
Abstract
This paper studied the configuration of spinning technology of PTT (polytrimethylene terephthalate)/PET (polyethylene terephthalate) bicomponent fiber via measurements obtained from the elasticity testing of fabrics made of them. The effects of four main spinning parameters on the elasticity of two series, named Z and Q, of interwoven fabrics were explained, including different ways of binding, intrinsic viscosity differences, and the percentage contents of PTT and the temperature of the hot plate. The experimental results indicated that the elongation ratios of the fabrics, which were made of PTT/PET bicomponent filaments spun by the parallel bound method, with larger differences in the intrinsic viscosity of the two ingredients and a higher temperature of the hot plate, were much larger than that of its corresponding counterparts. The elastic modulus ratio (m) and the PTT contents exhibited a cross-impact on crimp curves of PTT/PET bicomponent filament fabrics. The elongation ratios of fabrics made of PTT/PET bicomponent filaments would augment effectively as the hot plate temperature increased within a temperature range under the same posttreatment.
Keywords
Introduction
PTT (polytrimethylene terephthalate)/PET (polyethylene terephthalate) bicomponent fiber is a self-crimping conjugated polyester fiber with high-frequency helical crimps, which could offer an exceptionally good stretch, nice wrinkle recovery and high bulkiness to the yarns and fabrics. PTT/PET bicomponent fiber was developed in the expectation of imitating the unique structural property of wool fiber, which had both ortho-cortex and para-cortex to form a self-crimp structure and create its excellent and lasting elasticity. In the PTT/PET bicomponent fiber, the self-crimp structure actually depended on the difference of thermal shrinkage between PET and PTT. Several patents provided methods to produce this type of bicomponent filament with excellent elasticity property and recovery,1–3 and some researchers like Gupta and George, 4 and Denton 5 had carried out a lot of work on calculating the curvature of a bicomponent fiber theoretically. Recently, many commercial PTT/PET bicomponent fibers, such as T400®, 6 CM800®, ESS® and X55®, 7 were well developed to meet the growing market requirement. Now, more and more researchers are working on the outstanding elasticity and its recovery of the PTT/PET bicomponent fibers or filaments,8–13 as well as those of woven,14,15 knit,14,17 and denim fabrics. 16 Several researches showed that some factors, such as drawing technology, 18 wet-heat treatment 19 and internal structure,12,13 significantly affect the crimp and elasticity properties of the PTT/PET bicomponent filaments and eventually cause a distinct change on the elasticity of fabrics.14–17 However, the elasticity of the PTT/PET bicomponent filaments did not correspond exactly to that of the fabrics 20 made from them. Previous studies14,21 have been carried out on the configuration of helical crimp, crimp elongation and shrinkage of bicomponent fibers that have been removed from the fabric and they indicated that differences in elastic recovery, plastic recovery and elongation of bicomponent filament fabrics seem to come from the filament and not from the interlacement in the fabric. Meanwhile, there are many questions about the effects of the PTT/PET bicomponent filament spinning process on the elasticity of fabrics made from them. In this study we intend to figure out the more favorable spinning technology of PTT/PET bicomponent filaments from the fabric elasticity testing results, which can provide guidelines to production.
Materials and experiment
PTT/PET bicomponent filaments
PTT/PET bicomponent filaments used in the study were selected as two series: one named the Z-series was produced by our laboratory facilities, and the other named the Q-series was provided by a chemical fiber company. Each series contained two sorts of bicomponent filaments generated by two different bonding methods, of which the spinneret schematics are shown in Figure 1. One marked ‘a’ was parallel bonded so that PTT and PET polymer fluids merge within the spinneret plate and then were squeezed out together from the same orifice, and the other marked ‘b’ was air bonded so that PTT and PET polymers fluids were squeezed out separately from two adjacent orifices firstly, and immediately and swiftly bonded together by the die swelling effect forming after spinning.
Spinneret schematics of parallel (a) and air (b) bonded ways.
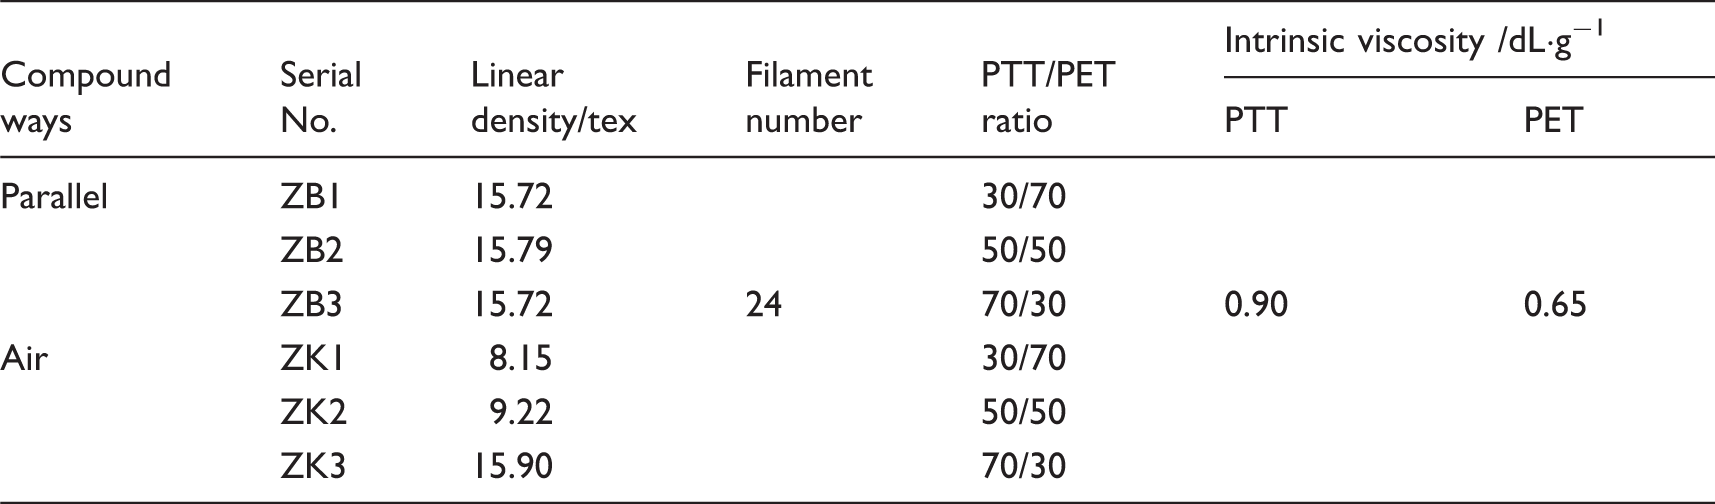
Specifications of Z-series PTT/PET bicomponent filaments
Specifications of Q-series PTT/PET bicomponent filaments

Table 2 showed the specifications of 12 kinds of PTT/PET bicomponent filaments in the Q-series. The basic spinning technical conditions of this series were as following: the spinning speed was 2000 m/min, the temperature of hot plate was 195°C, the drawing ratio was 2.35, and the drawing speed was 450 m/min.
Fabric sample preparation
Making reference to the previous results from our research group on weaving methods, 21 we chose PTT/PET bicomponent filaments from the Z-series or Q-series as weft yarns, and the cotton yarns (8.34 tex × 2) as warp yarns to produce the appropriate fabric structure, which could display the elastic property of PTT/PET bicomponent filaments well. Then we obtained the Z-series and Q-series fabrics respectively. The specific weaving parameters were as follows: the fabric structure was 5/2 satin, the weft yarn density should be adjusted according to the fineness of different kinds of filaments from the Z-series and Q-series in order to ensure the same fabric tightness factor of both Z-series and Q-series. Therefore, the warp density in both Z-series and Q-series fabrics was controlled at 230 ends per 10 cm, while the weft density in the Z-series and Q-series fabrics was controlled at 394 picks per 10 cm and 496 picks per 10 cm separately.
Fabrics made of PTT/PET bicomponent filaments would perform with greater elasticity after being finished, because of the unique elastic mechanism of PTT/PET bicomponent filaments and the largest thermal shrinkage ratio between PTT and PET would be turned on at a certain temperature. Consequently, all samples in this study ought to experience hot-water finishing in which fabrics were treated without any stretch in the 501 Electrically-heated Water Bath Pot at a water temperature of 90°C.
22
The reasonable finishing time was 60 min, which was determined by experimental results as shown in Figure 2. We made the fabric ZK1 as a sample and it exhibited the highest constant load elongation at the finishing time of 60 min. After hot-water finishing, the specimens would be removed for natural drying, and preconditioned in the constant surroundings with a temperature of 20 ± 2°C and relative humidity of 65% ± 5% for 24 h.
Effect of finishing time on constant load elasticity elongation of fabric.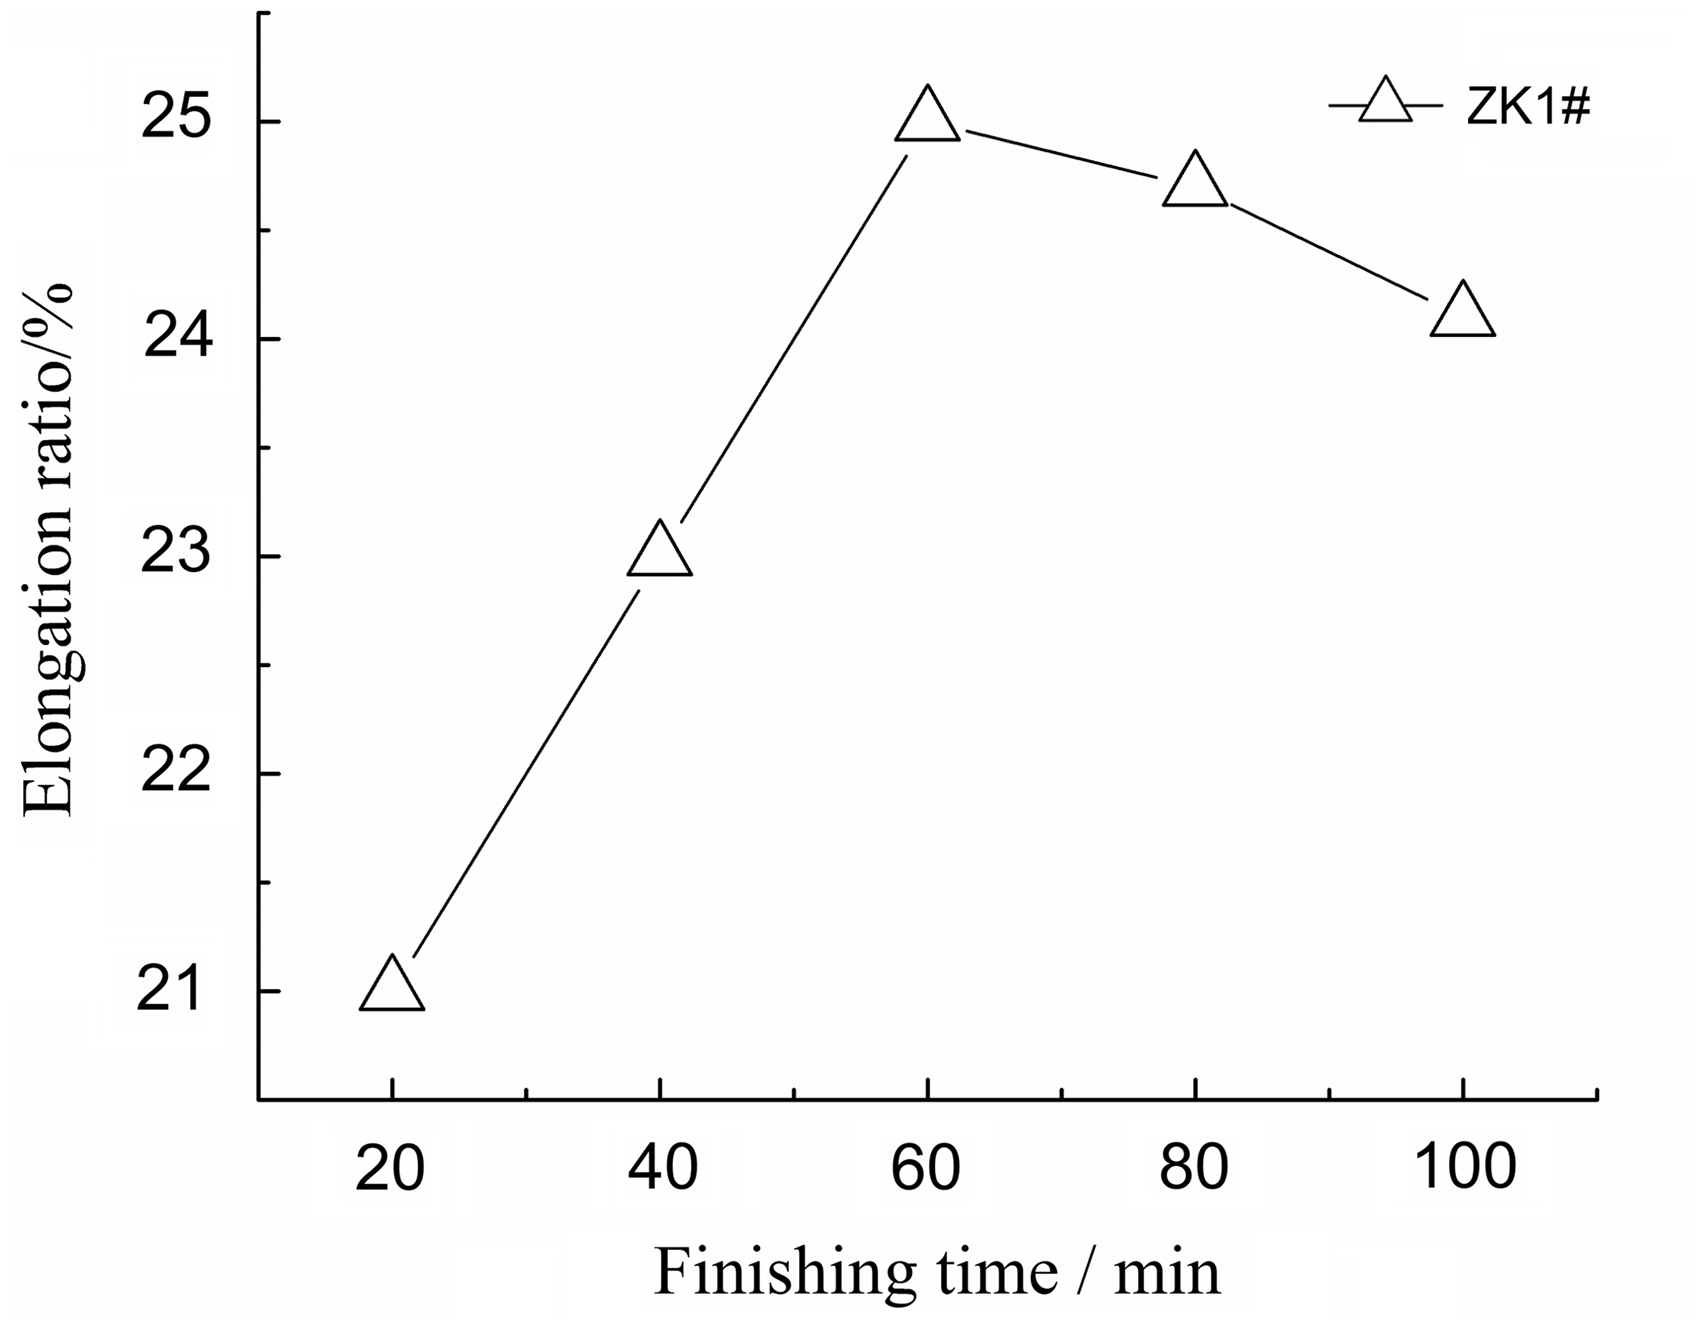
Testing standard, parameters set and indices
Considering PTT/PET bicomponent filaments were woven as weft yarns in fabrics, we tested the elasticity of fabrics in the weft direction only. According to the Chinese textiles testing standard FZ/T01034-2008, we adopted the constant load test method, and the testing parameters set on the YG-065 Fabric Strength Tester were as follows: the width of the fabric sample was 50 mm; the gauge length was 100 mm; the rate of extension was 100 mm/min, the constant load was 25 N, the pre-tension was 1 N, and the stagnating time of tensile and recovery were 60 s and 180 s, respectively. The test required three samples for each kind of fabric, and was repeated five times on each sample.
Three testing indices for characterizing the elasticity of these fabrics in the constant load tensile test were defined as follows:
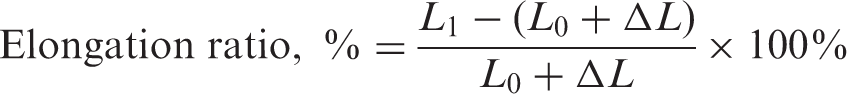

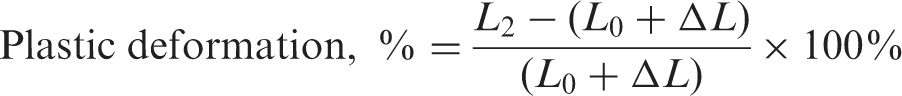
Where, L0 was the gauge length (mm); L1 was the length of the sample that was stretched up to the constant load and held for 60 s (mm); L2 was defined as the length of the stretched sample which was returned to the initial location after five times tensile repeated and then held for 180 s under the pre-tension load of 1 N (mm); ΔL was set as the length of sample stretched up to the pre-tension load of 1 N under relaxing clamped (mm).
The elongation ratio reflected the deformation ability of fabrics under tension, the elasticity recovery ratio meant the elasticity recovery of the fabric after being stretched five times, and the plastic deformation ratio indicated the accumulation of fabric’s irrecoverable deformation after being stretched five times. The latter two indices were mainly to characterize the elasticity recovery and the fatigue resistance of fabrics respectively.
Results and discussions
Effect of ways of bonding
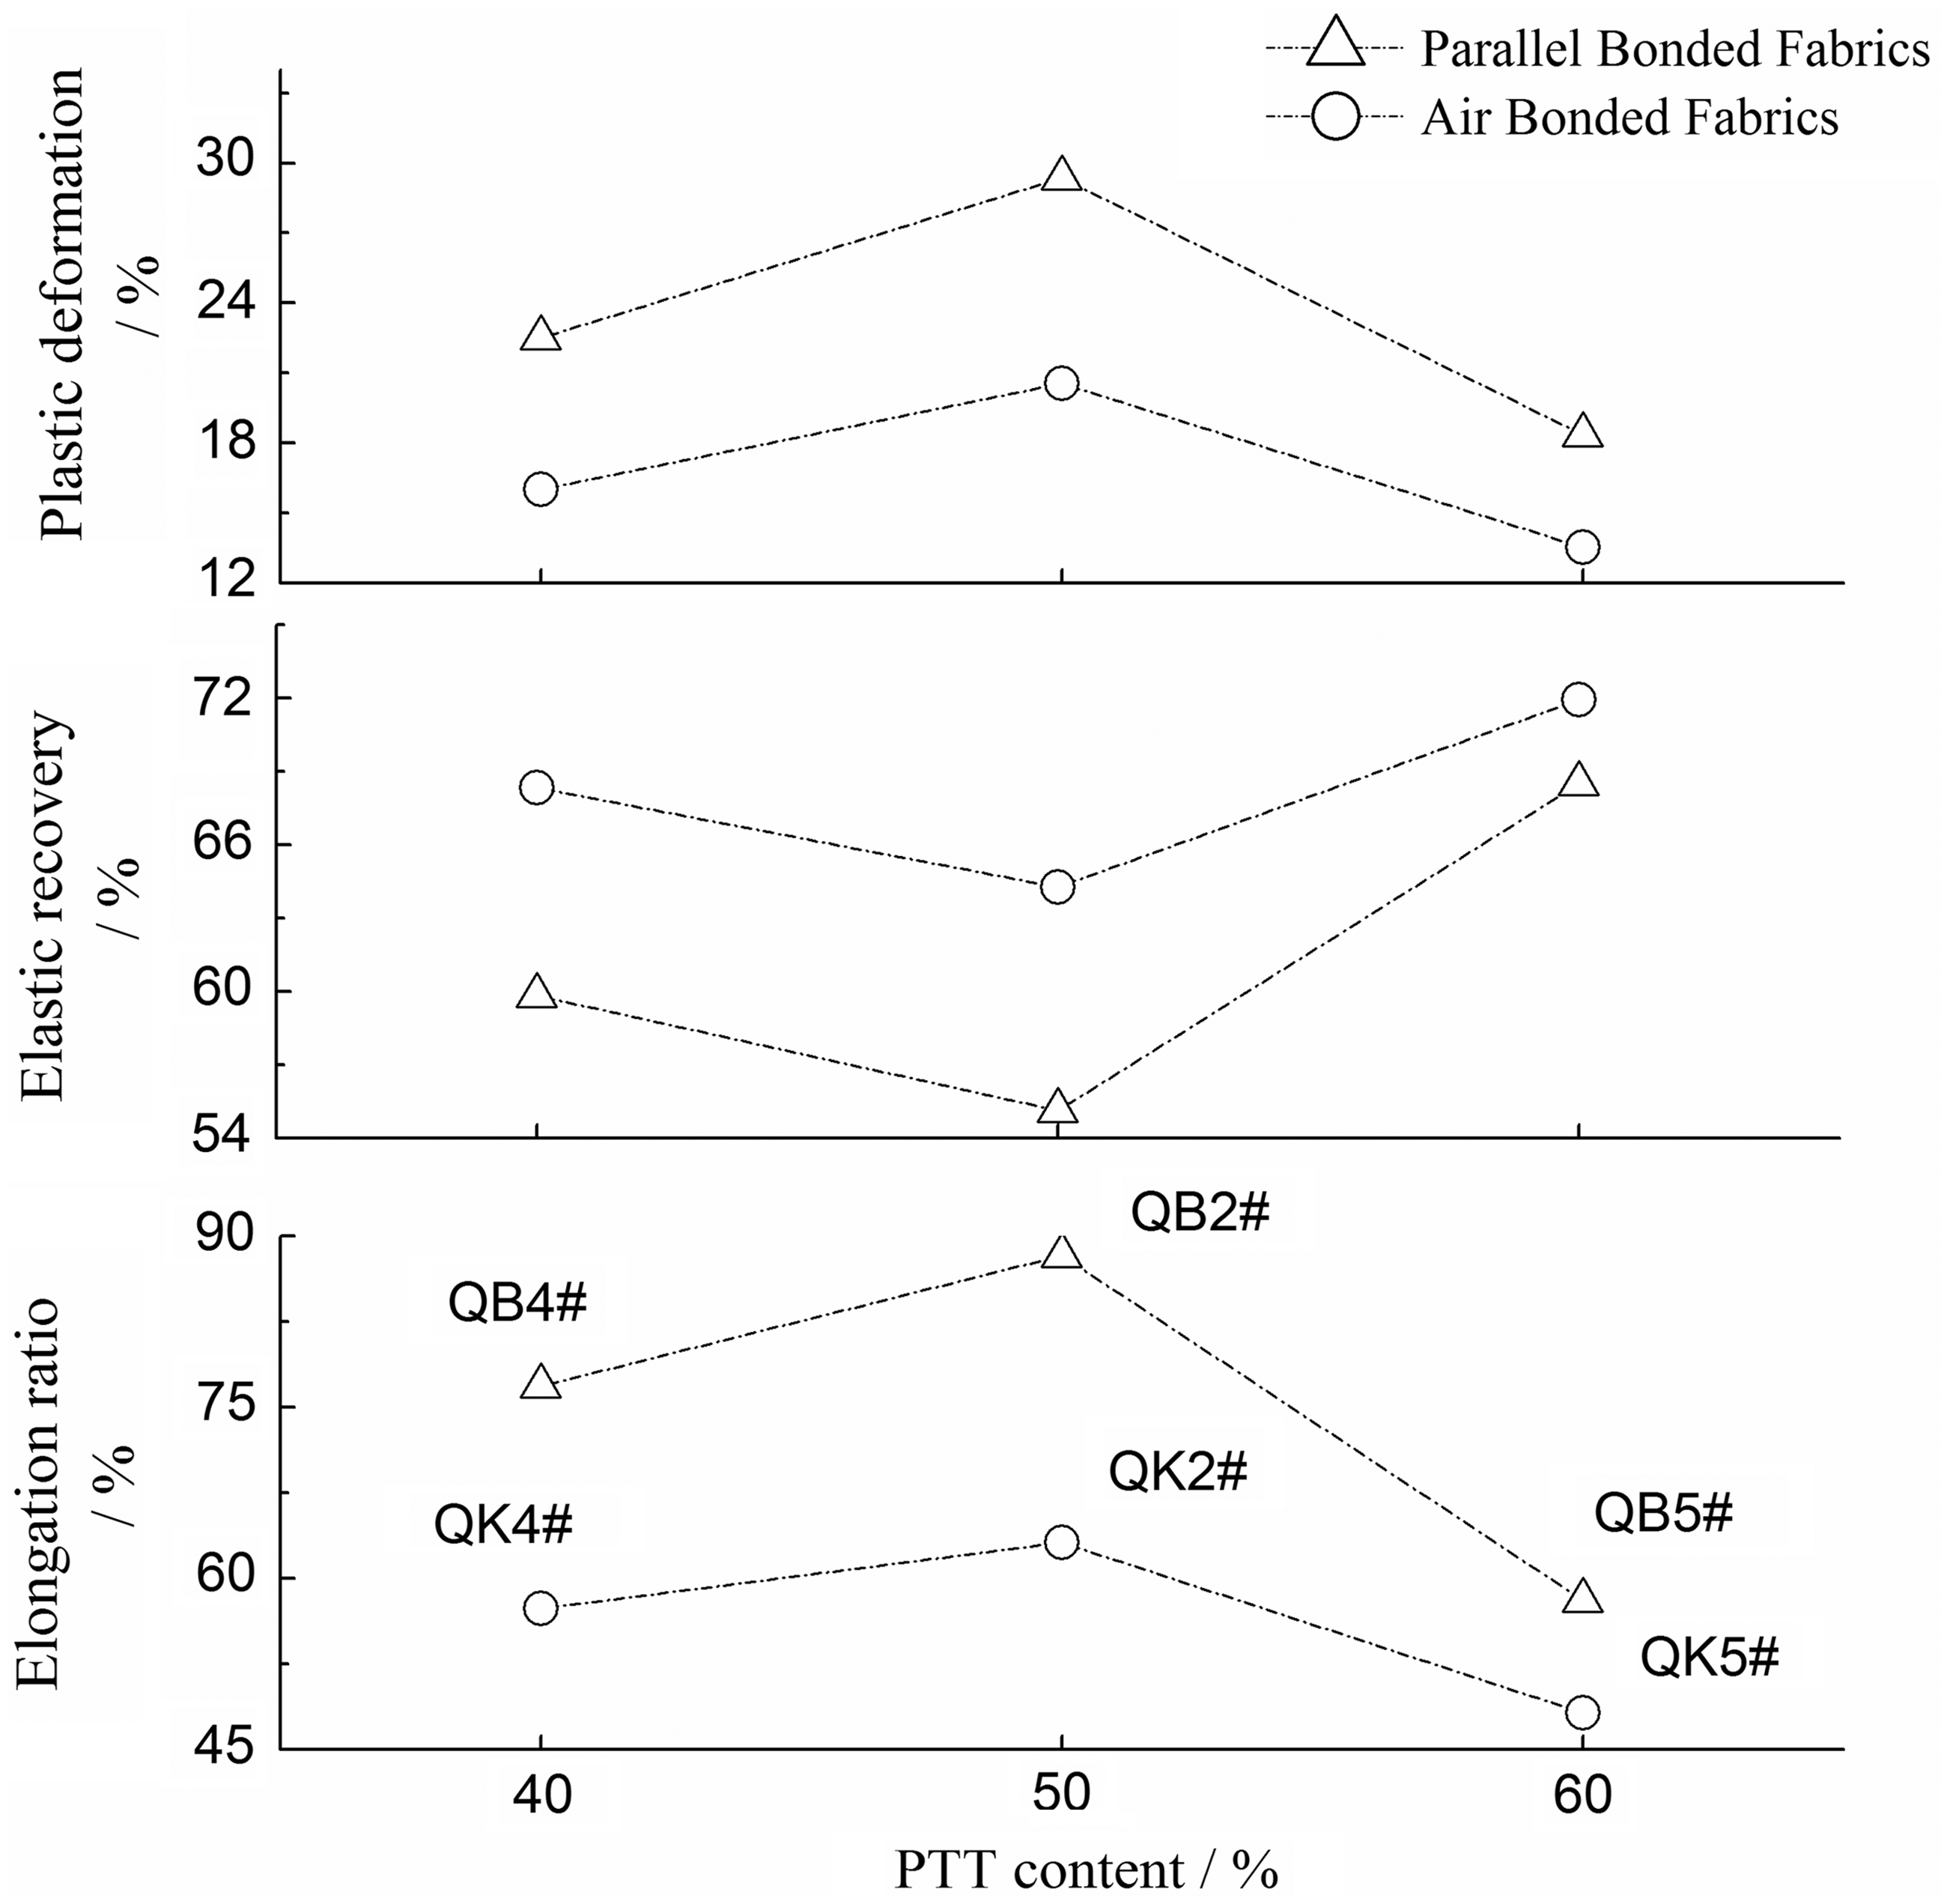
Figure 3 and Figure 4 illustrated the effects of ways bonding and PTT content on elasticity of both the Z-series and Q-series fabrics. The testing results of them demonstrated that the elongation ratio and the plastic deformation ratio of parallel bonded fabrics at three different proportions of PTT were much larger than those of the air bonded fabrics, while the recovery ratio of the bonded fabrics produced from the parallel bonded filament yarns was lower than that of fabrics produced from the air bonded filament yarns. Nevertheless, all fabrics with filaments from any one of these two different bonded methods in the Z-series and Q-series could possess enough elongation ratios or elasticity, and the self-crimp structure of filaments could also be generated well. However, the elongation ratio of filaments was so different between parallel bonded and air bonded, which was shown clearly by comparing the significant differences between the Z-series and the Q-series fabrics with the same content of PTT in the constant load elongation ratio in Figure 3 and Figure 4.
Effects of PTT content on Z-series fabric elasticity. Effects of PTT content on Q-series fabric elasticity.
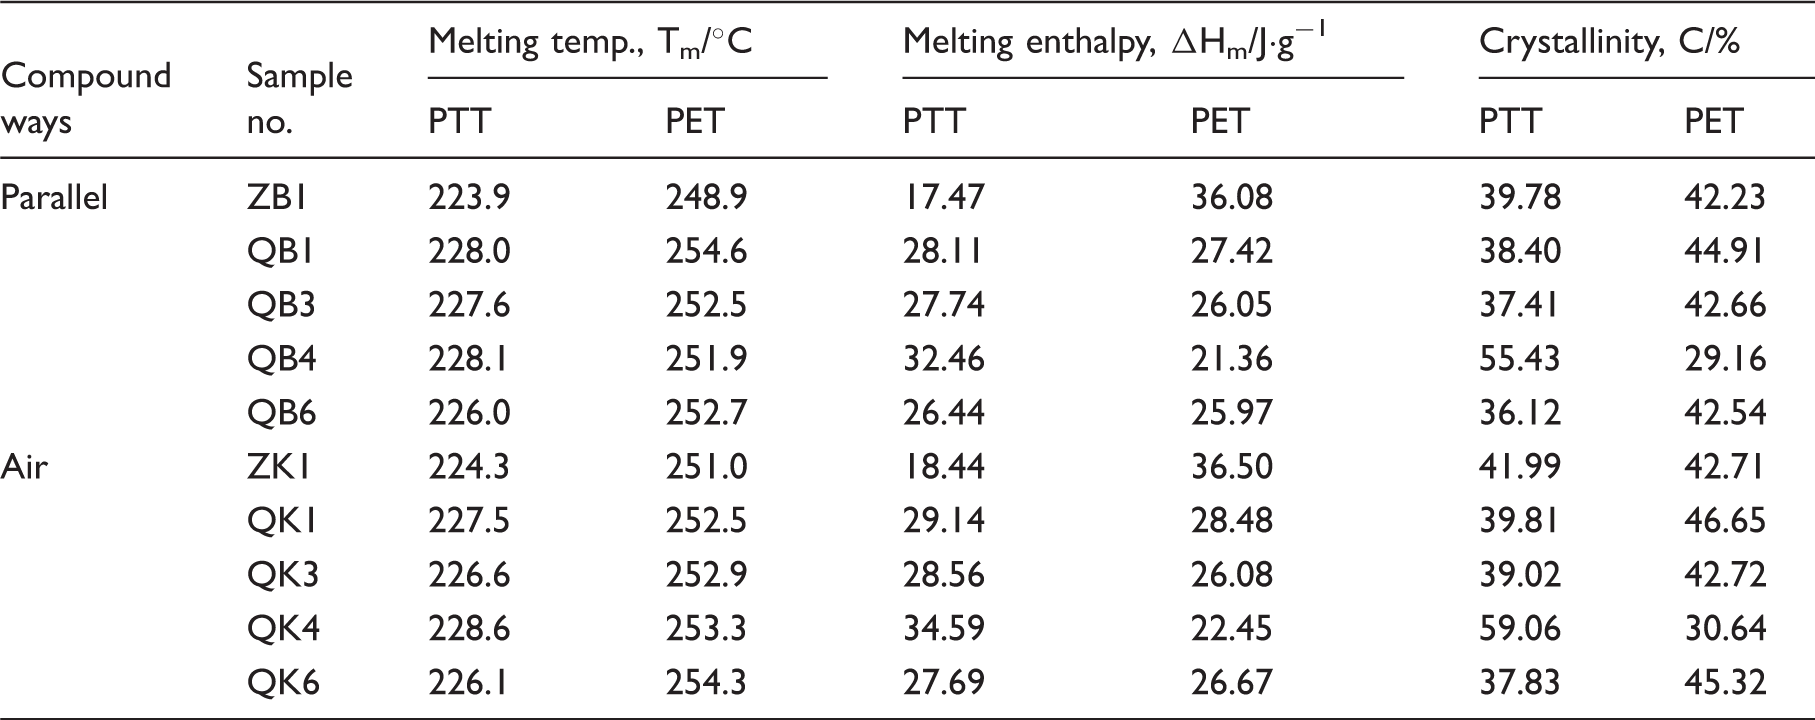
The reason for the distinct elasticity differences among fabrics woven from bicomponent filaments, with parallel and air bonded methods, was that the essential different crystallization and orientation of both PTT and PET under these two bonded ways, which engendered various morphologies and aggregation structures of PTT and PET.8,9 Because of the low melting temperature of PTT chips, the apparent viscosity of PTT with high intrinsic viscosity was lower than that of PET with low intrinsic viscosity at the same spinning temperature. Therefore, in the parallel bonded PTT/PET bicomponent filaments, when two components were squeezed out from the outlet of orifices at the same spinning temperature, PET undertook the most part of the drafting force along the spinning line due to its higher apparent viscosity, but PTT with lower apparent viscosity could merely share a little drafting force out of its good fluidity. That is why PTT obtains lower crystallinity and orientation during the spinning process and could level the disorientation in the hot treatment and form higher frequency crimp structure, which could improve the total elasticity of bicomponent filaments out of its higher thermal shrinkage.
Crystallinity results of comparable PTT/PET bicomponent filaments
Effect of PTT intrinsic viscosity
From Table 2, we could find out that in the Q-series filaments there were only one type of PET chips with intrinsic viscosity (IV) of 0.64 dL/g and two types of PTT chips with IV of 1.00 dL/g and 1.30 dL/g. Results in Figure 5 demonstrated that the elongation ratio of fabrics, which were made from PTT/PET bicomponent filaments spun by high IV PTT chips (i.e. IV difference of PTT and PET was 0.66 dL/g), was higher than those of fabrics made from filaments spun by low IV PTT (i.e. IV difference of PTT and PET was 0.36 dL/g) while the IV of PET chips was the same in both of these fabrics. What is more, from this we could understand that the higher the IV difference between PTT and PET in the bicomponent filament, the higher the elongation ratio of their interwoven fabrics. It was fully in accordance with the previous testing results,
8
suggesting that the configuration of the helical crimp would be more distinct, and crimp elongation and shrinkage of PTT/PET bicomponent filaments would be larger and its elasticity would be much better, if the IV difference of PTT and PET became larger.
Effects of PTT intrinsic viscosity on fabric elasticity.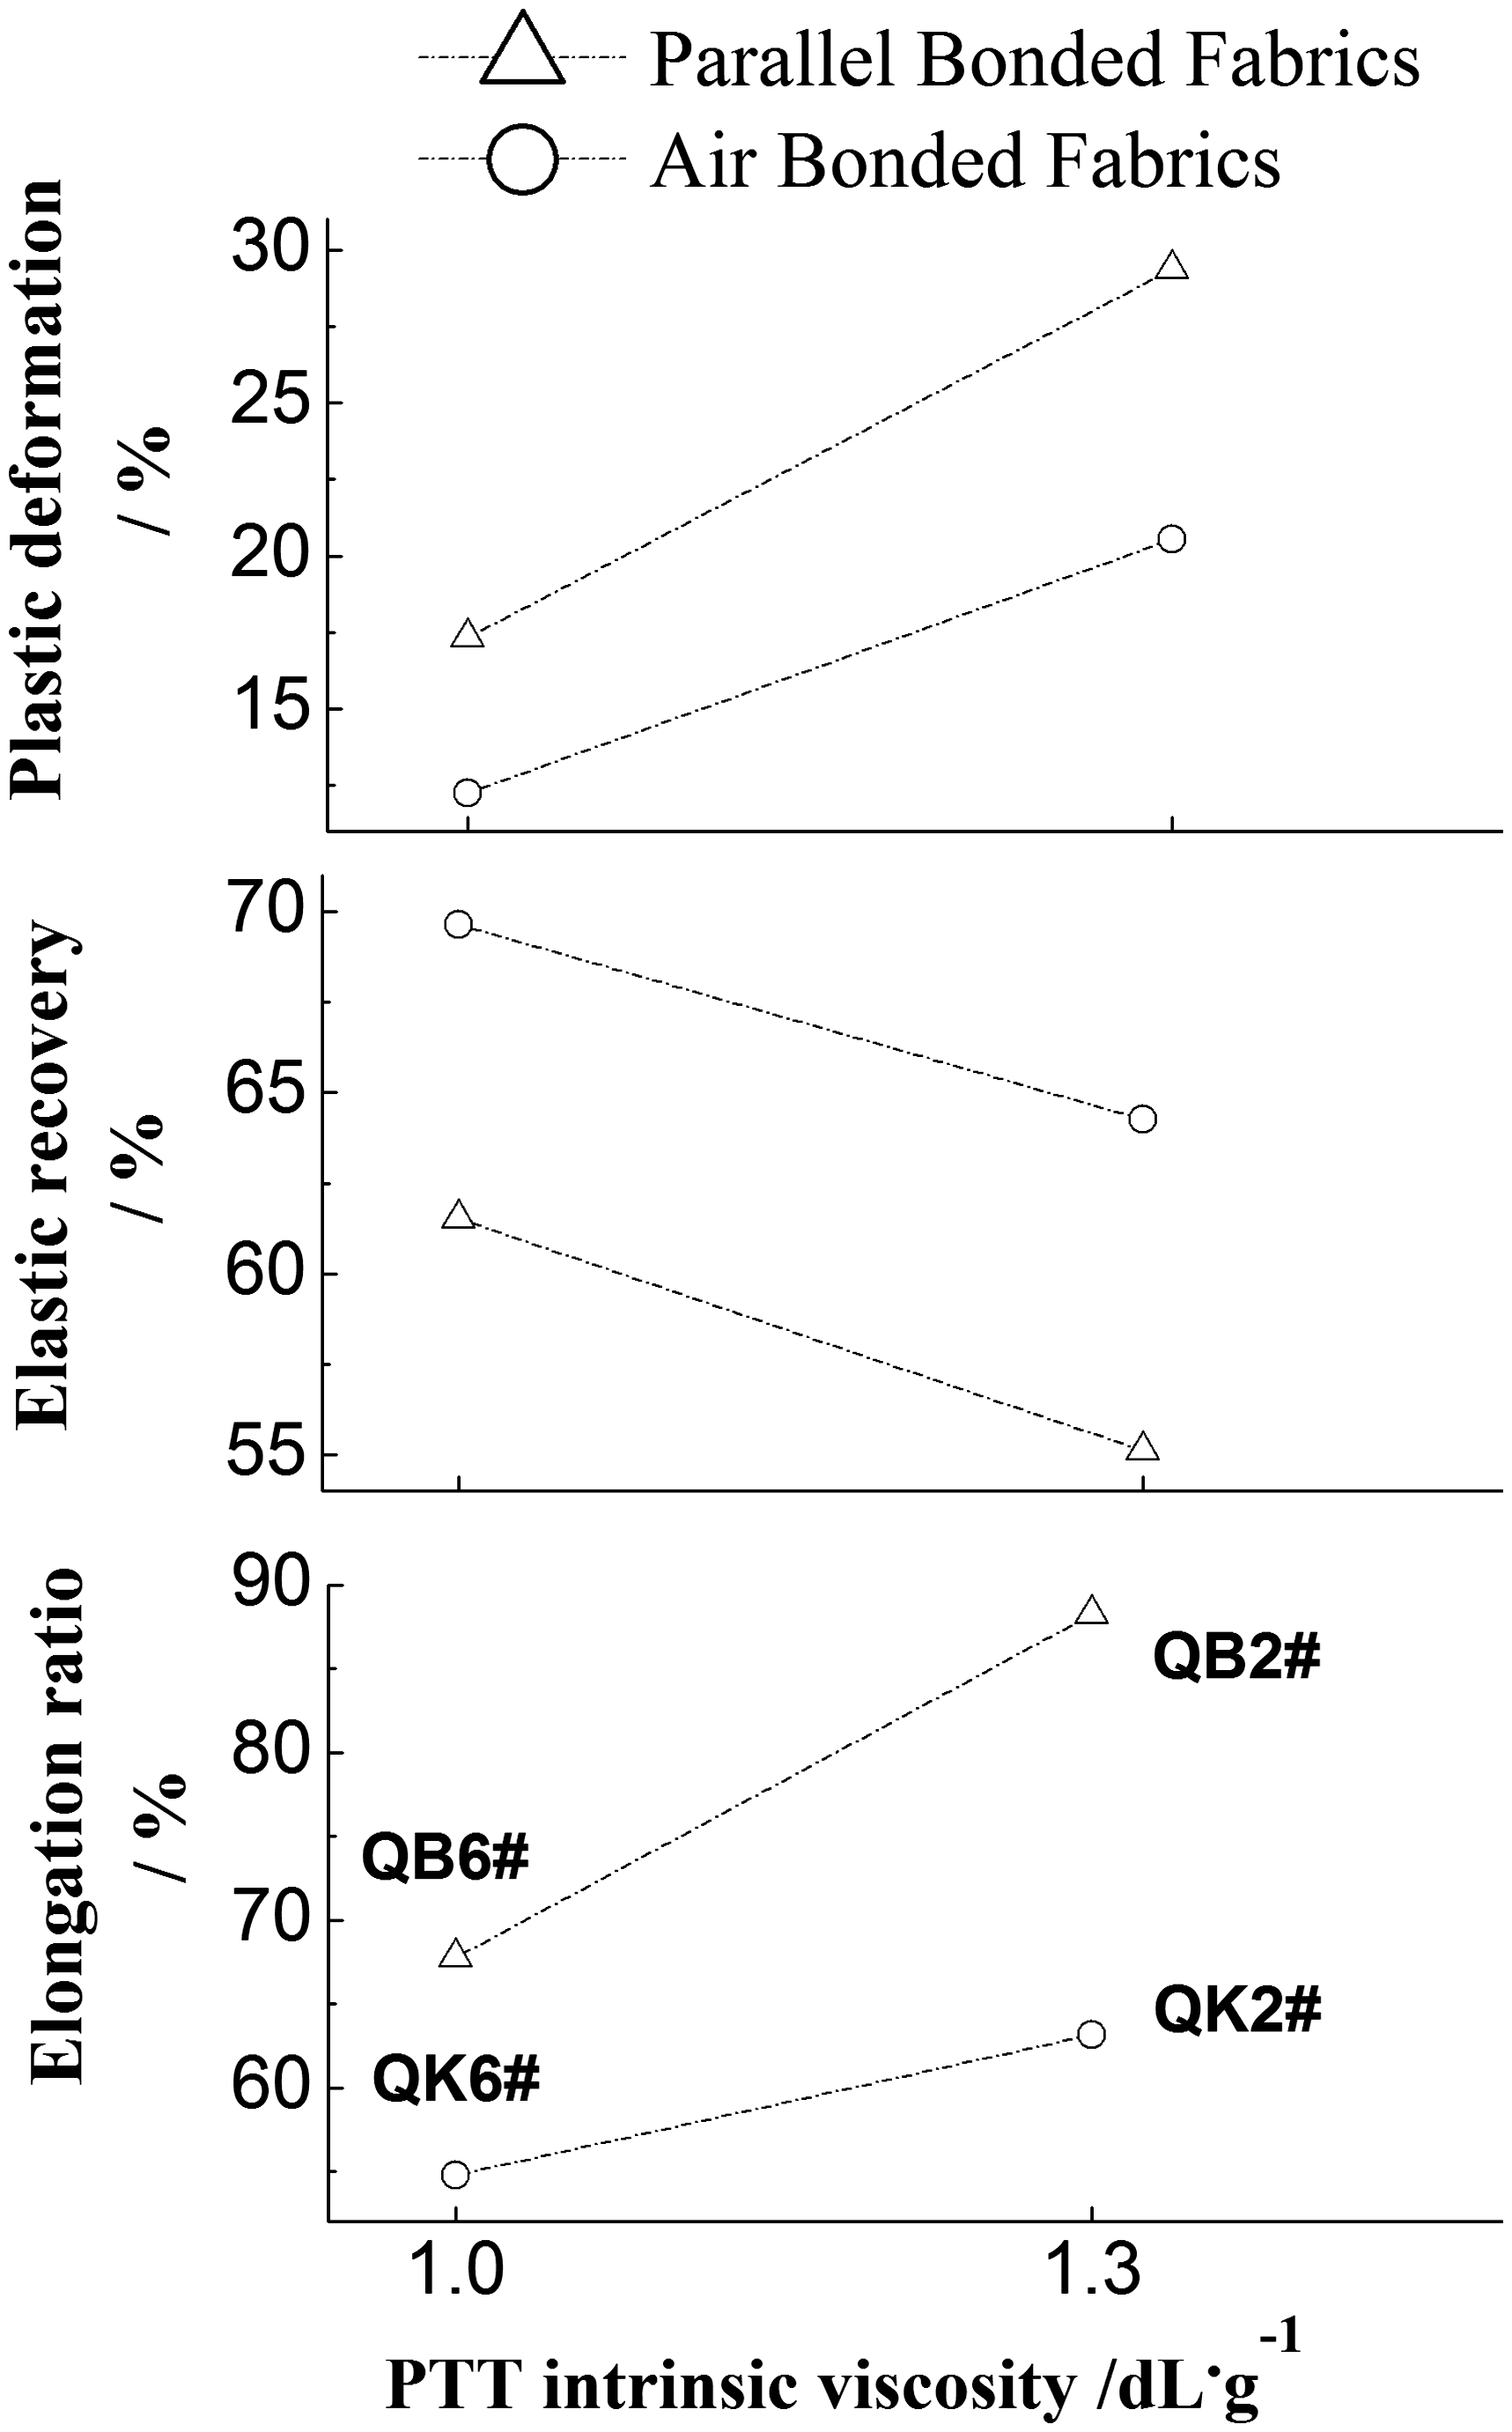
All of the above could be further verified by comparing the results in Figure 3 and Figure 4, which indicated that elongation ratios of Z-series fabrics were much smaller than those of Q-series ones. One of reasons was that the IV difference between PTT and PET varies between the Z-series and Q-series, of which the IV difference of 0.25 dL/g in the Z-series was much less than that of 0.36 dL/g or 0.66 dL/g in Q-series. The almost straight interface of PTT and PET
24
in the Z-series bicomponent filaments as shown in Figure 6 could also be used as a favorable proof of the slight change in IV differences between PTT and PET, which was only 0.25 dL/g.
Cross-sectional shapes of Z-series parallel bonded fibers (Mark in the pictures is 0.01 mm): (a) ZB1, 30% PTT; (b) ZB2, 50% PTT; (c) ZB3, 70% PTT.
The reason for the above results was attributed to the lower melting temperature (Tm) of PTT than that of PET. Although the IV was higher for PTT compared to that of PET, at the same spinning temperature, the apparent viscosity of PTT was smaller than that of PET, meaning that there was a better fluidity of PTT melting. Then, when PTT/PET bicomponent filaments were subjected to the drafting force along the spinning line, PET would crystallize firstly because it undertook the large part of stress, while PTT would generate deformation following PET because of its good liquidity and it was sharing less stress. Therefore, the axial array of macromolecular chains in the high IV PTT component would be more irregular than that of the low IV PTT in bicomponent filaments under the same spinning conditions, which signified the better disorientation ability and larger thermal shrinkage ratio of high IV PTT. In other words, the larger IV difference between PET and PTT would increase the thermal shrinkage ratio between them, enhance the crimp elasticity of filaments and improve the fabric elongation.
Cross-impact of PTT content and elastic modulus ratio
Figure 3 displayed that, with the increase of PTT content, elongation and plastic deformation of the fabric from two different bonded methods would decrease gradually, while elastic recovery of them would rise. The fabric elongation reached a maximum at 30% of PTT content. The three elasticity indices varied much wider within the range of 30%–50% PTT content. However, Figure 4 showed that the elongation and plastic deformation of fabrics from both bonded methods increased firstly and then decreased as the PTT content increased, of which the values reached a maximum at 50% of PTT content. However, the fabric elastic recovery decreased firstly and then increased as the PTT content increased, and reached a minimum with 50% of PTT content. The test results of Figure 3 and Figure 4 were opposite to that of fabrics with less than 50% of PTT, but were the same as the fabrics with 50% more PTT.
The results of Figure 4 were also matched well with that of other studies conducted by Shi and Xiao, 8 and Rwei et al 10 that suggest crimp elongation of bicomponent fiber would be at a maximum and crimp elasticity would be the best when PTT content was 50%. Variations of processing parameters such as spinning speed and drawing ratio of filaments in these two serials were taken into account when analyzing the differences in experimental results between Figure 3 and Figure 4. But these variations were too subtle to trend in the same way on the elasticity of fabrics made of two serial filaments.
The elongation of the fabrics depended on that of its constitutional filaments, and there was a positive correlation between the elongation and the crimp curve of PTT/PET bicomponent filaments,
20
so doubts on the elongation of fabrics could be tackled by explaining the differences in curvature of two series bicomponent filaments. Denton
5
derived an equation (equation 1) to characterize the relationship of the crimp curvature ρ of filaments and the material parameters for self-crimping bicomponent fiber which has been proven to be practical.
10
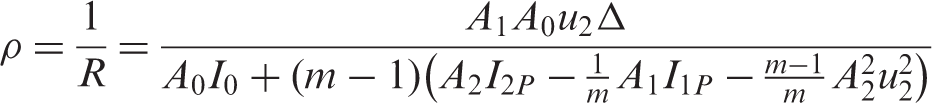
Where, R was the crimp curvature radius; m was the ratio of the elastic modulus E2 and E1 (m = E2/E1); Δ was the differential shrinkage ratios between the two components; A1 and A2 were the cross-sectional areas of the two components, A0 was the area of the whole cross-section (A0 = A1 + A2); u1 and u2 were the distances from the centroids of the two component areas to the centroid of the whole cross-section, respectively; I1 and I2 were the inertia moments of the two sections around the axes through their own centroids, and I1P and I2P, were the inertia moments of the two components relative to the axis through the centroid of the whole section (I1P = I1 + A1u12 and I2P = I2 + A2u22). Note that u1 was needed for calculating I1P.
The factors, like geometric parameters of the cross-section of the fiber, elastic modulus ratio (m) and thermal shrinkage ratio difference (Δ) of two components, would influence the crimp curvatures as shown in equation 1. Different PTT contents could alter geometric parameters of the fiber’s cross-section, which can change the crimp curve eventually; Δ was determined primarily by IV difference of two components and the spinning drawing process; m represented elastic modulus ratio of PET and PTT which was affected by the differences in crystallinity and orientation degree of the two components. Because the spinning parameters or intrinsic viscosity of the chips affected the crystallization and orientation degree of the two components, m would get a significant change when the spinning technology or IV of them was not the same. Then the crimp curve would also be influenced, although variations of PTT content had little impact on the value of m. 24 Calculating the crimp curvature of the corresponding filaments with three different PTT contents and investigating the cross-effects of PTT content and variations of m, the results are illustrated.
In Figure 6, there were the images of the cross-sectional shapes of three PTT/PET bicomponent filaments ((a) ZB1, (b) ZB2, (c) ZB3) with PTT contents of 30%, 50%, 70%, respectively. The slices were cut by a Y172 Hardy’s cross-section device and examined by the OLYMPUS CH-2 optical microscope with ×400 magnification as taking Z-series (ZB1, ZB2 and ZB3) parallel bonded filaments for example on calculating crimp curvatures. Besides, the cross-sections of these three filaments looked like irregular ellipses and were very similar to each other from being produced with the same spinneret plate and other spinning conditions.
In order to calculate the centroids for the component and the fiber, cross-sectional shapes were selected with typical and clear outlines and an interface in images of fibers, which could provide effective geometrical information. The picture size of Figure 6 was adjusted to make the calculation simple, in which the measured value was marked as 10 mm. Then the selected images of the filament cross-sections were printed out and drawed on transparent coordinate papers. The interface of 30% and 50% PTT content were masked correspondingly as shown in Figure 7. The real length of the ruler 0.01 mm was enlarged to the measured value 10 mm, so the magnification (N) of the cross-section was 1000 times, and A1, A2 and A0 can be calculated by counting the number of small square grids in the coordinate paper and solved its real cross-sectional area by considering the magnification: real areas = calculated areas/N2.
Manual drawing of cropped fiber cross-section (a) and background subtracted for calculating centroid coordinate (b).
The whole cross-section of Figure 7 was comprised of many square unit cells with an area of 1 mm2, the centroid location (X, Y) of the whole cross-section and those of the two components could be determined by the average location of the coordinate (xi, yi) in the region according to the following equation 2:
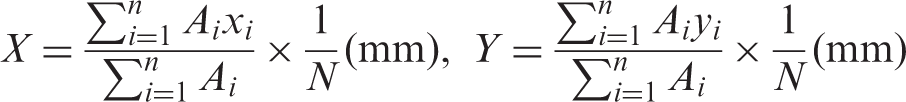
Where, Ai represented areas of any unit cell; xi, yi denoted abscissa and ordinate coordinate of center position for any unit cell; N was the magnification times; n was defined as the number of unit cell. The real center position was calculated by dividing the calculated coordinates value by N, then the real values of u1, u2 would be obtained.
The inertia moments I1 and I2 of the two areas to their own center axes were calculated by the method shown in Figure 8.
25
Let δ and n be the height and number of the stripes, respectively. When δ was small enough to regard each strip as approximately a rectangle, ai was the distance from the center line of the ith strip to the centroidal axis, areas of strip ith was xi × δ, where xi was the mid-width of the ith strip and N represented the magnification. So the inertia moment Ix of the whole section relative to the x-axis (real inertia moment of either component relative to its centroidal axis in Figure 7) was calculated from equation 3.
Scheme of random shape to be calculated.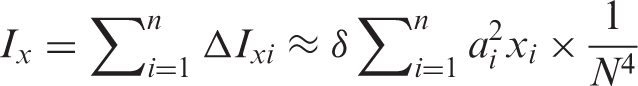
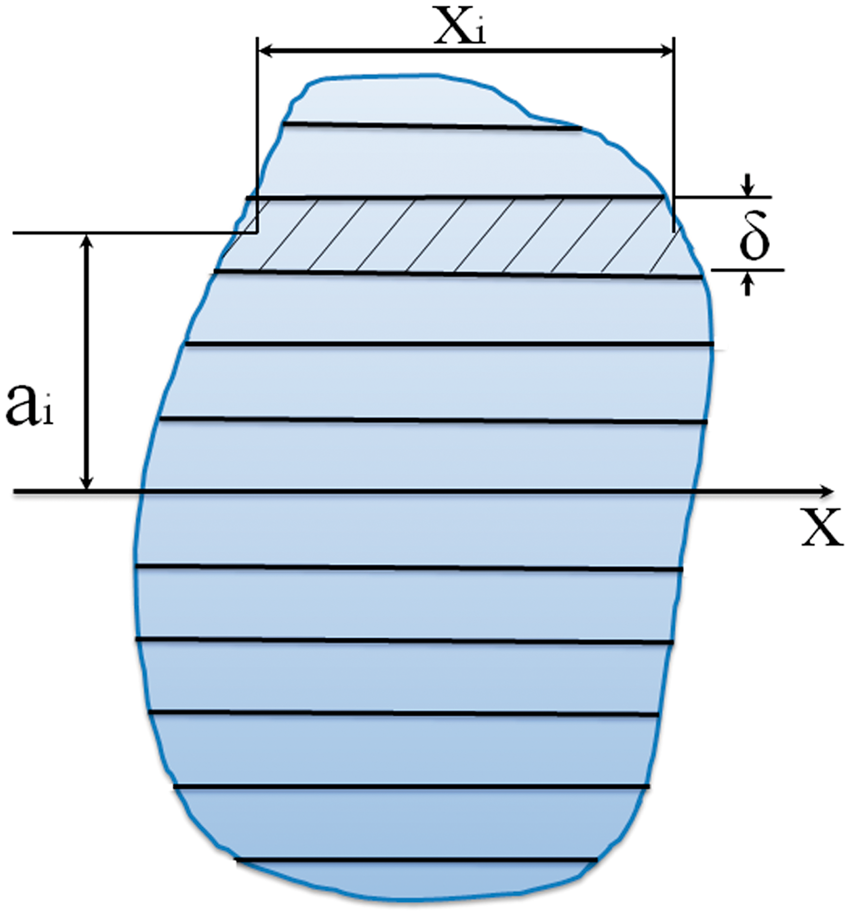
Calculation results showed that the abscissas of the centroidal position for either component or the whole section were nearly the same, which implied the x-axis was parallel to the middle axis that passed through the center of the whole section and was perpendicular to the line which connected the centers of the two components. So a row grid can be regarded as a strip, which made the calculation simple. As mentioned above, the cross-section in Figure 7 can be viewed to be comprised of 19 strips and the height of each strip was 1 mm. So ai, xi, δ can be obtained and then substituted into equation 3, so that the parameters I1, I2, I1P, I2P could be solved for.
The three PTT/PET bicomponent filaments (ZB1, ZB2 and ZB3) were made of the same chips with the same IV, and the spinning and draw parameters were almost the same, thereby Δ could be considered as the same value of 0.0853.
23
Finally, the calculated geometric parameters of the filament cross-sections and Δ were substituted into equation 2. Then m was assigned to values ranging from 0.5 to 5 with an increasing step length of 0.5, and we could get the curves that indicated the cross-effects of different PTT contents and m on the crimp curves of the Z-series filaments as shown in Figure 9.
Cross-impact of different PTT contents and elasticity modulus ratio (m) on crimp curve.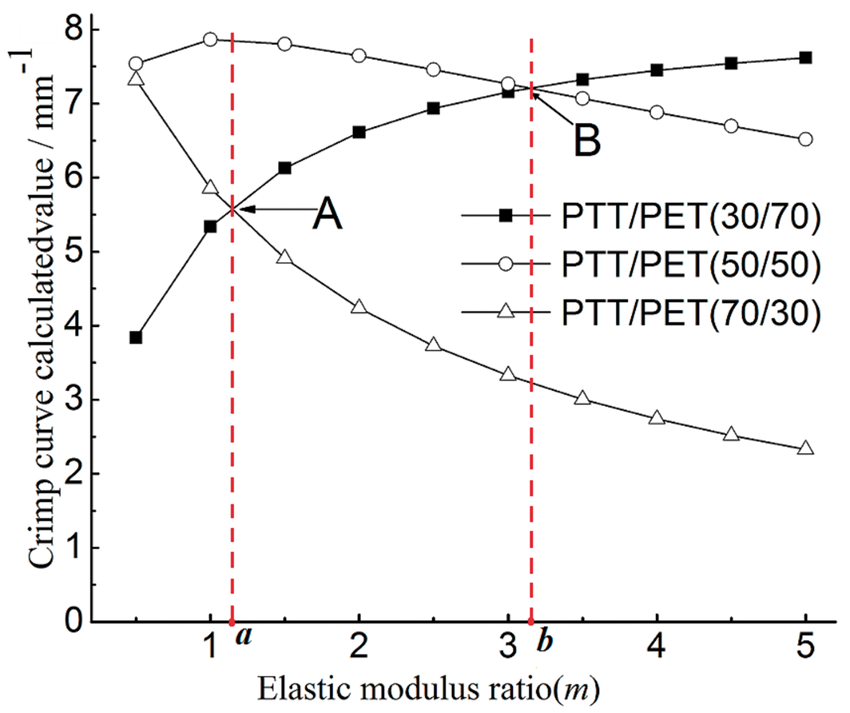
Figure 9 showed two crossing points A and B in these three crimp curves. A represented that the crimp curves of 30% PTT and 70% PTT content filaments were the same when m was 1.12, while B meant that the crimp curves of 30% PTT and 50% PTT content filaments were the same when m was 3.14. In fact, the value of Δ had little impact on the values and locations of crossing points. To clarify the result clearly, the values of m at points A and B were set as a and b. Then the comparing results of the crimp curvatures among three filaments with different PTT contents in Figure 9 were as follows: if m < a, we can see that 50% PTT > 70% PTT > 30% PTT; if a < m < b, then 50% PTT > 30% PTT > 70% PTT; and if m > b, 30% PTT > 50% PTT > 70% PTT.
Therefore, the reason for the experimentally different results in Figure 3 and Figure 4 can be explained. The value of m for filaments with different PTT contents in the same series might be regarded as the same due to their polymer chips with the same IV, spinning and drawing parameters. However, the m values of filaments from two different series (Z, Q) would have great differences because filaments were spun by different IV chips, and various spinning and drawing parameters.
The m value of the Z-series filaments should be relatively larger (m > b) according to Figure 3 and Figure 9. The comparison results of the crimp curvatures among filaments with different PTT contents was 30% PTT > 50% PTT > 70% PTT corresponding to that of Figure 3. While the curves and crossing points were similar to that of the Q-series filaments as shown in Figure 9, in which PTT contents were 40%, 50% and 60% separately, with the same calculation method, the m value of the Q-series should be smaller (a < m < b), and thus the comparison result of the crimp curves among different PTT contents in the Q-series filaments was 50% PTT > 40% PTT > 60% PTT, which was consistent with the results of Figure 4. The results of air bonded filaments could be obtained in the same way by the analogy analysis.
So m, as the ratio of the PTT content and elastic modulus, had cross-impact on the elasticity of PTT/PET bicomponent fabrics made of different bonded filaments. If the value of m was in the different range, different PTT contents would have different impacts on the crimp curve of filaments and elastic properties of fabrics. It had been reported 20 that the crimp curvature and crimp elongation of bicomponent filaments would be maximized with PTT content of 50%, but that was just the experimental result at certain conditions of a < m < b as we derived. Here existed exceptional cases, i.e. if m value was in the low value range (m < a), crimp curvatures of filaments would be the largest and the elongation ratio of fabric would be the highest; if m was in the high value range (m > b), crimp curvatures of filaments would decrease as the PTT content increased.
Effect of hot plate temperature
Partially oriented yarn (POY) of PTT/PET bicomponent filaments produced from conjugated spinning equipment should be processed into drawing textured yarn (DTY), which can be used for weaving after drawing and sizing. The yarns need to be heated by preheat roll named hot plate in the drawing process. Figure 10 illustrated that the elongation ratio and the plastic deformation ratio of fabrics made by two bonded methods increased gradually but elasticity recovery decreased as the hot plate temperature increased.
Effects of temperature of hot plate on fabric elasticity.
In the POY drawing process with the sustained drawing ratio and within a certain temperature range, the higher the temperature of the hot plate was, the higher the disorientation ability of the filaments was. It would also lead to a decrease in the crystallization and orientation of the two components in filaments and then accelerated disorientation, which resulted in higher shrinkage of filaments in turn. Meanwhile, the decline in the crystallization and orientation of the two components could also reduce their thermal shrinkage ratio difference, which would result in lowering the crimp elasticity of filaments. However, the increase of the shrinkage caused by temperature increasing was larger than the decrease of crimp shrinkage caused by the descending of macromolecular chain crystallization and orientation. 26 Being processed under the same wet-heat treatment, fabrics made of PTT/PET bicomponent filaments at a much higher temperature of the hot plate (i.e. the drawing temperature) showed a greater elongation, which meant the constant load elongation was higher.
Conclusions
This paper explored the elasticity of fabrics made of PTT/PET bicomponent filaments in the weft direction, in order to investigate the spinning technology of PTT/PET bicomponent filaments, taking parameters including the bonded ways, the intrinsic viscosity difference, the percentage of PTT and the temperature of the hot plate into account.
We found out that the elongation of fabrics made of parallel bonded PTT/PET bicomponent filaments were better than that of fabrics made of air bonded ones. This was attributed to the higher crystallization and orientation degree of PTT from the air bonded method, which would decrease the thermal shrinkage of PTT and thereby lower the crimp and elongation ability.
The test results also demonstrated that the larger the intrinsic viscosity difference of PTT and PET was, the higher elongation ratio of the corresponding PTT/PET bicomponent fabrics was. Because the IV difference caused the thermal shrinkage difference of PTT and PET in filaments, which eventually heightened the crimp elasticity of the filaments and the elongation ratio of its corresponding fabrics.
Interestingly, the elastic modulus ratio (m) and different PTT contents exhibited a cross-impact on the crimp curves of fabrics with PTT/PET bicomponent filaments, the crimp curve of filaments was top and the elongation ratio of its fabric was the best with lower value of m and 50% of the PTT content, while the crimp curvature and elasticity of filaments would drop with the higher value of m as the PTT content increased.
Additionally, when in the spinning process the filaments experienced identical draw ratio but the hot plate temperature increased within a temperature range, the elongation of fabrics would augment effectively under the same wet-hot treatment. The reason was that as the drawing temperature increased, the increase of filament shrinkage resulted from disorientation of filament macromolecules was larger than the decrease of crimp shrinkage caused by decreasing the thermal shrinkage difference of two components, which would improve fabric elongation eventually.
Footnotes
Acknowledgements
The authors sincerely thank the editor, Dr Dong Zhang, and the reviewers for their kind comments and advice, which led to a significant improvement of this paper.
Funding
This work is supported by the National Natural Science Foundation of China (grant number NSFC 50973015).