




Abstract
A prospective technology for manufacturing thermoplastic composites is based on hybrid commingled yarns. The hybrid yarns are further processed into semi-impregnated thermoplastic preforms in the form of woven or non-crimped fabrics, which are consolidated and molded in a single processing step. The quality of the component distribution in yarn is known to affect the mechanical properties of the manufactured composites. As part of a quality management system for the manufacturing process of thermoplastic composites based on commingling yarns, a new method for analyzing the blending quality along the length of commingled structures is presented in this work. By using this method, a new blending index (kb,yarn ) is introduced as a measure of the quality of commingled yarns. The blending index combines the existing coefficients of the lateral and radial distribution of fibers in the cross-section of hybrid yarns. Within this paper, the new analysis method is explained in detail using the example of glass fiber/polyamide 6 (GF/PA) commingled yarns. Due to the combination of the yarn analysis along the yarn axis and in its cross section, the new method allows for the first time a reliable comparison of the blending quality in commingled yarns used for the manufacturing of thermoplastic composites.
Keywords
Thermoplastic composites are widely used in various fields, including in the aerospace, marine and automotive industries. They are characterized by their broad range of physical properties, high automatization potential and large-scale production capability. A challenge to their production is the high viscosity of the polymer matrix. Therefore, thermoplastic composites are mostly produced in an energy- and time-consuming two-stage process in which the consolidation step of the preforms is separated from the molding step. A prospective technology for manufacturing thermoplastic composites is based on commingling yarns — hybrid structures that contain the reinforcement and thermoplastic matrix of the final composite. The hybrid yarns are further processed to semi-impregnated thermoplastic preforms from woven and non-crimped fabrics. The textile preforms can be easily draped into the desired form, enabling simultaneous consolidation and molding of structural parts. Given the equal distribution of high-strength and thermoplastic filaments in yarns, low flow lengths are achieved during consolidation.
In previous studies, 1–3 the quality of component distribution was shown to affect the mechanical properties of the manufactured composites. Achieving a uniform distribution of the reinforcing and the thermoplastic filaments in the yarn cross section is a major challenge in the commingling process. The non-uniform distribution of reinforcing and thermoplastic filaments in hybrid yarn may lead to high void content in the final composite. The simplest way to qualify the blending quality in hybrid yarns offers the use of terms like “good,” “acceptable” and “insufficient.” However, the results of such analysis depend largely on the personal skills and the subjective opinion of the person doing the testing. Thus, no reliable comparison of the blending quality in yarns characterized by different testers is possible. Therefore, investigation of the degree of blending in commingled yarns is important to ensure high-quality management of the manufacturing process.
Cross sections of textile yarns have been investigated for several decades in the textile industry. Various analysis methods were introduced in the last decades, allowing quantifying the quality of the fiber distribution in hybrid yarns by using different mathematical indexes. However, there are only a few studies dedicated to the investigation of commingled yarns used for the production of thermoplastic composites. The factors that determine the properties of commingled yarn and the composites they comprise can be divided into two groups. To the first group belong factors crucial to the structural characterization along the yarn length. Various authors in the 1950s completed significant works on the mixing and blending of yarn components. The theoretical approaches to the study of irregularities in yarns arising from the uneven mixing of fibers of different types were studied by Cox et al. 4–6 Evaluation of blending quality in the yarn was given based on statistical methods. The commingling process is used to introduce nips to flat yarns by interlacing. Alagirusamy and Ogale 1 and Miao and Soong 7 investigated in detail the influence of process parameters on nip formation in yarns. According to Miao and Soong, 7 nips can be classified into four different basic types: twist, braid, wrap and entangled. Alagirusamy and Ogale, 1 in contrast, classified nips into six types: braid, entangled, entangled braid, wrap, core and side-by-side. These studies focused on the relationship between the investigated parameter and the number of nips in yarns, respectively, and the interlacing degree of the yarns.
The second group includes factors that determine the blending quality in cross sections of the yarns. For staple fiber yarns, the investigation of yarn cross sections is state of the art. At the beginning of fiber recognition analysis, each cross section of yarn is taken in outline and center drawn-in on a glass projection screen using pen and ink. Numerous efforts have been devoted to fiber recognition and distribution analysis of blended yarns made of fibers such as wool, acrylic and nylon. 8–10 These methods allow the evaluation of fiber distribution in sectors of the yarn cross section. Lately many works have been devoted to fiber image analysis using digital-image processing. Chiu et al. 11 applied a digital-image processing technique to fiber recognition analysis of cross sections for a two-component polyester/rayon composite yarn. They used four predefined values (area, perimeter, compactness and shape) to classify fibers. Xu et al. 12 used a neural network method of analyzing cross-sectional images of a wool/silk blended yarn. In Chiu and Liaw, 13 a new image-processing method was proposed to recognize fiber patterns in cross-sectional images of a polyethylene terephthalate (PET)/rayon composite yarn. This method consists of two voting techniques — connected component and circle parameter voting — and requires fewer parameters. The blending quality in the cross section of commingled yarns was investigated in Stolyarov and Kravaev, 14 in which some coefficients for the lateral and radial distributions were used to describe the disposition of the filaments in yarn.
Scope of research
A review of the literature failed to reveal any studies dealing with the investigation of the blending quality along the yarn length of commingled structures. Currently, a new method for such analysis is being developed to fill this gap within the state of the art. The method can be applied as a part of the quality management system in the manufacturing process of thermoplastic composites based on commingling yarns. Use of this method yields a measure for the quality of commingled yarns, which can be used to compare different yarn structures.
Experiments
In order to test the method for analyzing the blending quality in commingled yarns, glass/polyamide 6 (GF/PA) hybrid yarns were manufactured at the Institut fuer Textiltechnik der RWTH Aachen University (ITA). The combination of glass fibers (GF) with polyamide 6 (PA) is currently widely used in different application fields such as the automotive, mechanical engineering, sports and leisure industries. During the study E-glass roving with a linear density of 320 tex was applied. To achieve the desired fiber content of 60 w %, two PA filament yarns with a single linear density of 140 tex were used within the commingling process. Using a process pressure of 9 bar and an overfeeding of 1.5 %, the GF and PA filament yarns were commingled at a production speed of 100 m/min to hybrid yarns.
Method for yarn analysis
Sample preparation and digital image processing
To investigate the degree of interlacing along the yarn length, a number of 1-m-long samples (n ≥ 5) are taken from different areas of the yarn in order to get representative results for the whole yarn package. The distance between the samples should be at least 1 m. The specimens are individually placed without tension in a scanning device. By using the scanner, a digital image of the yarn topography is produced. For the following optical analyses of the yarn structure, the resolution of the picture should be higher than 300 × 300 pixels.
By using micrographs of the yarn architecture, typical effects within the yarn samples are visually recognized. Depending on their appearance, the effects are assigned to one of the five specific categories shown in Figure 1.
Microphotographs of interlaced nips in commingled yarn.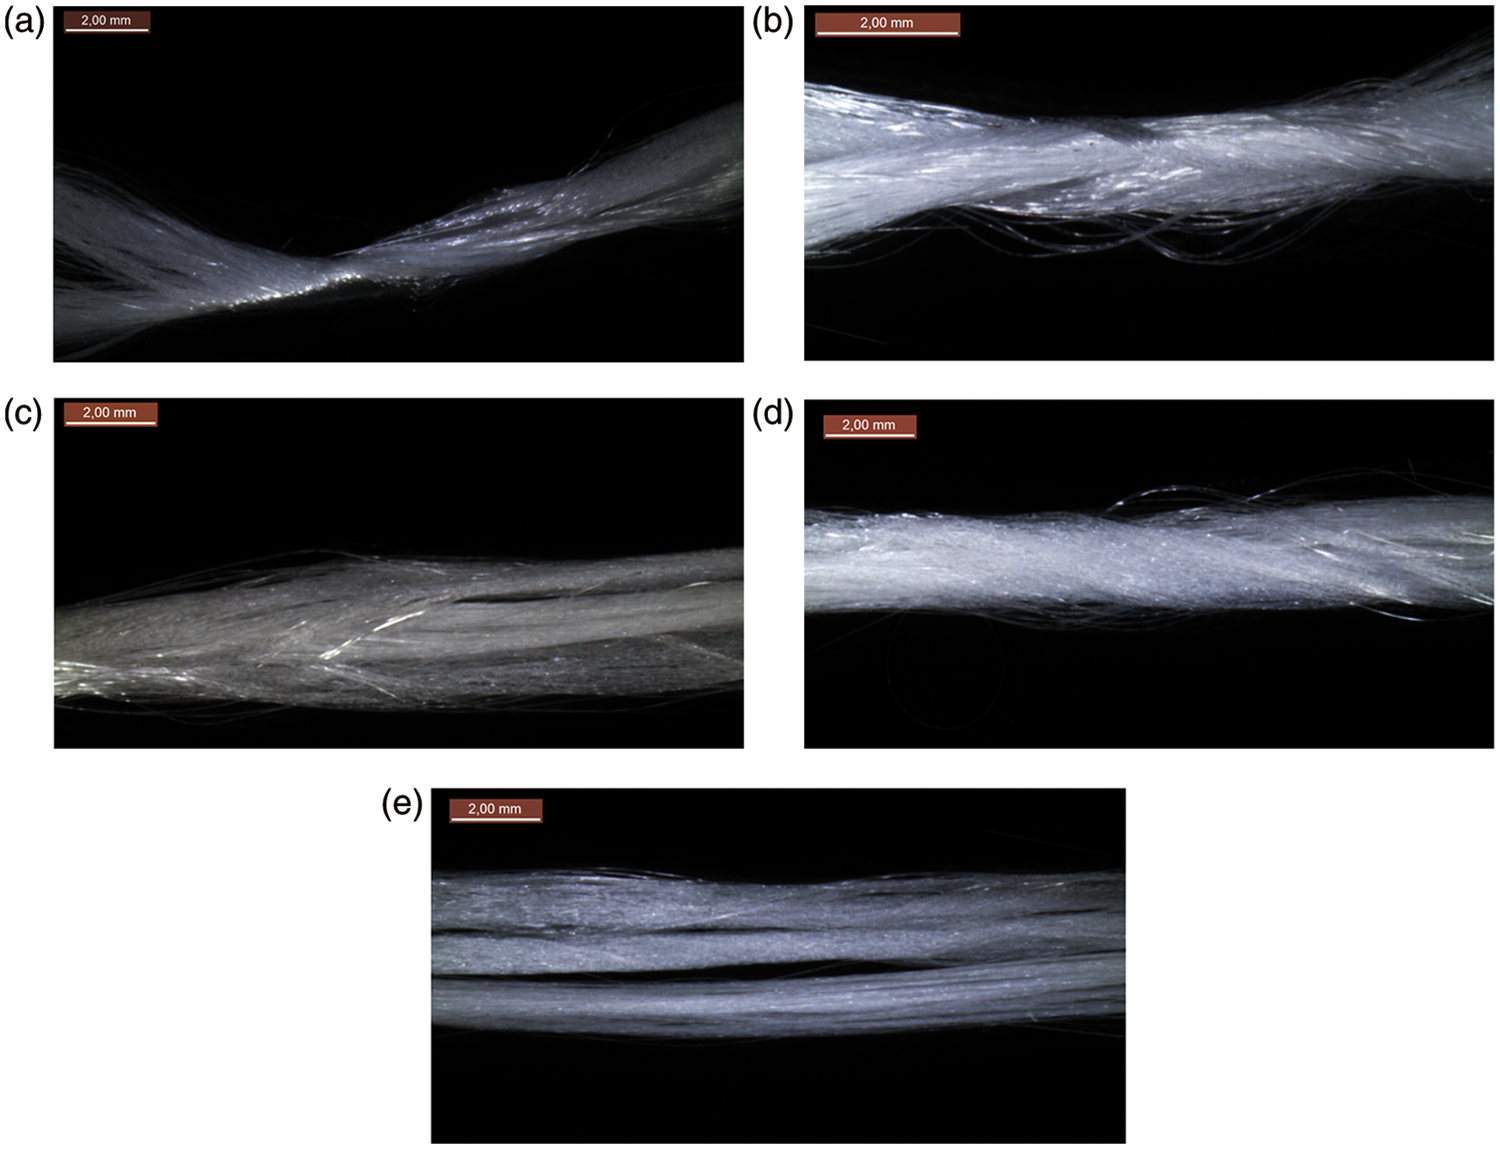
Twist nips (Figure 1a) appear when the applied raw materials are insufficiently opened during the commingling process. Braid nips (Figure 1b) consist of intertwined filament bundles that form braids. Wrap nips (Figure 1c) are created when the applied yarns are divided into two or more filament bundles, one of which is pulled out by the air jet and is wrapped around the other bundle. Entangle nips (Figure 1d) consist of randomly mixed filaments and therefore show no unique structural patterns. Additionally, there are non-interlaced parts in which the two components are neither mixed nor bound whatsoever (Figure 1e).
To analyze the blending quality in the yarn, a number of samples (p ≥ 5) are taken from each category for microscopic investigation. Thus an arithmetic average for the fiber distribution in each effect category can be built on the base of n × p ≥ 25 pictures. The quality of sample preparation is crucial to ensure accurate filament recognition. Hence, to achieve a high accuracy of recognition, the samples are prepared according to the following method. First, the yarn samples are passed through rubber tubes and clamped to a special frame. The next step involves preparation of a mixture of epoxy resin and hardener into which the samples are embedded. Third, the samples are ground by using fine-grained silicon carbide (SiC) abrasives and diamond discs in water on a horizontal rotary grinding wheel. Grinding is performed in four steps by decreasing the grain size of the SiC grinding discs from 125 µm to 68 µm and then reducing that of the diamond disc from 30 µm to 15 µm. Finally, to avoid scratches on top of the slices, the sample surfaces are polished by using an aluminum oxide suspension on woven cloth attached to a rotating wheel in two steps with successively finer grain sizes of 3 µm and 0.05 µm.
The filament distribution and interlaced nips in the manufactured commingled yarn are further examined by optical microscopy. To analyze the interlacing nips and cross sections of the yarn, pictures are taken at magnifications of 20× and 200×, respectively. The micrographs are captured by a Leica microscope DM 4000 M equipped with a digital camera in TIF format with a minimal resolution of 300 dpi. Recognition of the filaments was conducted automatically by ImageJ software for digital-image processing, and for maximally accurate analysis the additional processing for filament recognition was done manually. Image processing, including various filtering processes with convolution function for removing noise and separating filaments from the background, was carried out for reliable recognition of the filament location. As a result of digital-image processing, the coordinates of the single filaments (white points for glass and black points for PA) as well as the centers of gravity for both components (larger white and black points) in the yarn were determined (see Figure 2). In addition, the center of gravity was found for all component filaments (larger white/black points).
Microphotographs of cross section of interlaced nips in commingled yarn (left) and recognized models (right): a – twist; b – braid; c – wrap; d – entangle; e – non-interlaced. Microphotographs of cross section of interlaced nips in commingled yarn (left) and recognized models (right): a – twist; b – braid; c – wrap; d – entangle; e – non-interlaced.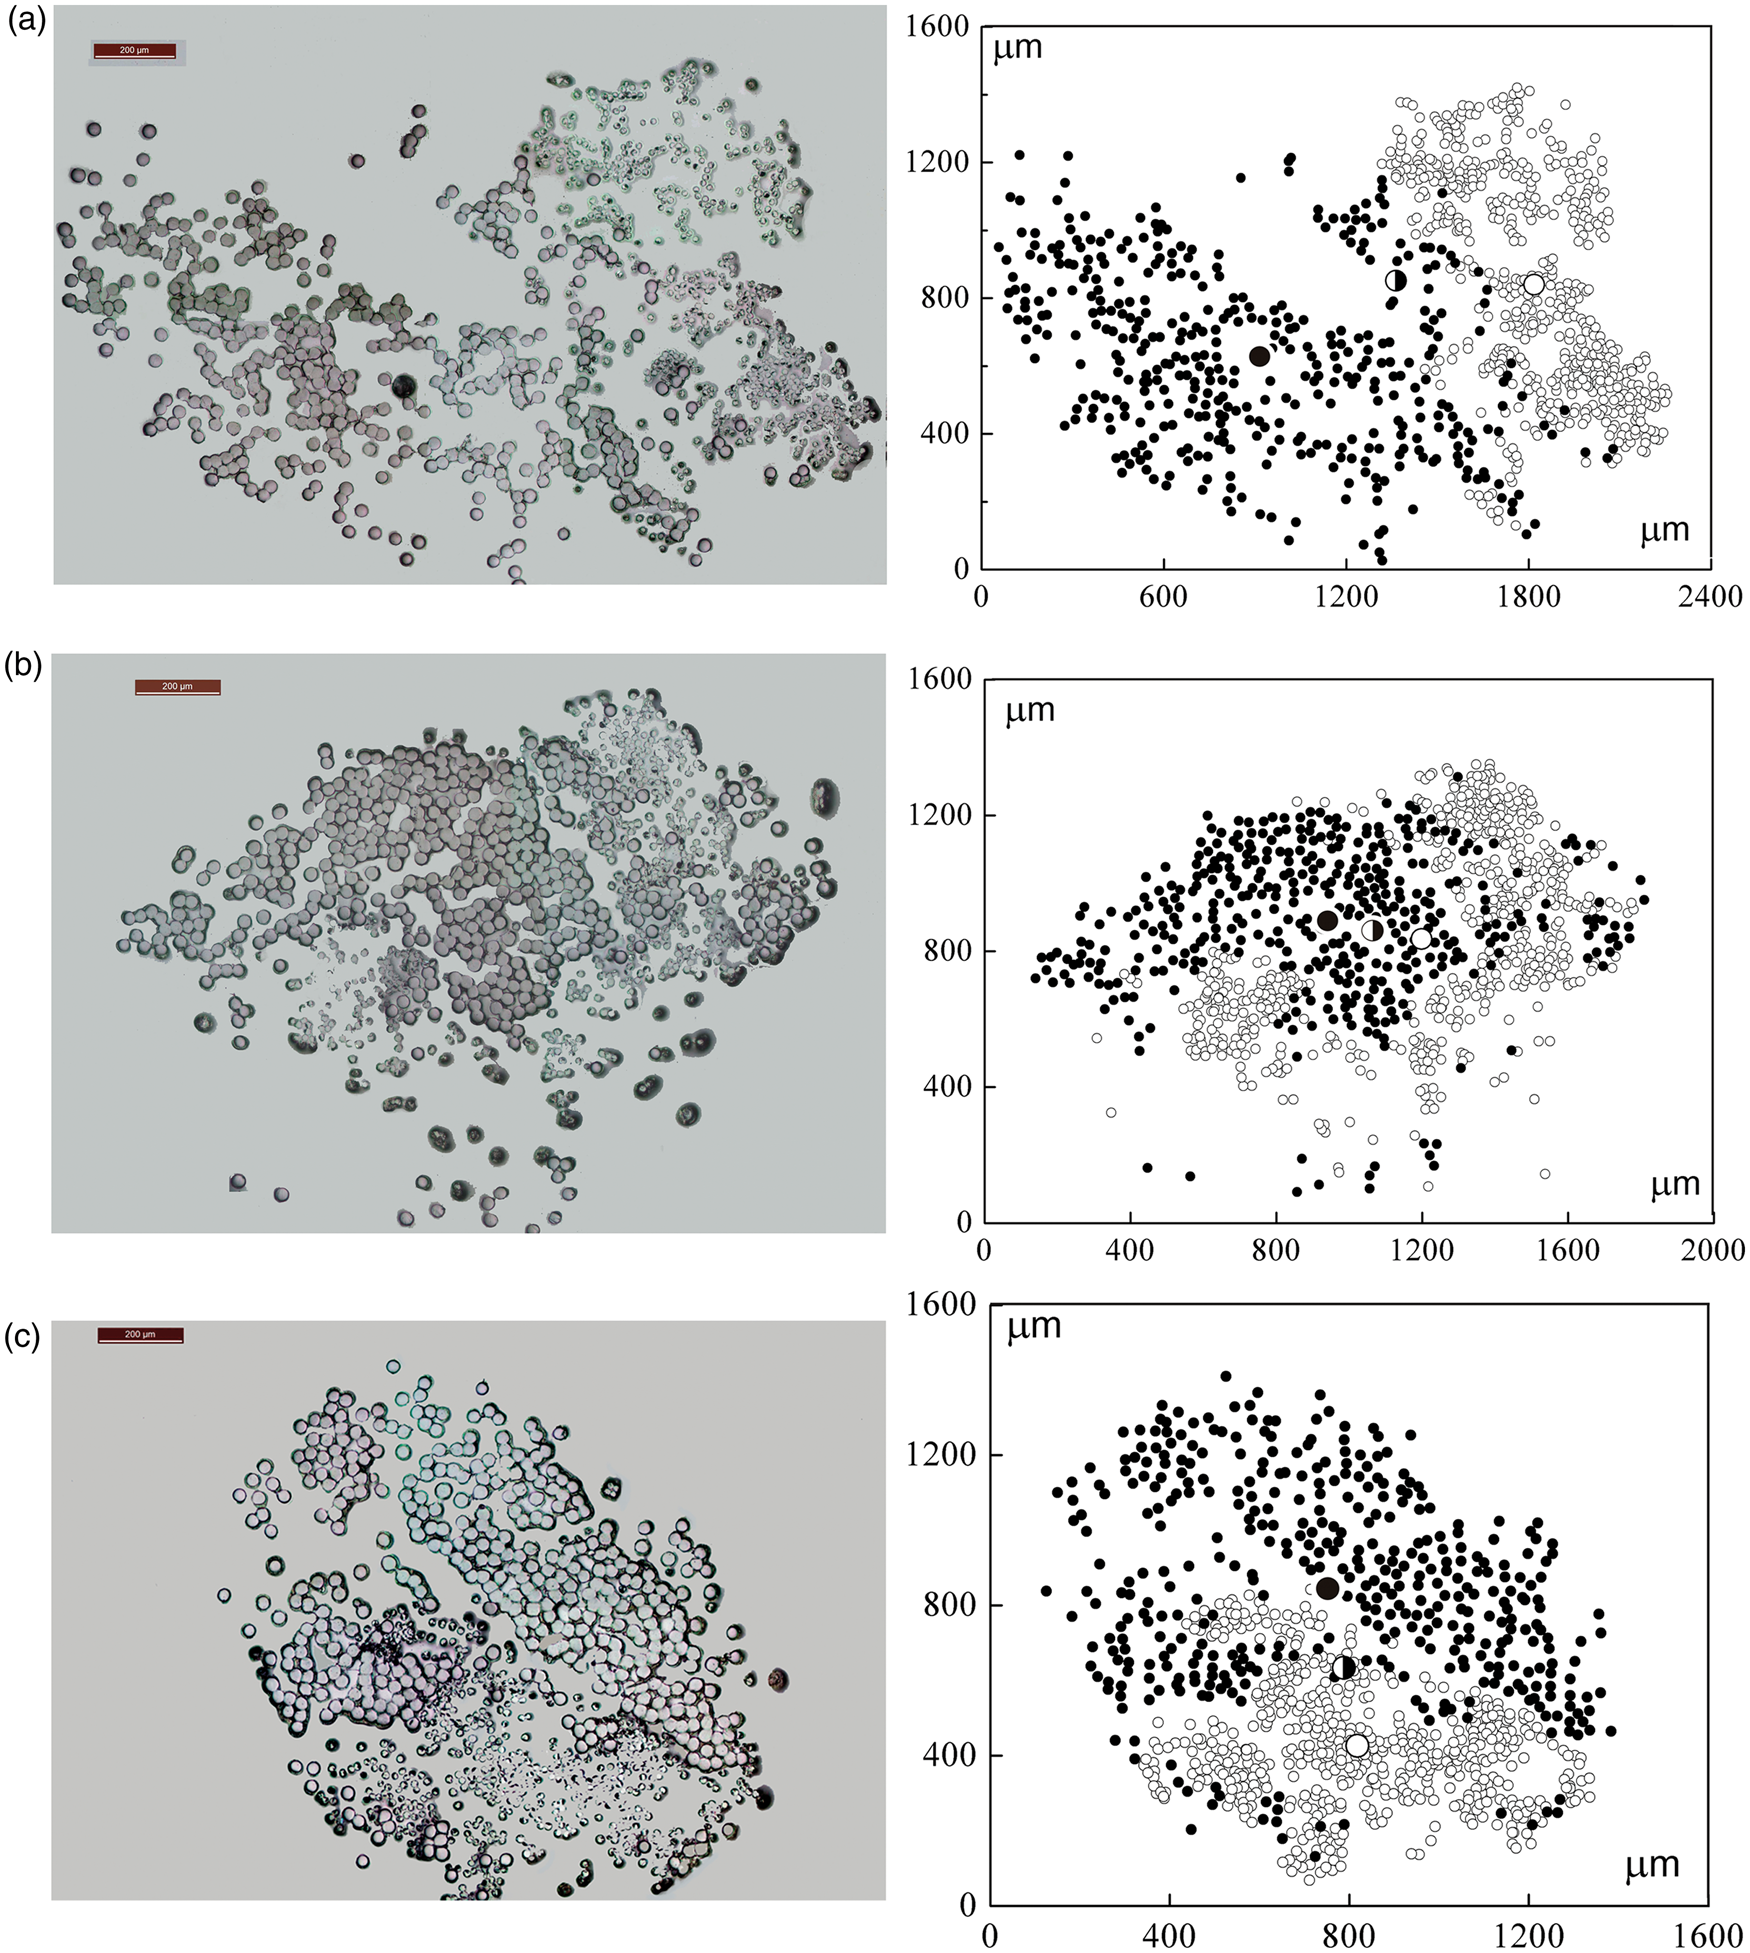

Analysis of yarn structure
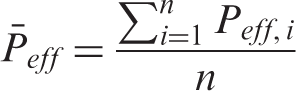
The portion of the typical effects in yarn P
eff,i
(twist, braid, wrap, entanglement and non-interlacing) is calculated according to Equation (1)

The average portion of the effect in all n samples taken from the yarns is given by
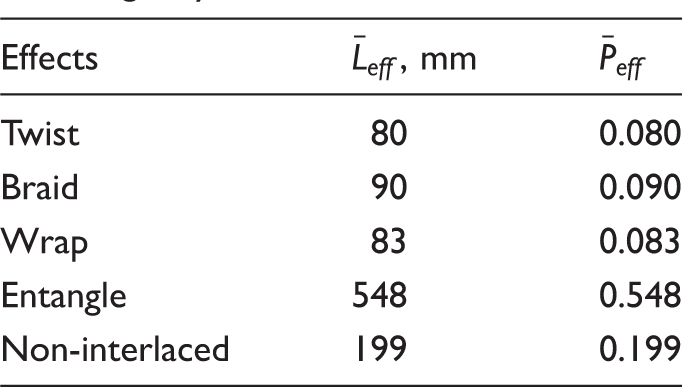
Characteristic parameters of commingled yarns
Analysis of yarn cross sections
Two parameters define the quality of filaments disposition in the cross section of a commingled yarn: filament distribution and blending quality. Filament distribution defines the homogeneity of component dispersion in the cross section of a manufactured hybrid yarn. In contrast, the blending quality defines the level of mixing between the components. It should be noted that although the degree of blending of the filament components in the yarn cross section is determined by the uniformity of distribution of the reinforcement and thermoplastic filaments, a homogeneous filament distribution does not necessarily lead to a uniform blending of the different components.
Filament distribution
Different statistical methods can be used to evaluate the distribution quality of the commingled yarn. Here, the radial distribution index 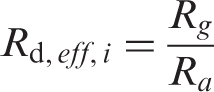
The average radius of the glass component, R
g, the average radius of the PA component, R
p, and the average radius of all filaments, R
a, are defined by Equations (4), (5) and (6), respectively.


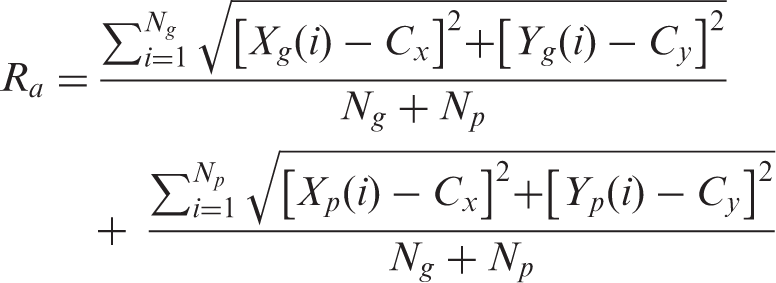
Here, Xg(i) and Yg(i) are the coordinates of i th recognized glass filament, Cx and Cy are the center coordinates of all filaments, Ng is the number of glass filaments in the cross section, Xp(i) and Yp(i) are the i th recognized PA filament, and Np is the number of PA filaments in the cross section.
For the n samples in one of the five effect categories, the average index of the radial distribution 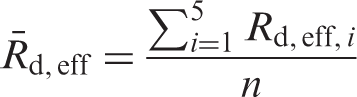
The lateral distribution index within the effect category, L
t,eff,i, is determined using Equation (8)

For each of the five effect categories, the average index of the lateral distribution with n yarn samples, 
Figure 3 shows a graphic example of determination of the radial and the lateral distribution indices.
Examples for determination of radial distribution index (a) and lateral distribution index (b).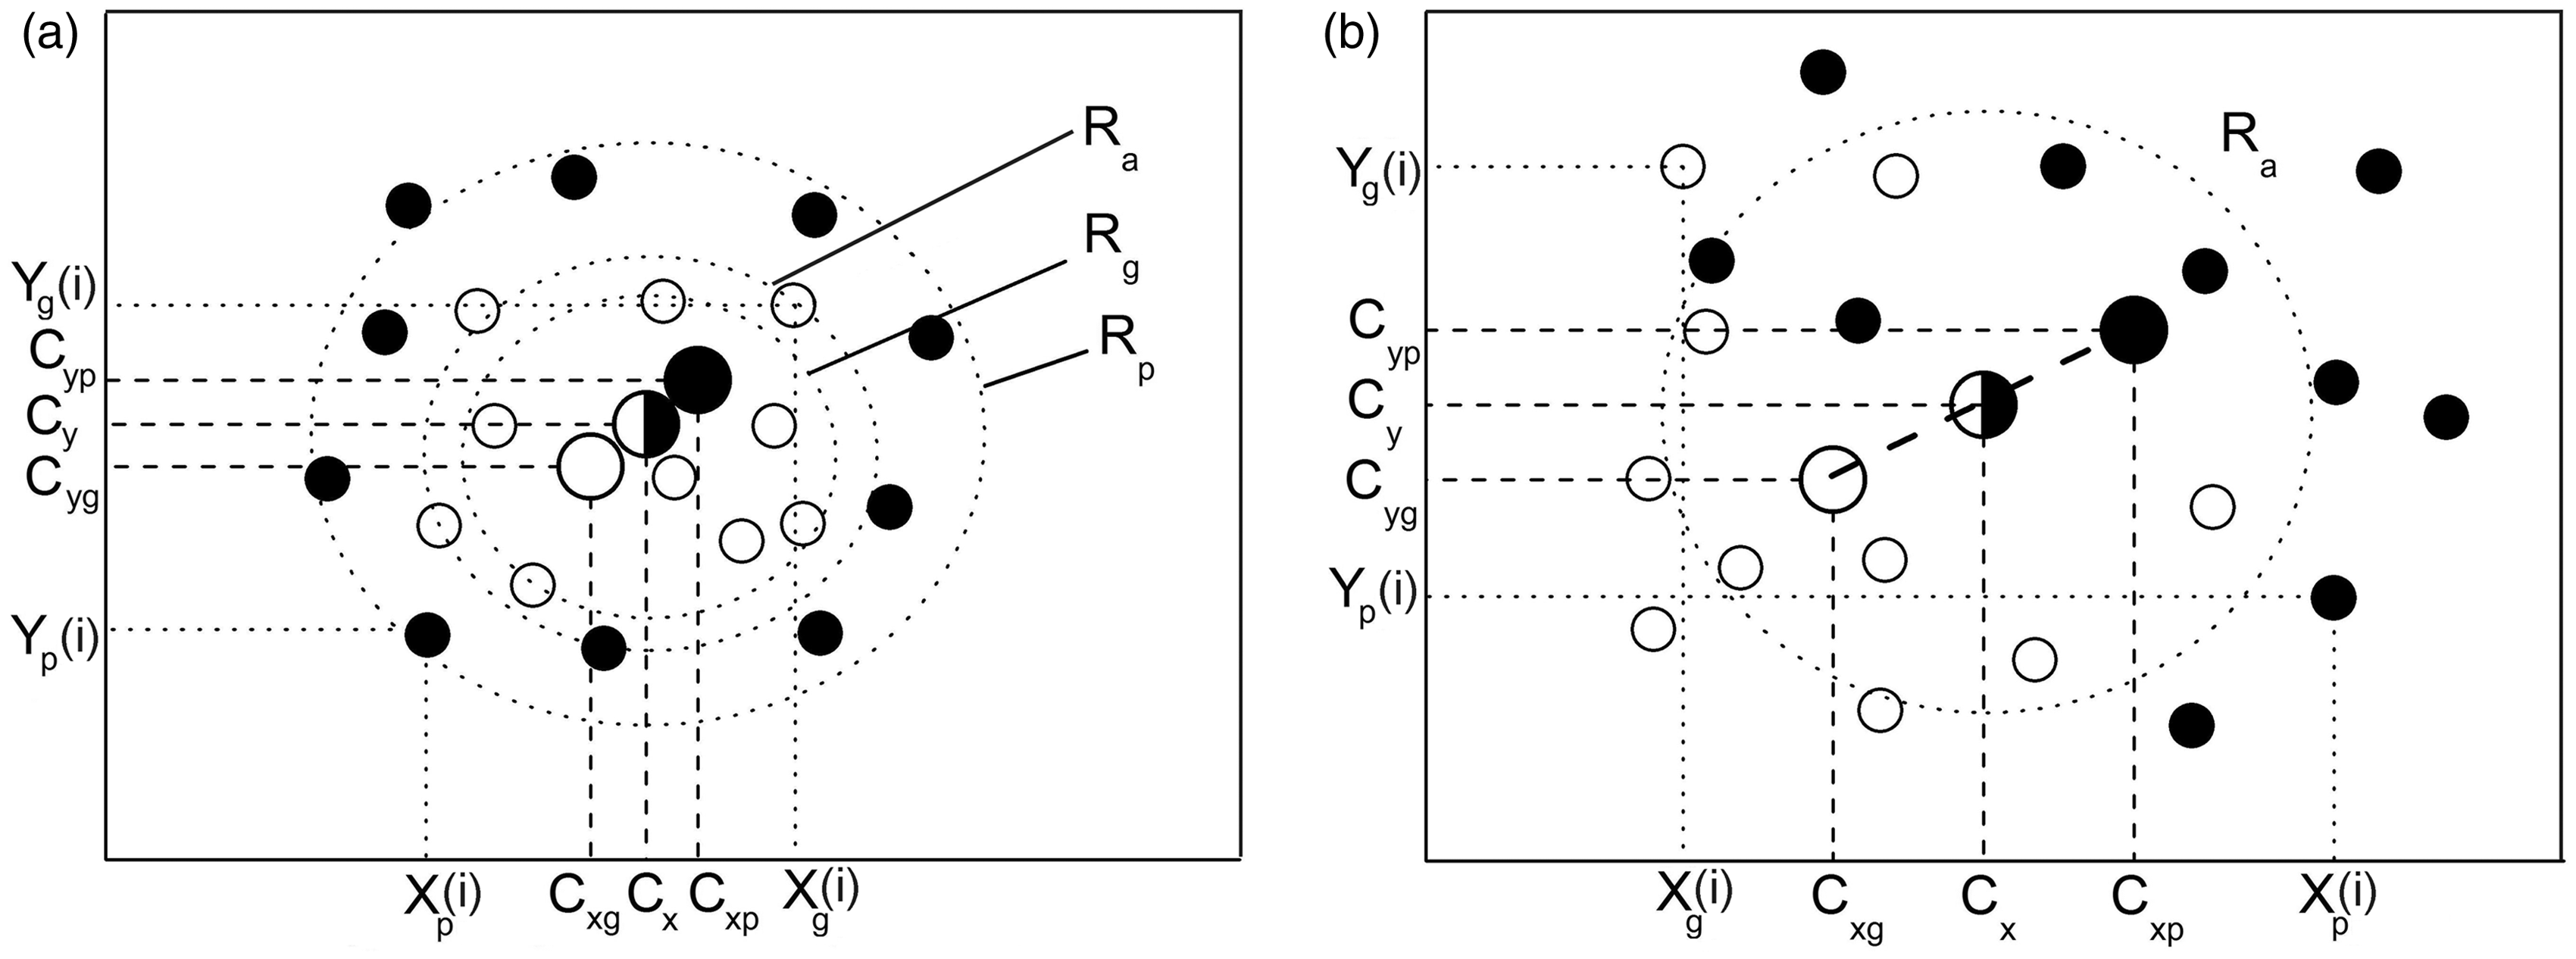
Blending quality
To assess the blending quality of the components in the cross section of the specific effect, both radial and lateral coefficients should be considered. A new blending coefficient is introduced, which is calculated according the following equation.

The first term of this equation gives the distance to the perfect radial distribution of the filaments in the cross section. The second term, the lateral distribution
The distribution of filaments is next described for the different effect categories. Twist nips in the cross section are arranged side by side as compacted bundles of filaments (Figure 2a). In the case of braid nips (Figure 2b), bundles of filaments form an interwinding structure with a positive effect on filament blending. In wrap nips (Figure 2c), a bundle from the first component is in the process of embracing the bundle of the second component, demonstrating the typical wrapped structure. In the case of entangle nips (Figure 2d), a random distribution of filaments is observed with homogeneous blending of the filament bundles. Within the non-interlaced areas (Figure 2e), both components are positioned side by side without any blending.
Blending properties of commingled yarns
PA: polyamide 6;
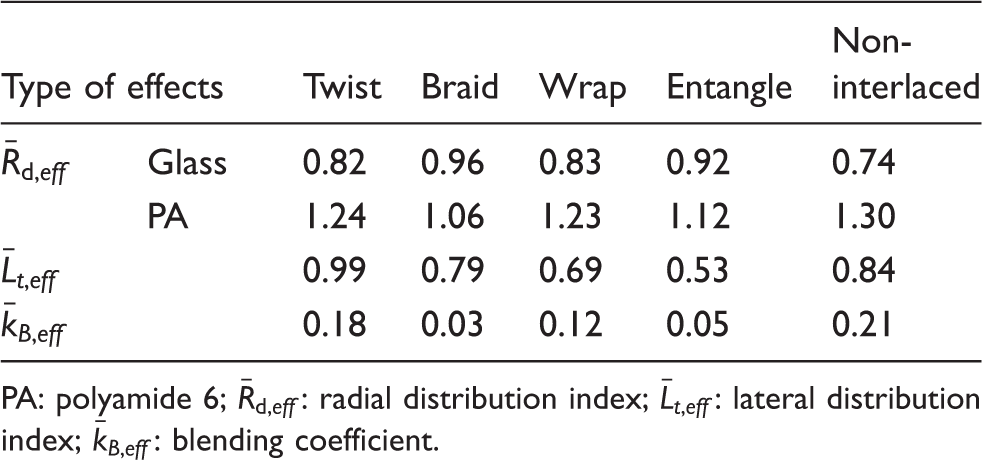
The worst distribution performance among interlacing effects was observed in the case of twist and wrap nips, in which the difference between the radial distribution indices of the individual yarn components is greatest. This genuinely reflects differences in the structure of these nips based on the manufacturing processes. However, if we compare the lateral distribution index, which shows the degree to which the centers of filaments are separated from one another, then twisted nips show worse performance than wrapped nips. This is demonstrated clearly by calculating the proposed blending coefficient, which reveals a difference between the two nips.
Good distribution and blending is observed in the case of braided and entangled nips. In these cases of interlocking bundles, chaotic and homogeneous mixing is observed.
For purposes of comparison, yarn samples were taken from non-interlaced parts of commingled yarn. As can be seen from the pictures, in this case the yarn strands are arranged side by side, and may even be located at some distance from one another. This accordingly affects the distribution indices. The difference in the radial distribution indices between the glass and nylon filaments is largest in this case. Correspondingly, the lateral distribution index strongly differs from 0, because the centers of the two filaments sections are located far apart from one another. This case somewhat resembles that of twisted nips, in which the strands are located in a similar fashion.
Analysis of blending quality along yarn length
By using the values from Tables 1 and 2, the index for the blending quality of the entire commingled yarn is calculated using Equation (11)

Here, the index represents an average value of the blending indices within the cross sections of the different effects in yarn, where the portion of each effect on the sample length is taken into account. Yarns with perfect distribution of the components in their cross section exhibit a blending index kB,yarn = 0. A blending index kB,yarn > 0.2 is typical for yarns with a side-by-side alignment of the single components in the hybrid yarn.
Conclusions
In this work, a new method for analyzing the blending quality along the length of commingled yarns was presented. The method can be applied as part of a quality management system for the manufacturing process of thermoplastic composites based on commingling yarns.
In the proposed method for yarn analyses, five categories of typical effects were defined in commingled yarns: twist, braid, wrap, entangle and non-interlaced. Furthermore, a new index for characterizing the blending quality of the cross sections of commingled yarns was introduced. The blending quality and distribution of filaments in the cross section of GF/PA hybrid yarn used to manufacture thermoplastic composites was investigated. By using the classification of the typical effects in the yarn and the new blending index, the coefficient of blending quality of the yarn was calculated. The example of GF/PA commingling yarn showed that the blending index of commingling yarns kB,yarn is determined in the range from 0 to 1. Yarns with blending index kB,yarn = 0 show a perfect distribution of the components in the yarn cross section. In the hybrid yarns with a blending index kB,yarn > 0.2, a side-by-side alignment of the fiber components with a poor blending is observed. This coefficient provides the measure for the quality of the commingled yarn and can be used for comparing different yarn structures.
Footnotes
Funding
This work was supported by the DFG (Deutsche Forschungsgemeinschaft) and BMBF (German Federal Ministry of Education and Research).