
Abstract
The permeability property of fabric is a desired performance property of textile structure used in different areas. In this study, the relationship between in-plane and through-plane permeability behaviors and the structural properties of woven fabrics having numerous usage areas, such as clothing and technical textiles, were investigated with the help of data obtained from a group of test fabrics having different weave types and weft settings, which were produced by using the same warp and weft linear density. In the study, the pore properties were examined in two regions: inter-yarn and inter-fiber pore regions. After defining the pore properties, which were determined by the structural and geometrical properties of fabric according to different approaches, the permeability results of both in-plane and through-plane directions were predicted theoretically by using obtained pore properties in flow equations. Estimated permeability results were compared with experimental results and the suitability of methods were discussed.
The performance property that comes out as a result of flow through the fabric and is named “fabric permeability” is a function of first the pore properties of fabric, as well as of the environmental factors and the fluid properties that pass through the fabric. Therefore, the control of permeability performance of a fabric whose usage area is known can be supplied by controlling the pore properties, which are determined by structural properties of fabric. The total porosity that determined the flow was named as “effective porosity”, and it was noted that the effective porosity was formed by three components that were named as intra-fiber, inter-yarn and inter-fiber (intra-yarn) porosity by Burleigh et al. 1 The intra-fiber porosity was generally neglected in studies and the total porosity responsible for flow was defined as a function of inter-yarn and inter-fiber pores. However, woven fabric structures are complex structures that consist of different parameters. Consequently, the permeability performance of fabric formed by the co-occurrence of many different factors was a complex three-dimensional (3D) mechanism and its prediction was hard.
Backer 2 first defined four intersecting types for the yarns by assuming them to be flexible, inextensible, circular cylinders to simplify the complex fabric structure; then, he studied the relationship between this geometry and the air flow through the fabric. Thus, he discussed the help of different structural properties, including weave types, yarn spacings and yarn type to air permeability. Pore structures, which were defined according to yarn intersecting types, were used in many researches as basic structure later.3–7
In the theoretical models that were formed to estimate the flow, Poiseuille (1840), Darcy (1846) and Kozeny (1927) equations, which were modified according to properties of pore medium, were generally used. Goodings 8 indicated that air flow could be explained using the Poiseuille equation by testing a group of fabric samples and analyzing the air flow as a function of pressure change by finding the pore diameter of fabric using the measurements of air pressure differences between two surfaces of fabric. Van Den Brekel and De Jong 9 predicted the fluid flow of the porous medium in both inter-yarn and inter-fiber regions by investigating Kozeny and drag theory in their calculations. In the fabric, the inter-yarn and inter-fiber pores were assumed as parallel regions; accordingly, the permeability coefficient for both inter-yarn and intra-yarn transmission was calculated by the continuity equation and local porosity. In another study, the fluid flow that took place in the fabric at the laminar flow region of yarn groups was approximately explained by Darcy’s law. The fluid flow model, which was developed in inter-yarn and inter-fiber capillaries by assuming the cross-section of the yarn being race track, was formed by evaluating it together with a geometrical model that depended on hydraulic radius theory. 10 Kulichenco and Langenhove 11 modeled the fabric as a parallel capillary system in order to predict the air permeability of the porous aerodynamic structure. They defined an equation for the filtration rate of total flow in the porous system, depending on pressure difference, fluid viscosity, hydraulic pore diameter, pore length and porosity, by thinking laminar flow properties, Stokes and Weisbach–Darcy equations all together.
In recent years, 3D model studies have increased as a result of the development of computer-aided design systems. Permeability models, which also depend on geometrical properties of fabric, were formed by using formed 3D fabric models with software that was based on computer fluid dynamic (CFD) techniques and was developed for estimating end-use properties of fabric, such as the permeability property.4,5,7,12–14 For instance, Lu et al. 4 analyzed fluid flow numerically for the plain, sateen and twill fabrics by using a CFD software, named Fluent, and found the differences between the flow shapes of different weave types to be significant. The obtained Fluent analysis results supported Backer’s 2 findings; that is, plain fabrics showed resistance to the flow more than sateen weaves that had the same yarn linear density.
In the studies about the theoretical determination of permeability, researchers generally assumed fabric structure as isotropic in order to simplify the structure and solved the flow equations being suitable to this homogeneous structure. Fabrics with multifilament construction were commonly modeled as monofilament and flow equations were solved according to impermeable fabric structures. Apart from these studies, Wang et al. 12 defined an ideal 3D woven fabric geometry formed by multifilament yarns and analyzed the permeability by Fluent CFD software. Thus, the flow area in the fabric was divided into two regions – inter-yarn and inter-fiber pore – which were calculated separately. On the other hand, the homogeneous method, which analyzed the heterogeneous medium according to the homogeneous medium having the same average macroscopic behavior, was used by different researchers.14,15 The fluid flow at microscopic level was explained by the Stokes equation when the method was applied; the permeability of fiber tow was calculated first and the effective permeability was determined by then considering the effects of fabric parameters. In another numerical approach to predict the effective permeability, the flow was controlled by continuity and Stokes equations in the unit cell and the flow in the yarn was modeled by using the Brinkman equation by considering how yarns should behave as a permeable, porous medium.14,16–18 Verleye et al. 19 computed meso-scale permeability by two different methods in order to simulate macro-scale permeability. The structure, which was formed by the macro pores at the inter-yarn regions and micro pores at the intra-yarn regions, supported the fractal construction. Yu and Lee 20 used fractal theory in the determination of fabric permeability and calculated the flow carried out through a pore by modifying the Hagen–Poiseuille equation. In another study, the capillary rise in the yarn was modeled by defining the fractal structure of intra-yarn pores. 21
In the first part of their study, Das et al. 22 formed a yarn model depending on yarn parameters that would affect the vertical wicking behavior of yarn and calculated the capillary flow with the Hagen–Poiseuille equation by using the parameters obtained from the model. In the second part of the study, they first improved a mathematical model by modeling the yarn geometry in the fabric as an inclined tube in order to predict the vertical wicking behavior of plain woven fabric and then calculated the wicking height by defining the yarn geometry according to Peirce geometry. 23 Experimental and theoretical results showed that the starting wicking rate was higher in yarn than in fabric. However, it was observed that wicking height was higher in the fabric than yarn at the state of equilibrium and this situation was interpreted as the fact that the weft yarns continued providing fluid in the warp yarns by functioning as a reservoir during wicking.
In the studies, it was presented that the fabric parameters, such as linear density of the yarn, yarn packing rate, fabric density, crimp factor, the cross-section shape of the yarn, the total cover factor, weave type and raw material properties, affected the fabric geometry and the flow behavior of fluid. The yarn diameter is an important property in defining the pore properties and the diameter values obtained by different methods result in differences at the calculated pore parameters.24,25 It was observed that the cross-sectional shape influenced the pore and flow properties by investigating section structures, such as elliptical, 13 racetrack and lenticular shapes. 26 Therefore, it is important to choose the true method when determining structural properties.
This study was aimed at predicting the flow carried out in the through-plane (out-of-plane) and in-plane directions by using the structural properties of fabric and classical flow equations. For this purpose, the pore properties at through-plane and in-plane directions were determined separately for the flow that occurred in the inter-yarn and intra-yarn regions first and then the permeability properties of fabric were defined by evaluating the flow results of two pore regions together. The difference of this study from other studies was that the through-plane and in-plane flow mechanisms of fabric were studied together by analyzing effective pore properties separately for these two flow directions. When the permeability properties were calculated theoretically, classical Darcy and Poiseuille equations were modified to predict the through-plane flow and the Lucas–Washburn equation was modified to predict the in-plane flow by considering the pore properties obtained from models. Thus, the predicted permeability results were obtained depending on the structural parameters of fabric. Obtained theoretical results were tested by being compared with the experimental results.
Theoretical study
The flow of a fluid in the fabric and yarn occurs through three dimensions. These are the flow mechanisms that take place in-plane (x and y coordinates) and through-plane (through-thickness) directions. In this study, the in-plane and through-plane flow mechanisms were predicted separately according to pore properties at those directions. The pore properties of fabric were first defined by dividing the fabric into two regions as inter-yarn and inter-fiber pore regions; the flow rates of these two regions were calculated by assuming that the 3D flow mechanism was formed through inter-yarn and inter-fiber regions separately. Later, the fabric permeability, which occurred as a result of flow through two regions, was defined according to the structural parameters of the fabric.
The surface and cross-sectional images of the fabric samples were observed to clarify the models of inter-yarn and inter-fiber pore regions. In Figure 1(a)–(c), scanning electron microscopy (SEM) images of plain, 2/1 twill and 3/1 twill fabric samples are given, respectively, in order to indicate inter-yarn pore regions. Different inter-yarn pore types are indicated on the surface images of the fabrics in Figure 1(a)–(c). In Figure 1(d) and (e), the surface and cross-sectional SEM images of the yarn structure are shown, respectively. In Figure 1(f), the pore structure of the yarn can be observed in detail with the help of the obtained cross-sectional image of the fabric by using frozen section technique and a research microscope. As seen in the figures, pore regions are effective at both flow directions.
Surface SEM images of (a) plain fabric, (b) 2/1 twill fabric, (c) 3/1 twill fabric, (d) yarn, (e) cross-sectional SEM image of yarn, (f) cross-sectional image of yarn obtained by frozen section technique using a research microscope.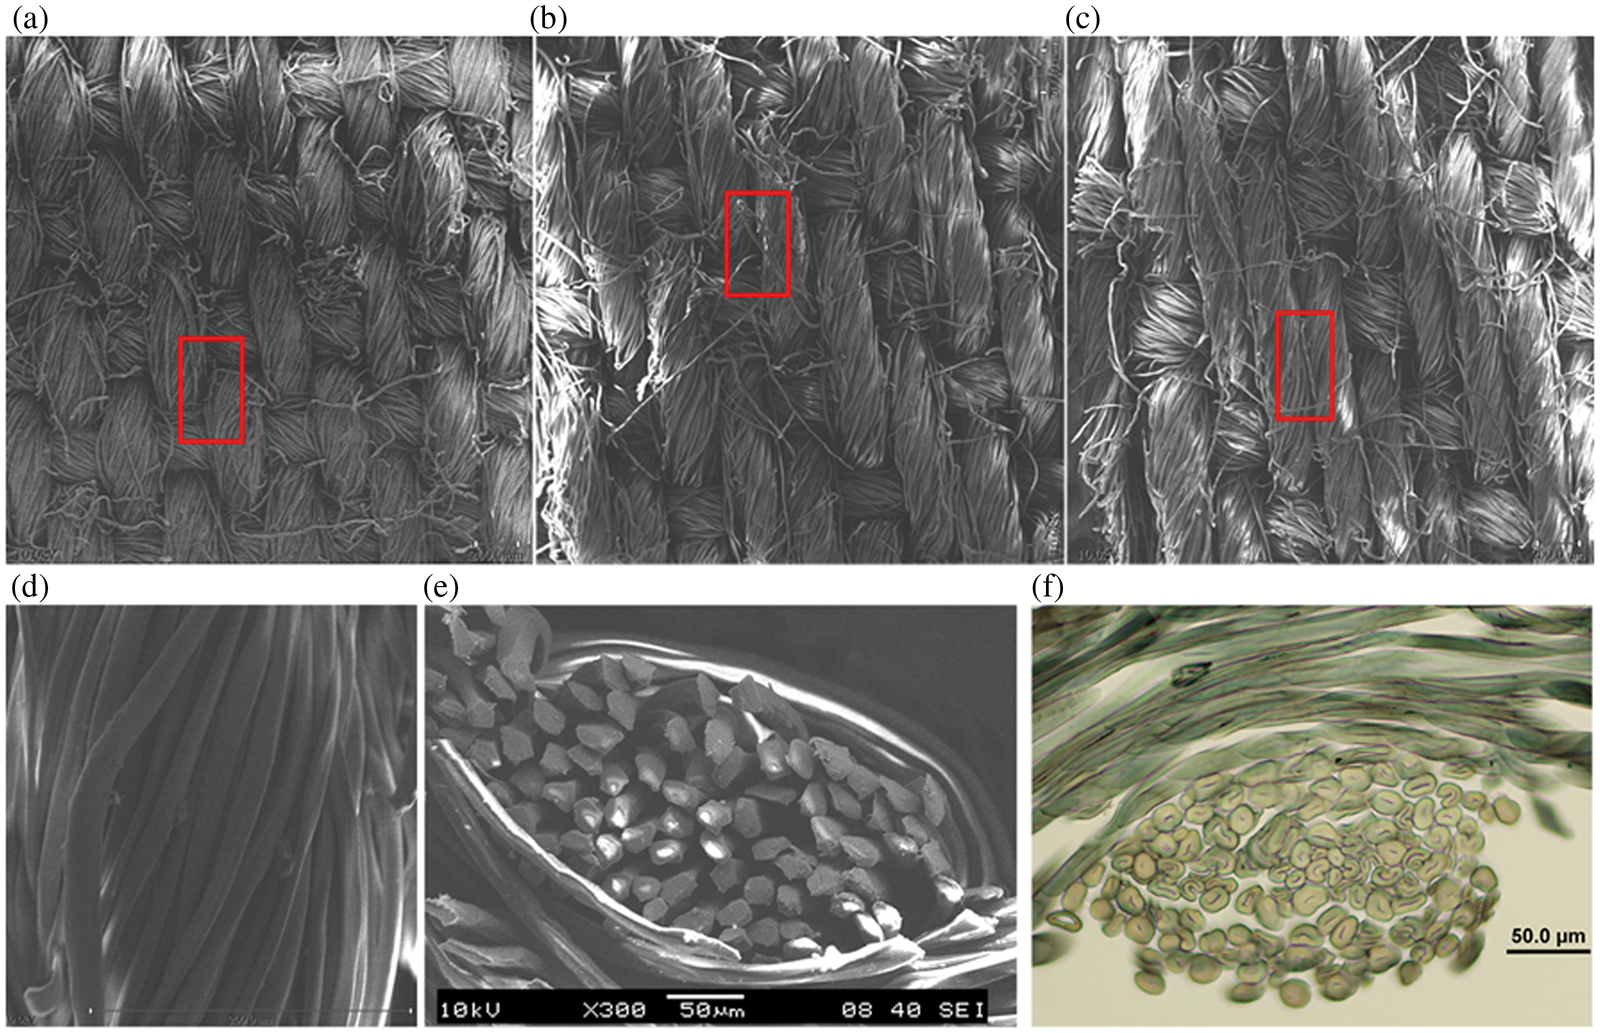
Defining the inter-yarn and inter-fiber pore parameters for through-plane flow
In woven fabrics, empty regions, named “inter-yarn pores”, were formed between the yarns by the intersecting of warp and weft yarns. In the first stage of this study, fabrics were assumed as being formed of circular, impermeable, monofilament yarns in order to define only inter-yarn pore properties by simplifying the pore structure of the fabric. Pore size and porosity properties of inter-yarn regions were estimated by using two-dimensional (2D) and 3D unit pore models. The pore properties of obtained 2D and 3D unit pore cells were defined according to four types of unit pore cell formed as a result of different intersecting of warp and weft yarns, as shown by Backer
2
in Figure 2(a).
Pore unit cell types (a) in 2D geometry, (b) in 3D geometry.
Two-dimensional planer unit pore cell model
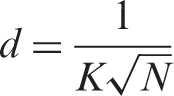
The 2D geometrical properties of unit pore cells were obtained by examining the projection of the intersecting shape on the fabric plane. Two-dimensional unit pore cell models were formed, depending on yarn diameter and spacing parameters. While determining pore parameters of inter-yarn regions, circular yarn diameter calculated according to Ashenhurst theory
27
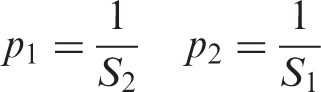
was used. Equation (1) shows the theoretical circular yarn diameter (d), which was calculated according to Ashenhurst theory by using the yarn spinning system coefficient (K is equal to 8.3 for ring spun cotton yarn) and yarn count (N) in the metric system. Yarn spacings (p1, p2) were defined depending on warp and weft settings (S1, S2) in Equation (2). Subscripts 1 and 2 in the equations indicate the parameters in the warp and weft yarn directions, respectively:
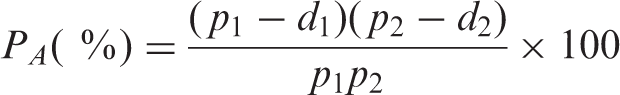
The porosity of the 2D unit pore cell shown in Figure 2(a) in a draft was calculated from the rate of the total open area to the total area of the unit cell. This value, named the areal porosity (PA), is defined in Equation (3). The areal porosity (PA) of all pore types was equal due to the fact that their projections to the fabric plane were the same. Another pore parameter calculated from the 2D unit pore cell model was pore size defined by pore radius. The average pore radius (R2D) of the circular cross-sectional unit pore cell, shown in Figure 2(a), is calculated in Equation (4) theoretically by assuming that it has equivalent pore area with the rectangular unit pore cell:

Three-dimensional unit pore cell model
In this study, 3D unit pore cell models were also formed depending on the intersecting types of warp and weft yarns. Three-dimensional unit pore cells were modeled as settled in a rectangular prism that passed from the center yarn axes of warp and weft yarns and for which the dimensions were equal to fabric thickness (t) and yarn spacings (p1, p2), shown in Figure 2(b). The total volume of the 3D unit pore cell was equal to the volume of the prism (VT). The total yarn volume (VY) in the prism was calculated by using yarn diameter, yarn spacings and the yarn lengths in the pore cell depending on Pierce geometry. Thus, the inter-yarn pore properties of the 3D unit pore cell were not only defined from yarn diameter and yarn spacings, but also according to yarn geometry.
According to the 3D unit pore cell model, the ratio of yarn volume in the prism to the prism volume was named the volumetric packing rate (


Obtaining fabric pore properties from unit pore models
In the study, the average areal porosity (PA), volumetric porosity (PV) and average pore radius (R2D, R3D) of fabric were calculated by considering the type of unit pore cell distribution in the weave unit after calculating the inter-yarn pore properties of 2D and 3D unit pore cell models. While the pore properties of plain weave, which consisted of a Type 1 pore unit cell, was equal to a pore unit cell, average pore properties o f 2/1 twill weave were calculated considering the distribution Type 1 and Type 2 unit pore cells, and the average pore properties of 3/1 twill weave were calculated considering the distribution Type 1, Type 2 and Type 4 unit pore cells. In this study, the variation of yarn diameter, yarn spacings and fabric thickness along the fabric were neglected in order to homogenize and simplify 2D and 3D models. Thus, theoretically calculated average pore radius results for each fabric sample were used in flow equations and the effect of pore size distribution in the permeability result was omitted.
Determination of equivalent pore sizes of intra-yarn regions for through-plane flow
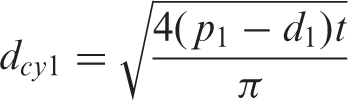
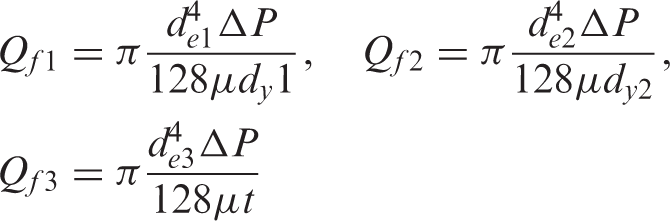
Particularly in multifilament fabrics, the inter-fiber (intra-yarn) regions play a big role near the inter-yarn pores at the movement of flow in three dimensions. Air permeability was related to the flow rate transferred in the perpendicular direction to the fabric. For this reason, flow rates through the yarn must also be defined when defining total air permeability of fabric. As seen in the cross-sectional image of the yarn in Figure 1(f), there were pore canals both along and perpendicular to the direction of the yarn and these canals were interacted with each other. Thus, inter-fiber pore regions were not only effective in capillary flow that occurred along the yarn, but also in the flow that took place in the through-plane direction. In Figure 3, pore regions of the 2D pore unit cell model and the flow rate (Q) occurring in those regions were shown. As seen in Figure 3, the flow rate of the inter-yarn pore region was Qy, the flow rates passed in the warp and weft yarns perpendicular to the plane were Qf1 and Qf2, respectively, and the flow rates of intersecting points of warp and weft yarns were Qf3. The pore properties needed for calculating the flow rate of the inter-yarn region were obtained from 2D and 3D pore unit cell models. The diameters (de) of circulars having equivalent pore area with each regions were calculated by using Equation (7), depending on the structural parameters (d1, d2, p1, p2) of the 2D unit pore cell and yarn porosity, which was determined experimentally, in order to estimate the flow rate perpendicular to the warp and weft yarns. The subscripts 1, 2 and 3 denoted warp, weft and intersecting regions, respectively. Py was the yarn porosity determined from cross-sectional images of the yarns by Stereo Investigator® measurements. In 3D space, the yarn was assumed to be isotropic in terms of areal porosity of yarn. Thus, Py was used in equivalent pore diameter calculations (de1, de2, de3) of yarn regions that were effective at through-plane flow. When the packing ratio of the yarn increased, Py would decrease and also the equivalent pore diameters would decrease. This situation caused a decrease of the through-plane flow of the yarn. In the model, the change of pore properties at cross-over regions, because of bending, was neglected:
Inter-fiber and inter-yarn pore regions of 2D pore unit cell.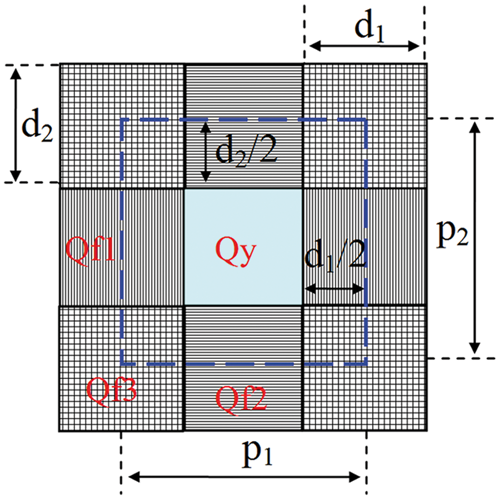

Determination of pore properties for in-plane flow
Capillary flow in inter-yarn region
Firstly, the fabric system was modeled as a structure that consisted of parallel yarns to each other in order to model the capillary flow mechanism in the vertical direction at the inter-yarn pore regions (Figure 4(a)). Then, considering the 3D structure of the fabric system (Figure 4(b)), the capillary diameter of the inter-yarn region was calculated as a parameter depending on yarn diameters (d1,d2), yarn spacings (p1, p2) and fabric thickness (t) by using Equation (8). In Equation (8), the subscript 1 defined capillary diameter for the warp direction. The same calculations were made for weft direction. The dimensional variation of the capillary system due to yarn geometry was neglected:
(a) Simplified capillary flow between parallel yarns, (b) Capillary flow mechanism in the inter-yarn regions of the fabric, (c) Capillary flow mechanism in inter-fiber regions.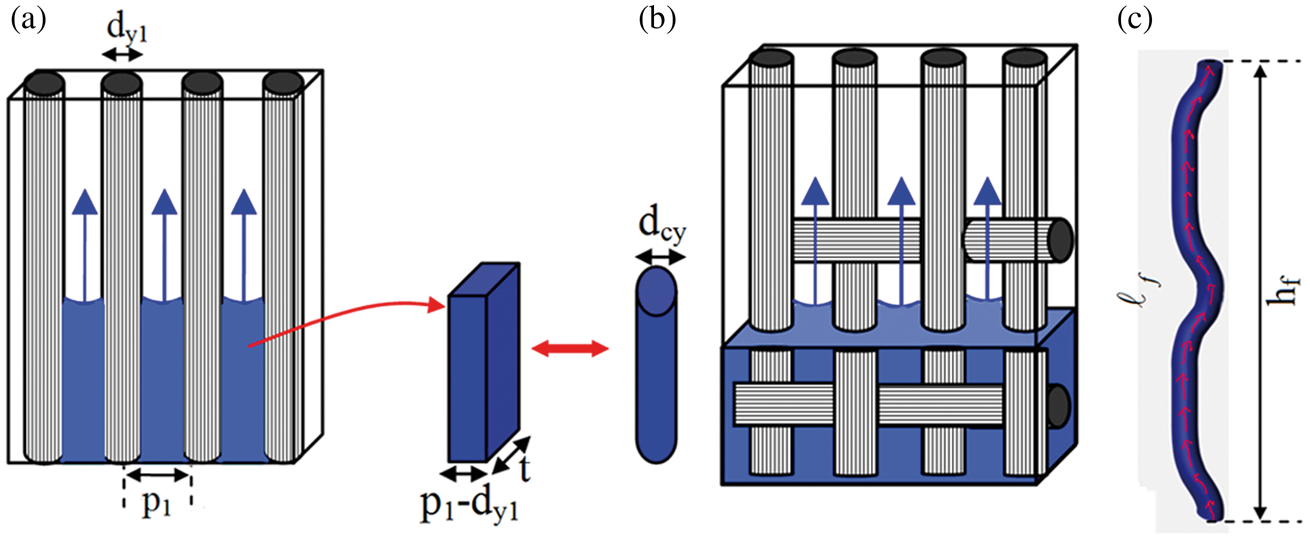
Inter-fiber unit pore cell model for in-plane flow
As seen in the real cross-sectional images of the yarn there were pore regions between the neighboring fibers along the yarn. The capillary pressure formed by inter-fiber pores contributed to the drive of the flow. The pore sizes of inter-fiber regions in the yarn where the flow occurred must be determined in order to estimate the fabric permeability by calculating the in-plane flow mechanism along the yarn. The structural parameters of the yarn, including fiber diameter, yarn twist, etc., were not homogeneous along the yarn. Also, due to the fact that the pore properties of yarn, such as porosity, pore size and pore shape, were not homogeneous, the prediction of capillary flow became a complex problem. For this purpose, the yarn that consisted of staple fibers was modeled as being an ideal structure according to the assumptions which accepted that fibers were the same length, that fibers oriented end-to-end along the yarn, that the fiber number did not change in the cross-section of the yarn, that the distance between fibers was same and that fiber diameter was constant. The effect of the twist was neglected and the fibers were assumed to be parallel to each other. In Figure 5, the hexagonal packing of the fibers in the idealized yarn model was shown. As seen in the model, the pore size distribution of inter-fiber regions was ignored. Accordingly, in Equation (9), the average pore size of inter-fiber (Rpf) was calculated by using the circular cross-section fiber radius (Rf) and the distance between two fibers (R), and by considering that the unit area of the inter-fiber pore region (Apf, shown in Figure 5) was equal to a circular cross-section pore area. The R parameter, which expressed the distance between two fibers, was related to the yarn packing ratio. First of all, the packing rate of an inter-fiber pore unit ( Inter-fiber pore unit cell model.


Prediction of permeability properties
Prediction of through-plane permeability
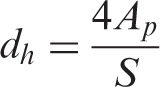
The flow velocity (Um, m/s) in a tube having a defined length (L) and diameter (dh) was defined by Equation (13). In the equation, dh (m) denotes hydraulic pore diameter, ΔP (Pa) is the pressure difference between two surfaces of fabric, μ is the viscosity of fluid and L is the length of the pore. The hydraulic diameter of the pore (dh) was calculated by Equation (14), depending on pore area (Ap) and the wetting perimeter length (S) of the pore contacted with fluid:

The flow rate (Qy, m3/s) of inter-yarn pore regions of the fabric was defined by Equation (15) as related to the flow velocity of fluid (Um), the cross-section area of one pore and the number of pores in the unit area.25,28 The pore length (L), along which the fluid transport was assumed to be equal to the fabric thickness for the inter-yarn region in order to calculate the flow rate, occurred perpendicular to the fabric plane. In the study, the hydraulic pore diameter for inter-yarn pores (dh) was assumed to be equal to the pore diameter obtained from 2D and 3D pore models; the air flow rate (Qy) through the inter-yarn pore regions was predicted by using Poiseuille and Darcy equations:
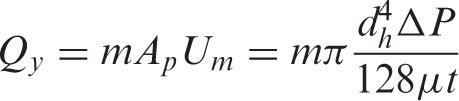
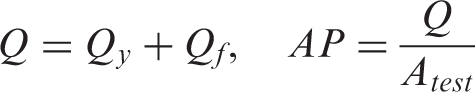
Due to the fact that the air permeability was mostly related to air flow rate passing in the perpendicular direction to the fabric plane, the flow rate through the warp and weft yarns in a unit pore cell were calculated by using Equation (16) for the inter-fiber flow regions shown in Figure 3. The length of the pore (L) was assumed to be equal to the yarn diameter for the flow that took place through only warp and weft yarns; on the other hand, it was assumed to be equal to fabric thickness at intersecting regions. The result of through-plane flow at the cross-over region would be smaller than the other regions, depending on pore length. The total flow rate that occurred in the intra-yarn region at the unit fabric area was calculated by Equation (17). Consequently, the total flow rate (Q) occurring perpendicular to the fabric plane was calculated from the sum of flow rates that took place through inter-yarn and inter-fiber regions. The predicted air permeability (AP) was obtained from the ratio of total flow rate (Q) to the tested fabric area (20 cm2) in Equation (18):

Prediction of in-plane permeability
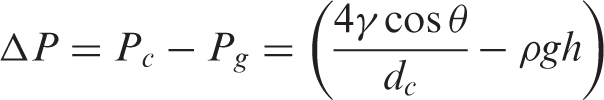
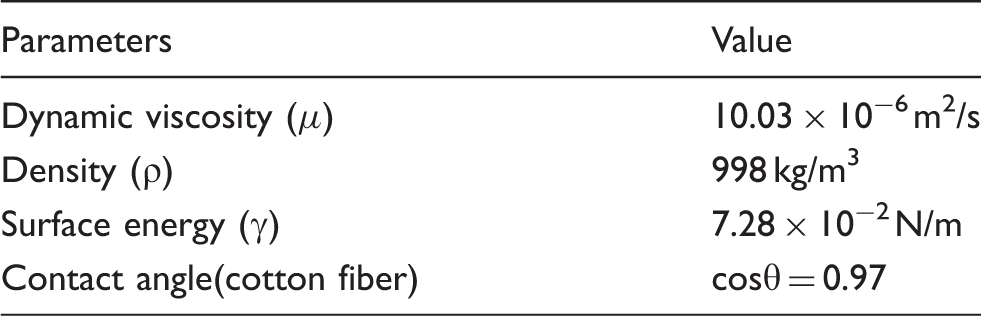
The capillary flow mechanism in the inter-yarn and inter-fiber regions was modeled by capillary theory, depending on fabric structure in order to predict the in-plane flow behavior of fabric theoretically. The flow velocity (Um = dh/dt) occurring in a circular capillary tube (dc) was a function of pressure differences (Equation (19)). The effective forces during the capillary flow occurring in the vertical direction were capillary forces that affected forward and gravity forces that affected down. Accordingly, the pressure difference (ΔP) during the capillary flow at a straight capillary tube was defined by Equation (20). In this equation, capillary pressure (Pc) was a function of capillary diameter (dc), the contact angle between the fluid surface and the fiber (θ) and the surface energy of the fluid (γ). The gravitational pressure (Pg) depended on the height of the fluid, acceleration of gravity (g) and the density of the fluid (ρ). The capillary rise of the fluid according to time, namely flow velocity (dh/dt), was defined by Equation (21) from these two equations for the capillary flow occurring in the vertical direction. At the equilibrium condition in which the capillary force was equal to gravity, the maximum capillary rise was reached (Equation (22)):

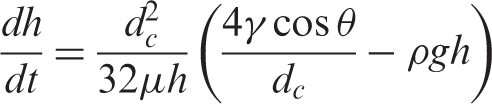

The capillary mechanism of a fluid in the fabric was more complex than the capillary flow occurring in a straight tube, because the fabric system had a 3D complex structure and the flow in this structure occurred depending on both inter-yarn and inter-fiber pore regions. Due to the fact that the inter-yarn and inter-fiber regions were in contact with each other, modeling of the flow mechanism became more difficult. For this reason, in-plane flow occurring in inter-yarn and intra-yarn regions was first defined separately according to capillary theory; the capillary rise value of the fabric system was then evaluated by these two mechanisms. Equation (21) was solved by using MATLAB® software and the capillary rise height (h) according to time (t) was obtained for inter-yarn and intra-yarn regions. In the study, vertical wicking tests were realized within a time period of 300 seconds; thus, the velocity of capillary rise (dh/dt) was defined for this time period.
In the fabric structure, the inter-yarn pore regions were formed by different intersecting of warp and weft yarns (Figure 4(b)) so the fabric system had a more complex capillary mechanism than a straight tube. The capillary diameter that was effective for in-plane flow for the inter-yarn region was related to the cross-sectional structure of the fabric. The inter-yarn capillary structure of the fabric changed depending on the intersecting order, while the fabric was considered in a rectangular prism. However, the change of capillary diameter was neglected in the study and the constant capillary diameter value calculated by Equation (8) was used. This is a basic approach to predicting the equivalent capillary diameter of the inter-yarn region at which the surface properties of the yarn were omitted. The volumetric porosity value (PV), determined depending on the structural and geometrical properties of the fabric, was used in order to predict the inter-yarn capillary mechanism occurring in the in-plane direction of the 3D fabric structure. PV was defined by yarn diameters, settings, fabric thickness and weave type. PV contained yarn path and yarn cross-section properties. Therefore, PV was thought to reflect the effect of surface properties. Thus, the velocity of capillary rise (dhy/dt) of the inter-yarn region in the vertical direction was determined in Equation (23) by using a parameter that defined the effect of change in the 3D fabric structure:

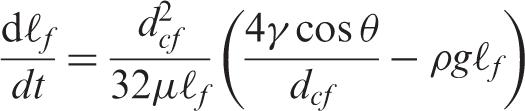
Vertical capillary rise in the yarn was calculated depending on the hydraulic pore diameter of the inter-fiber region by assuming that the inter-fiber pores were equal to each other and that they were continuous. The obtained capillary rise result was found to be equivalent to the rise value that occurred in a straight tube having the same diameter. However, yarn had a defined geometry in the fabric. The shape of the pore along the pore was named “tortuosity” (τ). In this study, the tortuosity of the intra-yarn pore system was defined as a function of 3D yarn geometry. The tortuosity (τ) of the intra-yarn capillary was accepted to be equal to the crimp factor (k) of the yarn for the yarn geometry defined by structural and geometrical parameters of fabric (Figure 4(c)). The theoretically obtained capillary wicking rise was calculated depending on un-crimp yarn length (ℓ
f
) (Equation (24)), and the function of intra-yarn capillary height (hf) depending on time (the capillary rise velocity) was then modified by using the crimp factor (k) in Equation (25):

In the 3D fabric system formed by different intersectings of warp and weft yarns, the inter-yarn and inter-fiber capillary regions did not follow a straight path. During the vertical capillary flow, the yarn at the opposite direction caused change at the capillary geometry; in addition, the fluid transferred to the inter-fiber pore regions of the opposite yarn at the contact condition of the fluid and flow slowed down at those regions. In this study, this state, which made the capillary flow mechanism more complex, was neglected and the velocity of the vertical capillary rise was solved for inter-yarn and inter-fiber regions, separately. In the fabric, the inter-yarn and inter-fiber pore regions influenced the flow mechanism of one another because they were in contact with each other. In order to model the change of flow velocity as a result of this interaction, the integrated capillary flow velocity of the fabric was obtained by averaging the capillary rise height of the inter-yarn and inter-fiber regions as a function of time (Equation (26)):

Experimental study
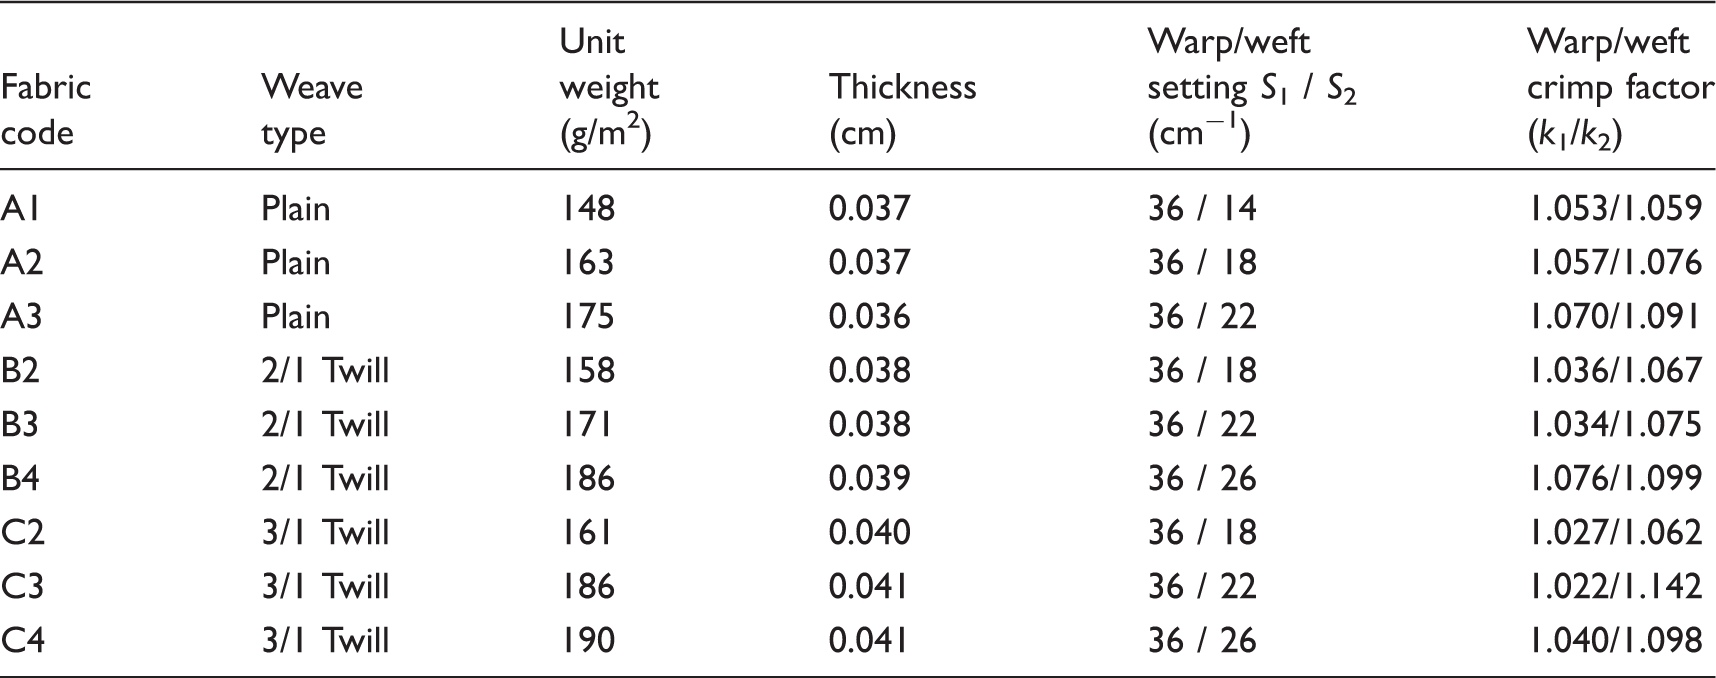
Structural properties of fabrics
The air permeability test and vertical wicking test were made in order to determine the permeability properties of fabric experimentally and to compare the results with estimated permeability results. The air permeability test carried out in order to determine the flow at the through-plane direction of the fabric was tested by using a Textest Air Permeability Tester FX 3300 Labotester III; 30 samples were tested for each fabric type. Air permeability of fabric was tested according to TS 391 EN ISO 9237. 29 Vertical capillary rise tests were carried out in both warp and weft directions in order to determine the flow mechanism of the fabric in the in-plane direction according to the DIN 53924 standard. 30 A diluted (0.01 M) potassium chromate aqueous solution was used for tracking the movement of the water. The vertical wicking height values of the liquid were measured onto a ruler placed parallel to the fabric specimen at regular time intervals in 5 minutes. For each fabric type, five repeats were done for warp and weft directions and the obtained results were evaluated by using Minitab 14 statistical software.
The cross-sectional images of fabric were obtained by using the frozen section technique in order to determine the structural properties of yarn in detail. The yarn and fiber properties were measured on obtained images by using the Stereo Investigator® program. The reason for preferring the Stereo Investigator® program was that it allowed one to measure linear and areal measurements. In this method, the area of a close curve was calculated by using the distance of these points after determining the coordinates of each point on the contour. In this study, yarn area, the area of each fiber in the yarn and the number of fibers in the yarn, was obtained by the Stereo Investigator® program in order to determine the inter-fiber porosity experimentally by using the images of the yarn cross-section. The test group used for the investigation of inter-fiber porosity consisted of 50 samples of yarns that contained a minimum of one image in the warp and weft directions of each fabric type. After the areal measurements were done, the first packing ratio of yarn was determined for each yarn by the ratio of total fiber area to the total yarn area (
Results and discussion
Permeability test results
Air permeability test results of fabrics

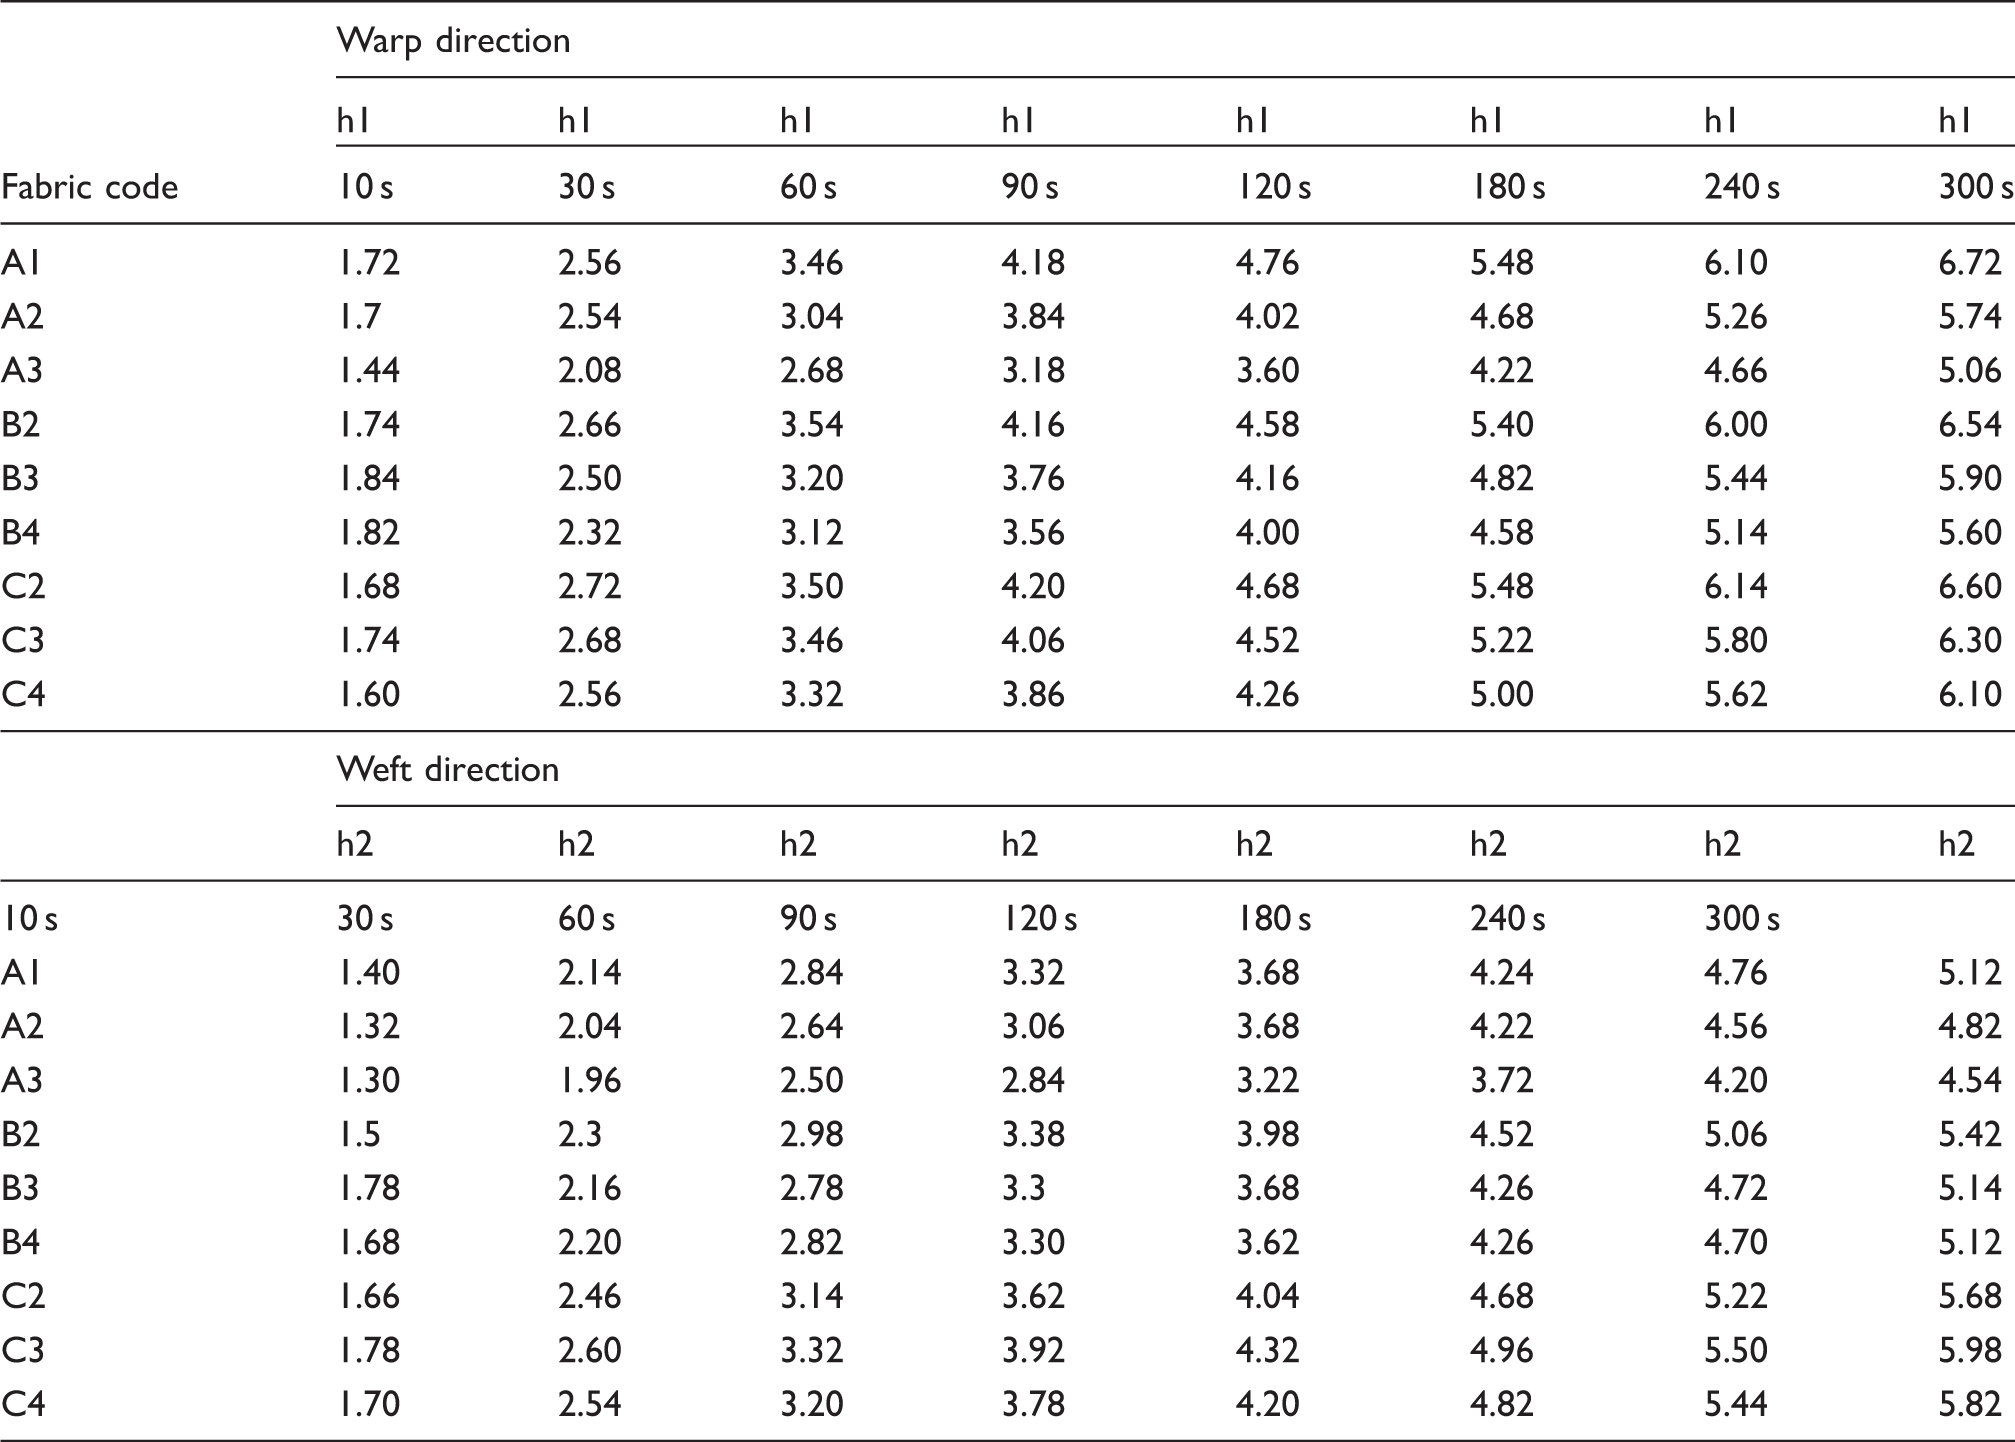
Vertical wicking test results in warp and weft directions
The calculated results of pore properties for in-plane and through-plane flows
Inter-yarn pore properties of two-dimensional and three-dimensional models, and equivalent pore size of intra-yarn regions
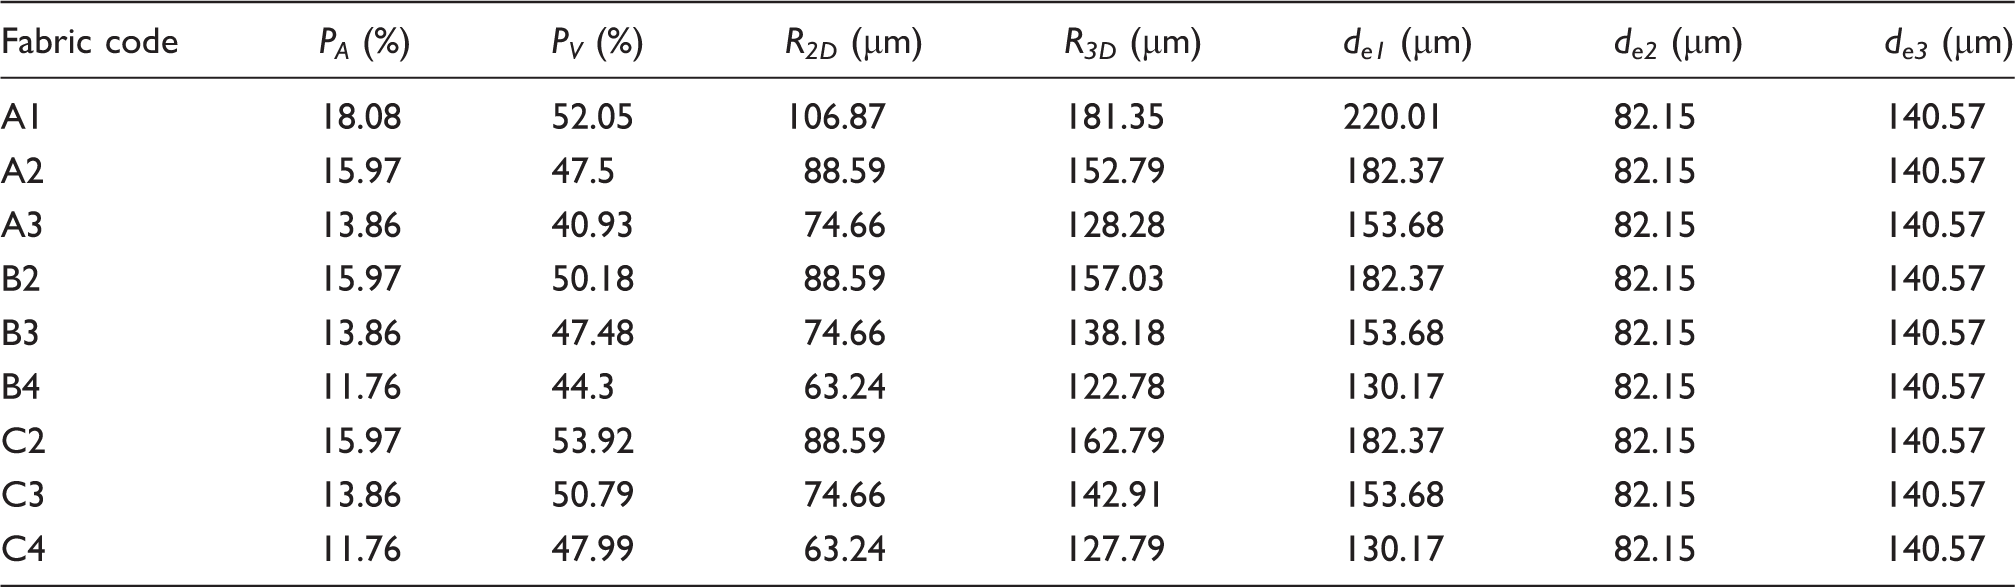
Pore size was one of the most important pore parameters, which was effective at permeability properties. It was known that the pore size and shape of the fabric changed because of the non-homogeneous structural parameters of fabric and the deformations that occurred during flow. However, in this study pore size distribution of fabric was neglected. In the beginning of the study, yarn diameters and spacings of the fabric samples were measured by using surface images of the fabrics and the pore sizes of the fabric samples were calculated according to measured parameters in order to get information about the pore size distribution experimentally. When the pore size results calculated by measured and theoretical parameters were compared, it was observed that the theoretically calculated pore size values were in the range of 95% confidence level of the experimental ones. For these reasons, it was decided to use theoretically calculated pore size results in order to simplify the approach.
When investigating the effect of different weft settings on the porosity, it was observed that the increase of setting caused decrease in the porosity of 2D and 3D models. The pore properties of fabrics having different weave types with the same settings were equal (PA plain = PA 2/1 Twill = PA 3/1 Twill). However, it was observed that the permeability results of different weave types were different when air permeability and vertical capillary rise test results were evaluated. This could be explained by the relationship between 3D fabric geometry and 3D flow mechanism. The yarn movement, which defined the pore shape, affected fabric permeability because of both friction properties and the total yarn volume in the prism. In the study, the air permeability test results of plain fabrics were found to be less than twill fabrics. Likewise, the vertical capillary rise results showed that the fluid flow was less in plain woven fabric having the same parameters. This was due to the pore distribution in the weave type. Intersecting regions in the weave unit increased the amount of yarn, which caused both the decrease in volumetric porosity and the increase in friction surface with which the fluid would contact. In contrast, twill weaves, having long floating sections, were observed to have higher permeability because they contain the Type 4 unit pore cell, which had the most pore volume, as can be seen in the 3/1 twill fabric results.
The correlation coefficients between air permeability and average inter-yarn pore sizes calculated from 2D and 3D unit pore cell models were found to be 0.888 and 0.951, respectively. In the theoretical calculations of 2D and 3D unit pore cell models, the structural properties of pore (pore shape and pore size) were assumed as being homogeneous in order to simplify the fabric structure. However, in real fabrics pore shape and size changed along the fabric because of the non-homogenous structural parameters, including yarn diameter, settings, fabric thickness, etc., and because of the deformation that occurred during the transfer.
Not only the inter-yarn pore properties but also the inter-fiber pore properties played a big role in the in-plane and through-plane flow mechanism. The intra-yarn porosity (Py) was determined by Stereo Investigator® measurements and it was defined as 36.18%.
In the study, the size of pores in inter-fiber regions were calculated depending on fiber diameter and the packing ratio of yarn in order to predict the total permeability of fabric in the in-plane direction by calculating the flow mechanism carried out along the yarn. Accordingly, the inter-fiber pore diameter was found to be 7.8 µm and the hydraulic pore diameter, which was used to predict the inter-fiber flow, was calculated as 7.54 µm.
Predicted permeability results
Through-plane permeability (air permeability)
Experimental and theoretical air permeability results

2D: two-dimensional, 3D: three-dimensional
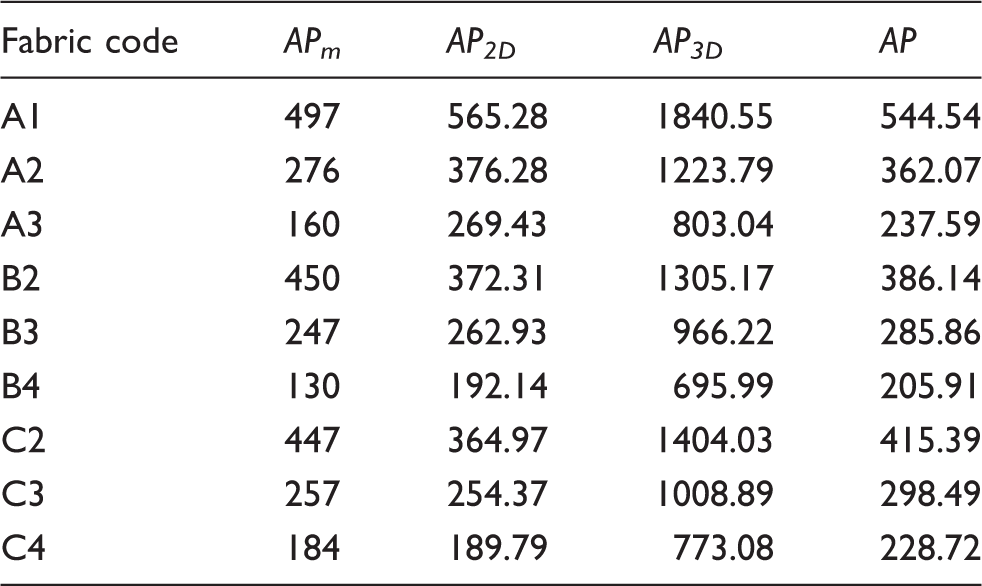
When the relationship between the predicted air permeability results calculated by the total flow rate that occurred through-plane direction in the fabric and air permeability test results was investigated statistically, the correlation coefficient was found to be higher and statistically significant. The correlation coefficients between the predicted air permeability data calculated from 2D and 3D unit pore models were found 0.859 and 0.940, respectively.
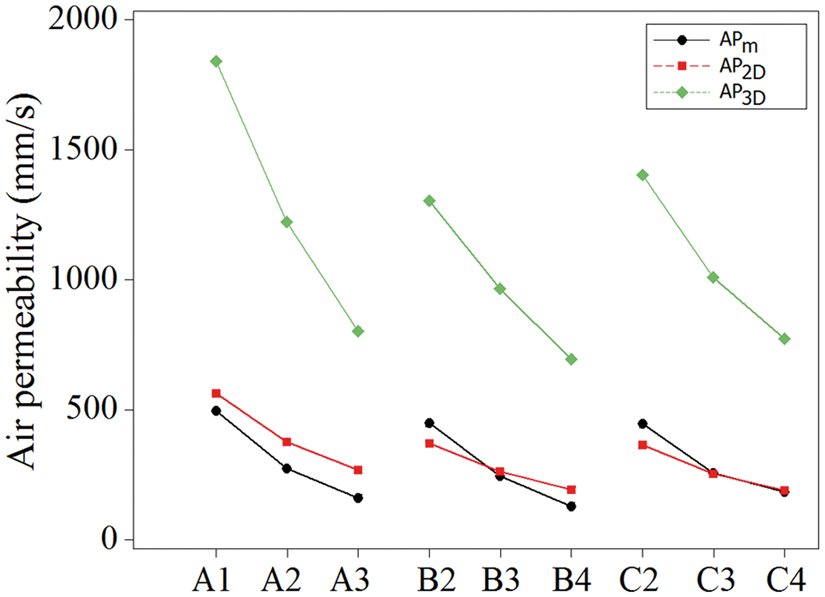
In Figure 6 the relationship between total air permeability values predicted with 2D and 3D models for inter-yarn regions and test results (AP) is shown. The results of the 2D model were close to test results. The air permeability results predicted from the 3D model were higher than the real values, because the inter-yarn pore size calculated according to volumetric approach was large. In the 3D model, the contribution of not only the inter-yarn pore regions but also the other regions into the pore cell (the regions between the yarn surfaces and prism surfaces) was considered depending on the yarn geometry. In the study, when the air permeability test results of fabrics having different weave types were investigated statistically, it was found that the difference between air permeability of different weave types having the same structural parameters was generally significant. Namely, weave type affected permeability properties. However, the differences between weave types could not be explained when the projections of intersection types were investigated in 2D geometrical models. For this reason, predicted air permeability results of fabrics having the same structural parameters and different weave types were calculated as similar by the 2D model. This situation presented the validity of the 3D model. Since the flow was a 3D mechanism, it was affected by the shape and properties of 3D fabric geometry. However, an improvement was needed in the model due to the fact that the results obtained from the 3D model were higher. For this purpose, a revision was made for the predicted permeability results of the 3D model by defining a shape function. The 3D fabric model had the same number of inter-yarn pores as the 2D model. The suggested shape function was defined by the square of the ratio of the 3D average pore size to the 2D average pore size in Equation (28) in order to improve the flow results obtained from the 3D model. In the calculation of flow rate, both the 2D and 3D geometrical approaches were thought to be important. Therefore, the shape factor was used in order to reflect the effect of both models’ outputs together. The predicted air permeability results of the revised 3D unit pore cell model are summarized in Table 6:
The relationship between predicted total air permeability results of models (AP2D, AP3D) and measured (APm) results. Measured, predicted and revised air permeability results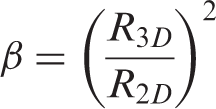
When the relationship between the predicted air permeability results revised from the 3D model and the test results was investigated, the correlation coefficient was found to be 0.94. As a result, the improved predicted air permeability results were close to the real results and the relationship between them was significant at the 99% confidence level. The improvement applied to the model was useful in the prediction of air permeability of fabrics having different structures, because 3D models had the ability to define the difference between different weave types (Figure 7). The difference between the predicted air permeability values and experimental ones were approximately within the ±14% range for the 3D unit pore model. The difference between the measured and predicted results could be explained by the variation of yarn diameter, yarn spacing and fabric thickness parameters along the length and thickness directions. Besides, the difference between the predicted and experimental results was evaluated as being within acceptable limits due to the fact that deformations could occur in the fabric structure when pressure is applied.
The relationship between the revised predicted air permeability of 3D model (AP) and tested (APm) results.
Prediction of in-plane flow
Properties of drilled water at 20℃
The capillary diameters of inter-yarn pore regions in the warp and weft directions

The capillary rise results of the fabric system
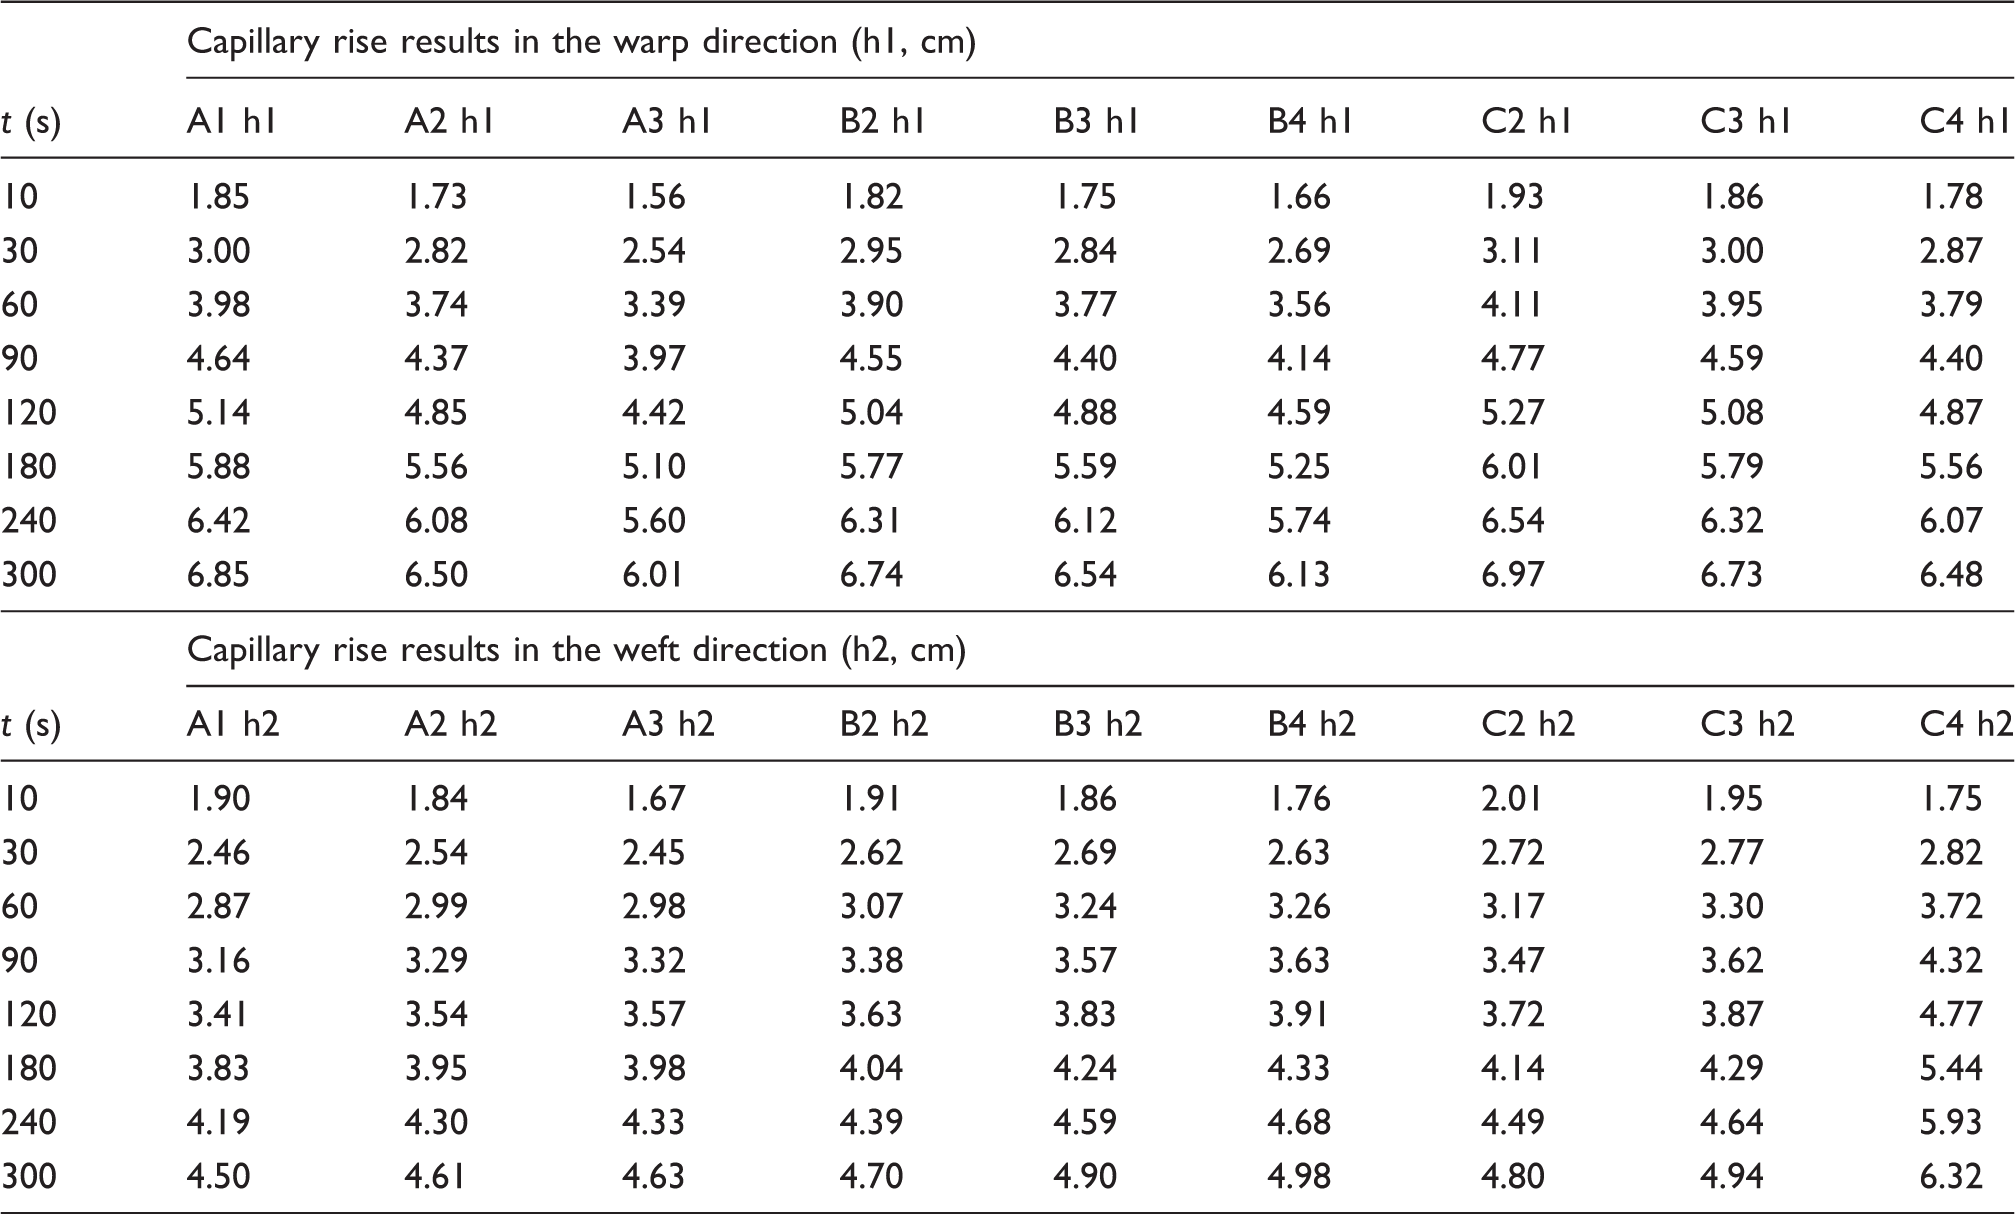
When the relationship between the theoretical capillary rise height results depending on time and the experimental results were investigated statistically for each fabric type, the relationship was found to be significant at the 99% confidence level. The correlation coefficient between predicted and experimental results was 0.977.
In Figure 8, the predicted inter-yarn and inter-fiber capillary rise results obtained from theoretical calculations, experimental results and the integrated predicted capillary rise results for warp and weft directions of the plain (A2), 2/1 twill (B2) and 3/1 twill (C2) fabrics having 18 cm−1 weft setting were shown. In the figure, the black dashed line indicated capillary flow mechanism obtained by capillary diameter calculated for inter-yarn region. The inter-yarn capillary behavior calculated by considering the volumetric porosity calculated from 3D fabric geometry was indicated with blue line. Pink line indicated inter-fiber capillary rise mechanism calculated depending on yarn crimp factors and green one indicated the experimental results obtained from capillary rise test. Red line indicated the integrated capillary rise results calculated according to the flows occurring inter-yarn and inter-fiber regions. As seen in Figure 8, the inter-yarn capillary wicking height, which was calculated without volumetric porosity of the fabric system, was higher. However, the flow that occurred in the fabric was a function of structural and geometrical parameters of the fabric. The inter-yarn flow rate calculated by considering the volumetric porosity of fabric was important, because it reflected the variation of fabric depending on structural properties. When the relationship between experimental and theoretical results was examined, it was found to be significant. When the integrated capillary wicking behavior calculated with the average of inter-yarn and inter-fiber capillary rise results was investigated, it was observed that the predicted and experimental results were close to each other in the warp direction. In the weft direction, inter-fiber regions played a significant role at the transfer of the liquid, because the capillary diameter was larger: the inter-yarn regions behaved like a reservoir for the continuousness of the flow. When the graphics were investigated, it was observed that the slope of the predicted velocity of the vertical capillary rise (dh/dt) showed greater similarity with the experimental one in the time.
The theoretical and measured capillary rise results of plain (A), 2/1 twill (B) and 3/1 twill (C) fabrics at 18cm−1 weft setting.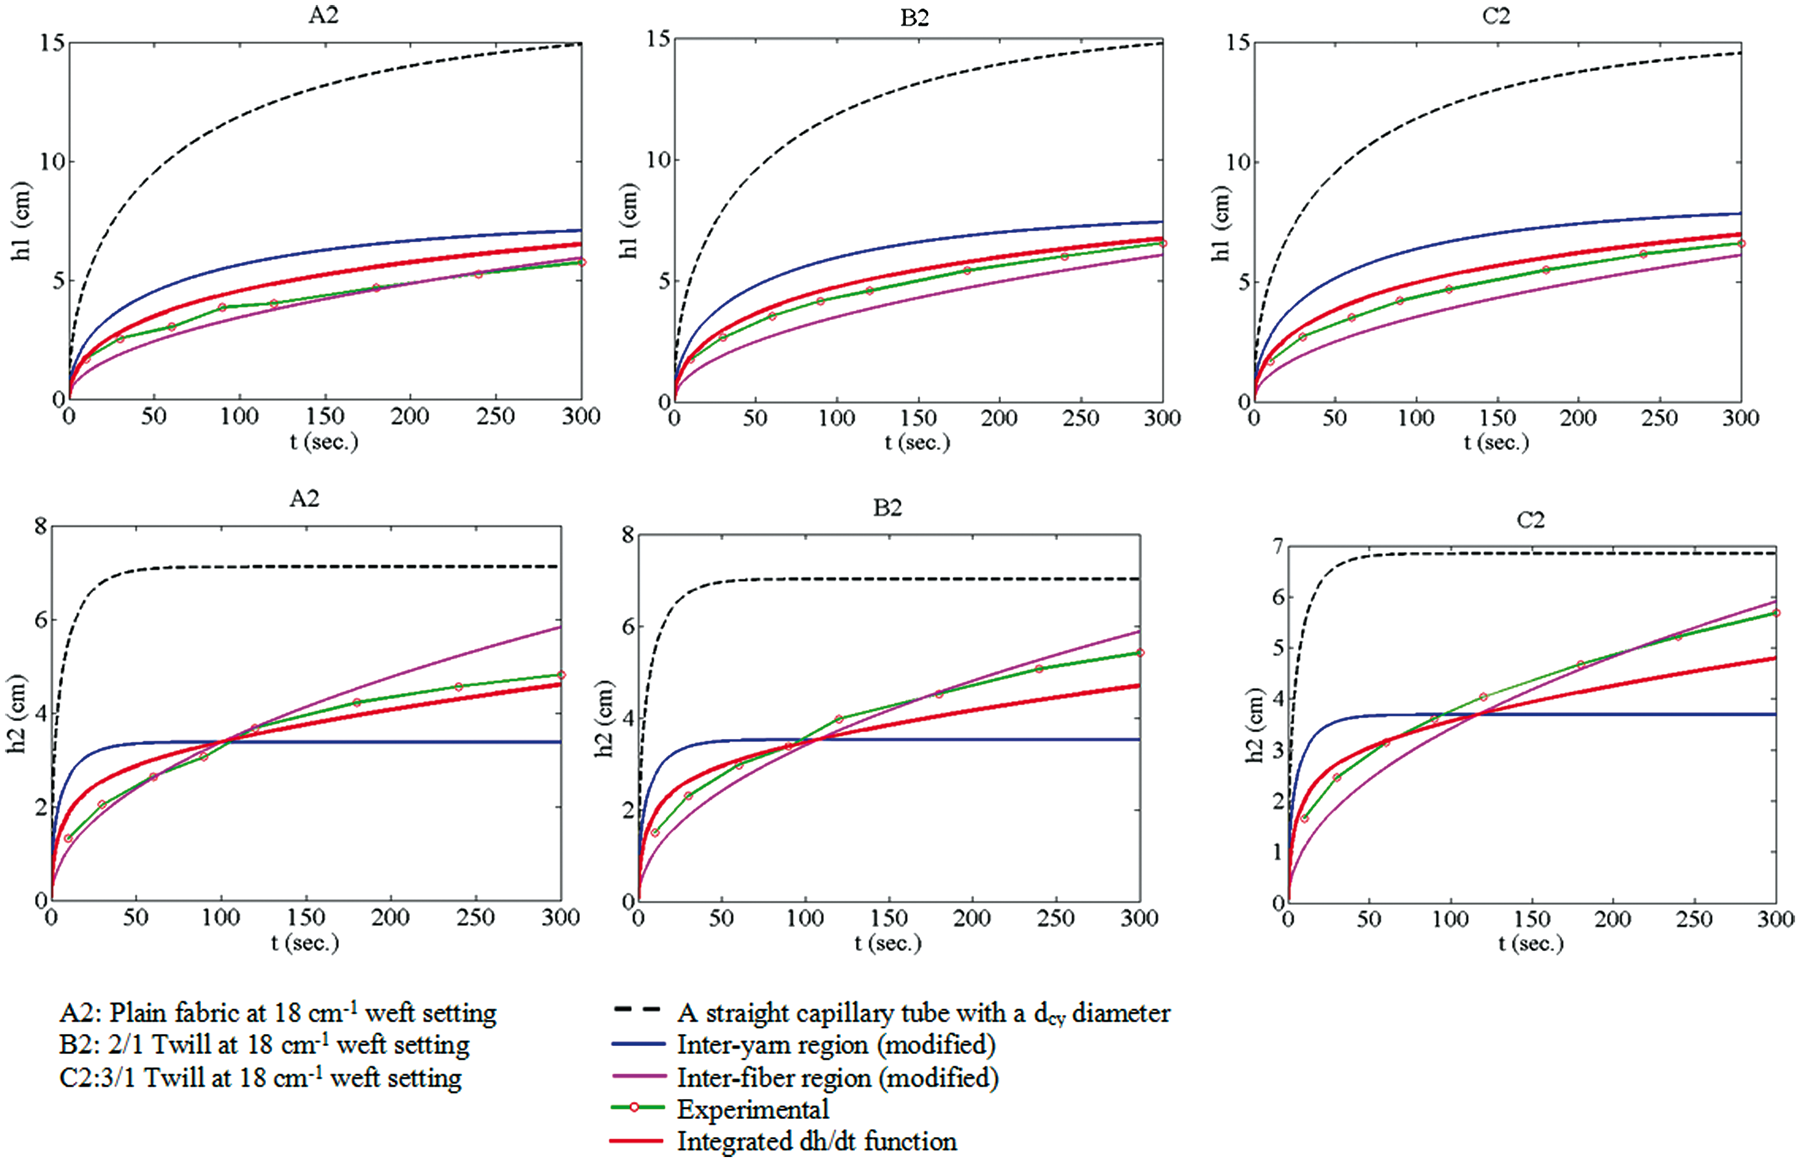
The relationships between the theoretically calculated capillary flow behaviors of fabrics having different weave types and the same yarn count and settings are shown in Figure 9 for the warp and weft directions. The theoretical and experimental results showed the same tendency. In the same settings, the maximum capillary rise height (C) and so the flow velocity (dh/dt) are shown in 3/1 twill fabric, which had the higher porosity. The lowest was the plain weave (A), which had the minimum volumetric porosity because of repeating intersecting. Both the theoretical and experimental results of fabrics having the same weave type within different weft settings demonstrated that the flow velocity decreased with the increase of setting, as seen in Figure 10.
The theoretical capillary rise velocity results of tested fabrics having different weave types at same settings for both warp and weft directions. (A:plain, B:2/1 twill, C:3/1 twill). The comparison of theoretical and measured capillary rise results of fabrics in warp direction according to settings (A:plain, B:2/1 twill, C:3/1 twill).

While the capillary rise function obtained from experimental data and the data calculated theoretically for inter-yarn and inter-fiber regions were investigated, it was observed that the experimental results showed a similarity to the flow of inter-fiber regions, particularly in the weft direction. In liquid transfer, it is known that the inter-fiber porous regions supported the movement of the flow with the provided capillary pressure. As seen in the graphics, the capillary rise showed a similar behavior to the inter-yarn capillary region at the first contact times with the liquid and later slope looked like the predicted flow behavior of the inter-fiber region. Consequently, the liquid first filled the inter-yarn regions that had large pores when the time of the transfer in that regions slowed down and the inter-fiber regions affected the transfer of the liquid.
In this model study, the error sources could be summarized as being homogenized fabric and yarn structures in which the variation of pore properties was neglected. In addition, the interactions between inter-yarn and inter-fiber regions and the deformations during the flow mechanism were also neglected. Using these assumptions, the 3D fabric structure and flow mechanism were simplified. All of these assumptions would cause error; however, the relationship between predicted in-plane and through-plane flow results and experimental ones was found to be significant.
Conclusion
In this study, the permeability results of fabrics carried out in through-plane and in-plane directions were predicted by defining the inter-yarn and inter-fiber pore properties of these two directions separately. The air permeability of fabric was generally the result of flow occurring through the perpendicular direction of the fabric plane. The predicted air permeability of fabric was obtained from the total flow rate that occurred in the through-plane direction at the inter-yarn and inter-fiber regions of the unit pore cell. When the total air permeability data predicted from 2D and 3D models were investigated, it was observed that the results obtained from the 2D model were insufficient to present the differences of different weave types, in spite of the fact that the relationship between the porosity results of the 2D unit pore cell model and air permeability test results were significant statistically. Because flow was a mechanism carried out in the 3D model, it was affected by the shape and properties of 3D fabric geometry. Therefore, the air permeability results predicted from the 3D model had a higher correlation coefficient with real air permeability and it reflected the variation among different weave types. The air permeability results of the 3D model was found to be higher than the experimental results because of the larger pore diameter obtained from this model. By taking these findings into consideration, a shape factor was defined by the relationship between pore diameters obtained from the 2D and 3D models, and predicted air permeability results of the 3D model were improved. It was observed that the obtained results were close to the experimental ones.
The in-plane flow results of fabric were first calculated for inter-yarn and inter-fiber regions separately, depending on capillary theory. When predicting inter-yarn capillary rise, the volumetric porosity of the fabric was used as an input parameter in order to reflect the variation of capillary diameter (due to the yarn geometry) and the effect of weave type on the theoretical results. The crimp factor of the yarn formed depending on 3D fabric geometry was considered while predicting the flow that occurred intra-yarn. The capillary rise behavior that emerged as a result of capillary wicking of these two regions was evaluated as the average of these two regions, and the integrated capillary behavior of fabric was predicted. Consequently, the obtained predicted capillary rise results showed higher correlation coefficients with the test results.
The main error source encountered in theoretical studies was that yarn and fabric were assumed to be a homogeneous structure. Therefore, further researches will be aimed at making studies that consider the variation of yarn structure in 3D fabric models. In further studies, the model will be improved by taking into consideration the pore size distribution. In addition, the effects of different structural parameters on the permeability of fabric, particularly raw material, are planned to be investigated by a detailed experimental study.
Footnotes
Funding
This research received no specific grant from any funding agency in the public, commercial or not-for-profit sectors.