
Abstract
A direct measurement method using an air-pack-type pressure sensor has been used widely to obtain clothing pressure, but this method still has many limitations. For instance, it gives only pointwise information and is inherently inconvenient and error-prone. Therefore, we suggest an indirect method for measuring the clothing pressure of various positions at once without touching the subject by using three-dimensional (3D) deformations of a reference shape (i.e., a circle grid) printed on clothing. The clothing pressure can be obtained with a simple analysis of tensile stress and the curvature data extracted from the 3D deformation of circle grids on the clothing surface. Specifically, the tensile stress of the fabric was obtained from a tensile tester and the direction of the principal stress and the radius of curvature in the principal direction were measured from 3D imaging data to obtain an accurate value. The clothing pressure from the indirect method was verified by comparing the results from direct pressure measurements using an air-pack-type pressure sensor. The indirect method was found to successfully estimate the clothing pressure.
Keywords
Clothing pressure is closely associated with the comfort or function of a garment, and it is an essential factor of tight-fitting clothing such as compensatory clothing items for women, sportswear for athletes, and pressure garments for burn patients. Therefore, appropriate clothing pressure is necessary for each type of garment, and it can be an efficient measure for clothing design, particularly for functional garments, because clothing pressure data can indicate a pattern problem or be used to evaluate a design by gauging the appearance as a quantitative numerical value. Because of the diverse somatotypes of the human body and the increasing need for compression garments in various functional clothing, a simple and accurate technology for measuring clothing pressure is necessary.
In general, two methods exist for measuring clothing pressure. One is a direct method using various pressure sensors and the other is an indirect method that predicts clothing pressure by observing the deformation of a textile. The former is very straightforward and simple, but the measured values are incorrect for some cases, particularly on the curved human body, in the pressure range of 1−20 gf/cm2 (0.098−1.961 kPa).
1
Most pressure sensors are neither flexible nor sufficiently thin for precisely measuring the pressure inside clothing. Moreover, the accuracy worsens when a weak force is exerted on a curved area of soft human tissue. Among various pressure sensors, the air-pack-type pressure sensor is relatively accurate and sensitive for very low pressure values.
2
This type of sensor is, however, impractical for observing the distribution of clothing pressure because it is rather expensive and gives only pointwise information. In addition, direct measurements are inconvenient because the sensors are placed at each measurement point under the elastic garment, and this placement evokes discomfort to the wearer during measurements. On the other hand, a non-contact method that involves estimating clothing pressure by measuring the deformation of a textile was suggested by Kirk and Ibrahim;
3
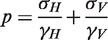
this method was based on the Young–Laplace equation under the assumption that the human body is a combination of cylinders and spheres. Equation (1) shows the equation proposed by Kirk and Ibrahim. They suggested that, in most cases, clothing pressure resulted from the stress imposed by the textile. According to the equation of Kirk and Ibrahim, clothing pressure can be estimated using the stress of a textile and a radius of curvature. The stress of a textile (σ) can be obtained from the corresponding strain in the strain–stress curve of the textile, and the radius of curvature (r) can also be measured using an instrument such as a spherometer. The Kirk and Ibrahim method is reasonable theoretically; however, its range of application for clothing pressure measurement is limited to the horizontal and vertical extended areas, which are scarcely found on the human body. As an example, they mentioned the knee area, assuming that it is a cylindrical shape:
Besides the tensile stress in Equation (1), the shear stress of textiles should also be considered when the textiles are worn. On a clothed human body, the orthogonal grain lines are affected by the complex curvature of the body and the extensibility of the fabrics in various angles. Hence, the tensile force is not always exerted along the grain of fabrics, and the direction of the maximum force deviates from the tensile stress along the grain of fabrics, σ, in Equation (1). In addition, the surface of the human body is neither cylindrical nor spherical; hence, a conventional curvature measurement with simplified assumptions cannot be directly applied to a real human body.
After the original proposal of Kirk and Ibrahim, 3 indirect methods were proposed by many other researchers. 4 Hasegawa and Ishikawa 5 used the dome method in which the garment to be worn is set on the measurement equipment and expanded by air pressure to form a dome shape. Leung et al. 6 suggested a pressure prediction model using the dimensions of the fabric, emphasizing anisotropic and non-linear behaviors of these dimensions; this model increased the accuracy of the measurement. However, some errors still remain in these earlier approaches because the measurements and basic theories did not consider the three-dimensional (3D) effects and fabric deformation when the textiles were worn.
In our previous study, we reported the preliminary results for an indirect measurement of clothing pressure using a girdle, based on 3D measurement techniques. 7 In the present study, improved methodologies were developed using the principal stress and realistic radius of curvature on the upper and lower clothing surface worn over 3D plaster casts of the human body. A more reliable procedure for estimating the clothing pressure was obtained by determining the size of the reference grid where the average curvature should be measured. Thereby, we are able to suggest a more comprehensive indirect method for measuring clothing pressure by considering the deformation of textiles on the various positions of a curved body surface and the corresponding forces exerted on the 3D area of interest.
Experimental methods
Overall procedure
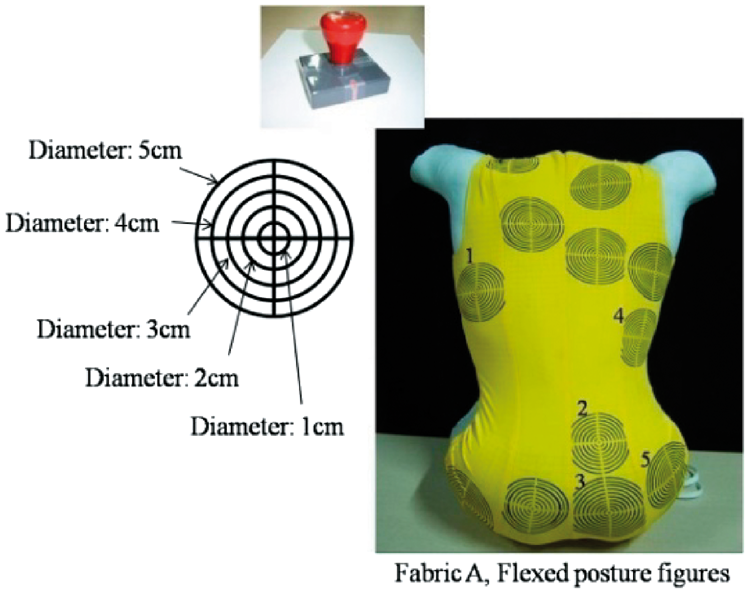
Figure 1 shows the experimental procedure. In order to develop a better measurement scheme, more systematic approaches were used in the present study compared with our previous one. First, we tested various reference grids to determine the appropriate shape and size of a grid for pressure measurement. Since the human body is made of a continuously changing curved surface, selecting a grid of proper shape and size, highly correlated with the curvature in Equation (1), is very important for pressure estimation. As shown in Figure 2, a circle grid was selected as the reference shape. A circle grid can be used to determine tensile stress as well as shear stress, because the shear stress becomes zero along the principal axes (major and minor), whereas other shapes, such as a square grid, cannot be used to determine the direction of force, including shear properties, other than simple tensile force. Herein, the major and minor axes refer to the longest and shortest directions after deformation, respectively, whereas the horizontal and vertical axes are used for the original grid. In fact, Kirk and Ibrahim
3
did not mention any details on how to treat the continuously changing curvature value on the human body and the stress of textiles at the point of interest; therefore, Equation (1) has not yet been used in the prediction of clothing pressure on the human body. In order to utilize Equation (1) for the prediction of clothing pressure, the optimum area of the measurement site should be selected first. It is then possible to determine the appropriate curvature and strain values for the human body. To determine the optimum measurement size for the variables σ and r in Equation (1), circle grids ranging from 1 to 5 cm in diameter were printed on the experimental clothing (A1) and the effect of the grid size was investigated by comparing the estimated clothing pressure with the results from direct measurement. The test was conducted with five plaster casts of different areas of the body that have distinct differences in curvature, as shown in Figure 3. After selecting the appropriate circle size for measuring the radius of curvature, the feasibility of the suggested indirect measurement method was tested using two fabric types (A and B) and clothing sizes of different reduced patterns (A1, A2, A3, A4, B1, B2, and B3); two measurement locations (the upper back and the hip) were selected, and standing and flexed plaster casts of a man’s body were used.
Experimental procedure. Axes of the square grid and circle grid (major and minor axes after extension could be determined in case of the circle grid). Five measurement locations for the determination of the size of the grid circles.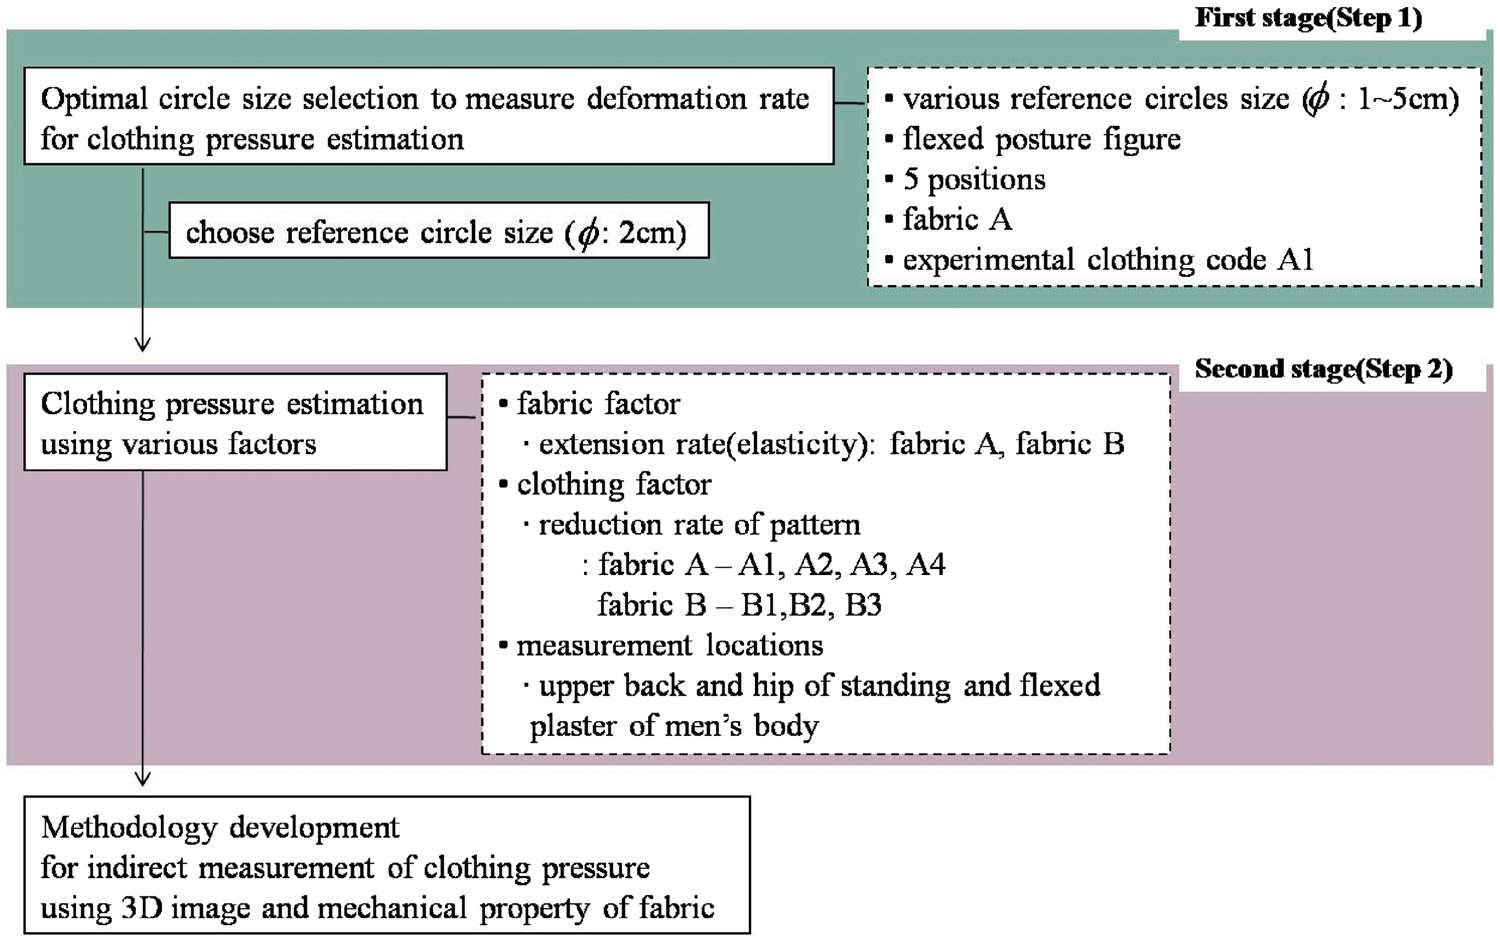

Physical properties of experimental fabrics

Percentage stretch of experimental fabrics using the Ziegert and Keil method. 8

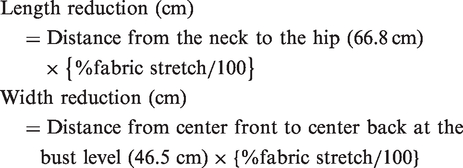
Maximum length of reduction suggested for the experimental fabrics based on percent fabric stretch measured by the Ziegert and Keil method. 8

Various reduction rates of experimental clothing

Grading amount (cm) = maximum length of reduction possible amount × % reduction.
Reduction rates (%) = percentage stretch of experimental fabrics × % reduction.
In addition, plaster molds of two postures, standing and flexed, were used to verify the suggested method. Two representative locations, the upper back and the hip, were selected for clothing pressure estimation, as shown in Figure 4.
Two positions of clothing pressure estimation on the pattern and on the flexed posture.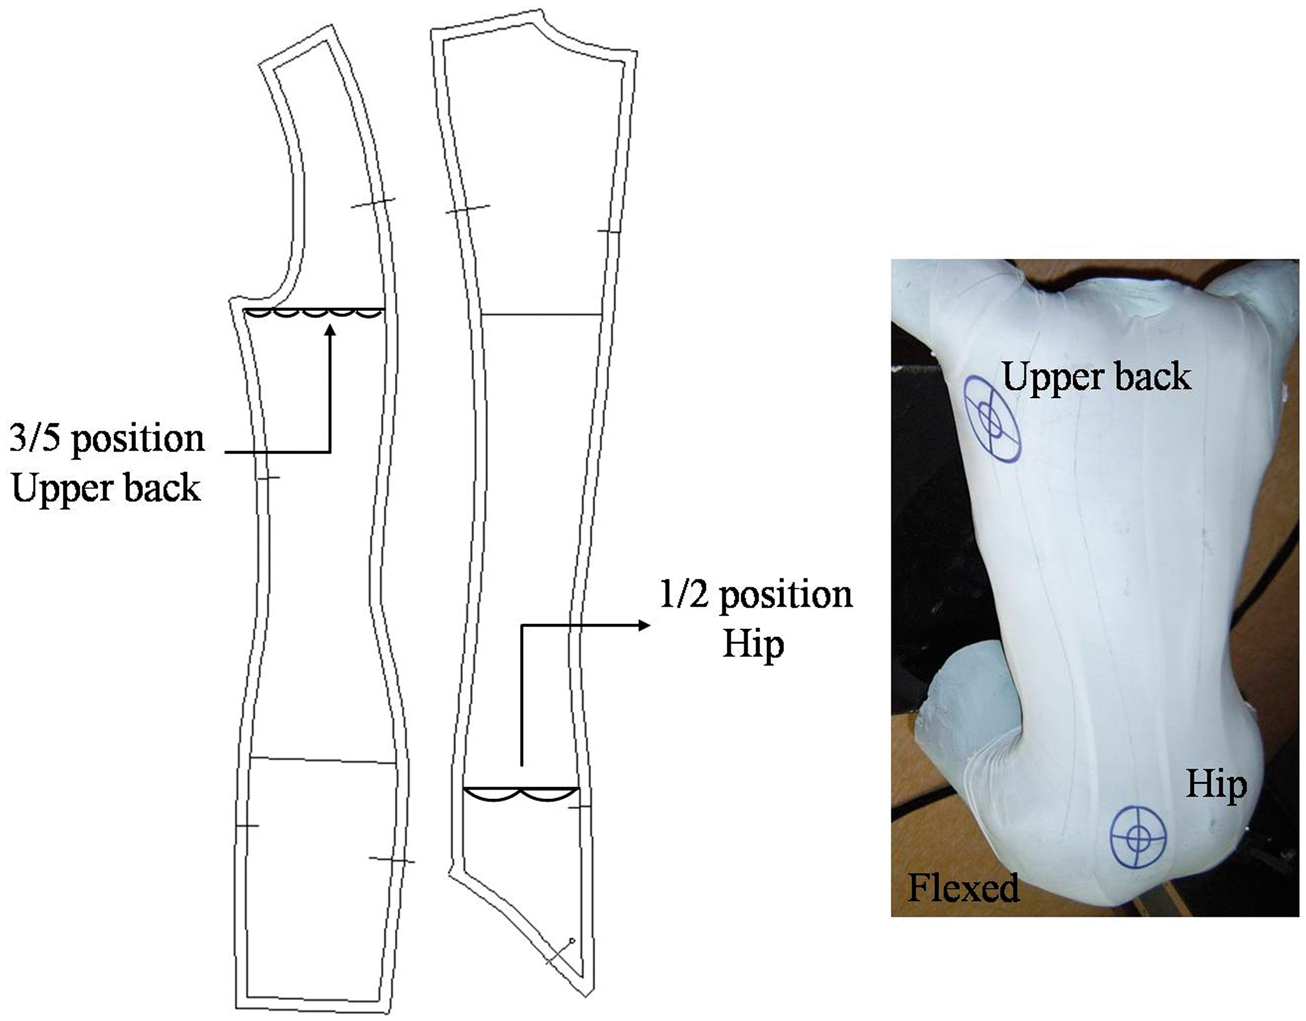
For each measuring location, the circle grid was marked and the deformation of the textile was measured by analyzing the changes in the images of the 3D circle grid. The analysis process was as follows. First, the major and minor principal directions were determined from the 3D information. Subsequently, the angle between the principal line and the orthogonal lines was determined. The increased length and radius of curvature of each direction were extracted using Rapidform® (INUS Technology, Inc., & Rapidform Inc., Korea). Using the strain–stress relation with respect to the angle of the grain and the increased length, we measured the actual tensile stress of the textile from each strain–stress curve. Finally, the clothing pressure was predicted using the newly suggested equation in this study. In order to validate the results, the clothing pressure was measured via a direct method (i.e., using the air-pack-type pressure sensor) at the same location and compared with measurements obtained from the indirect method.
Experimental clothing
A bodysuit was used as an experimental garment because the bodysuit covers both the shoulder and the crotch and prevents the plaster body structure from slipping; otherwise, the exact measurement positioning on the body plaster was impossible because of the differences in the size reduction of the stretchable tricot. The basic 2D block pattern was obtained from the 3D scan data measured using a 3D whole-body scanner via triangle simplification.9,10 Before sewing, the circle grid was marked on the experimental garment. For the first stage (Figure 1), in order to determine the correct size of the grid, the grid was printed at 12 different locations. Among them, five positions were used for determining the grid size, as shown in Figure 3. As the second stage of the experiment, two locations were selected for the experiment to validate the suggested method of indirect pressure measurement. For every experimental garment, a side zipper was used for convenient doffing and donning.
Measurement of tensile stress
In this experiment, accurate measurement of the grid on the 3D body plaster and the calculation of the principal stress and principal direction of the deformed grid circles are important for the correct estimation of the clothing pressure. Therefore, tensile strain–stress data were obtained via the careful fundamental experiments by increasing the angle of the specimen’s grain from 0° to 90° at 10° intervals (Figure 5). The details of the fundamental experiments can be found elsewhere.
7
Tensile stress–strain curves of fabrics A and B with various mounting angles between the jaw.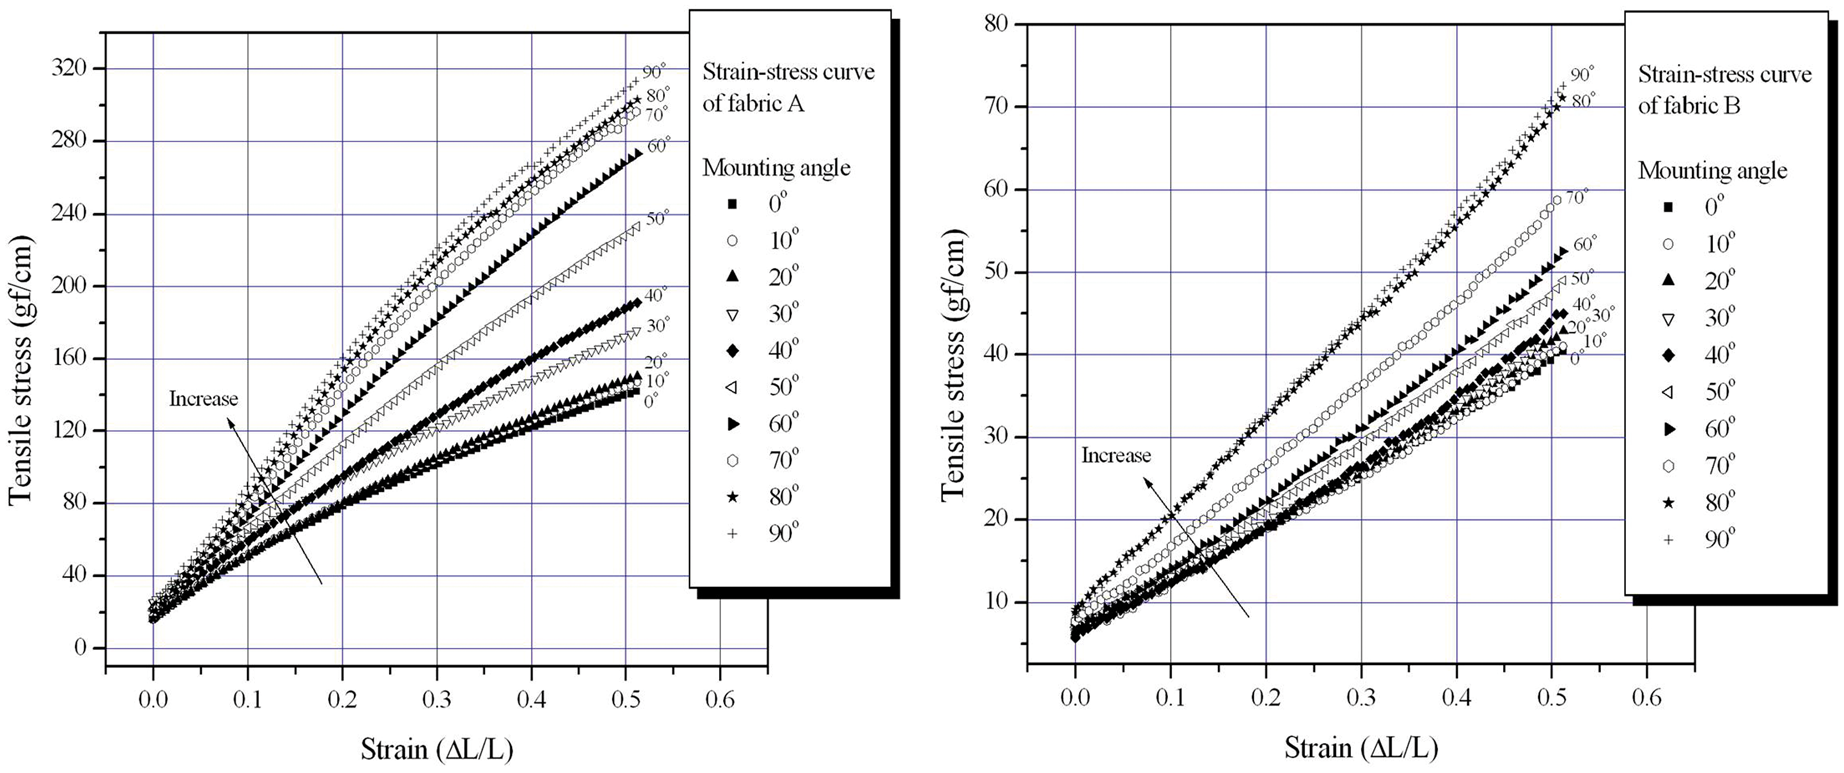
Three-dimensional scanning for measuring radius of curvature
To analyze the deformation of the grid circle accurately, a high-resolution 3D scanner (Opto-Top HE color Breuckmann, Steinbichler Inc., Germany) was used to scan the bodysuit over the plaster. The 3D scanner was equipped with a 2-megapixel charge-coupled device (1600 × 1200 pixels, white light) with a high accuracy of ±20–70 µm. The average point distance is 240 µm, and the 3D scanner can measure non-cooperative surfaces.
Measurement of deformation of the circle grid and radius of curvature
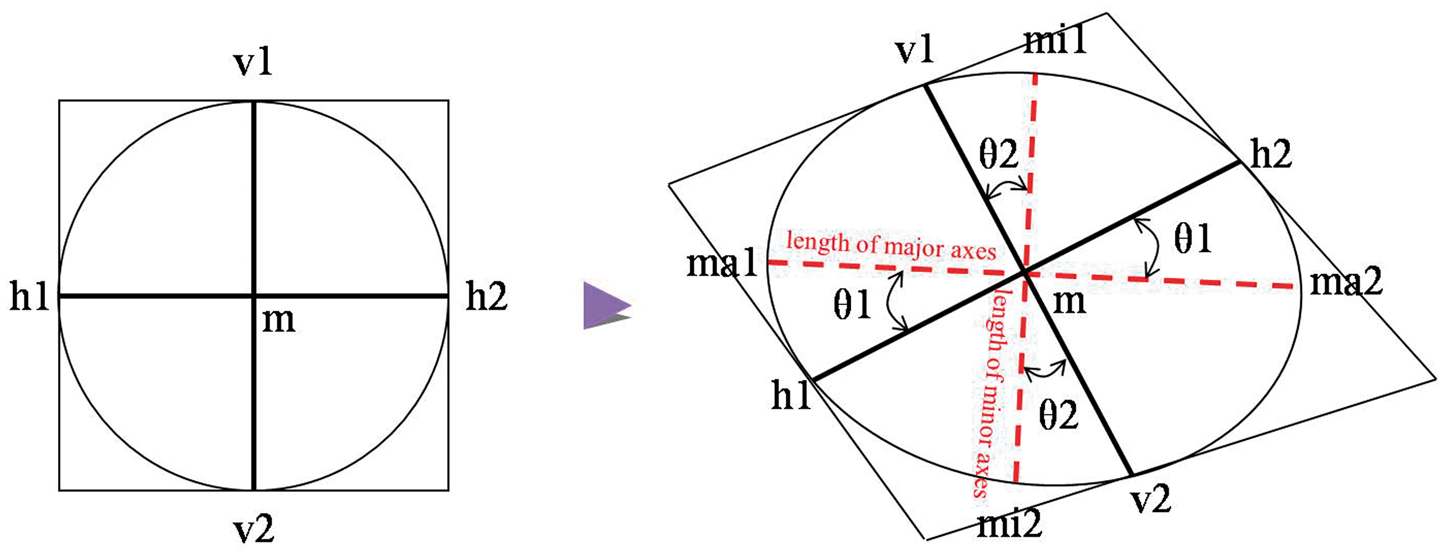
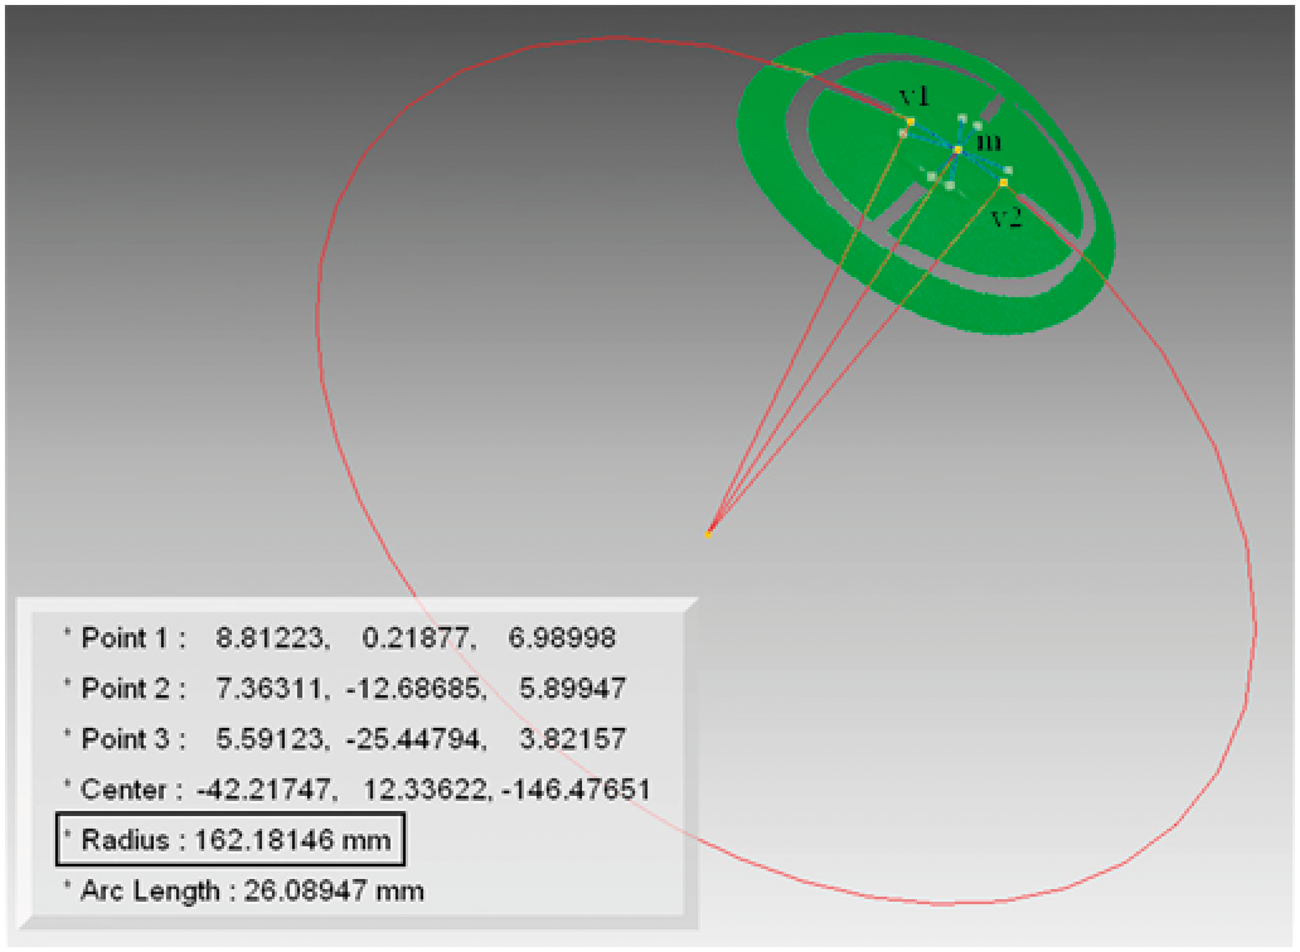
With the aid of a 3D scanning data analysis program, we could detect the horizontal, vertical, major principal, and minor principal deformations and measure the radius of curvature along these axes. Figure 6 shows the detailed process. First, we found nodes of the circle grid (horizontal nodes: h1 and h2, vertical nodes: v1 and v2, and middle node: m) and set base lines (horizontal line: H and vertical line: V) from the nodes. Then, we drew evenly spaced curves and found the major and minor axes, which are the longest and shortest distances, respectively, as shown in Figure 7. In addition, to obtain the parameters in the proposed equation, we needed to determine the deformed angle theta (θ1, θ2) and the extended length on the 3D image of the clothing over the plaster. The measurement of curvature at a point as in the conventional method is not applicable because of the subtle noise on the 3D scanned data, as mentioned in previous studies.11,12 Therefore, we used three points along the principal direction for calculating the radius of curvature (Figure 8).
Steps of searching the horizontal, vertical, major, and minor axes in the deformed reference circle grid. Measurement of the grid circle deformation (deformed angle and length of circle grid). Measurement radius of curvature using three points.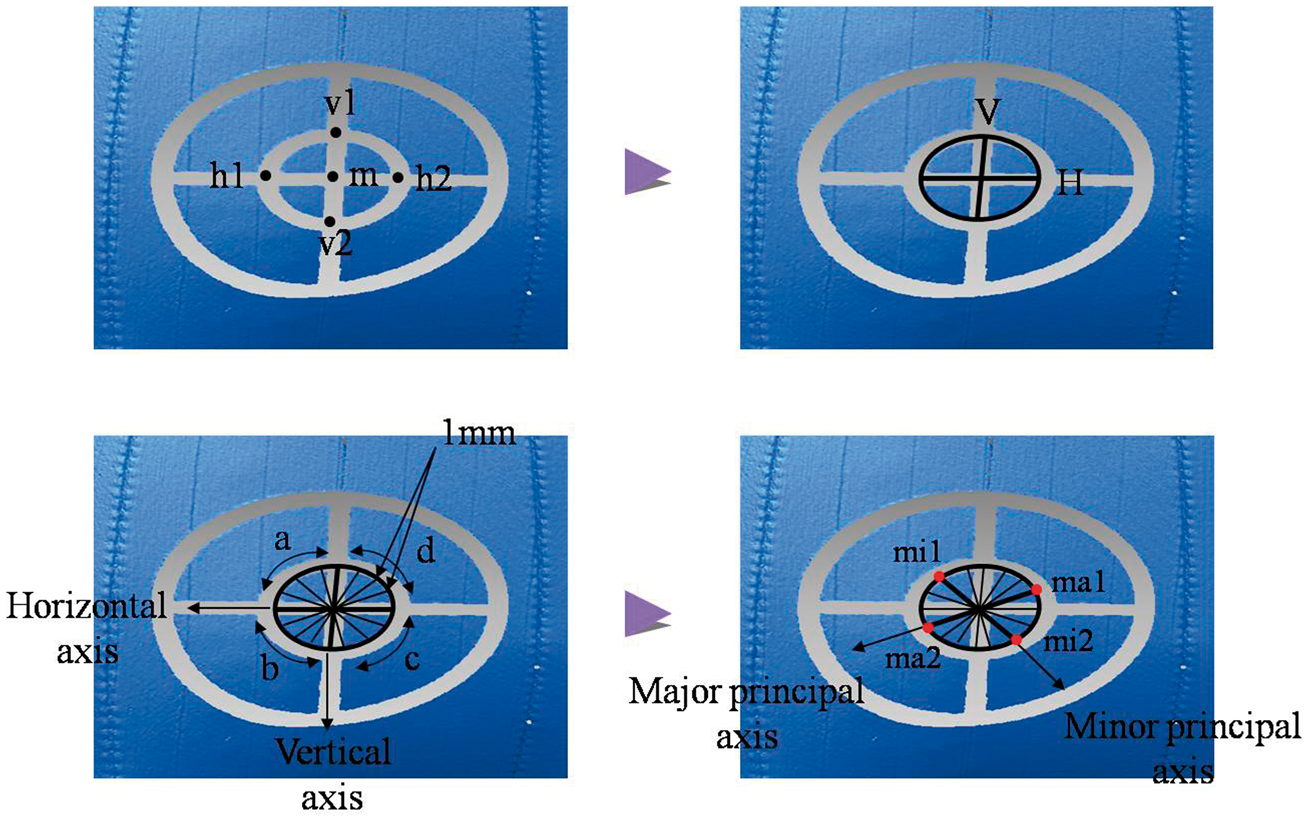
Estimation of clothing pressure
Equation (3) is the prediction equation of clothing pressure suggested in this study. Instead of using the stress and radius of curvature in the horizontal and vertical directions as suggested by Kirk and Ibrahim,
3
the principal stress and radius of curvature along the principal direction were introduced to the newly developed Equation (3) for adopting 3D technology. In this equation, the radius of curvature can be measured directly if we define three points in the software, Rapidform®; however, the stress cannot be obtained directly. Therefore, we have to measure the deformation of the textile material used and obtain the stress from the strain–stress relation of various angles by changing the mounting angle of a specimen, as mentioned previously. Clothing pressure P can be estimated by searching the maximum (major) as well as minimum (minor) principal direction, as indicated in Equation (3). For example, denominator r values were measured using 3D analysis software and numerator σ values were calculated from the regression line of strain–stress curve data at a certain deformed angle θ. The strain value was calculated from the difference between the original grid size and the extended length on the 3D image. The tensile stress was obtained from the strain–stress curve of the corresponding deformed angle and strain, as shown in Figure 9:
The tensile stress from the stress–strain curve of the corresponding theta and strain level.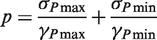

Direct measurement of clothing pressure
In order to validate the estimated clothing pressure, we carried out direct clothing pressure measurements using an air-pack-type pressure sensor (AMI 3037-2, AMI Techno, Co., Ltd). The pressure obtained from the air-pack-type pressure sensor is the average value of the area pressed by the sensor (diameter: 1.5 cm). This sensor has a range from 0 to 300 gf/cm2 (0–29.42 kPa) and guarantees 0.5% accuracy across its full range.
Results and discussions
Selection of optimal circle size for estimating clothing pressure
Estimation of clothing pressure at five locations depending on the reference size and types of axes (case A1)

Note: measured pressure is the mean of three repeats.
Along with the grid size selection, it is worthwhile to access the feasibility of the suggested pressure prediction method (i.e., Equation (3)) by comparing its results with those of the conventional method (i.e., Equation (1)). Table 5 summarizes the comparison of the results of the two different methods, and it clearly shows the efficacy of using major and minor axes instead of the horizontal and vertical direction, as conceptually suggested by Kirk and Ibrahim. 3 As can be seen from Table 5, the values obtained using the major and minor axes of the original 2-cm-diameter grid yielded the closest match to those obtained via direct measurement. When a human wears a garment, the orthogonal grain lines are affected by the complex curvature of the human’s body and the dynamics of the textiles. Hence, in addition to the tensile force exerted along the grain of textiles, the actual tensile force changes with respect to the direction of textile deformation. Therefore, the newly suggested method in this study is more rigorous than that proposed by Kirk and Ibrahim. It is notable that there is little difference between the indirect and direct methods for measuring positions 1, 2, 3, and 4 where the application of the air-pack-type pressure sensor is suitable. For measuring position 5, the results from the indirect method are inconsistent with those of the direct method. Another point worth noting is that when the grid size has not been decided, as in the previous paper of Kirk and Ibrahim, the accurate prediction of clothing pressure is impossible. The range of the predicted pressure is quite large when the diameter of the grid changes from 1 to 5 cm, as shown in Table 5. Adopting 3D technology for the surface analysis of the human body and the deformation of textiles improves the prediction of clothing pressure. This is further understood when a 2-cm-diameter grid is used in the case of clothing worn on plaster casts of the body, where shear stress is involved. When the deformations of the major and minor axes are nearly identical to those of the horizontal and vertical axes, as in the case of positions 2 and 5, the value predicted via the two types of axes is identical.
Figure 5 shows the strain–stress curve of the specimens with increasing mounting angle from the grain at 10° intervals. As shown in the figure, at the same strain, the tensile stress increases as the grain angle increases. This result shows that the tensile stress is influenced by the angle, suggesting corrections considering the principal direction of deformed clothing surface are necessary to ensure accurate estimation of clothing pressure, unless tricot does not have any differences in stretchability all around the direction.
Estimation of clothing pressure using various factors
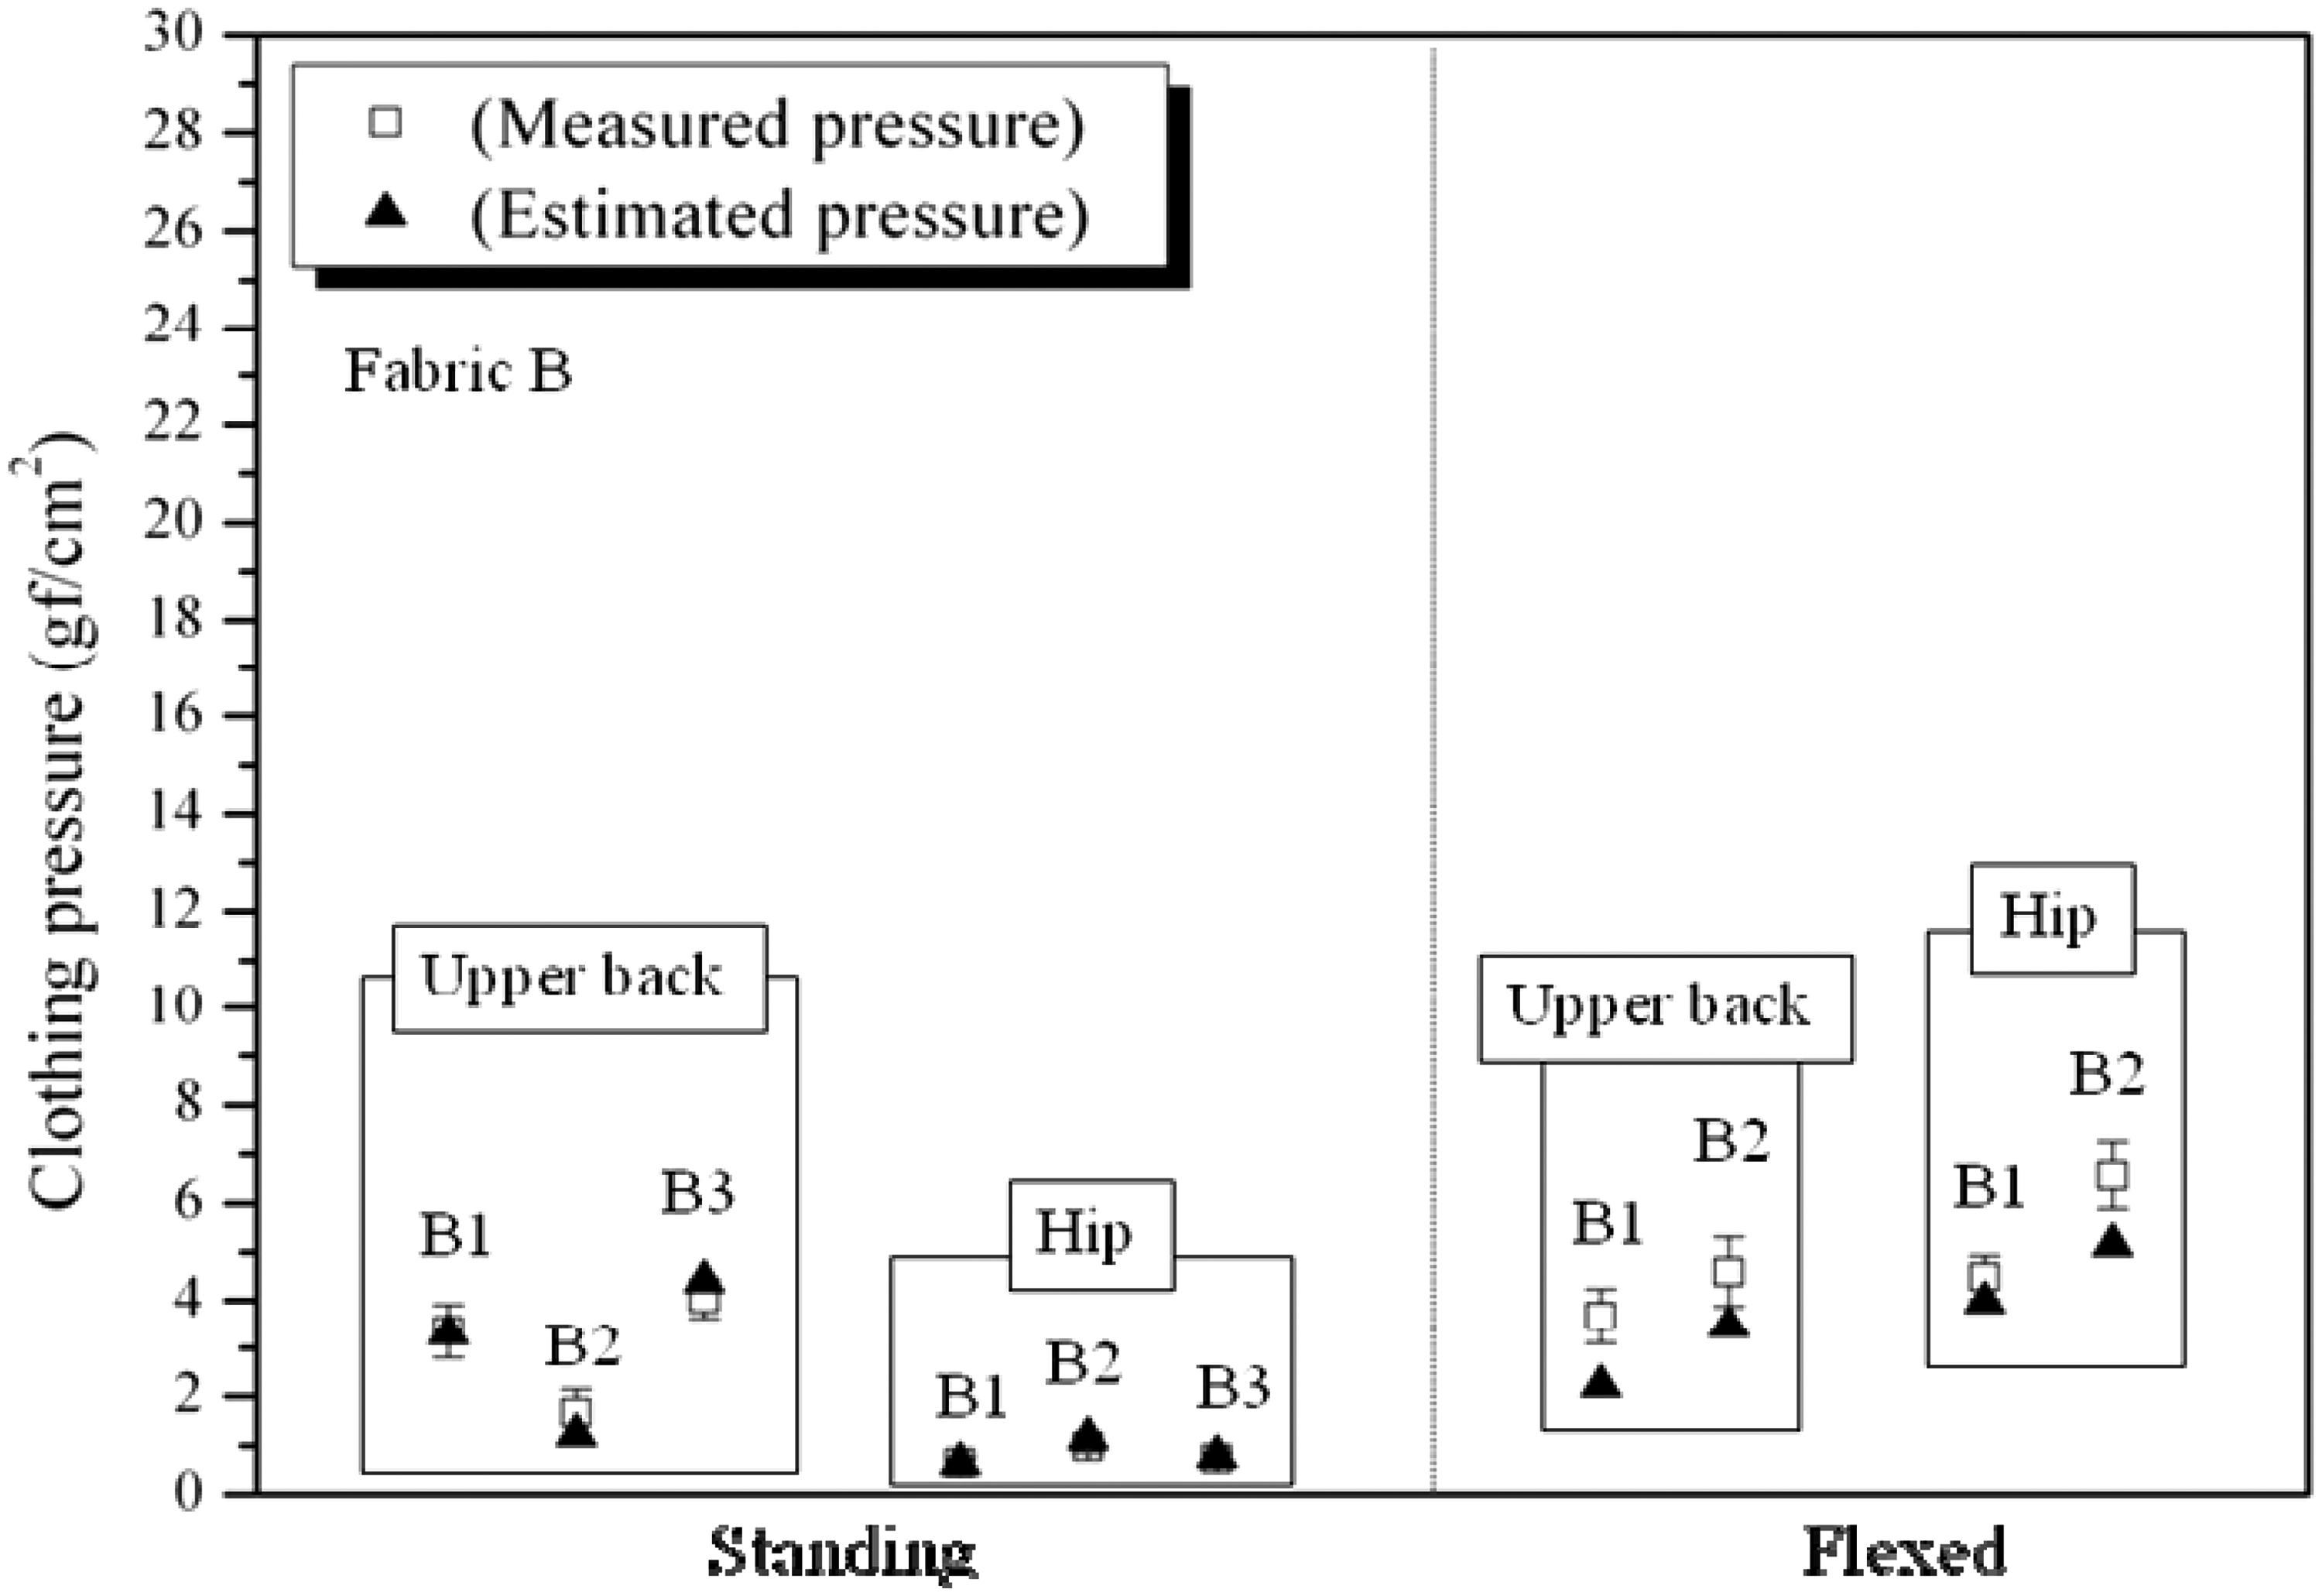
The results of verification of the newly proposed method of clothing pressure under various conditions are illustrated in Figures 10 and 11. We donned clothing made of fabric A with four levels of reduction rate, from A1 to A4, in standing and flexed positions to estimate the clothing pressure at two points: the upper back and the hip. As you can see in Figure 10, the predicted values agree well with those obtained from direct measurement; however, at the hip, the values obtained from the indirect method are higher than those obtained from the direct measurement. We will explain the reason later in Figure 12. Since the plaster surface is not compressible, as opposed to the human body, it was difficult to place the plaster cast of the flexed position in the bodysuit with a high reduction level. Therefore, for the flexed position, the bodysuits with lower reduction rates (A1 and A2, B1 and B2) were tested, and the predicted values matched well with those obtained from direct measurement at the two points on the plaster: the upper back and the hip. In the case of fabric B (Figure 11), the estimated values agree well with the measured values within the ranges of ±2 gf/cm2 (±0.196 kPa).
Verification of the proposed equation of clothing pressure for fabric A (factors: posture and position on the body). Verification of the proposed equation of clothing pressure for fabric B (factors: posture and position on the body). (a) Comparison of measured pressure and estimated pressure near hip area. (b) Distribution of air space in the microclimate in the case of A4 (fabric A, the largest reduction rate).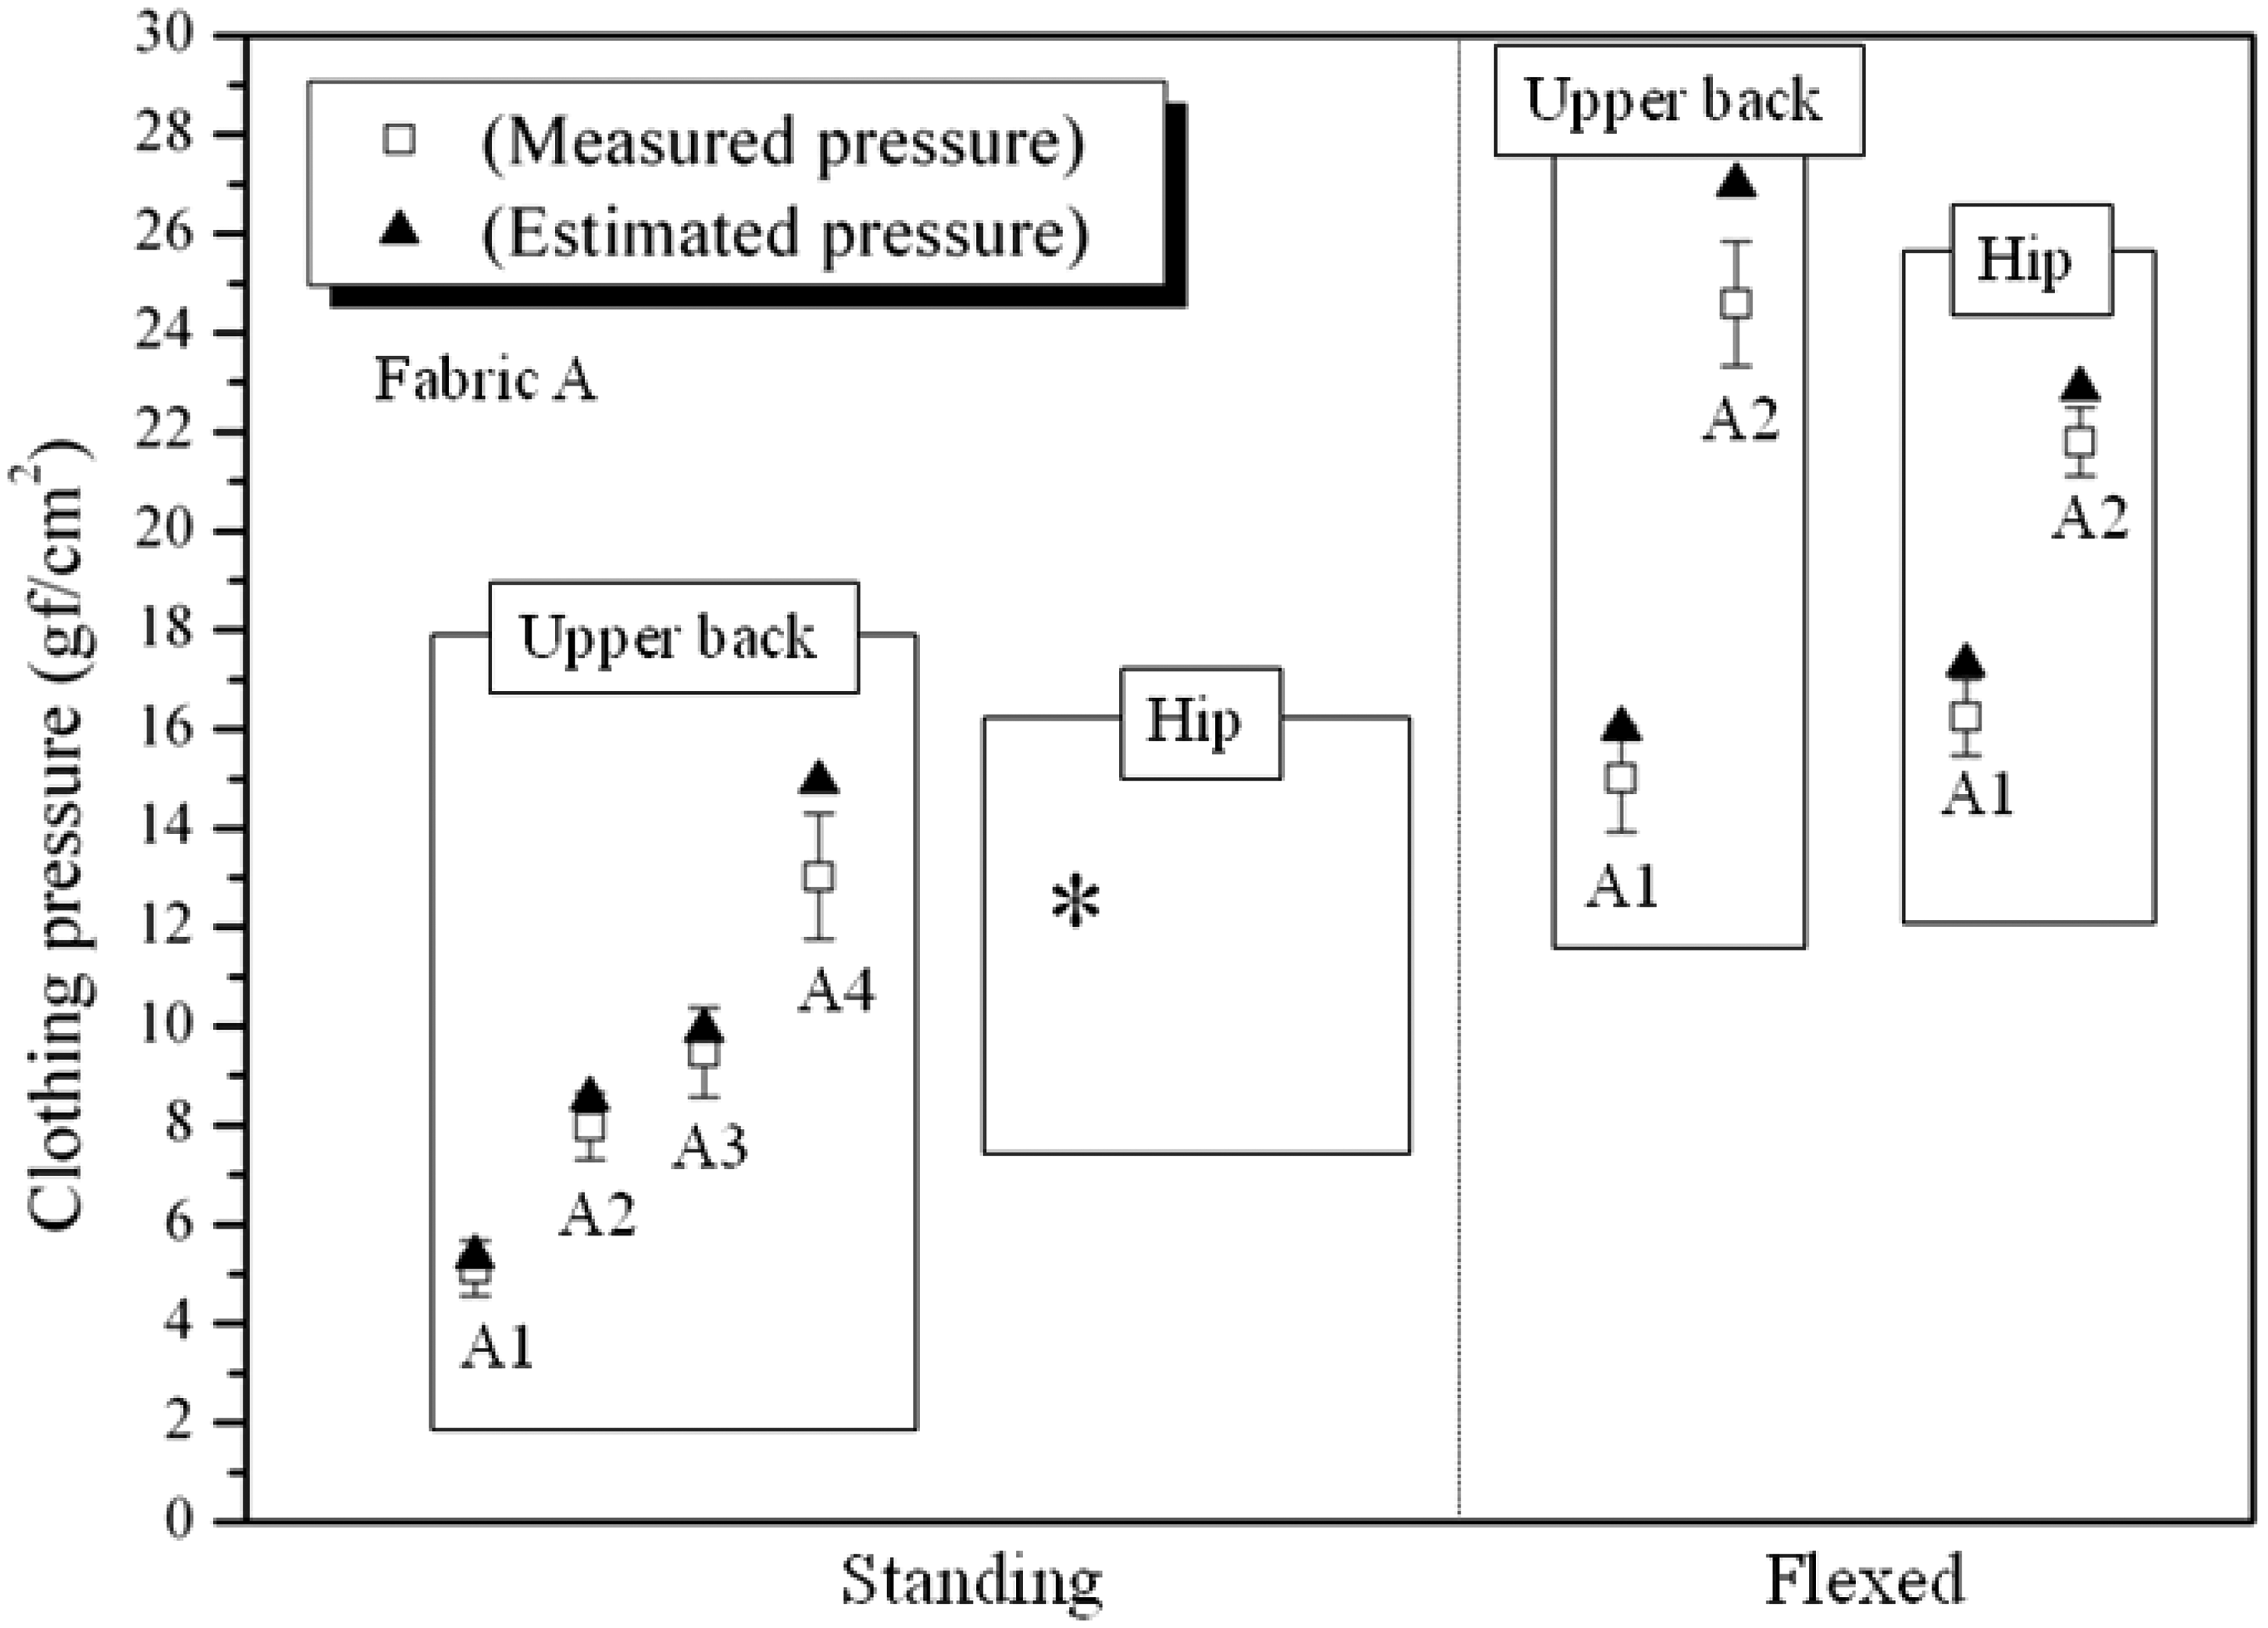
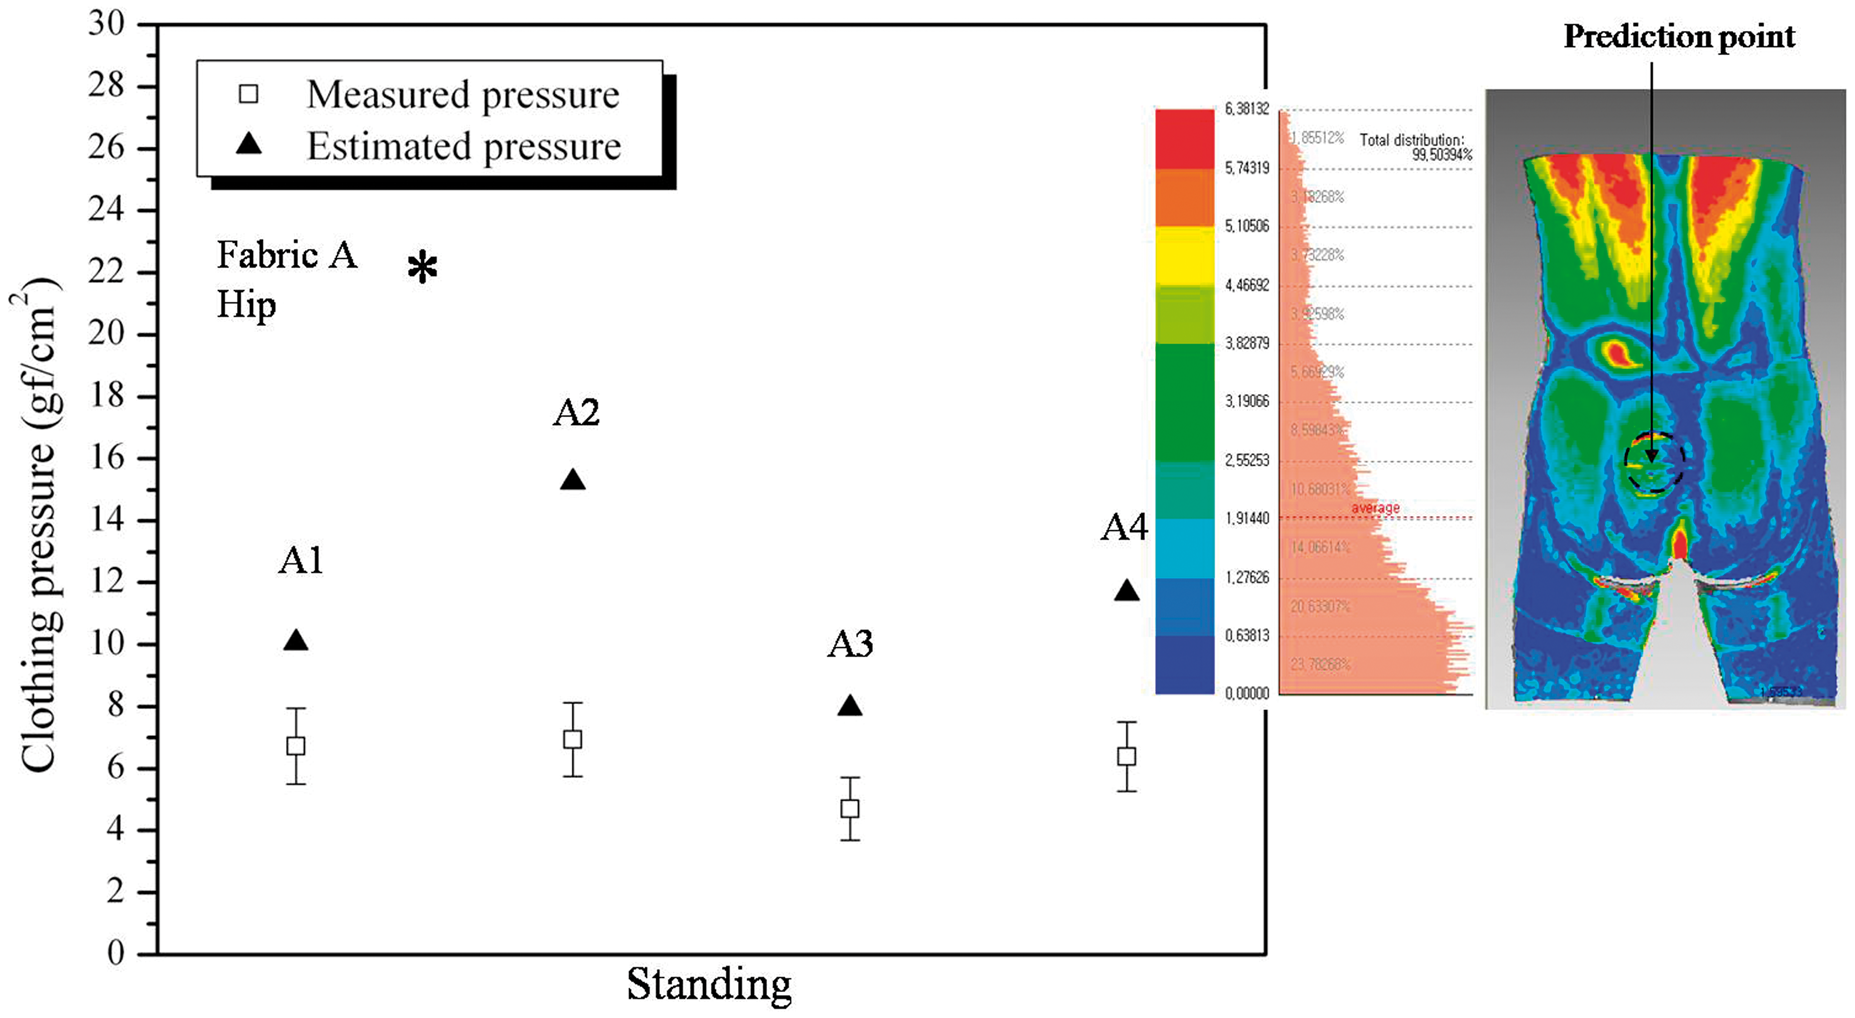
We performed statistical verification with the paired t-test, and the differences between the indirect and direct measurements were not significant at the 0.05 level, except at the hip point in the case of fabric A. It is clear that the indirect method correctly estimates the value of clothing pressure in most positions.
Contrary to other results, the gaps between the indirect and direct measurements were large at the hip point in the case of fabric A. Figure 12(a) shows the difference between the directly measured and estimated pressure, and Figure 12(b) illustrates the air gap under the clothing with the largest reduction rate (A4), which explains the reason for the discrepancy. This figure shows the 3D information pertaining to the air space between the plaster and the experimental clothing with shell–shell deviation. As shown in the figure, a considerable air space (about 2–3 mm) exists between the clothing and the plaster cast (hip area); accordingly, the estimation of the pressure deviated from the direct measurement. Fabric A is thick and less extensible and also has a lower reduction rate than pattern fabric B, so that there remain gaps around hip area. Thus, for fabric A, the indirect method incorrectly predicted the clothing pressure when there was a gap between the clothing and body. For the indirect method, the basic assumption of the equation is that when the clothing adheres closely to the skin, we can deduce clothing pressure on a point from the curvature of the shape and exert force on the point due to extension of the textiles. By the result of the experiment, it was confirmed that there are no significant differences between measured and calculated data for 22 observations, except the hip area in case of fabric A. To build a more comprehensive indirect method, additional investigations with various kinds of fabrics will be necessary. Evaluation of the method with more diverse fabric conditions will be conducted in our future work.
Conclusions
In this study, a novel indirect, non-contact method for measuring clothing pressure was suggested by improving the method of Kirk and Ibrahim. 3 The deformation of circle grids on the clothing surface and the radius of curvature in the principal direction were obtained via 3D scanning, which were used for estimating the pressure. The strain–stress relation was obtained from the tensile test of textiles with a varying mounting angle deviating from the grain. The estimated clothing pressure was verified by comparing the results obtained using an air-pack-type pressure sensor. It was found that the accuracy of the pressure estimation was improved by considering the appropriate reference grid size, 3D curvature of the human body, and directional characteristics of stress–strain curves in textile fabrics. With the help of a 3D scanning system and an image processing technique, this newly developed method can be used to obtain accurate clothing pressure reliably. In future studies, we will consider other aspects of the human body, including viscoelasticity and motion. The results of this work can contribute to the design of women’s undergarments, compensatory medical garments, sportswear, and military uniforms. We are also working on developing a program that automatically detects clothing pressure.
Footnotes
Funding
This work was supported by the National Research Foundation of Korea (NRF) grant funded by the Korea government (MEST) (No. 2010-0014897).