



Abstract
The samples of luminous fiber with different colors have been prepared by adding the fiber-forming polymer PET chips as base materials and SrAl2O4: Eu2+, Dy3+ luminescent materials. The phase composition, afterglow decay and thermoluminescent characteristics of the fiber were measured by X-ray diffraction (XRD), with an afterglow tester and a thermoluminescent dosimeter. The results indicated that the existence of the polymer matrix lowered the efficiency of excitation and consumed the energy of emission to some extent. Accordingly, the afterglow brightness of the fiber was less than that of pure strontium aluminate phosphors when excited by the same exciting light. Transparent inorganic pigments had little impact on the afterglow decay laws. When the contrast between the hue of the pigment and the colored light of the fiber was closer, the afterglow brightness of the fiber was higher. When the excitation time was longer, the initial afterglow brightness of the fiber was higher. Increasing the excitation time did not prolong the afterglow life effectively. The transparent inorganic pigments affected the luminescent intensity of the thermoluminescent peak. The E values of white, yellow and green luminescent fiber were lower than that of blue and red luminescent fiber relatively, which basically coincided with the results of the afterglow curves.
Rare-earth luminescent fiber showing innoxious and nonradioactive properties is a novel photoluminescence fiber, 1 which is made of long afterglow luminescent materials and a fiber-forming polymer as the matrix, combined with transparent inorganic pigment and functional additives by a melt-spinning process. Once the fiber absorbs any visible light, it will be luminous in the darkness for more than 10 hours. Luminescent fiber appears in various colors in visible sunlight conditions, such as red, yellow and blue, etc., and emits a series of chromatic lights in darkness.
The luminescence of the fiber generates from long afterglow luminescent materials dispersing in the fiber. Compared with long afterglow luminescent materials used in the fiber, the light-emitting performance of alkaline earth aluminate SrAl2O4: Eu2+, Dy3+ is the best, presenting the highest afterglow intensity and duration time for more than 2000 minutes, and its main emission wavelength belongs to the yellow-green area sensitive to the human naked eye to be recognized in the dark easily.2–4
For light storage products, it is most important to study the afterglow decay laws and the thermoluminescence performance. 5 To the best of our knowledge, over the last few years there has been some significant research interested in the luminescence properties of rare-earth aluminate materials mainly focusing on exploring the preparation methods or finding the optimum formula to get better luminescent properties.6–8 Furthermore, variation and impacting factors of afterglow characteristics of luminescent materials applied in manufacturing the fiber have not been well known, which limits the development of products and luminous effects to a certain extent. In recent years, luminescent fiber production has become very important for scientists and companies because of the particular characteristics of the fiber. Ge et al. 9 have studied the structure, mechanical properties and thermal properties of luminescent fiber to prove its good fiber spinning characteristics and practical value. However, there has been scarcely any research to investigate systematically the afterglow duration characteristics of the fiber and their effecting factors from the practical application viewpoint; preparation methods have been the main focus of the studies.10–14 On one hand, afterglow properties are related to the composition of materials, preparation processing and light stimulating conditions such as excitation time. On the other hand, afterglow decay time is affected by the number of trap levels, the depth of traps, bound electronic numbers existing in the trap level, electron liberation probability, etc.
In this research, the samples of rare-earth strontium aluminate and luminescent polyethylene terephthalate fiber were prepared by solid-state reaction and the melt-spinning technique, respectively. With chromatic luminescent fiber as a research object, the effects upon manufacturing elements of the fiber including the grain size and additive amount of strontium aluminate, fiber-forming polymer matrix, inorganic transparent pigment and light excitation testing conditions on the afterglow characteristics such as the afterglow brightness and time were illustrated in detail to summarize the afterglow decay laws and analyze the type, depth and electron distribution of trap levels with chromatic luminescent fiber systematically, which provided a theoretical and experimental basis for further studying the afterglow mechanism and new application perspectives.
Experimental details
Materials
Materials such as SrCO3(AR), Al2O3(GR), Eu2O3(99.99%) and Dy2O3(99.99%) and H3BO3(AR) were all purchased from SINOPHARM Chemical Reagent Co. Ltd. PET chips with different shape section were purchased from Wuxi Taiji Industry Co. Ltd. (Wuxi, China). Transparent inorganic pigments (including iron oxide red, pigment green and cobalt blue) and functional additives (including titanate coupling agent, octadecanamide and PE-WAX) were supplied by Jiangsu Guoda Complete Wiring Equipment Co. Ltd.
Preparation of luminescent materials
The samples of strontium aluminate materials were prepared by solid-state reaction. The Sr0.95Al2O4: Eu2+0.02, Dy3+0.03 was prepared by mixing the powder materials, SrCO3, Al2O3, Eu2O3 and Dy2O3, according to the mole ratios of the elements and adding 5% of H3BO3 as a flux, which were dissolved in approximately 100 ml of absolute ethanol and followed by ultrasonic dispersion with 25 kHz for 20 minutes in order to get a homogeneous mixture. Subsequently, the mixtures were dried at 90℃ for 24 hours, ground in a planetary high-energy ball mill for 1 hour and sintered at the 1300℃ with a heating rate of 10℃ min−1 in a powered carbon reduction atmosphere. The sintered products were re-milled and sieved to get the desired samples, SrAl2O4: Eu2+, Dy3+ (SAOED).
Preparation of luminescent fiber
Luminescent fibers were prepared by the melt-spinning process. The fiber-forming polymer PET chips were dried in an oven at 110℃ for 24 hours and mixed with scheduled weights of strontium aluminate, inorganic pigment and functional additives in a high-speed mixer. Then, each mixture was extruded in a twin-screw master batch producer at 270–290℃ to get master batches for the spinning application. After drying at 110℃, the master batches were melted and spun to obtain the white (no pigments added), green, yellow, blue and red luminescent PET fiber with a spinning temperature of 270℃, spinning speed of 3000 m min−1 and draw ratio of 3.
Since the amount of fibers and residual brightness in the fiber will affect the accuracy of results in the process of testing, the samples under test must be made accurately. The fiber sample weights were 5 ± 0.1 g, and were wound evenly on a 6 cm × 6 cm homemade “
Characteristic analysis
Crystal structures of samples were checked by means of a D8 Advance X-ray diffractometer (Bruker AXS, Germany) using Cu Kα radiation (λ = 0.15406 nm) at a voltage of 40 kV and a current of 30 mA. Samples were scanned over a range of diffraction angles, from 10° to 70°, with a scan speed of 4° min−1 at room temperature.
The afterglow decay curves were measured by a PR-305 Long Rays Fluorescence Tester (Zheda Sensing Instruments Co., Ltd) with simulated daylight of 1000 lx and tested 2 seconds after light excitation stopped.
The thermoluminescence spectra were obtained using a FJ27A-I TL Dosimeter (CNNC Beijing Nuclear Instrument Factory) with a heating rate of 1℃ s−1 and the temperature ranging from room temperature to 200℃. The testing was carried out under the following conditions: a Philips cold light lamp of 25 W (D65) as the light resource, an excitation illumination of 1000 lx and an excitation time of 15 minutes, and the samples were tested after 120 minutes of excitation as well.
Results and discussion
Phase analysis
The X-ray diffraction (XRD) patterns of the SAOED phosphors and chromatic luminescent PET fibers are shown in Figure 1. From the figure it can be seen that the diffraction peaks of SAOED appeared multimodal and sharp. In contrast to the Joint Committee on Powder Diffraction Standards data file (No.34-0379), the sample was a the α-SrAl2O4 phase belonging to a monoclinic system phosphorus quartz crystal structure and showed good crystallization degree and no impurity phase existed. In addition, the pattern of white luminescent fiber was the simple superposition of the sharp peaks of the inorganic luminescent materials and the macromolecular smooth structure without new peaks.
15
The pattern of blue luminescent fiber was basically the same as that of the white fiber, which indicated that the phase structures of the fiber were not affected or destroyed during the complex manufacturing process. However, due to adding the red inorganic pigment, the lattices of the inorganic materials of the red fiber were disturbed, making the diffraction peaks broader. The afterglow properties of red fiber decreased as well.
XRD patterns of SrAl2O4:Eu2+, Dy3+ and the chromatic luminescent fiber.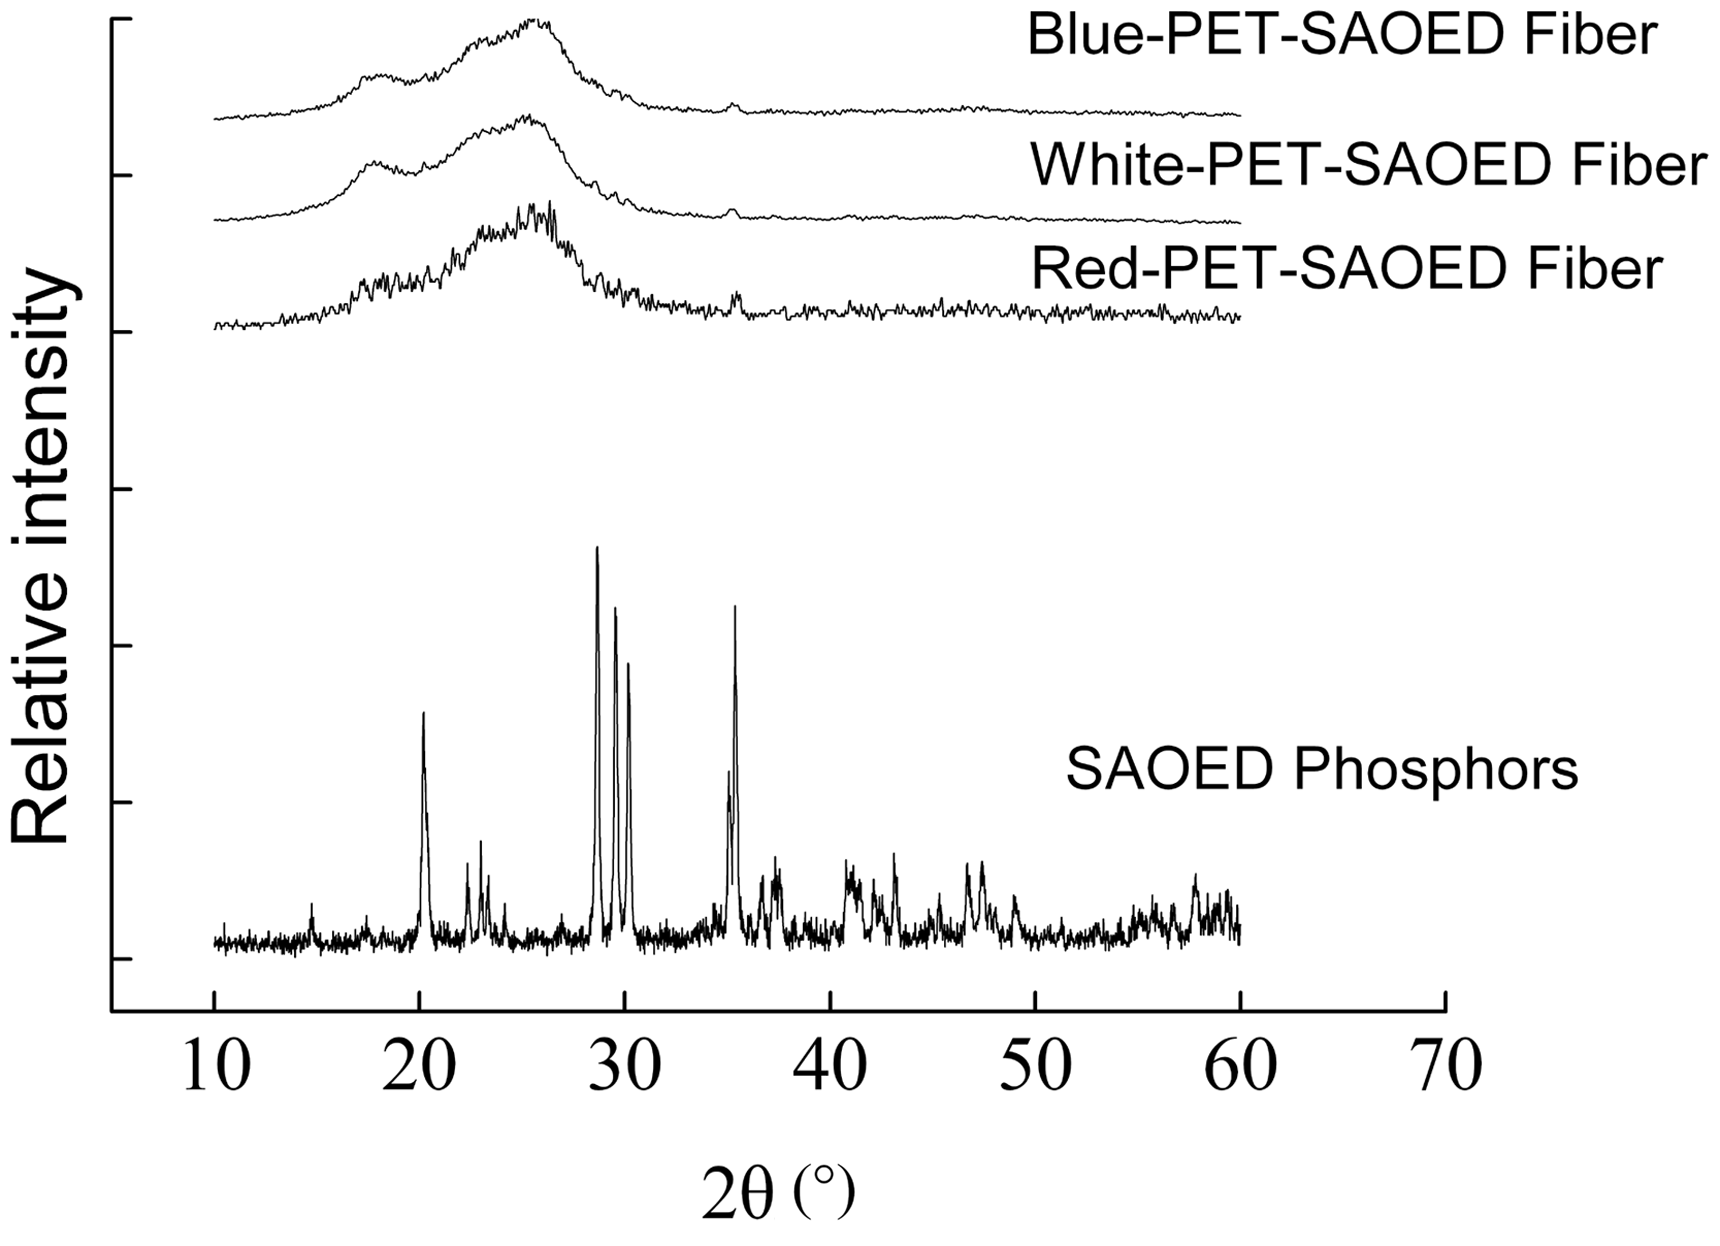
Effects of rare-earth luminescent materials on the afterglow characteristics of luminescent fiber
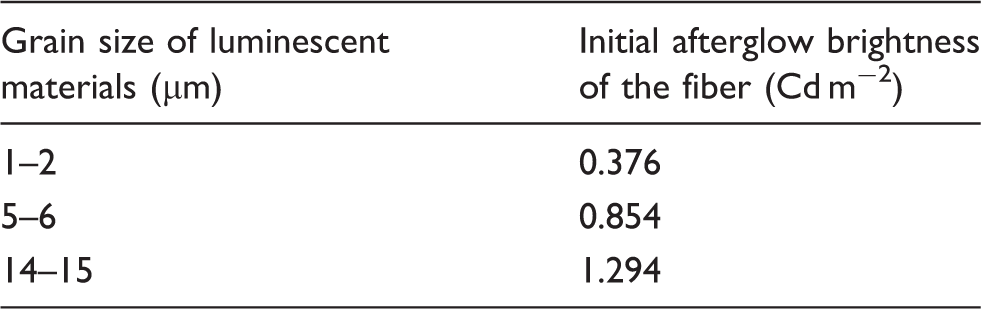
Effects of grain size on the afterglow characteristics of luminescent fiber
Initial afterglow brightness of luminescent PET fiber with adding different diameter of phosphors
Effect of the content on the afterglow characteristics of luminescent fiber
Figure 2 shows the afterglow decay curves of the white luminescent PET fiber with different contents of SAOED and an excitation time of 15 minutes. The afterglow properties of luminescent PET fiber are dependent on the luminescent materials in the fiber. It can be seen from the figure that although the contents of SAOED in the fiber were different, they presented a similar afterglow decay process and law. The afterglow intensity of the luminescent PET fiber containing SAOED of 2 wt% was obviously lower than that of other fibers, and its initial brightness was only approximately 0.25 Cd m−2. The afterglow properties of the luminescent PET fiber containing SAOED of 15 wt% was the best, but had poor spinning characteristics, and the rate of filament breakage during spinning increased dramatically. Considering the afterglow brightness of the fiber and the spinning process, when the content of SAOED in the fiber was 4–10 wt%, the luminescent PET fiber possessed good spinning process characteristics and an afterglow time of more than 10 hours which would meet with the practical product applications. Thus, the results indicated that the initial afterglow brightness of the fiber was increased gradually along with the higher content of SAOED in the fiber, which reflected a phenomenon of direct ratio, and afterglow life had no distinct connection with the content of SAOED, but was related to the depth and concentration of the trap level doped by Dy3+ ions.
The afterglow decay curves of luminescent fiber with different content of SrAl2O4:Eu2+, Dy3+.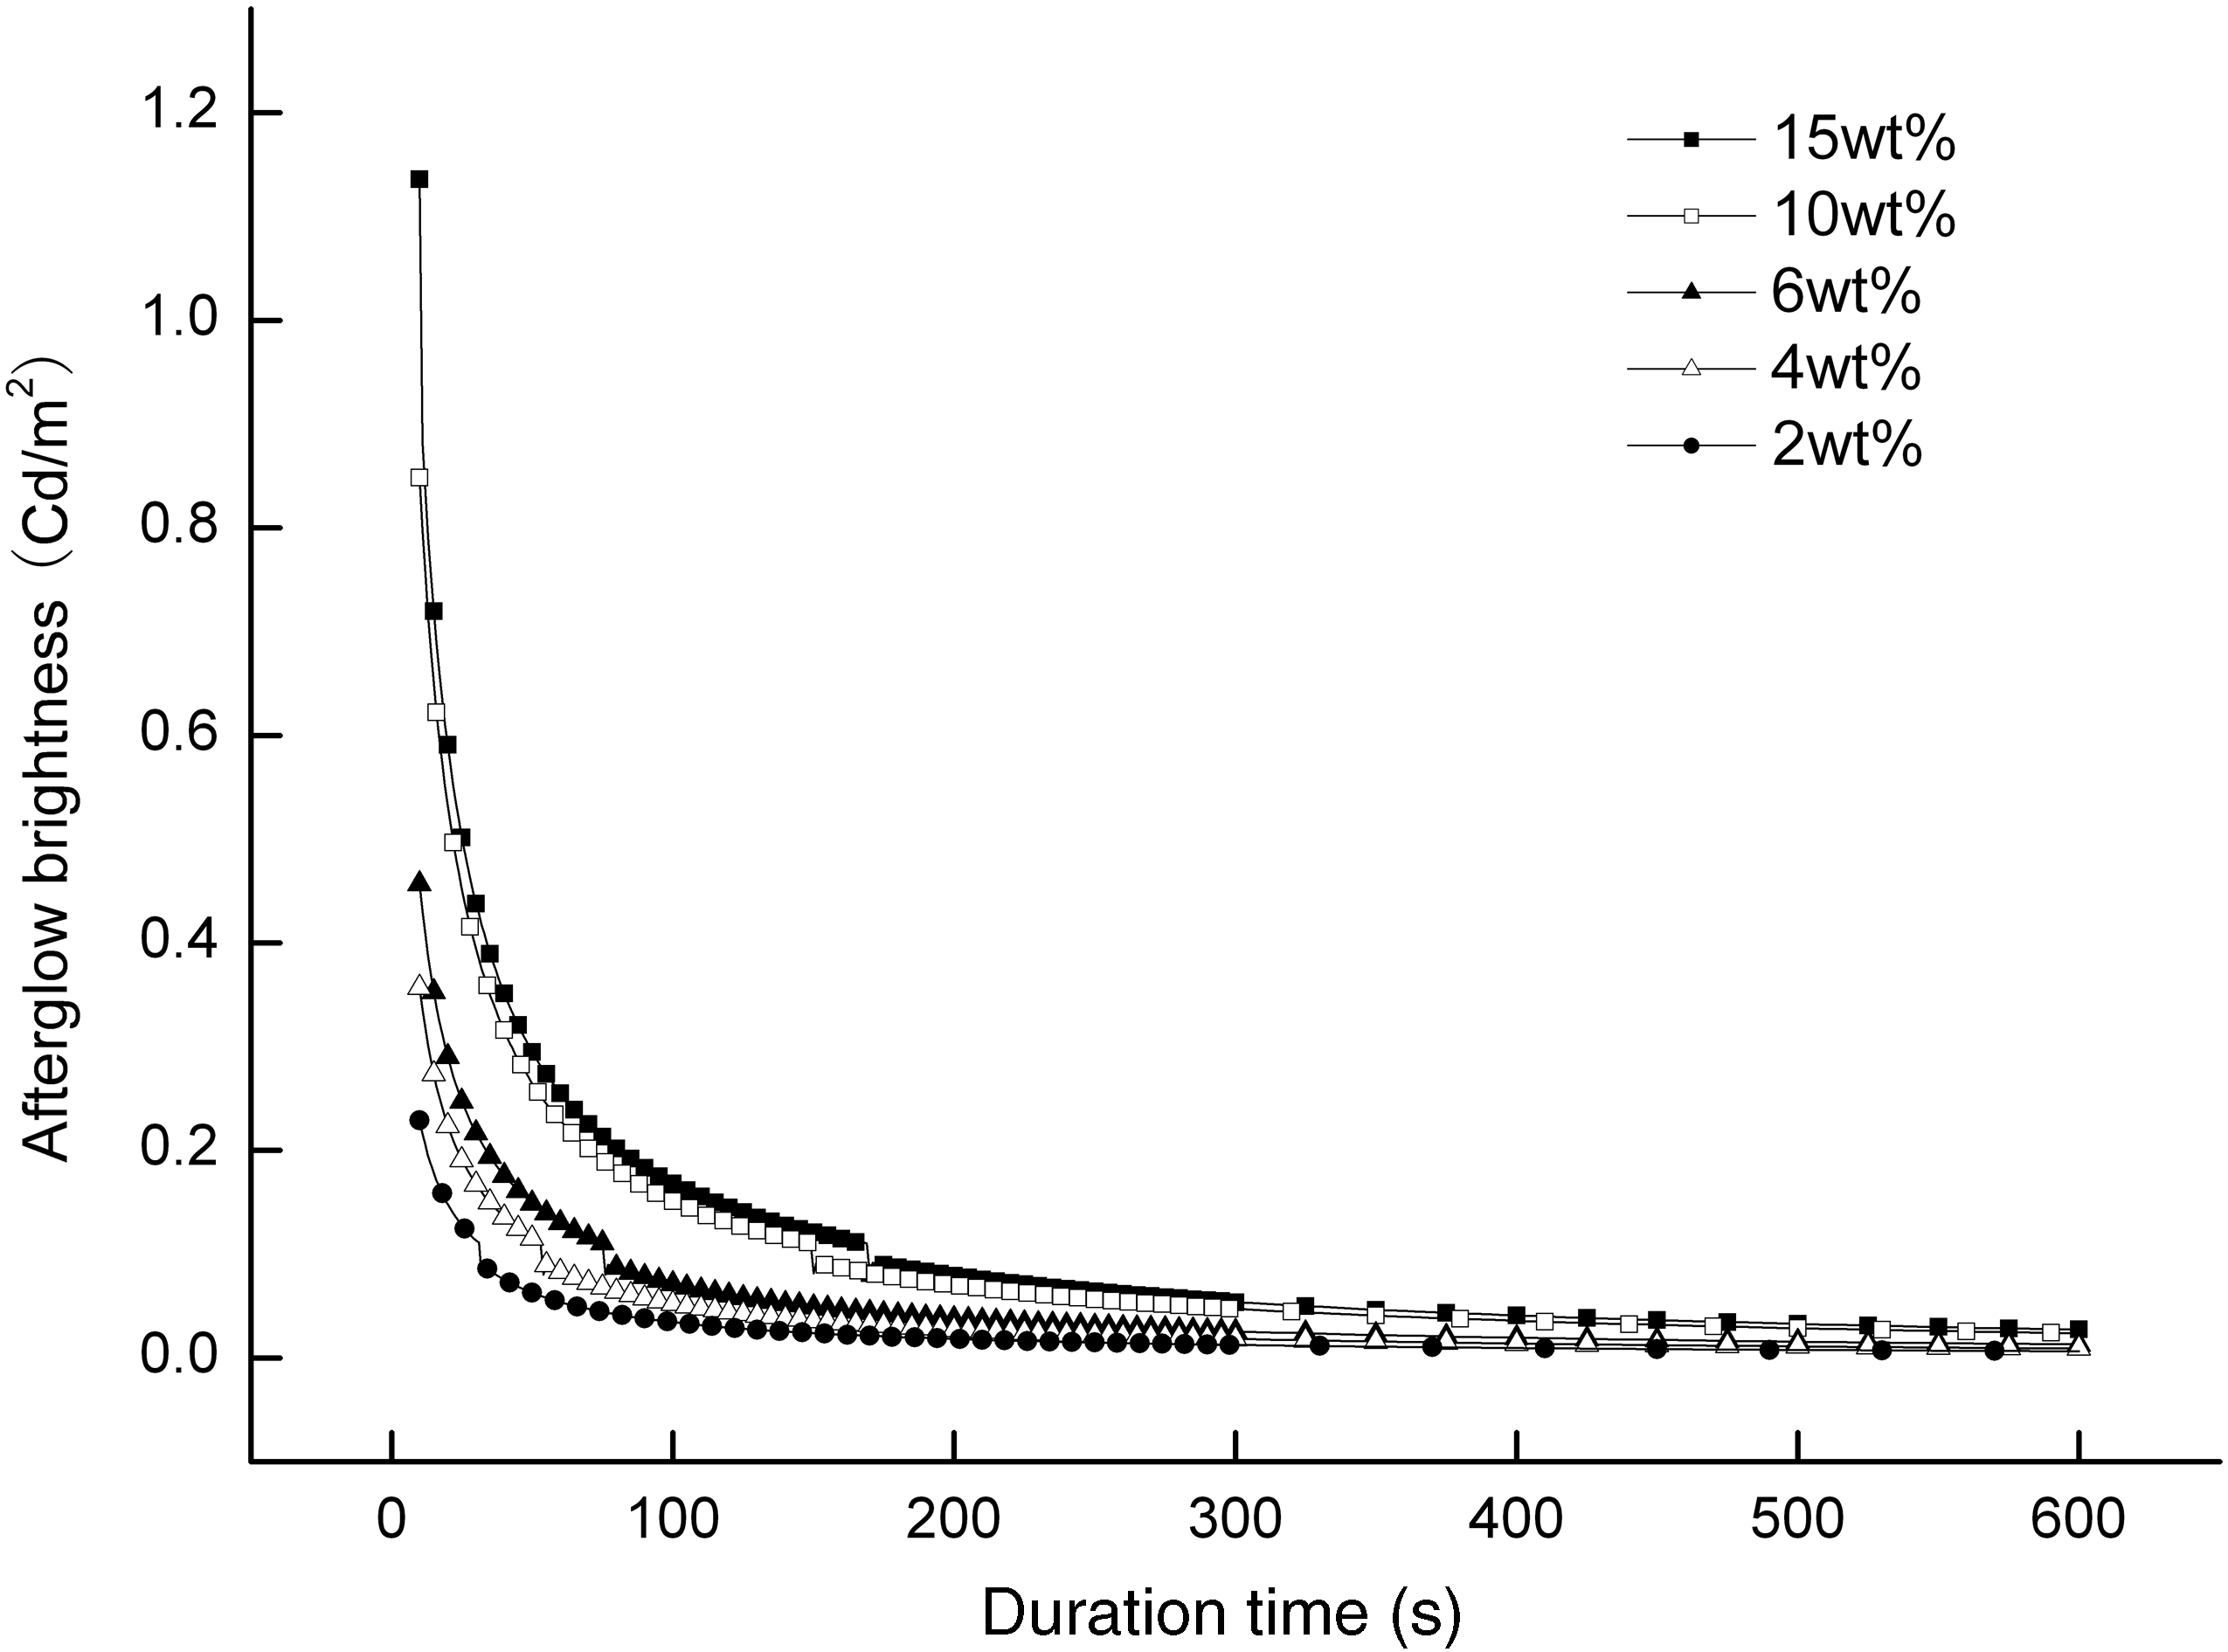
Effect of polymer matrix on the afterglow characteristics of luminescent fiber
The afterglow decay curves of the SAOED phosphors and the luminescent PET fiber excited for 15 minutes are recorded in Figure 3. The content of SAOED in the fiber was 5 wt%, named as White-PET-SAOED Fiber. It can be seen that the luminescent intensities were dramatically decreased at the start of luminescence and were followed by a long decay of the afterglow, which indicated that the initial luminescent brightness and decay speed of the afterglow existed differently, but the curve trend of luminescent PET fiber was in accordance with that of SAOED. It included three regimes: a fast initial decay corresponding to the intrinsic life of Eu2+, an intermediate decay due to Eu2+ ions trapped by shallow centers and a long decay of the afterglow arising from ions in deep trapping centers, such as Dy3+.9,16 As shown in the figure, the initial afterglow brightness of the SAOED phosphor was much higher than that of the luminescent PET fiber.
The afterglow decay curves of luminescent fiber and SrAl2O4:Eu2+, Dy3+ phosphors.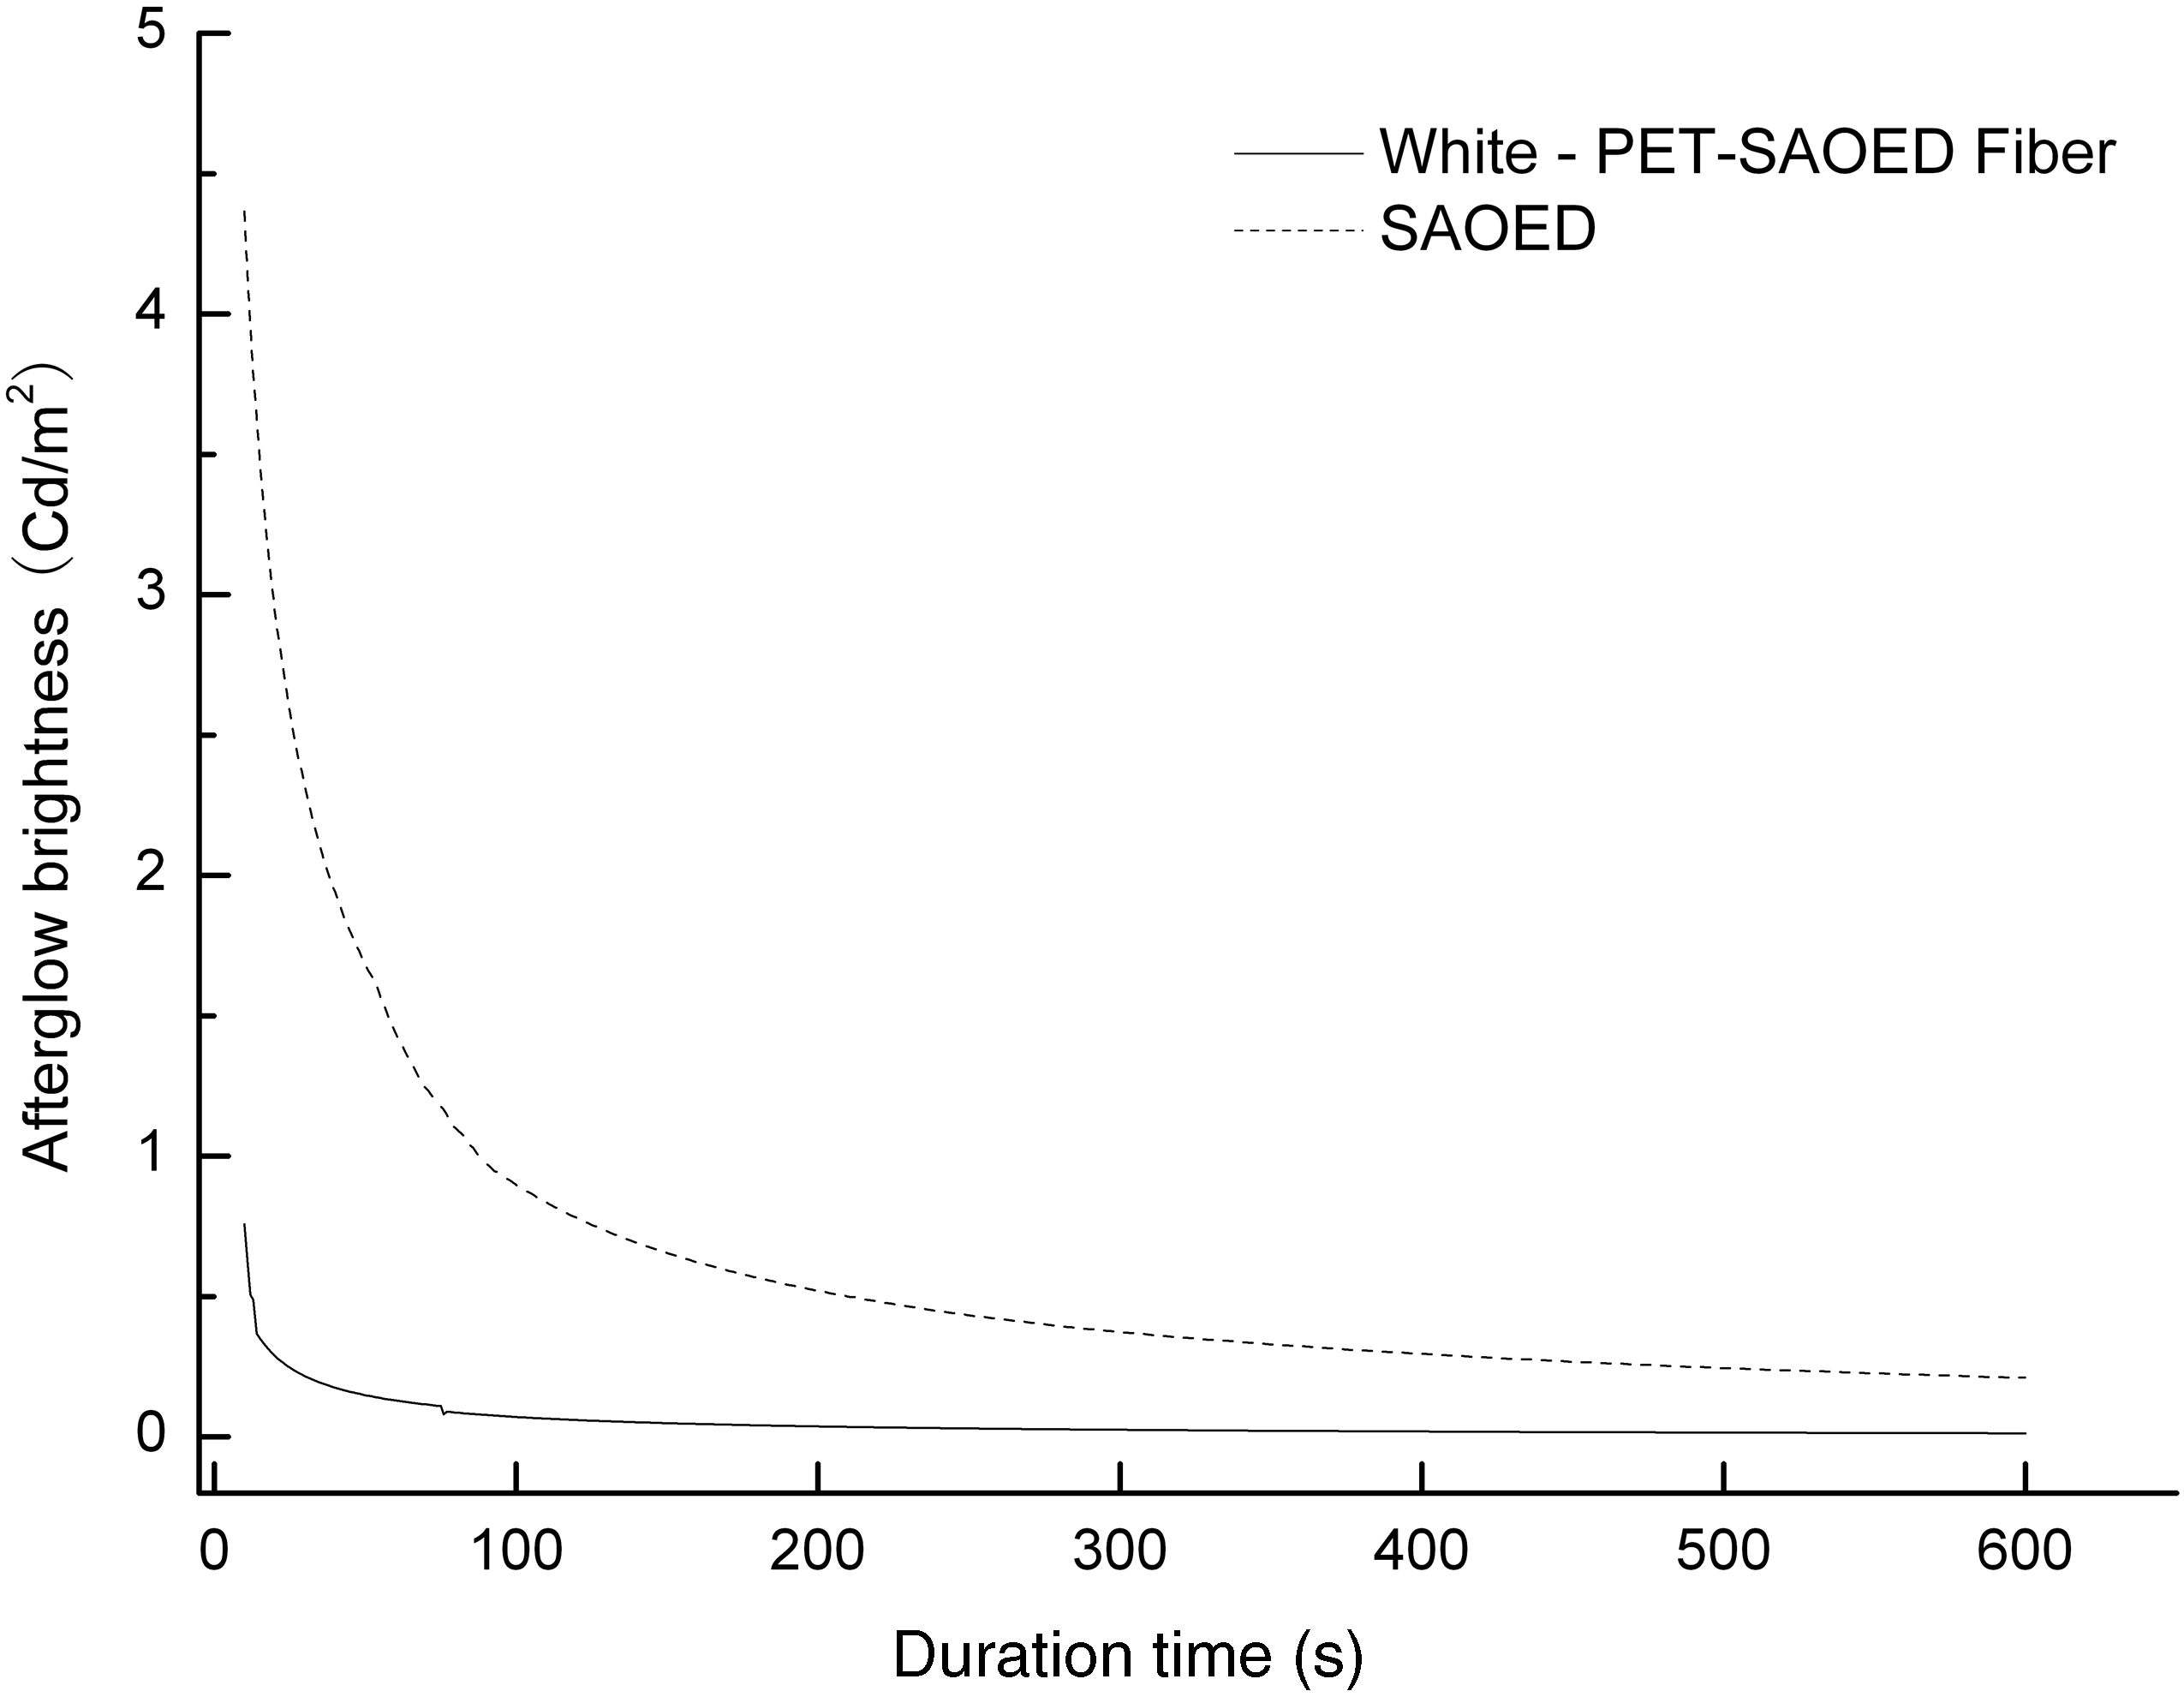
To the best of our knowledge, the matrix of the fiber-forming polymer PET had no fluorescence emission in the range of 450–600 nm, and the luminescence was attributed to the strontium aluminate in the fiber. When excited by the exciting light, the electrons of each energy level in the Eu2+ ion absorbed a certain wavelength energy and began to transit from the 4f ground state to the 5d excited state. Some electrons went back to the ground state because of energy imbalance, and meanwhile each electron gave up energy and emitted it in the form of light. After reviewing the XRD patterns, it was determined that the phase structures of the fiber were not affected or destroyed during the complex manufacturing process. Therefore, it was deemed that the low afterglow brightness of the fiber was attributed to the existence of the polymer matrix and it hindered the light travel during the process of luminescence.
In order to explain the effect of the polymer matrix on the luminescence of SAOED in the fiber, we simulated and analyzed its luminescence process in an ideal state. Firstly, we discussed the excitation process of the light. When an exciting light hit the air–fiber surface, it was reflected, scattered, absorbed and refracted by the polymer matrix. Then, only the refracted light entered the fiber and began to propagate within it, which had two possible outcomes. One part of the light encountered the SAOED particles and excited them directly, and the other part of the light which reached the fiber–air surface directly without encountering any particles, reflected and refracted again. Secondly, we discussed the emission light generated from the SAOED particles in the polymer matrix. One part of the emission light reached the fiber–air surface directly and was reflected and refracted on this surface, which suggested that the reflected light continued to travel within the fiber and began to a new cycle of excitation and emission, and the refracted light passed through the fiber and gave out light. The other part of the emission light encountered the SAOED particles and began a new excitation process. The light of excitation and emission were reflected, absorbed and refracted for many times, and then formed the last luminescence of the fiber. Therefore, the exciting light was not absorbed by the fiber efficiently during the excitation process, and the emission light generated from the luminescence particles in the PET matrix was consumed in some degree during the emission process in the fiber because of the existence of the fiber-forming polymer.
Effect of inorganic pigment on the afterglow characteristics of luminescent fiber
The afterglow decay curves of the luminescent PET fiber with the addition of several different transparent inorganic pigments are shown in Figure 4. The content of SAOED in the samples was 5 wt% and excitation time was 15 minutes. The decay trend of the luminescent fibers with inorganic pigments were similar and close to that of the white fiber without any pigment as a whole, but the initial afterglow brightness of the samples were different to some degree, which when listed in a declining order were white fiber, green fiber, yellow fiber, blue fiber and red fiber. In addition, we observed a step in the curves when the afterglow brightness reached approximately 0.1 Cd m−2; this point is when a substantial decrease in afterglow was exhibited. This phenomenon may be related to the patterns of the fast initial decay and the long decay process.
9
The decrease occurred in white fiber at 97 seconds, green fiber at 79 seconds, yellow fiber at 62 seconds, blue fiber at 59 seconds and red fiber at 48 seconds. After 60 minutes, the level of the afterglow brightness still remained in the same declining order: white fiber, green fiber, yellow fiber, blue fiber and red fiber, and the values of brightness approached to each other.
The afterglow decay curves of the chromatic luminescent fiber.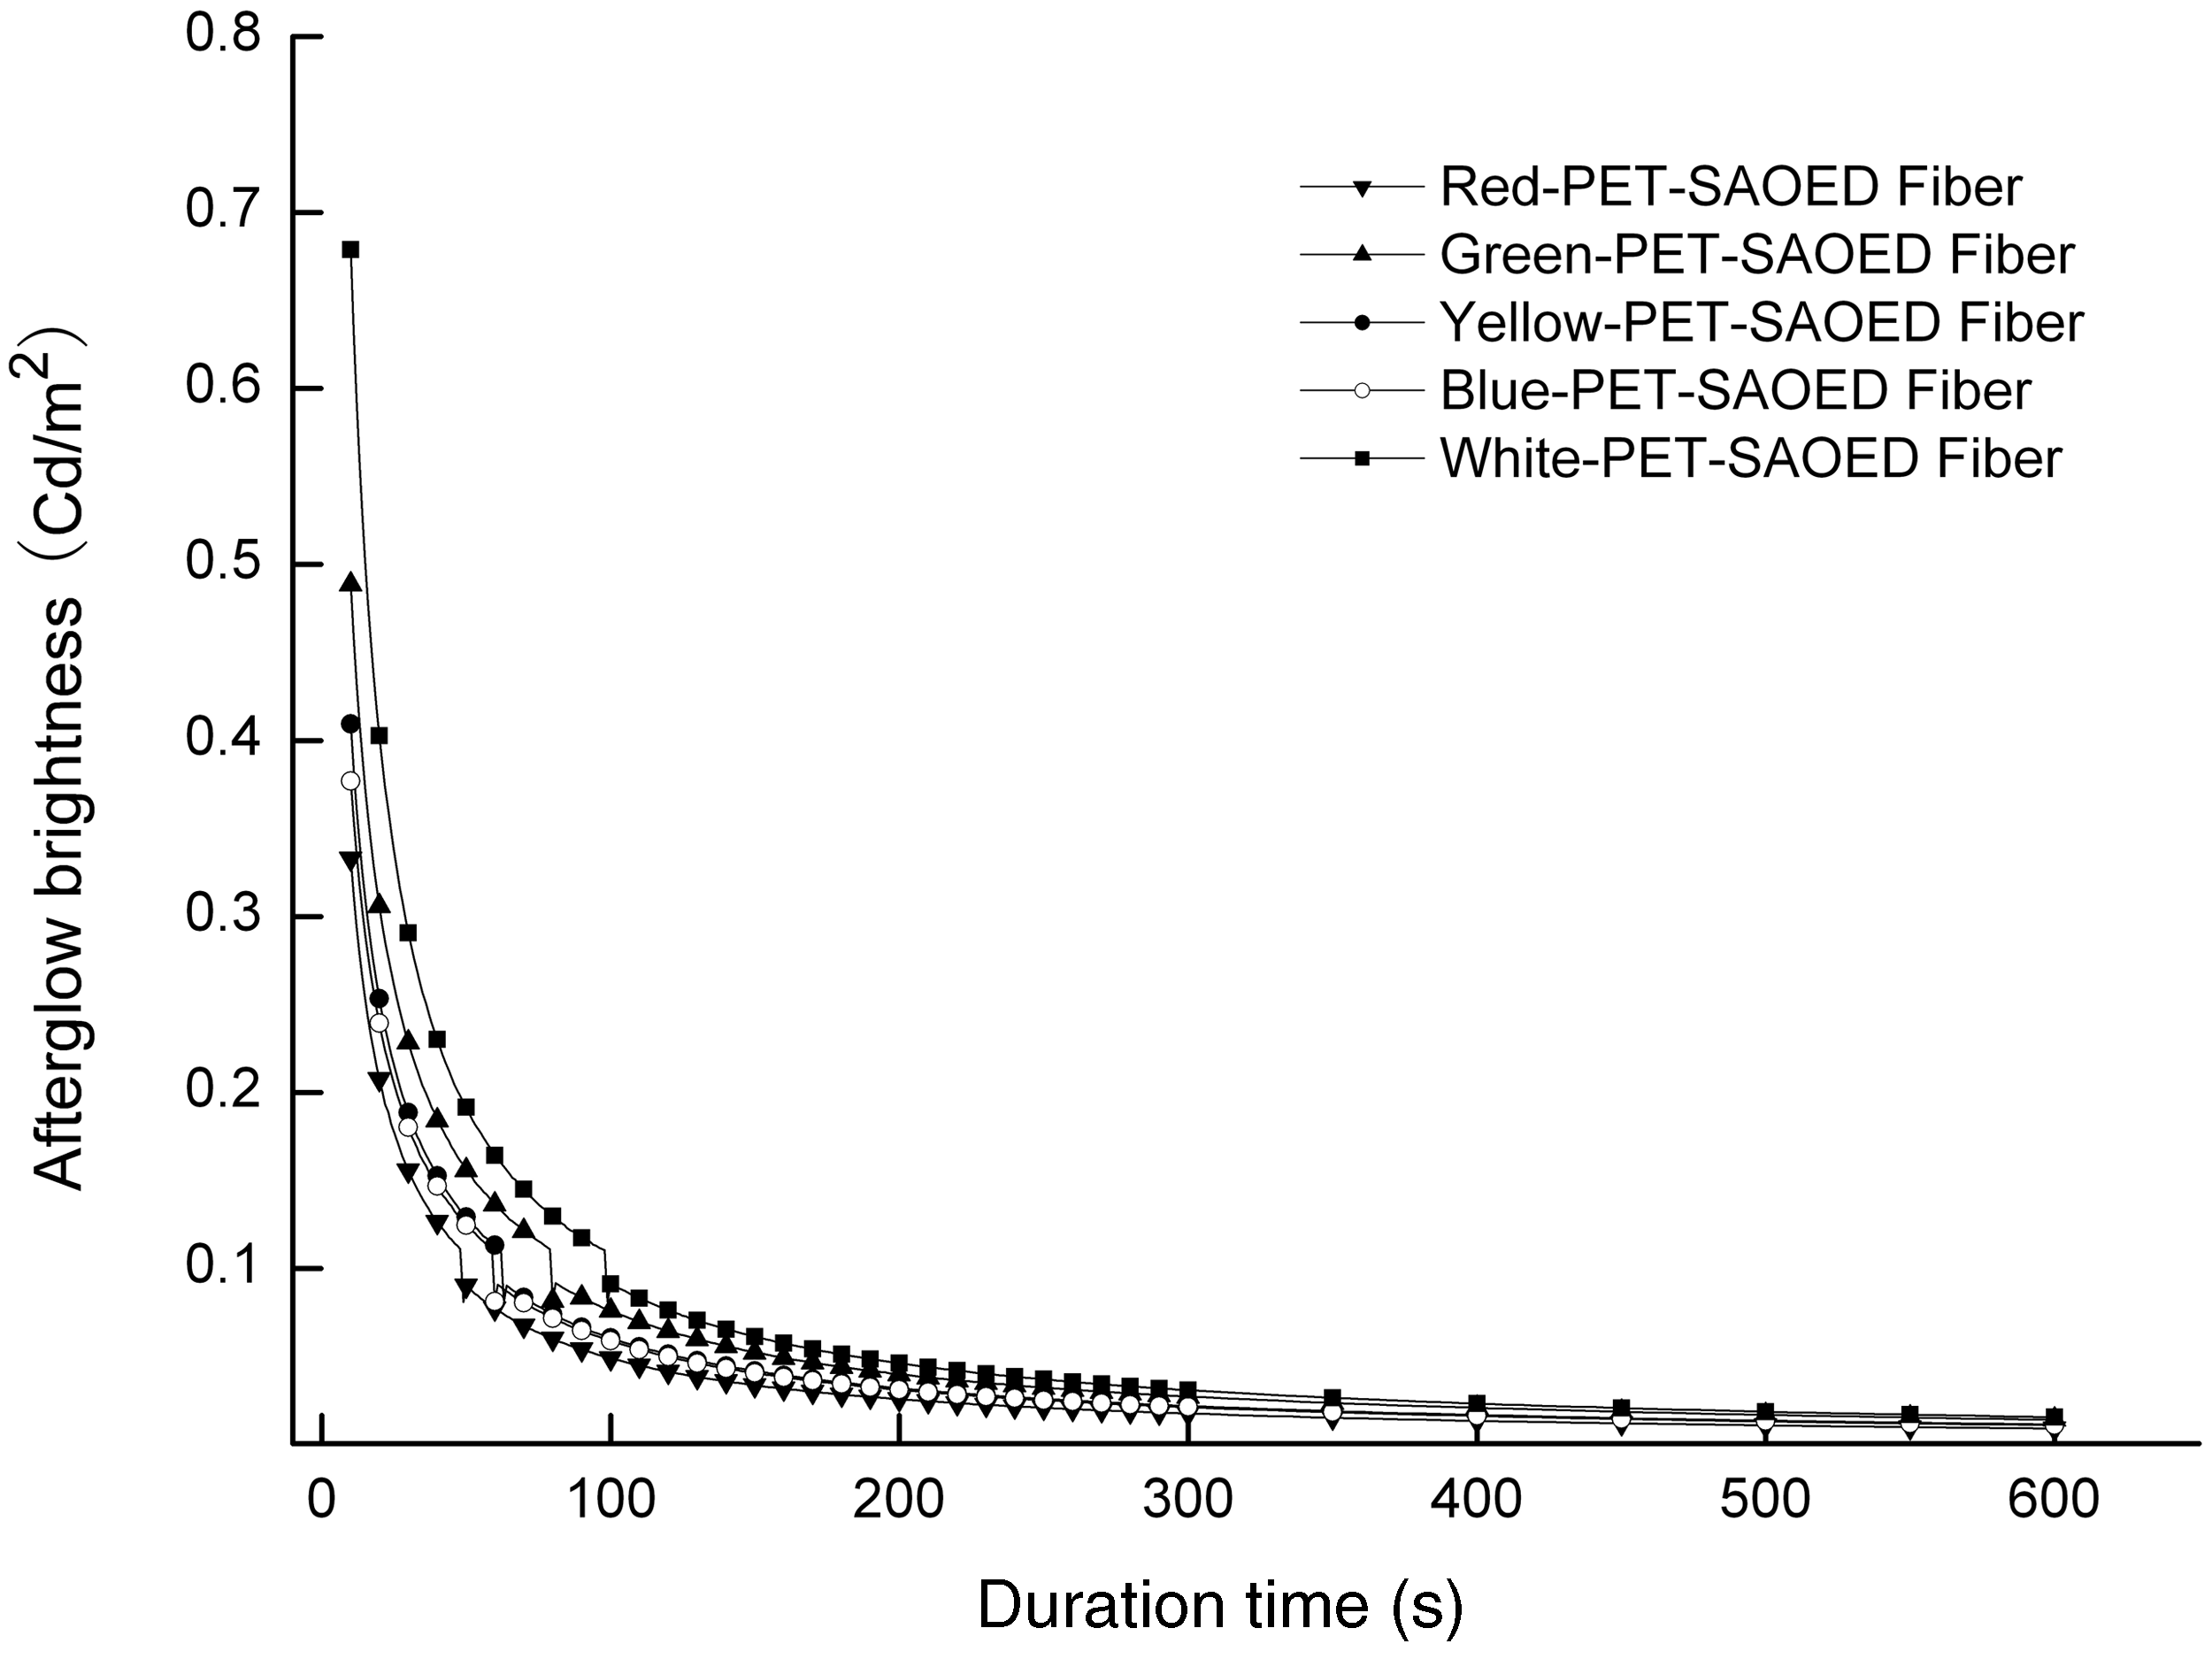
It was considered that different afterglow characteristics of the samples were related to the influence of the inorganic pigments on the color of the light emitted by the luminescent materials. It is well known that when light meets an object, some photons with a certain wavelength will be easily absorbed by the object if it has the same wavelength; other wavelengths will pass through the object to form the object’s hues. The luminescence of the luminescent PET fiber was attributed to the rare-earth strontium aluminates that distributed on the surface or inner portions of the fiber, with almost no particles agglomeration existing. 9 When the luminescent fiber was excited by the visible light, most of the strontium aluminate in the fiber, hindered by the polymer matrix and the inorganic pigments from obtaining excitation energy indirectly, generated photon transmissions, to which it was deduced that some of the photons inevitably encountered pigments that were absorbed selectively. Therefore, for the same polymer matrix, inorganic pigments had more influence on the transmission of photons emitted by the strontium aluminates. In the process of excitation, the white luminescent fiber without pigments obtained the most excitation energy and lost the least compared with the other fibers, which led to the highest initial afterglow intensity and the longest afterglow life. However, in the process of emission, photons from the white fiber were scarcely encountered, so the start of the luminescence exhibited a more rapid rate of decay. This is because the hue of the yellow-green color light emitted by the strontium aluminate is closer to that of the yellow and green pigments which transmit the yellow-green color light selectively. Thus, the afterglow brightness of the green and yellow luminescent fiber was slightly higher than that of the blue and red luminescent fiber.
Effect of light excitation conditions on the afterglow characteristics of luminescent fiber
Figure 5 shows the afterglow decay curves of the white luminescent fiber with different excitation times, 5, 15 and 30 minutes, in the same excitation light and with the same intensity, and records their attenuation conditions with a duration time of 900 seconds. It shows that the afterglow brightness of the fibers were different with different excitation times. It can be seen that the initial brightness of the fiber with excitation a time of 30 minutes was the maximum and that the excitation time of 5 minutes was the minimum. Moreover, the initial brightness of the fiber excited for 5 and 15 minutes were approximately at the extreme and showed similar decay characteristics. After about 100 seconds, the three curves flattened out gradually and the final brightness of the samples were almost the same, which showed that the afterglow brightness of the fiber with the excitation time of 5, 15 and 30 minutes successively became lower and were 0.00607 Cd/m2, 0.0058 Cd/m2 and 0.00568 Cd/m2, respectively, at an attenuation time of 900 seconds. Moreover, we tested the afterglow brightness of the fiber with an excitation time of 10 minutes for a longer time. It was observed that the residual brightness of 0.32 mCd m−2 was present at about 8 hours, which could apply practically in some areas of stage performance and night decoration and in some engineering applications.
The afterglow decay curves of luminescent fiber with the different excitation time.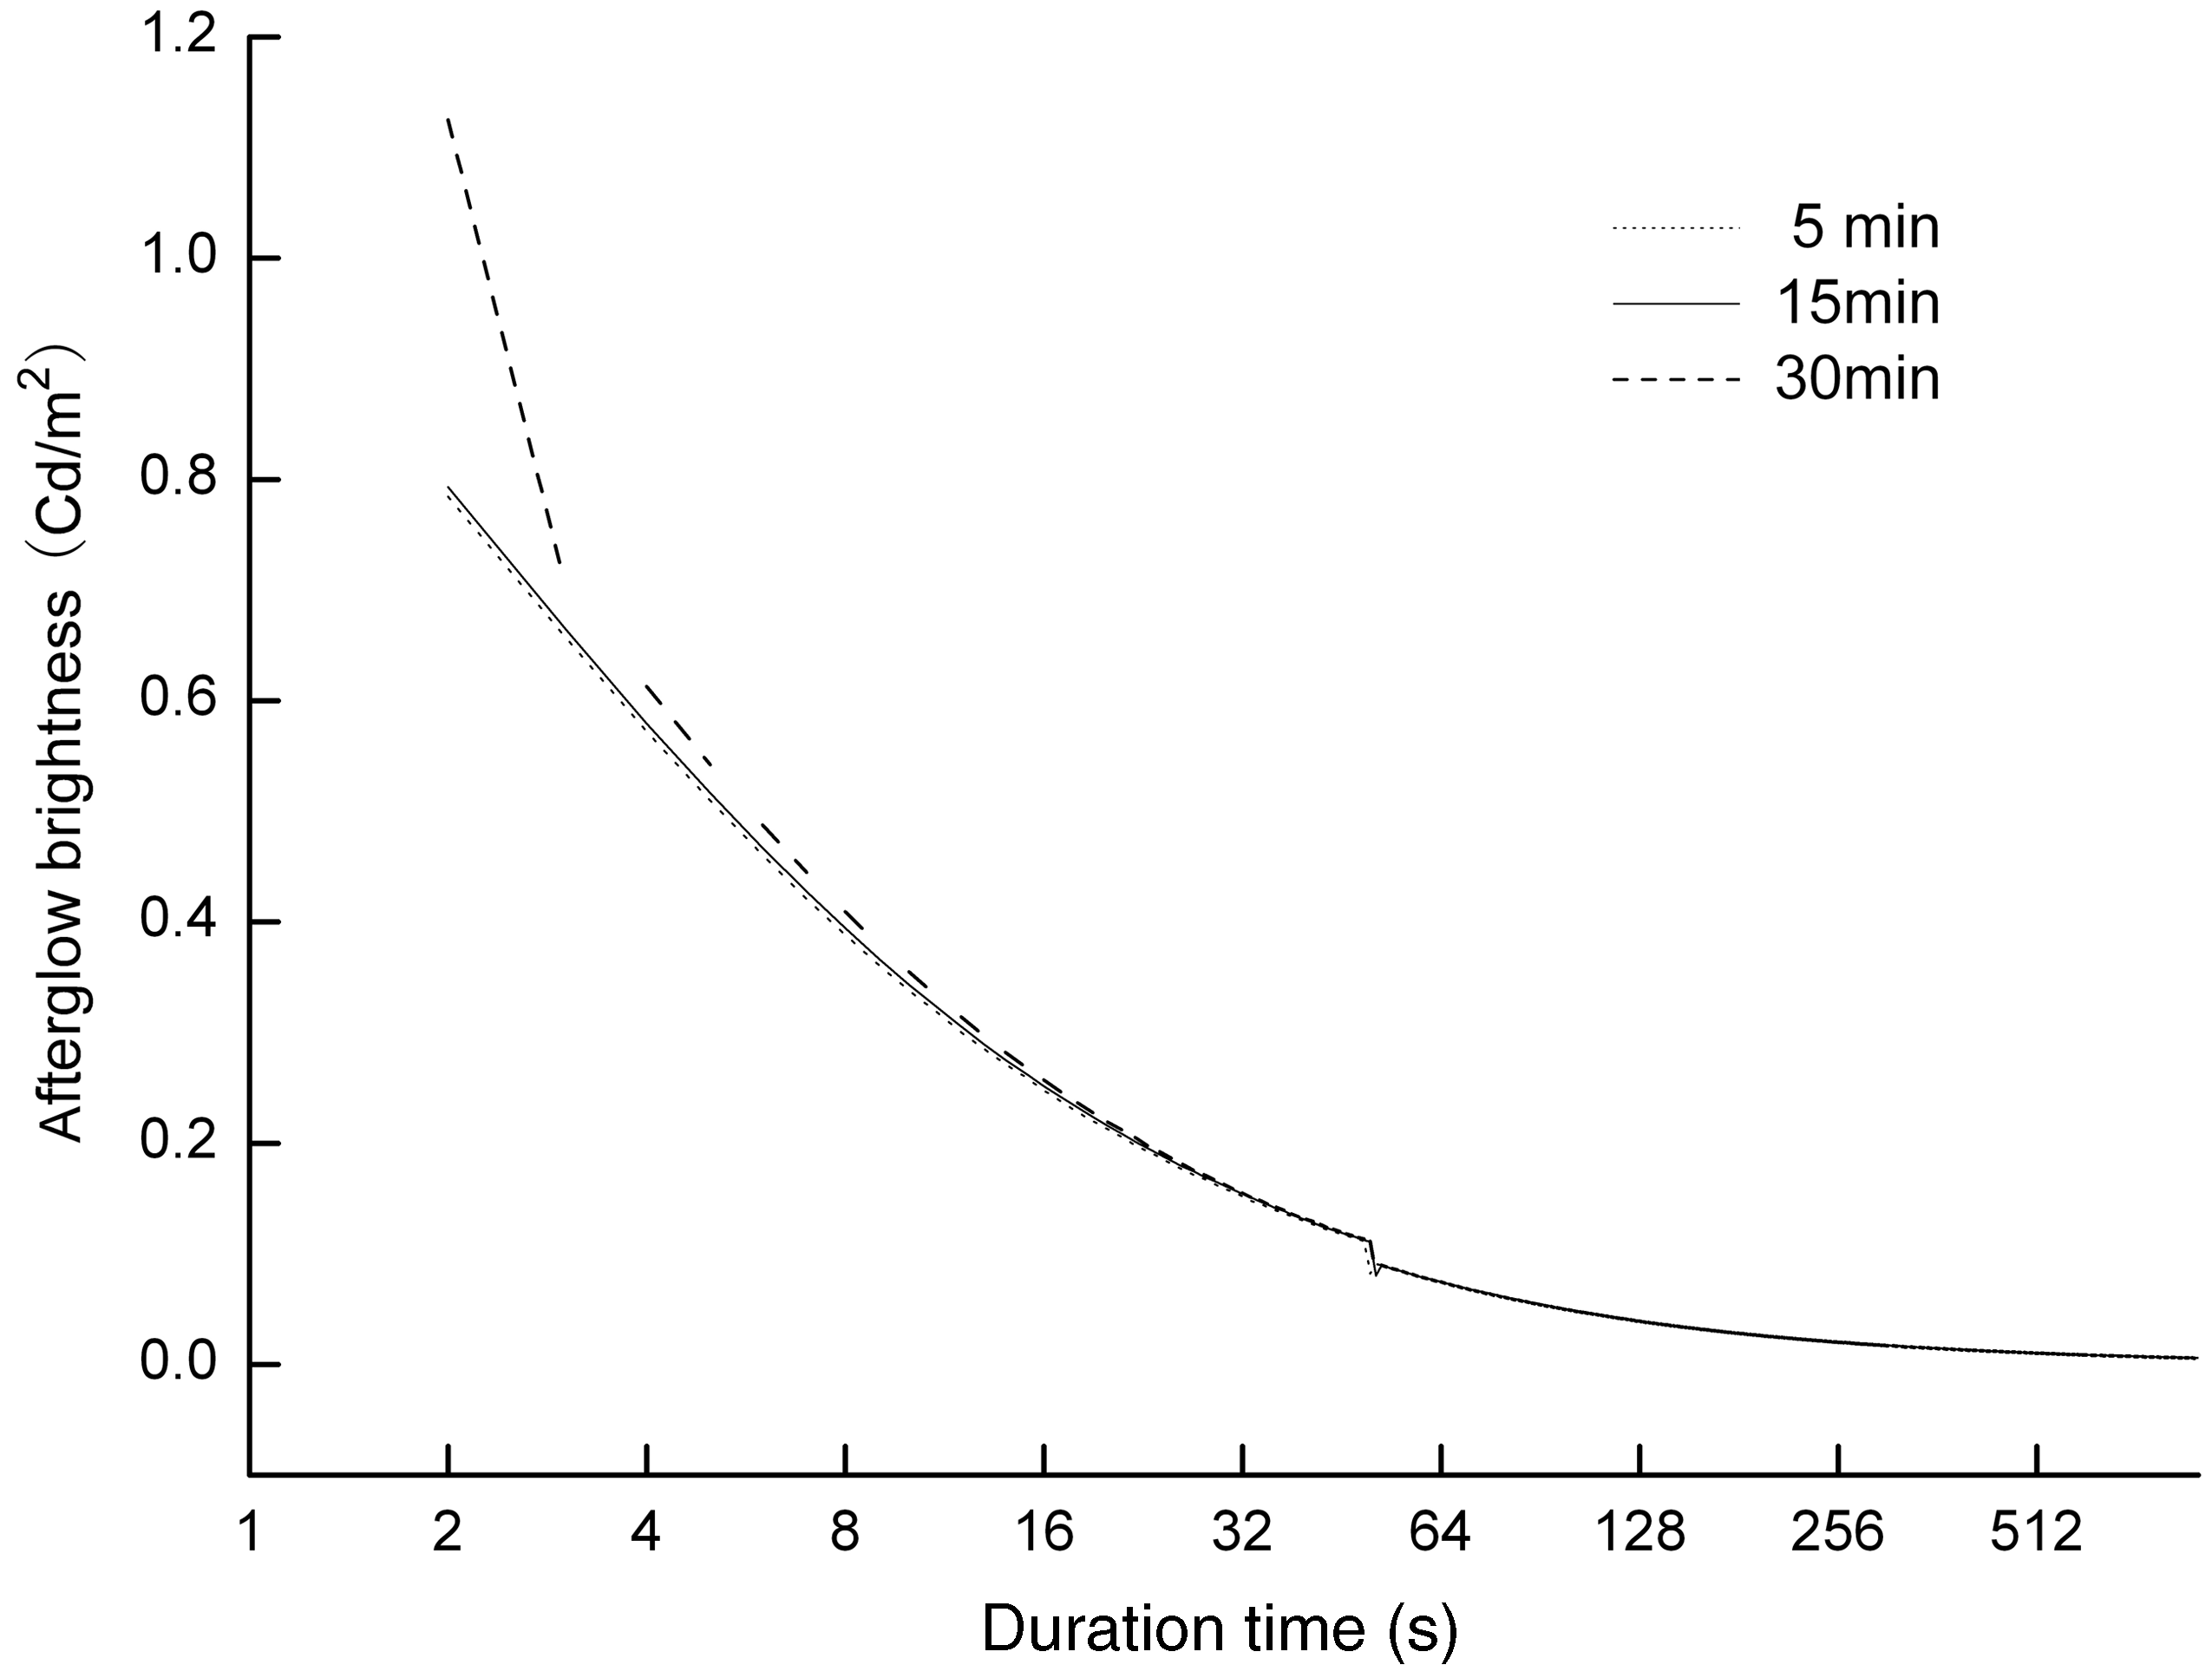
The above results suggested that the excitation time influenced the initial afterglow brightness and the attenuation time of the fiber to some extent but scarcely changed the law of afterglow decay. Strontium aluminate, absorbing the photons excited by the light, reached the saturation conditions, which indicated that prolonging the excitation time cannot stimulate more electrons. The state of the afterglow time mainly depended on the depth of the trap level. When the fiber was lit, the electrons that obtained enough energy moved from the valence band to the conduction band, in the process of which part of the electrons in the excited state generated fluorescence combined with a luminescent center in a short time, while the other electrons were captured by the trap level. The deeper trap first captured the electrons with the shorter excitation time, which equated to the result that when the excitation time was shorter, the duration time was longer. Meanwhile, the shallower trap captured the excess electrons with the longer excitation time, due to the shallower trap level corresponding to the faster decay process, and, as a result, the initial afterglow brightness of the fiber with the longer excitation time was relatively higher.
The trap level distribution of the luminescent PET fiber with different colors
As for the long afterglow materials, doped foreign ions replaced the ions of the host crystal’s lattice to make the matrix lattice defective and formed the trap level with a different depth that captured the excitation electrons from the conduction band. It is well known that in SrAl2O4:Eu, Dy phosphor, Eu2+ ions are the luminescent centers. The photo-excited luminescence is considered to be due to the transition from the 5d level to the 4f level of the Eu2+ and the holes in the traps are responsible for the long afterglow. In the present system, Dy3+ act as hole traps.
3
For the deeper trap, heating the luminescent materials can release the electrons from the trap and emit light. Normally the thermoluminescent method is employed to discuss the trap distribution of materials. Also rare-earth strontium aluminate in the fiber is a special thermoluminescent material, the thermoluminescent curves (the curves of the luminescent intensity with the change of temperature) can be analyzed to study the trap level distribution of the chromatic luminescent fiber. The afterglow characteristic is induced by the trap level; consequently, the investigation of the traps of materials may provide an appropriate explanation for the afterglow experimental phenomena. Figure 6 shows the thermoluminescent curves of the luminescent PET fibers for the five different colors: white (W), green (G), blue (B), yellow (Y) and red (R).
The thermoluminescent curves of the chromatic luminescent fiber.
As can be seen in the figure, the thermoluminescent intensity of the samples declined in the order of white, green, yellow, blue and red luminescent fiber, and the intensity of the red fiber was almost approaching that of the blue fiber. The thermoluminescent peaks of the samples were in the 393–403 K temperature range, which was not in accordance with the previous report that rare-earth strontium aluminates had thermoluminescent peaks at two temperatures.
17
This was the result because the thermoluminescent curves are related to the composition of the fiber, the preparation processing, the test conditions, etc. The depth of the trap level of the fiber can be deduced from the thermoluminescent curves. Chen
18
calculated the expression of trap level by the peak shape method based on a general dynamic model as follows
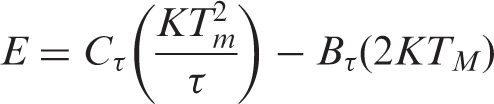


The trap level parameter of luminescent PET fiber with different colors
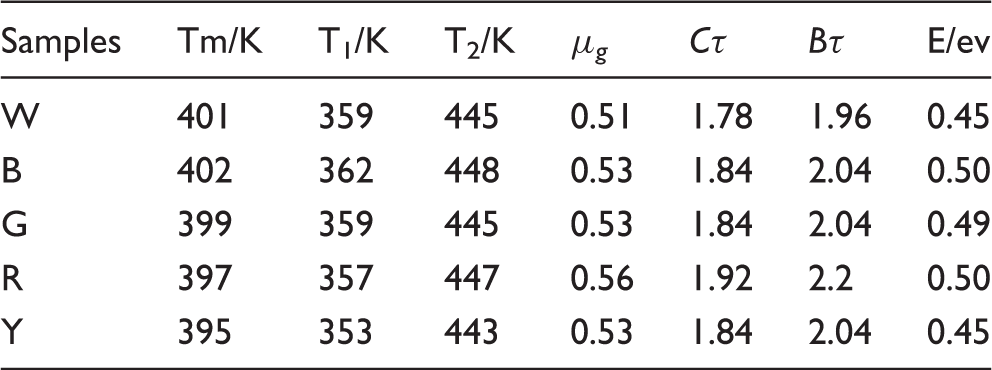
As shown in Table 2, the trap depth of the blue, red and green fibers were a little closer and higher than the trap depth of the white and yellow fibers of 0.45 eV. The thermoluminescent phenomenon was due to the trap level existing in a forbidden band of the captured electrons and holes. With an increase in the temperature of the fiber, the release probability of the electrons and the holes increased, and the luminescence was strengthened. After reaching a certain temperature, the luminescent intensity of the fiber began to weaken. The electrons and the holes of the traps decreased gradually because of their constant release, which created a peak in the pattern of the thermoluminescent spectra. When the temperature was higher, corresponding trap level was deeper.
When the energy E of the electrons released from the trap was lower, the luminescent probability of the electrons escaping from the trap and combining with the luminescence center was higher. According to the temperature of the thermoluminescent peaks in the figure, it can be estimated that the trap level of the fibers preliminarily belonged to a deeper trap. The results from Table 2 show that the E values of the white, yellow and green luminescent fibers are slightly less than that of the blue and red fibers, which led to the electrons in the trap releasing easily and obtained the high luminescent brightness. This result can be verified from the afterglow decay curves of the luminescent PET fibers with different colors. It was reported that the temperature of the thermoluminescent peak located in the range of 323–383 K, corresponding to the trap, was suitable for generating the phenomenon of long afterglow. For this reason, suitable trap depth played an important role in acquiring excellent long afterglow characteristics for the fiber.
Conclusion
The phase structures of SrAl2O4: Eu2+, Dy3+ and the luminescent fibers were not affected or destroyed during the complex manufacturing process used in the study of afterglow and thermoluminescence characteristics. The content of SrAl2O4: Eu2+, Dy3+ in the fiber influenced the initial afterglow brightness of the fiber but had no distinct connection with the afterglow life. When the content of the SAOED in the fiber is 4–10 wt%, luminescent PET fibers, possessing good spinning characteristics, would meet the needs for practical product applications. The polymer matrix has reflection, scattering, absorption and refracted effects on light, with the result that the exciting light was not absorbed by the fiber efficiently during the excitation process, and the emission light generated from the luminescence particles in the PET matrix was consumed to some degree during the emission process in the fiber because of the existence of the fiber-forming polymer. Therefore, it was concluded that the initial afterglow brightness of the SrAl2O4: Eu2+, Dy3+ phosphor was much higher than that of the luminescent PET fiber. Inorganic pigments had little impact on the afterglow decay laws, but the initial afterglow brightness of the samples was different to some degree. In a declining initial afterglow brightness order, the fibers were white, green, yellow, blue and red. When the contrast of the hue of the pigment and the colored light of the fiber is closer, the afterglow brightness of the fiber is higher. The excitation time had an influence on the initial afterglow brightness and the attenuation time of the fiber to some extent, but it scarcely changed the law of afterglow decay. When the excitation time was shorter, the duration was longer. Increasing the excitation time did not prolong the afterglow life effectively. The inorganic pigments affected the luminescent intensity of the thermoluminescent peak. The E values of the white, yellow and green luminescent fibers were relatively lower than that of the blue and red luminescent fibers, which basically coincided with the results of the afterglow curves.
Footnotes
Funding
The work was supported by the National High-tech Research and Development Program of China (863 Program, No. 2012AA030313) and the National Natural Science Fund (No. 21171074/B010201).