
Abstract
Fibrous textile materials are widely used in acoustic applications. However, the absorption of lower-frequency sound is problematic with fibrous material made up of coarser fibers. For this reason sound absorption materials effective at low frequencies are required. For low-frequency sound absorption the energy of sonic waves is absorbed by a thin nanofibrous layer in accordance with the principle of membrane resonance. This study deals with the acoustic behavior of a nanofibrous resonant membrane produced by needleless electrospinning. Using an experimental set-up involving a high-speed camera, it was attempted to predict the sound absorption behavior of a PVA nanofibrous membrane by determining its resonance frequency. The findings were compared with those from a homogeneous membrane structure in the form of a foil.
Although studies on the acoustic application of textile materials started in the nineties, the use of nanofibrous membranes in this field is almost new and is open to the development of functional materials. Nanofiber membranes offer a competitive advantage since they can improve acoustic insulation by increasing their sound absorption coefficient at reduced thickness and weight. As the absorption of lower frequency sound is problematic with fibrous structures made up of relatively coarse fibers,1–4 highly efficient sound absorption materials derived from finer fibers are required.
Despite the fact that such structures have been employed in acoustic applications for some time, there have relatively few reports on the acoustic properties of nanofibrous membranes. Those that have appeared suggest that nanofibrous materials can be highly efficient sound absorbers. Kalinova has demonstrated that the resonance frequency of polyvinyl alcohol (PVA) nanofibrous acoustic membranes decreases with increasing mass per unit area and average diameter of the nanofibers. 5 In the mentioned study, the sound absorption coefficient and transmission loss of the membranes has been measured and the data used to determine the resonance frequency of the membranes. Other studies by this researcher have shown that for low-frequency absorption, structures based on the resonance principle allow acoustic energy to be dissipated as thermal energy.6,7
Kalinova has also studied the sound absorption properties of PVA nanofibrous membranes of different structures. 8 Water vapor was applied for between 10 and 120 s to the surface of a nanolayer in order to change the structure of the membrane. In addition, the sound absorption coefficients of thin PVA nanofibrous membranes and a thin foil were compared. The results showed that the sound absorption curves for a nanofibrous PVA membrane and those for a thin polymeric foil were analogous. Furthermore, as the duration of the application of water vapor to the layer of PVA nanofibers was increased, the number of localities of different mass caused by dissolved and merged fibers increased and this might affect the resonance frequency of the membrane. Each area of the membrane resonates at a slightly different frequency, and an increase in the range of the sound absorption can be detected. In an earlier study, a comparison of the sound absorption behavior of a nanofibrous layer and a polyethylene foil of similar mass per unit area revealed that the nanofibrous layer had a higher sound absorption coefficient than the foil. Moreover, an increase in mass per unit area and in the air gap between the membrane and a rigid wall provided an increase in sound absorption coefficient. 9
In another study on the acoustic behavior of nanofibers, the acoustic damping properties of electrospun polyacrylonitrile (PAN) nanofibrous membranes of different thickness and porosity was investigated. 10 This indicated that with an increase in the back cavity or the thickness of the membranes the first resonance absorption frequency of nanofibrous membranes was shifted to a lower frequency. Additionally, the sound absorption of a perforated panel could be greatly improved by combining it with a thin membrane of PAN nanofibers. Traditional acoustic dampening materials (foam, fiber) coated with nanofibrous membranes have better acoustic performance than uncoated materials in the low and medium frequency range. These results confirm that a PAN nanofibrous membrane can be effective for noise reduction.
There has also been a theoretical study on the sound absorption characteristics of a membrane-type sound absorber. 11 In this study a closed-form analytical solution for the sound absorption coefficient of an infinite membrane with an air-back cavity was developed, and the effect of the parameters of the sound absorption system was discussed in the light of the results. In addition, a method of predicting the peak frequency and value of the oblique-incidence absorption coefficient of a membrane-type sound absorber was indicated.
In a study of the resonant tectorial membrane motion in the inner ear, its vibration has been measured in two orthogonal directions using a novel technique combining laser interferometry and a photodiode. 12 It was concluded that the resonant motion of the tectorial membrane was due to parallel resonance between the membrane and the compliance of the stereocilia of the outer hair cells.
Lee and Joo investigated the resonant panel effect on the sound absorption of nonwovens, and demonstrated that panels of polypropylene (PP) film and foil placed in front of a nonwoven promoted sound absorption in the lower and middle frequency regions. 13 Sound pressure causes the surface of the PP film to vibrate, absorbing sound energy as vibrational and frictional energy.
In view of the literature cited, resonance frequency appears to be a reliable indicator for studying the energy absorptive tendency of an acoustic system. On the other hand, a nanofiber layer acting as a resonant membrane in a sound absorption field exhibits a unique acoustic behavior.5–10 In the present study a novel optical method for predicting the sound absorption behavior of membranes has now been developed for determining the frequency of a PVA nanofiber membrane. Four different experimental set-ups were adopted, and the findings were compared with a homogenous membrane in the form of a foil.
Experimental
Materials
PVA was adopted for the production of a nanofiber membrane since it has been shown to be highly effective as a sound absorber.5–9 Moreover, it has good water solubility, an important factor in the formation of a nanofibrous membrane. A 12.8% v/v aqueous solution of PVA (Mw = 80,000–100,000 g mol−1) was prepared and 6% v/v glyoxal and 3% v/v phosphoric acid (percentages based on PVA) were added as crosslinking agents. The solution was stirred vigorously at room temperature. The proportions were based on the recipe proposed by Eva et al, 14 but using a higher proportion of crosslinking agent.
Production of the nanofiber membrane
For the nanofiber membrane preparation, a modified electrospinning method was adopted in which a metal roller conveys the polymer solution to a collector.
15
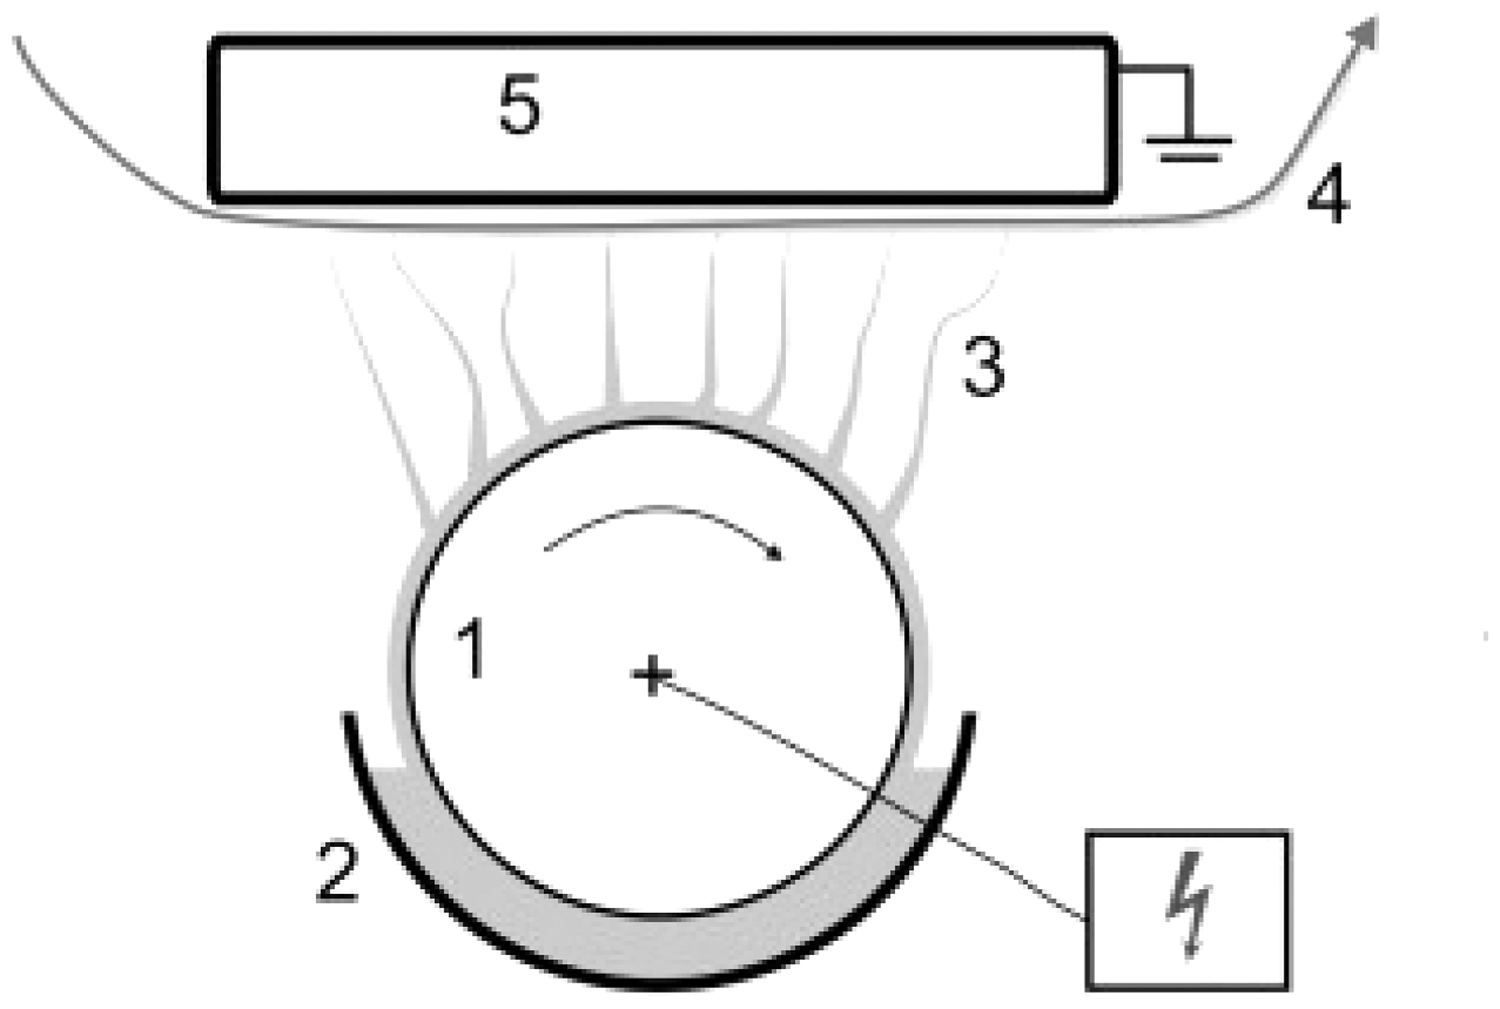
Figure 1 illustrates the production of electrospun fibers from the surface of the metal roll. The nanofibers are collected on a support material.
Modified electrospinning method: 1. metal roller, positively charged; 2. reservoir of polymer solution; 3. direction of fiber formation; 4. nonwoven support material for conveying nanofibers; 5. grounded collector.
16
Optimum process conditions for the spinning process were established, such as the distance between the electrodes and the applied voltage. Niu et al. found that the minimum collection distance from the PVA solution was 11 cm. 17 A cylinder spinneret has different critical voltages for electrospinning and an increase from 47 to 62 kV had little effect on average fiber diameter. For successful upward needleless electrospinning, a balance has to be struck between the applied voltage and the collection distance. In the present study, the distance between the surface of the roll and the collector was 12 cm and the voltage was 50 kV, giving optimal production of electrospun PVA nanofibers. A relative humidity of 34% and room temperature of 19℃ were maintained throughout. The final layer of fiber was cross-linked in hot air at 140℃ for 5 min.
The mass per unit area of the nanofibrous membrane was 25 g m−2. In order to compare the resonance frequencies of the nanofibrous membrane with that of a homogeneous membrane, a foil with similar mass per unit area (25 g m−2) was produced. Since single type of nanofibrous membrane was compared to the foil only, details such as thickness, density and porosity were disregarded.
Characterization
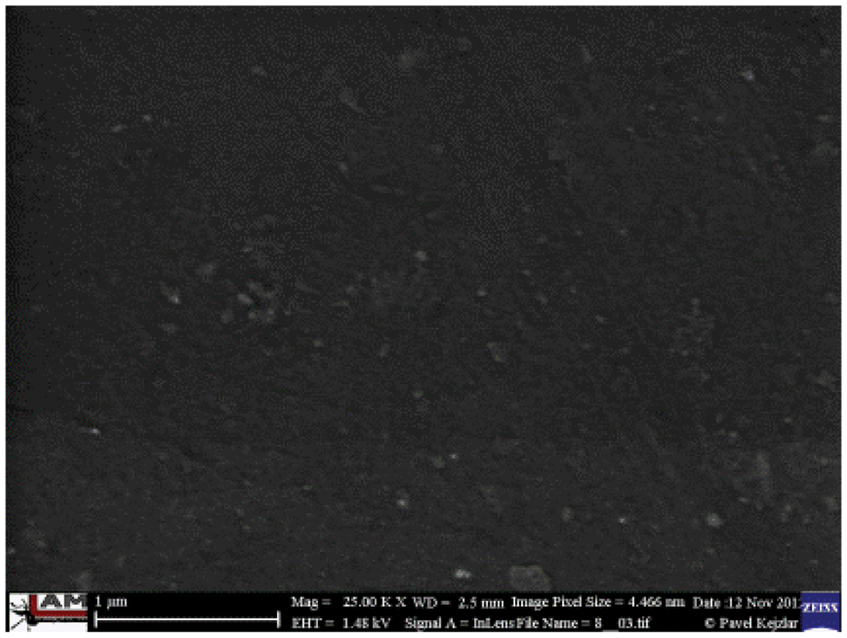
The surface and structure of the membrane and the diameter of the electrospun PVA fibers were determined using a scanning electron microscope (SEM). A small section of the fiber mat was placed on the SEM sample holder and sputter-coated with gold (Quorum Q150R rotary-pumped sputter coater). A Carl Zeiss Ultra Plus Field Emission SEM with an accelerating voltage of 1.48 kV was used for the SEM photographs. The average fiber diameter was calculated from the SEM images using image analysis software (NIS Elements BR 3.2). More than 100 fibers were counted from at least four SEM images from different areas of the sample. The average diameter of the PVA nanofiber membrane was found to be 230 ± 100 nm; the diameter distribution is shown in Figure 2. The surface and structure of the foil were similarly examined by SEM.
Diameter distribution of PVA nanofibers.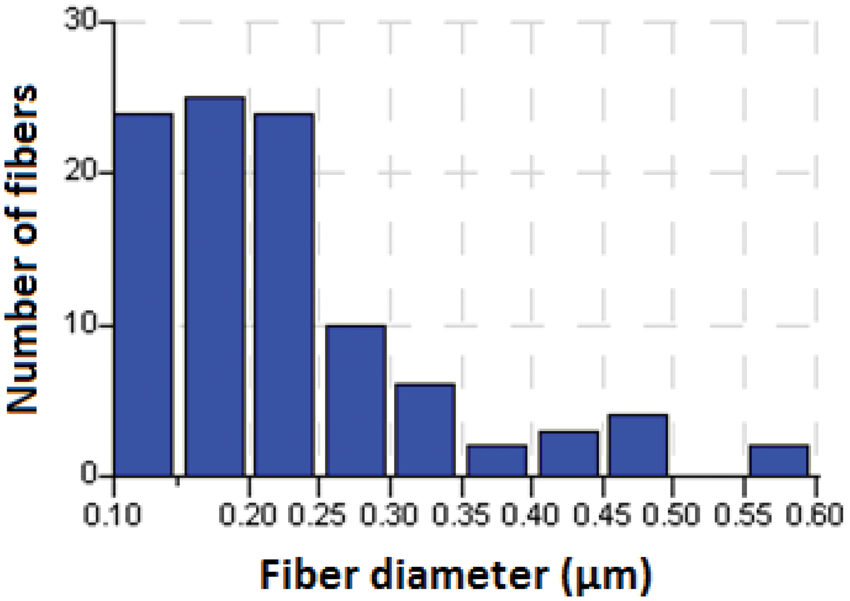
Optical method for determination of resonance frequency
The main components of the experimental study were a digital camera (Olympus System i–SPEED2), an 8.4” LCD display panel and a transparent tube 10 cm in diameter (Figure 3). A speed of 3000 frames sec−1 was employed at a preset resolution of 800 × 600 pixels. A mark was applied to the center of each sample to help focus the camera lens.
The measuring system.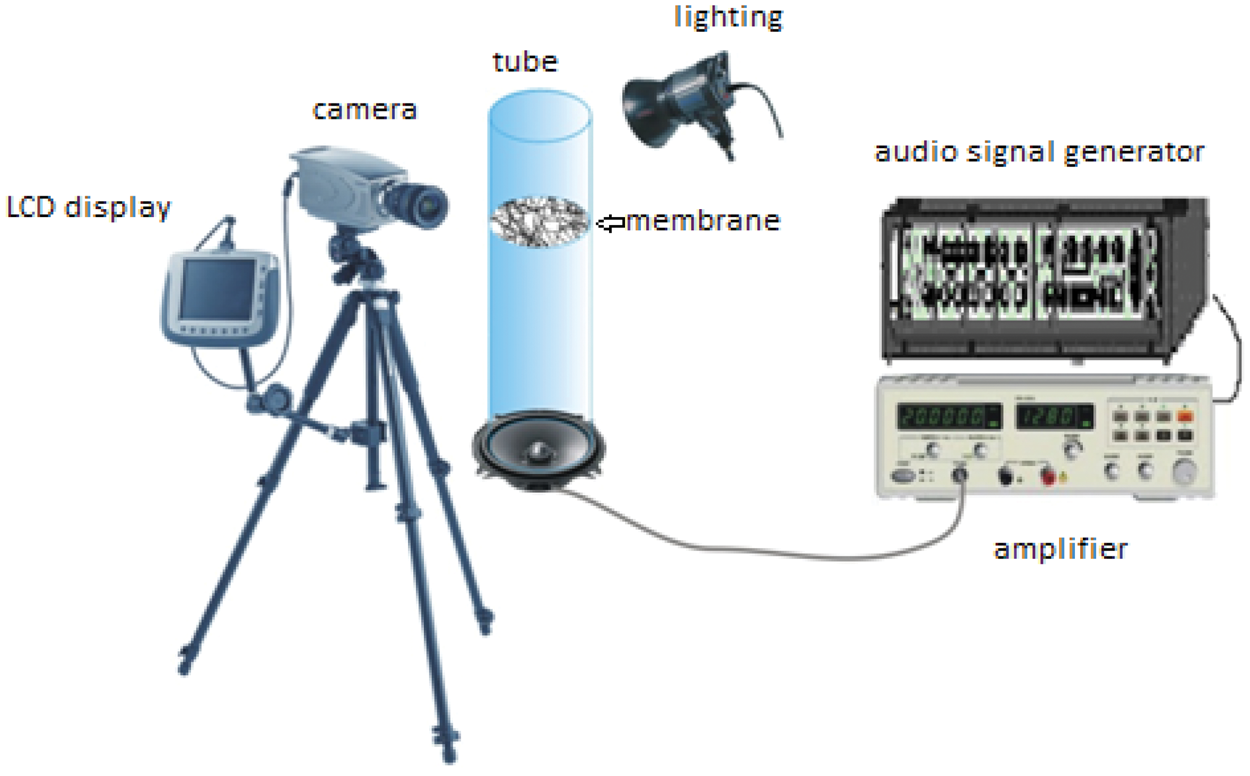
The test sample was mounted inside the tube. An incident plane sinusoidal sound wave was created using a speaker located at end of the tube. The membrane began to oscillate under the impact of the sound waves, and its movement was picked up by the high-speed digital camera, and in turn displayed on the LCD.
The sound waves caused vibration in the resonant nanofibrous system. At the resonance frequency, the acoustic energy was partially converted to kinetic energy, and the remainder was converted to other frequencies.
Figure 4 shows the distribution of the vibrational displacements for the first three symmetrical modes of a circular membrane.
18
The displacements for the first three symmetrical modes of a circular membrane.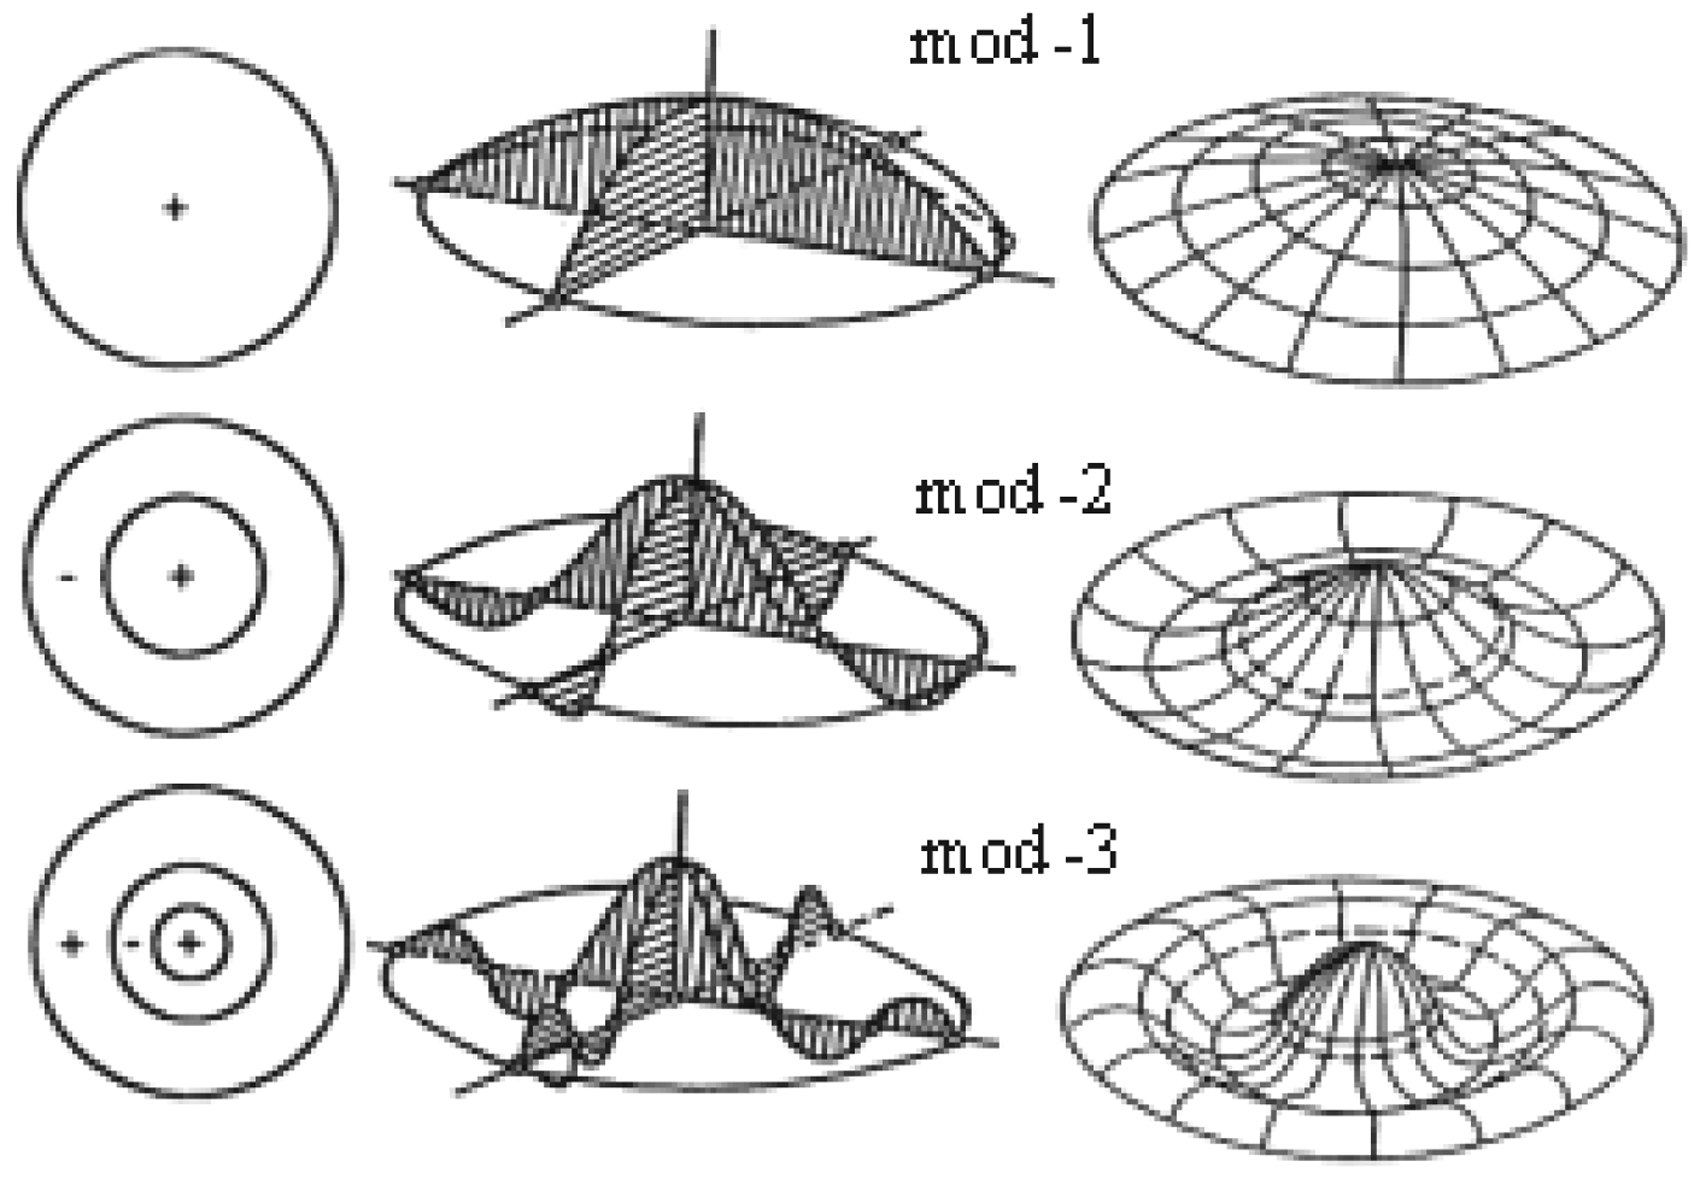
A vibrational mode is characterized by its modal frequency and mode shape, and is numbered according to the number of half waves in the vibration. Each mode is entirely independent of the other modes, and each has a different frequency (the lower modes having lower frequency) and different mode shapes. A node is a point (or a line) on a structure that does not move as the rest of the structure is vibrating.
The mode number mod–1 is designated (0,1) since there are no nodal diameters but one circular node (the outside edge). The (0,2) mode, named mod–2 in Figure 4, has no diameter nodes, but has two circular nodes, one at the outside edge and another at a distance of 0.436 a (a being the radius of the circular membrane) from the center of the membrane. The frequency of the (0,2) mode is 2.295 times the frequency of the (0,1) mode. The (0,3) mode has three circular nodes, but no diameter nodes. The frequency of the (0,3) mode is 3.598 times the frequency of the (0,1) mode. Like the (0,1) and (0,2) modes, the (0,3) mode is excited when the membrane is struck at the center. 19
In order to determine the resonance frequency of both the membrane and the foil, a frequency range 0–1500 Hz was studied by taking measurements at every 20 Hz, to obtain a rough estimate of the resonance frequency. The deflection size of the samples (nanofibrous membrane and foil) at a frequency range 0–1500 Hz was measured using the experimental settings given below:
Setting 1: Open tube (one end of the tube is open). Setting 2: Closed tube (the tube closed with a rigid plate). Setting 3: Open tube with a 0.5387 g weight hung on the sample, and then immediately removed to create a radial tension on the sample while one end of the tube remained open. Setting 4: Closed tube with a 0.5387 g weight hung on the sample, and then immediately removed to create a radial tension on the sample while the tube was closed with a rigid plate.
Results and discussion
Figures 5 and 6 show the surface and structure of electrospun PVA nanofibers and foil, respectively. Some fibers were observed to stick to one another, forming an interconnected fibrous structure. The formation of a bonded fibrous structure was caused by insufficient solvent (water) evaporating at the polymer jets. This is a common observation in PVA membrane production when using the needleless electrospinning process, since it involves a number of jets operating simultaneously in a very limited space.
20
SEM images of PVA nanofibers at magnifications (a) ×1000, (b) ×5000, and (c) ×10,000. SEM image of foil (magnification ×25,000). Deflection of the structures when the tube was open.

The resonance frequencies of the nanofibrous membrane and foil were optically determined by measuring the degree of deflection using a high-speed camera.
The graphs in Figures 7–10 illustrate the total deflection (sum of positive and negative amplitude) of the membrane and foil at different measurement settings. The graph in Figure 7 shows the resonance frequency of both the membrane and foil when tested in the open tube form (setting 1). As may be seen from the graph, the nanofibrous membrane has a maximum deflection (1.6 mm) at 80 Hz, whereas the foil reaches maximum deflection at 100 Hz. The second resonance frequency of both membrane and foil is at 160 Hz, and the third at 400 Hz.
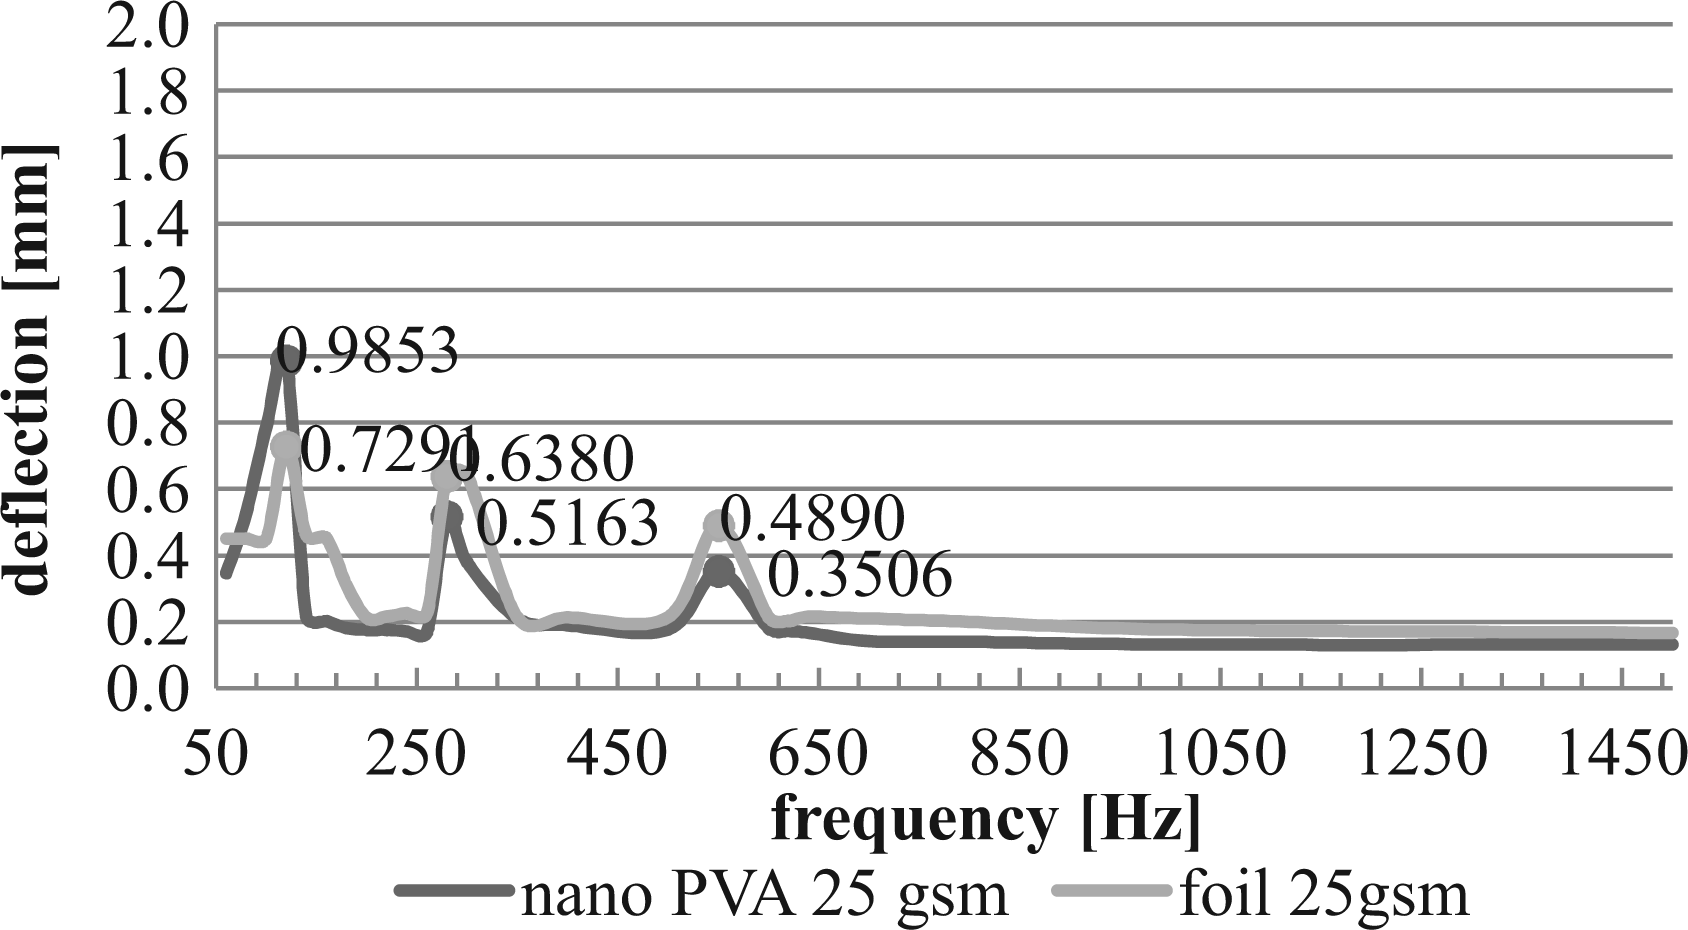
Figure 8 shows the resonance frequency of the structures tested when the tube was closed. It is seen that both the nanofibrous membrane and foil had maximum deflection at 120 Hz. The second resonance frequency for both structures was 280 Hz and the third at 550 Hz.
Deflection of the structures when the tube was closed.
Finally, the deflection curves of both the nanofibrous membrane and foil (Figures 9 and 10) exhibited similar characteristics to those in Figures 7 and 8. The frequency values at maximum deflection were the same, but the degree of deflection increased in the presence of the weight.
Deflection of the structures when the tube was open with weight. Deflection of the structures when the tube was closed with weight.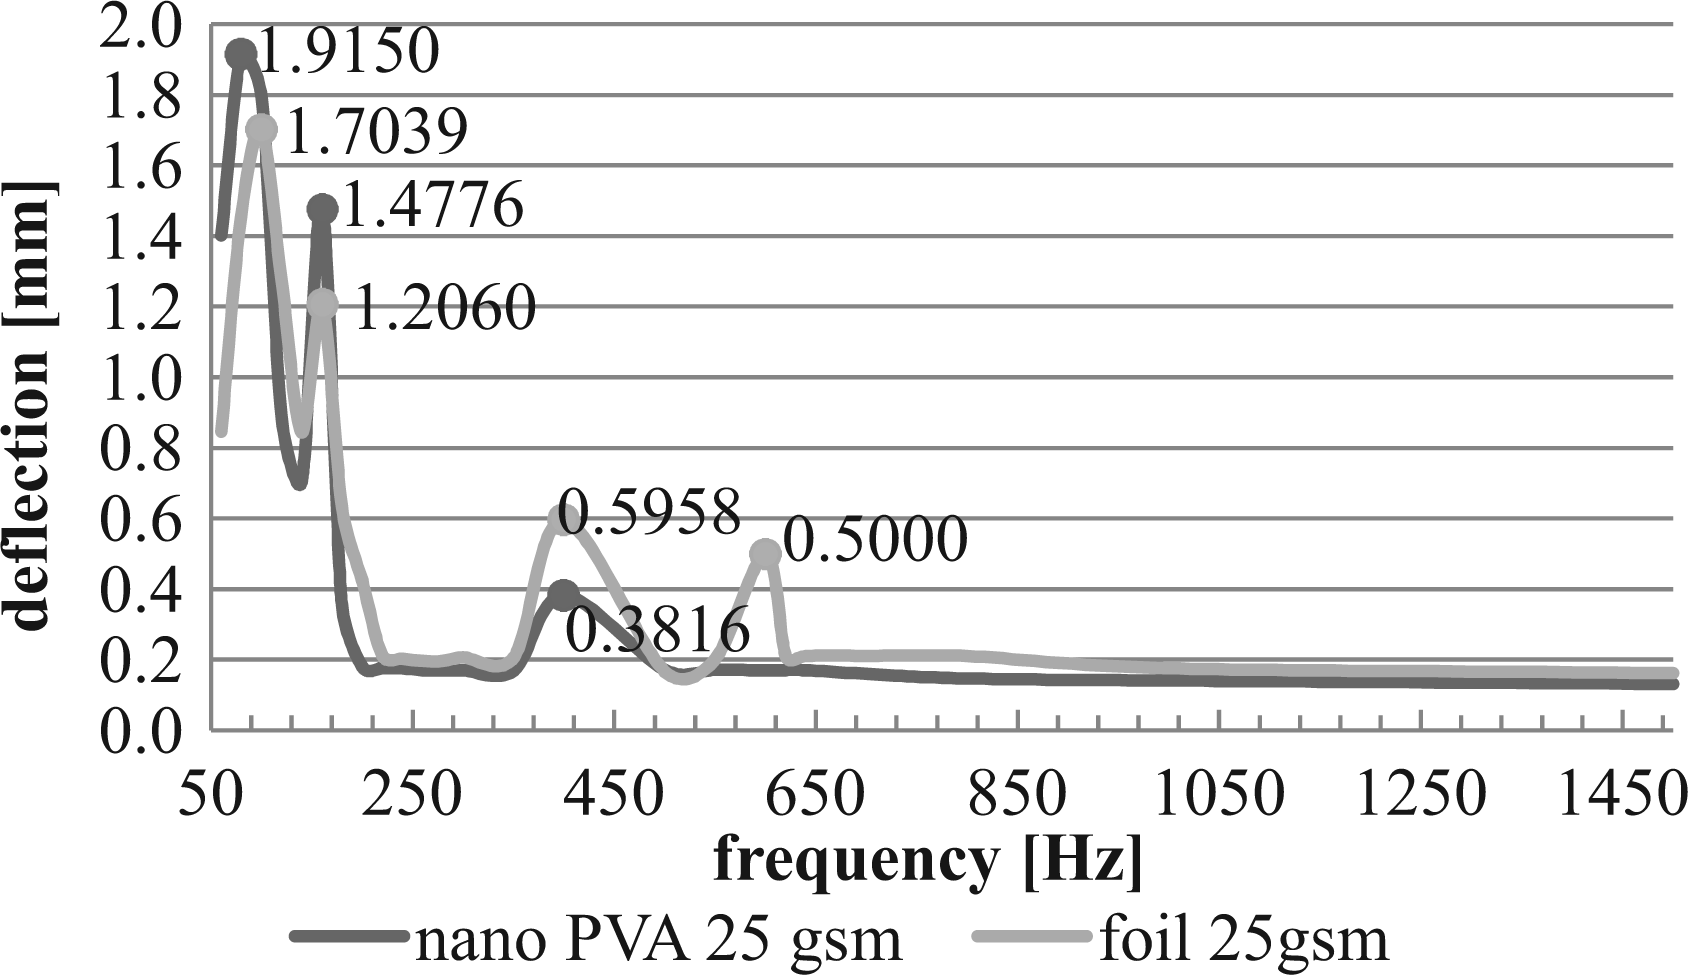
In comparison to the foil of the same weight and similar radial tension, the higher deflection of the nanofibrous membrane at lower frequency ranges (Figures 7 to 10) might be attributed to the higher elasticity of the membrane, resulting in a vibration with higher deflection. However, at higher frequencies it is observed that the deflection of the nanofibrous membrane is lower than for the foil membrane. It should be noted that the center point always vibrates at maximal deflection (deflection peak) at the first resonance frequency for both materials under discussion. At higher resonance frequencies, many more peaks may occur at the same time. However, the heterogeneous structure of the nanofibrous membrane, together with the additional peaks, may have a negative impact on the maximal deflection at higher frequencies.
In the case of the closed tube measurements, the higher resonance frequencies obtained for the membrane and the foil might be due to the resonance frequency of the tube itself. The resonance frequencies of the transparent tube depend on the tube length and can be calculated according to
21

The total length of the tube was 62 cm. Using Equation (1), the first, second and third resonance frequencies of the tube are in turn 277 Hz, 555 Hz, and 832 Hz. The data suggest that the influence of the resonance frequency of the tube on the resonance frequencies of the samples may not be negligible for the measurements made when the tube was closed. This may be partially due to the fact that a closed tube causes the formation of a standing wave in which the node and anti-node locations of the membrane vibrations change, and in turn an increase in the resonance frequency of the membrane is to be expected. This explains the increase in the resonance frequency of both the nanofibrous membrane and the foil in the closed tube (settings 2 and 4).
Apart from this, the amplitude of the deflections was observed to decrease when the tube was closed (settings 2 and 4). The resonance frequency occurs when the deflection is at a maximum. When the tube is closed, its resonance frequency does not coincide with that of the membrane, and in turn the membrane cannot vibrate sufficiently to cause maximum deflection to occur. At settings 3 and 4 (with and without a 0.5387 g weight hung on the sample), an increase was observed in the amplitude measured. Application of tension to the samples might have rendered them slack and more flexible, and consequently they might have vibrated more readily at a wider displacement.
Conclusions
Nanofibrous membranes have the advantage that they can improve the acoustic insulation performance of products by increasing their sound absorption coefficient at a reduced thickness and decreased weight. In the present study the aim was to predict the sound absorption behavior of a PVA nanofibrous membrane by determining its resonance frequency. In doing so, the experimental set-up enabled the determination of the resonance frequency of the nanofibrous membrane by measuring the size of deflection with the help of a high-speed camera. For comparison a foil was included, representing a homogeneous membrane structure. The data obtained revealed that the resonance frequency of both the nanofibrous membrane and the foil increased in the setting involving the closed tube. Furthermore, the amplitude increased when radial tension was applied to the sample in the closed tube. The nanofibrous membrane also showed higher deflection than the foil at lower frequency ranges.
It has been demonstrated that the resonance frequency of membranes can be determined using the set-up described. Based on the data obtained from the present study, a further study is underway which will focus on modeling a possible relationship between sound absorption coefficient and resonance frequency using nanofibrous membranes with different characteristics.
Footnotes
Funding
The study was supported in part by Project, OP VaVpI Centre for Nanomaterials, Advanced Technologies and Innovation, CZ.1.05/2.1.00/01.0005. The authors also wish to thank TUBITAK for support given to the project under the framework of the TUBITAK 2214 Program.