
Abstract
Research into new textile transmission lines is currently being conducted. Thanks to the flexibility of textile material used for their construction, these lines can become elements of a textronic system incorporated in modern smart garments to considerably enhance the comfort of its use. Textile transmission lines are required, however, to meet some specific requirements. A properly designed line should assure the minimum of signal losses and reflections. The normalized characteristic impedance of lines is assumed to be 50 ohms. This paper presents a new type of textile transmission lines. A method for measuring the line impedance is discussed. The construction of a measuring stand to be used for testing the electric properties of textile transmission lines is shown. Using artificial neural networks, a model for selected electric properties of textile transmission lines was obtained. The results of a sensibility analysis carried out based on the three-layer perceptron indicates a significant influence of selected model input quantities, such as the width of the inner conductive path, the distance between paths, path surface resistance, path thickness, and the number of warp and weft yarns occurring in a conductive path on the electric properties of textile transmission lines.
Keywords
The increasing interest in so-called smart garments has resulted in an increased demand for fibrous electronics. An element of each smart garment is transmission lines having the form of conductors connecting individual electronic systems implemented in the garment. In presently manufactured smart garments, conventional electronic elements and circuits and conventional conductors for their interconnection are normally used.1,2 This imparts considerable rigidity to such a garment in the locations of positioning both the electronic elements and the conductors that interconnect them. The progressing digitalization of electronic systems and the constant increase in the frequency of their operation have made the signals transmitted by those systems distinguished by a high-frequency and/or a wide-frequency spectrum. Conventional conductors (transmission lines) used for the transmission of such a type of signal are characterized by a considerable width and rigidity. This largely limits the potential for their use in smart clothing.2–4
A textile transmission line may also be an element of a textronic system in which electronic devices are incorporated in a textile carrier.5,6 For example, this line can connect a medical generator with the textile electrodes of a textronic system for muscle electrostimulation. 7 In such a system, wide-frequency spectrum electric pulses are supplied through a textile transmission line to textile electrodes placed at specific points on the patient's body. To achieve the proper therapeutic effect it is essential that the electric pulse transmitted via the transmission line does not undergo any distortion. This can only be provided by the properly designed transmission line that assures the minimum of signal losses and reflections.
Research is being currently conducted on a new type of transmission line using flexible textile materials, which considerably enhance the comfort of the smart garment user.4,8–11 The textile elements of the transmission line construction are a dielectric substrate and current-conducting paths. The role of the paths can be played by strips cut out from electroconductive flat textiles. The electroconductive properties of textile products are assessed using their electric resistance.12–15
The electric properties of textile transmission lines depend both on the properties of the textiles used (the parameters of the substrate and the paths) and on the transmission line construction itself (transmission line dimensions, conductive path width, path arrangement, the distance between individual paths). A model for selected electric properties of textile transmission lines was developed as a tool in the design of new textile transmission lines characterized by a 50 Ω impedance.
Textile transmission lines
Characteristics of the textile substrate
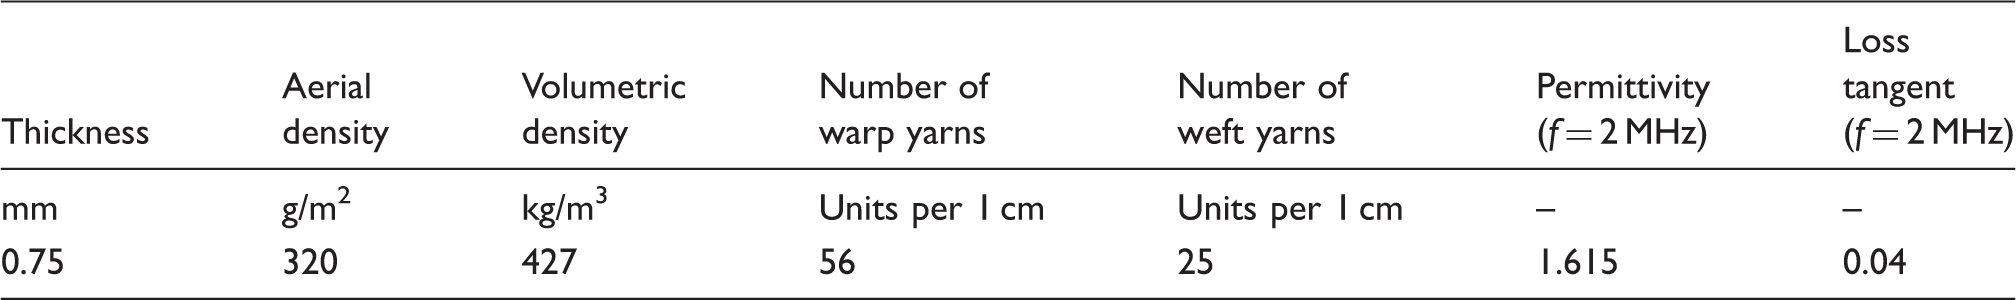
Transmission line paths, in the form of three identical textile strips of nominal dimensions 5 mm × 70 mm, were sewn on the substrate, using a zigzag stitch 6 mm × 5 mm, at a nominal distance of 2 mm from each other (Figure 1) to form the so-called coplanar line composed of a signal path, GND (ground) paths and the substrate. The substrates used for the textile transmission lines were the same for all textile strips.
Construction of the textile transmission line used for testing: 1 – signal path; 2 – GND (ground) paths; 3 – substrate.
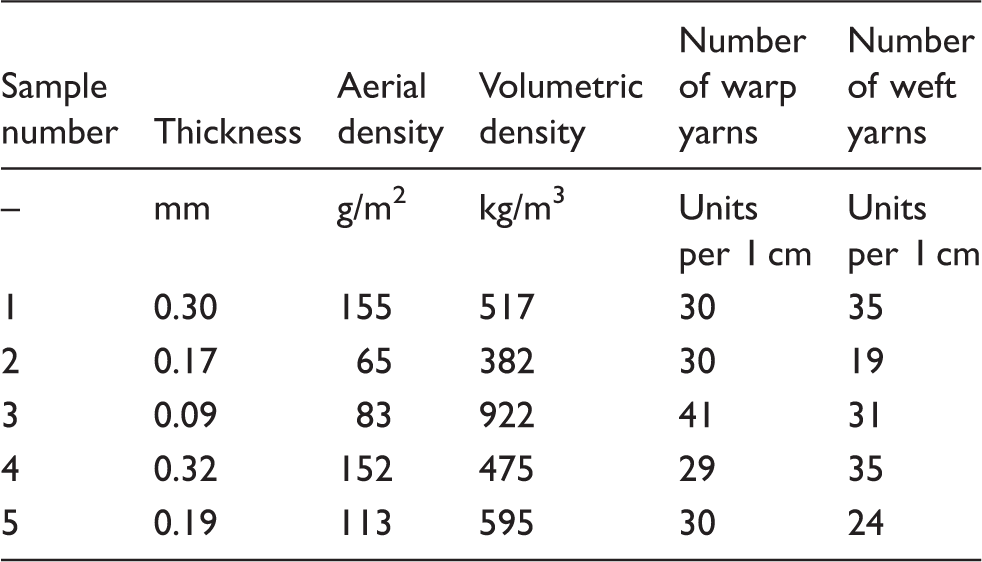
Material properties of the different electroconductive nickel-metallized nylon woven fabrics
In order to determine the suitability of the selected fabrics to be used for conductive paths, their surface resistance was determined based on the four-point measurement method.16,17 Fabric samples in the form of a 70-mm side square were prepared. The samples were cut perpendicular to the yarn arrangement. Cylindrical electrodes of a substrate contact diameter of 4 mm were used for measurements. The electrodes were made of brass and subsequently silver plated. The force of pressure on a single electrode was 0.24 N. The electrodes were arranged on the textile sample surface along both the weft and the warp directions, collinearly, at identical distances from one another, as shown in Figure 2 (arrow indicates warp direction). The two outermost electrodes were connected to a current source (see Figure 2). Current I is measured by a DC Power Supply Agilent E3644A meter (see Figure 2). To measure the voltage drop, the two inner electrodes were connected to the Agilent 34410A multimeter (see Figure 2). The measurements were conducted by forcing the flow of current of an intensity of 50 mA and taking the reading after 30 s after applying the voltage electrodes. The tests were conducted under ambient conditions (a temperature of 25.5℃ and a relative air humidity of 31%). Each measurement was repeated three times. The surface resistance was calculated for each electroconductive fabric sample while distinguishing the direction of electrode arrangement relative to the yarn system. The value of surface resistance is expressed in Ω/□, which means that the resistance of a sample with different dimensions can be different.
The manner of electrode arrangement on the sample surface: 1 – electrodes; 2 –textile sample surface; 3 – current source; 4 – direct current power supply; 5 – multimeter.
Surface resistance of electroconductive square-shaped fabric samples
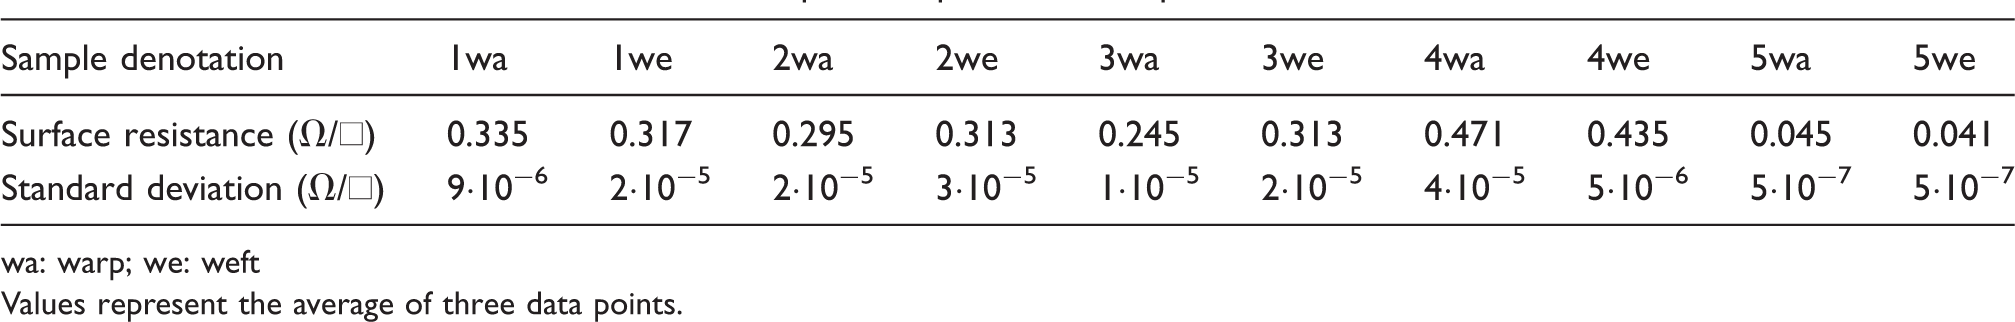
wa: warp; we: weft
Values represent the average of three data points.
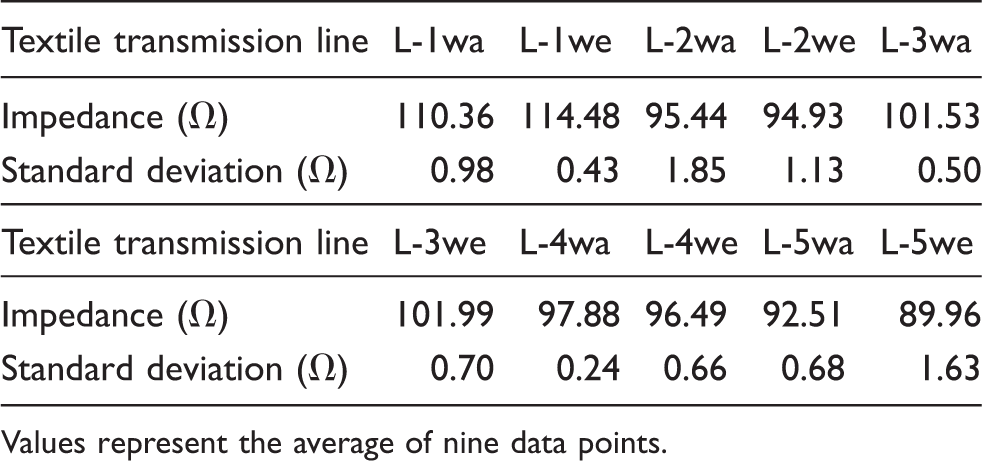
Surface resistance values below 1 Ω/□ indicate good electroconductive properties of the fabrics. Therefore, all of the tested fabrics were used to form the conductive paths of the transmission lines. From each fabric three strips cut out along the weft yarns and three strips cut out along the warp yarns were prepared. The same strips (one signal path and two GND paths, see Figure 1) cut from the same fabric and in the same fabric direction were subsequently sewed on the same textile substrates In total, 10 different textile transmission lines were prepared for testing. The textile transmission lines were designated as follows: L-1wa, L-1we, L-2wa, L-2we, L-3wa, L-3we, L-4wa, L-4we, L-5wa, and L-5we, where the number corresponds to the electroconductive sample number (Table 2) and ‘wa’ means warp fabric direction, while ‘we’ means weft fabric direction in which the strip was cut.
Methodology of determination of transmission line impedance
The adopted methodology for determining the line impedance relies on the reflectometry method, known also as the TDR method.18–20 The method involves applying a voltage step to the input of the transmission line under testing and measuring the voltage variation oscillations at the line input using a fast oscilloscope, the so-called sampling oscilloscope. Deviations of the characteristic line impedance from the normalized value equal to 50 Ω cause the formation of a reflected voltage wave which, by superimposing onto the incident wave, returns to the line input, influencing the voltage value measured by the oscilloscope. From the obtained variations in voltage at the line input, it is possible to determine the variation in the characteristic impedance of the transmission line tested as a function of time. In turn, the variation of the characteristic impedance as a function of time can be converted into its variation as a function of the distance from the beginning of the line.
For the purpose of carrying out the tests of the textile transmission lines, a measuring stand was built. Two terminals are provided on the base, which allow the connection of a textile line to be tested. The terminals are connected to a Tektronix DS8200 sampling oscilloscope using a high-frequency coaxial cable (see Figure 3).
The measuring stand for line impedance measurement: 1 – base of stand; 2 – terminals; 3 – textile line; 4 – high-frequency coaxial cable; 5 – sampling oscilloscope.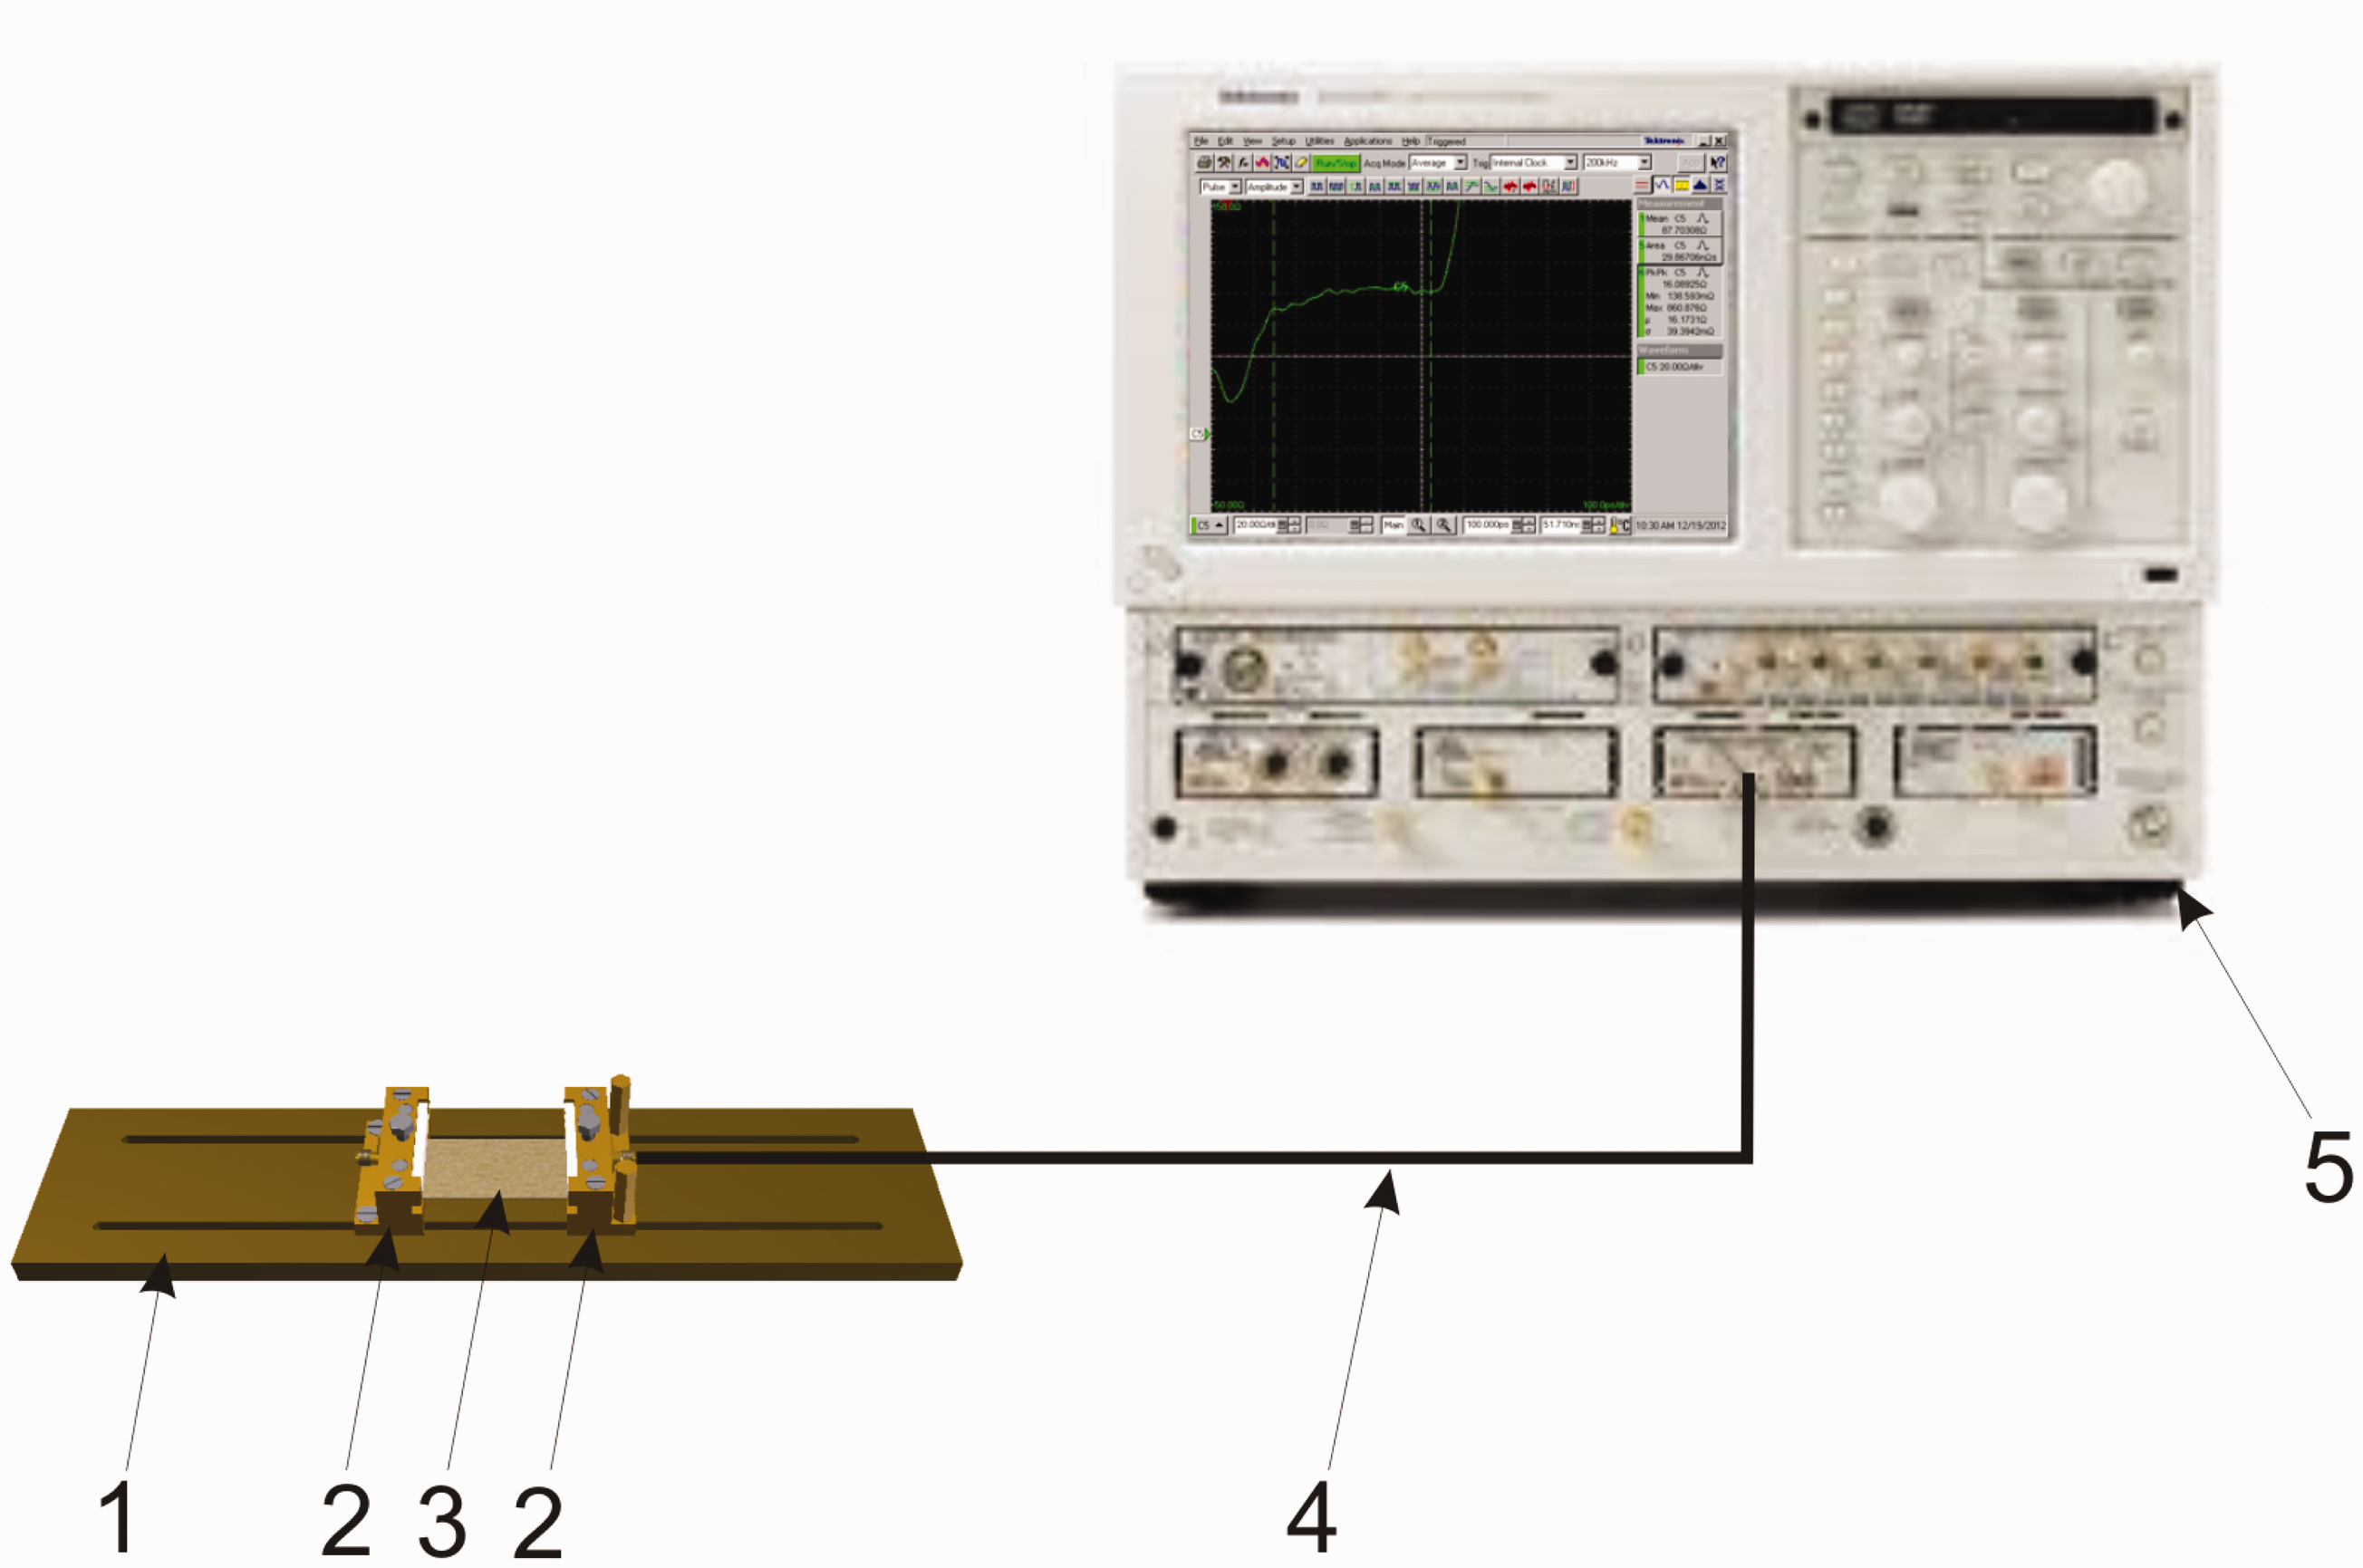
The terminals enable the test textile line to be connected to the measuring apparatus furnished with coaxial connectors in a stable and repeatable manner. At the same time, fixing the line between the connecters prevents its elements from contacting the base, which minimizes the influence of the base on the line parameters.
An example impedance profile of a textile transmission line L-5wa (Table 4) is shown in Figure 4.
An example impedance profile of a textile line L-5wa. The average values of the modulus of the transmission line impedance Values represent the average of nine data points.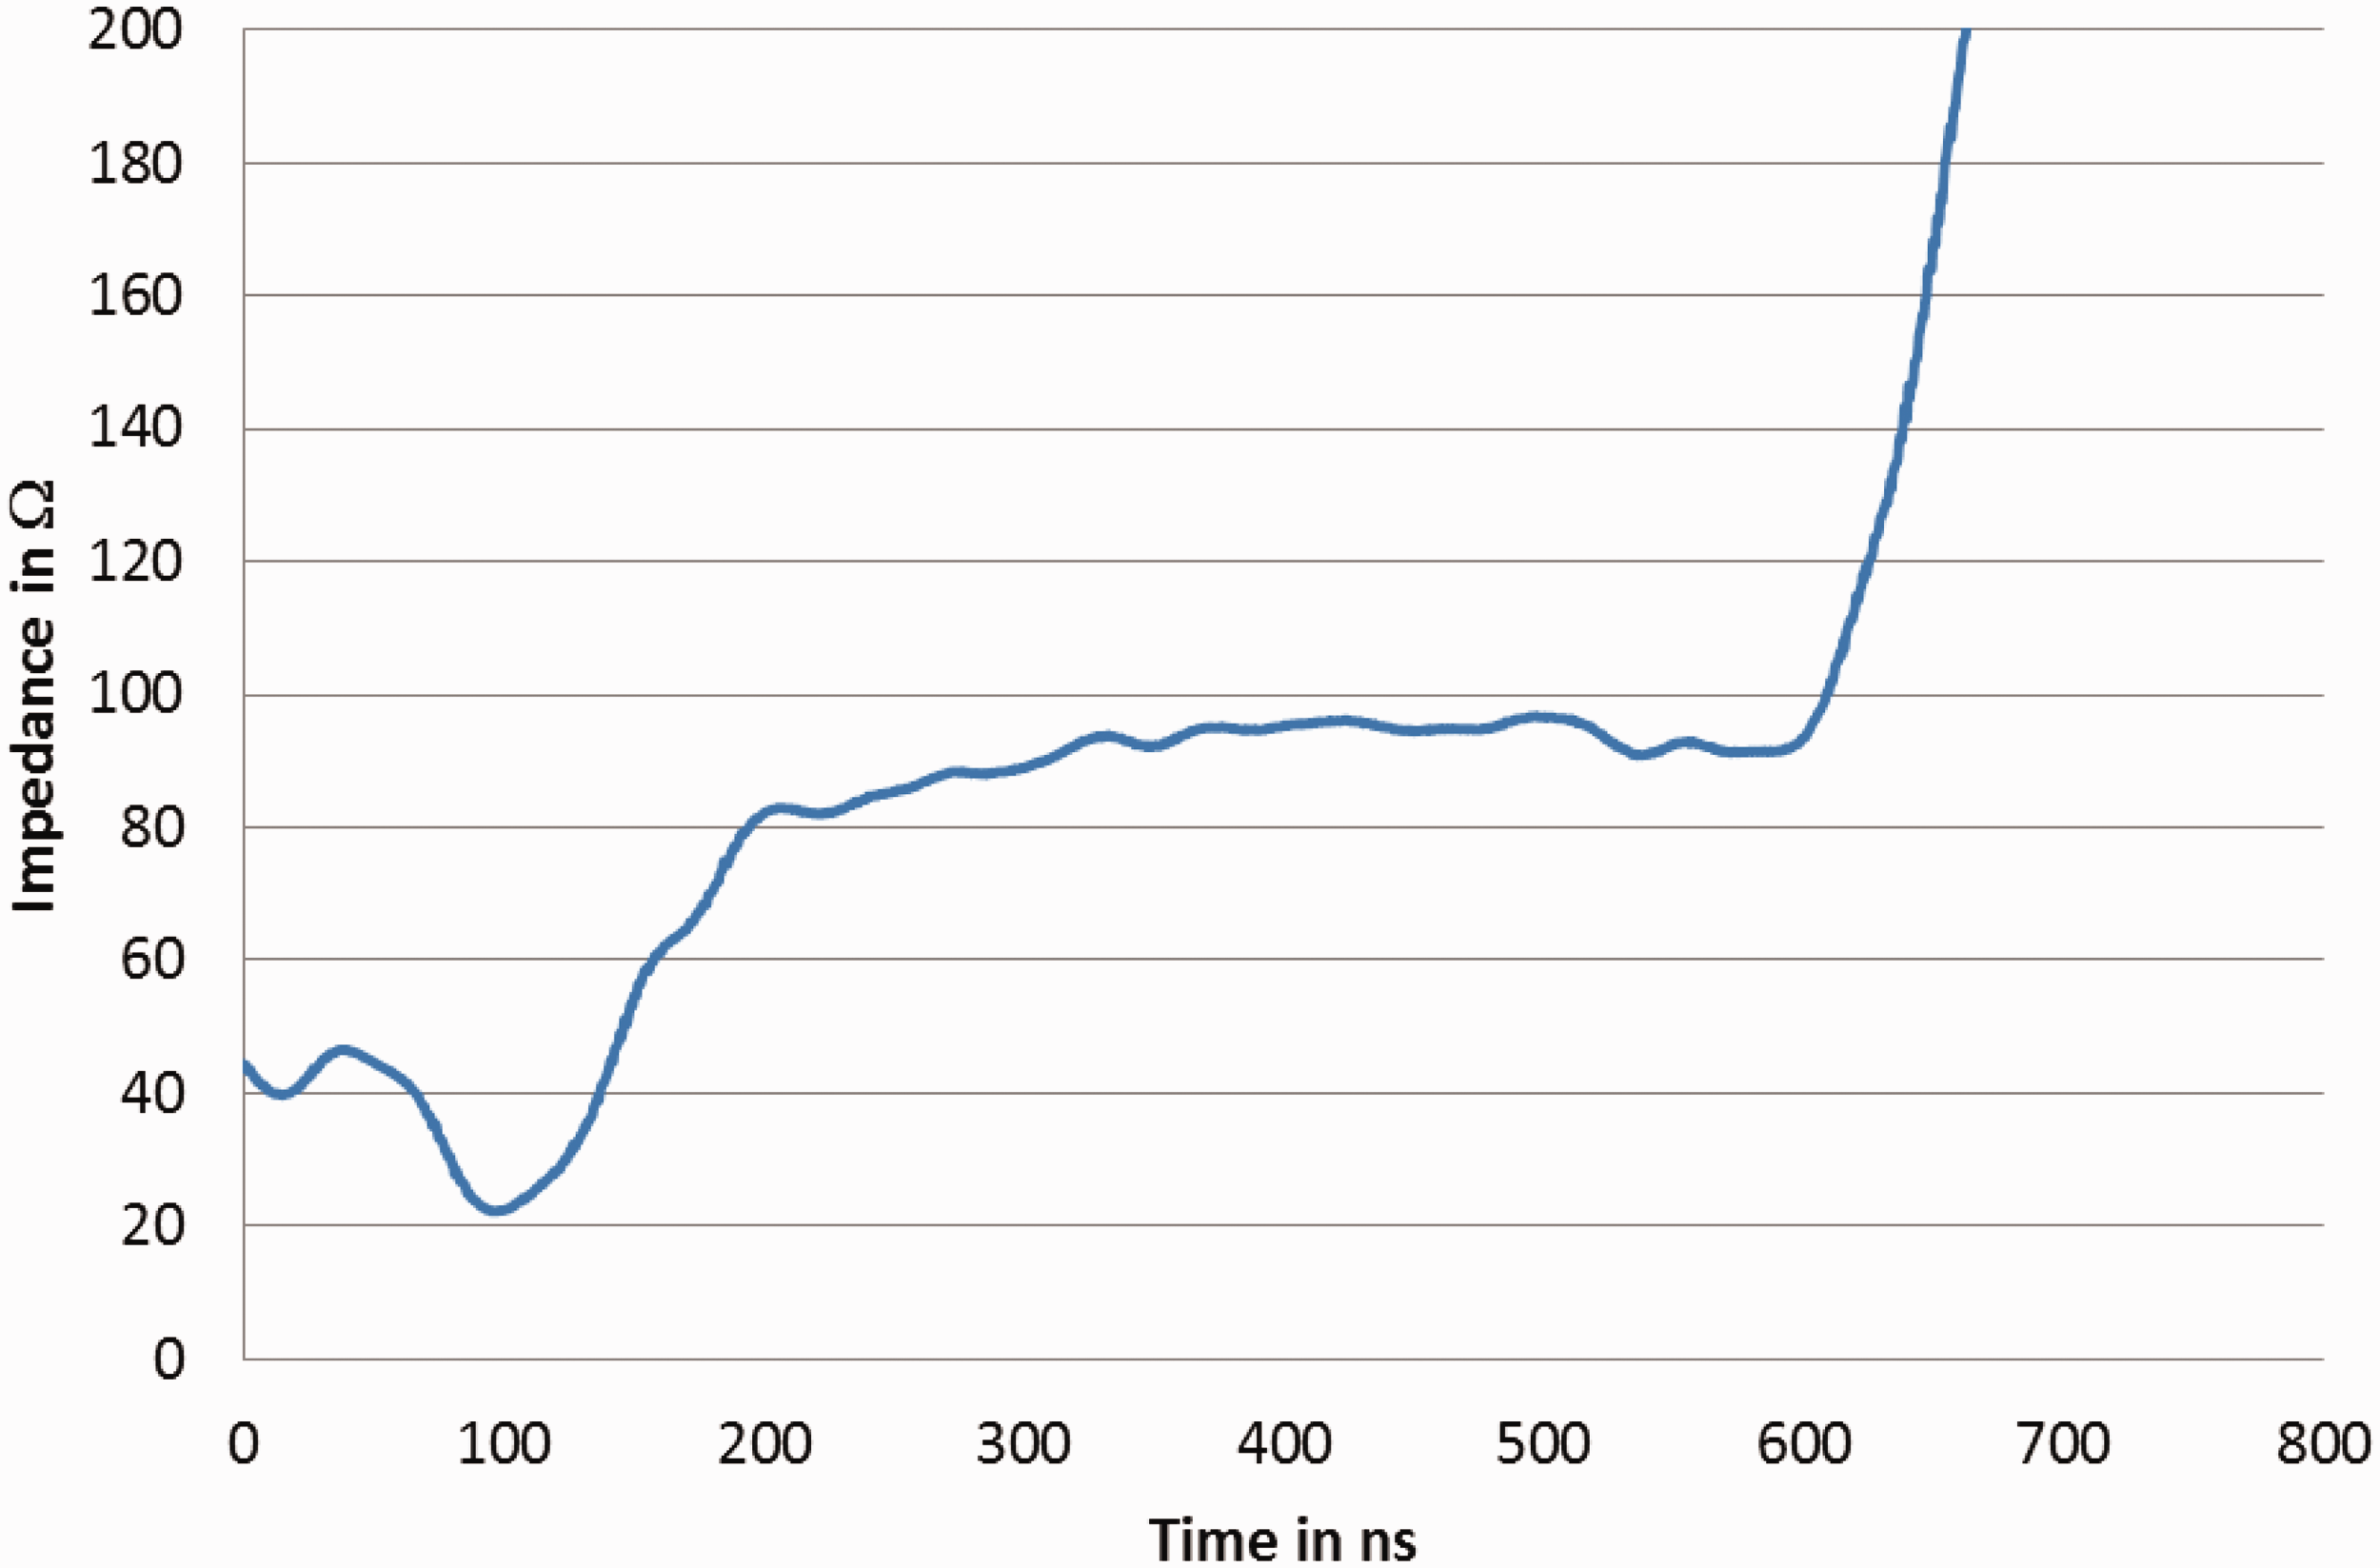
In the time interval of [0; 200) ns, the visible impedance variation is associated with the terminal connecting the line being tested. The proper impedance variation of the test line is contained within the time interval of [200, 600] ns. For the time of t > 600 ns, on the other hand, an increase in impedance value to infinity can be observed, which is caused by the absence of a load at the end of the line.
The average values of the modulus of the transmission line impedance received for textile transmission lines in the time interval of [200, 600] ns are presented in Table 4. Each measurement was repeated nine times. The standard deviation of measurement results are also given in Table 4.
The qualitative model of textile transmission lines
The aim of the undertaken research is to determine the influence of selected input quantities on the electric properties of textile transmission lines. For this purpose, a qualitative textile transmission line model was defined by establishing the elements of the set of input, output, constant quantities, and disturbances.21,22
The set of input quantities is made up of the following:
the real, average width of the inner conductive path, W; the real, average distance between the inner path and the outer (GND) paths, D; the conductive path surface resistance, Rs, being the average resistance determined for three strips identically cut out from electroconductive fabric; using the four-point method and maintaining the identical measurement conditions, the surface resistance of the strips was determined again and expressed in Ω/□ because this value depends on surface area of the sample; each measurement was repeated nine times to obtain a coefficient of variation that did not exceed 4%; the conductive path thickness, T, being the thickness of the fabric from which the strip has been cut (Table 2); the number of warp yarns, Nwa, occurring in the conductive path; for a fabric strip cut out along the warp yarns, Nwa is half the number of yarns per 1 cm of the sample (Table 2); for strips cut out along the weft yarns, Nwa is sevenfold the number of warp yarns per 1 cm of the sample (Table 2); the number of weft yarns Nwe, occurring in the conductive path; for a fabric strip cut out along the warp yarns, Nwe is sevenfold the number of weft yarns per 1 cm of the sample (Table 2); for strips cut out along the weft yarns, Nwe is half the number of weft yarns per 1 cm of the sample (Table 2). Input quantity variability ranges
The lower and upper limits of the range of variability of the selected input quantities of the qualitative textile transmission line model are summarized in Table 5. The ranges of variability specified for selected input quantities were determined on the basis of performance measurements.

The electric properties of the textile transmission lines were determined using two output quantities. The output quantity A (in Ω) is defined by the following formula:

The output quantity S (in Ω) is defined by the following relationship:
The output quantity A is a measure of the difference between the ideal line characteristic impedance being equal to 50 Ω and the tested textile transmission line impedance. This difference determines the fitting of the line to the transmitting and the receiving systems existing at the respective end of the line. This fitting, in turn, influences the value of occurring reflections of the transmitted signal at the contacts between the transmitter (receiver) and the line. The textile transmission lines prepared for testing exhibited an impedance from 80 to 90 Ω.
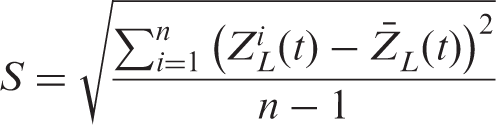
The output quantity S is the standard deviation of the transmission line characteristic impedance measurement results from the average impedance values. This quantity is also a measure of transmitted signal reflections forming on impedance irregularities in the line. In an ideal case, the value of this quantity should equal zero. This means that the characteristic impedance has an identical value at any point on the line. The standard deviation for the tested textile transmission lines tested ranged from 3 to 9 Ω.
The set of constant quantities includes the substrate type (fabric of parameters as shown in Table 1), substrate dimensions (30 mm × 60 mm), ambient temperature (25.5oC), and air relative humidity (31%).
The last set contains the interference quantities, such as electroconductive fabric weave, electromagnetic interferences, unmentioned structural substrate parameters, unmentioned structural parameters of fabrics used for conductive paths, and the pressure force of conductive paths to the substrate.
The neural model of textile transmission lines
Searching for the mathematical model of the subject of research can be conducted either based on the tool in the form of non-linear estimation or using spline functions. As a result of using non-linear estimation, the model defined by the user should have coefficients that are significant and relevant to the obtained results, which is in practice very difficult to achieve and very time-consuming. Spline functions, on the other hand, involve an extensive table of coefficients obtained as a result of using this method of approximation. In the case of textile objects, artificial neural networks have proved to be useful. 23 Researchers use this tool for prediction of permeability features of woven fabrics,24,25 thermal properties of textiles, 26 mechanical parameters of linear and flat textile products,27–29 functional properties of textile materials,30,31 and to identify fabric defects such as holes, oil stains, warp-lacking, and weft-lacking. 32 Neural networks provide a regression tool that is characterized by good generalization and extrapolation abilities.33,34
The quantitative textile transmission line electric properties model searched for is characterized by six input quantities and two output quantities. Due to the high complexity level of the issue, the multilayer perceptron was employed for solving the regression problem. It belongs to unidirectional networks that are distinguished by stable behavior. The stability guarantees that the onset of self-organization does not subvert the very learning properties that make stable self-organization of neural networks possible. The neural network was built using Automatic Network Designer, an option provided by the STATISTICA Neural Networks software program. The program automatically splits the set of measurement results (in the present case, this is a 90-element set) into a training, a validation, and a testing set in the proportion of 2:1:1. The neural network learning process forms the final network structure by setting non-zero values of the weight coefficients, while the values of the output quantities become the output values of the entire network.
34
A three-layer perceptron, 6-52-2, was obtained, with the input layer containing 6 neurons, a hidden layer containing 52 neurons, and an output layer containing 2 neurons (Figure 5). Neurons in the input layer are the conductive path width: W; the conductive path distance: D; the path surface resistance: Rs; the path thickness: T; the number of warp yarns: Nwa, and the number of weft yarns: Nwe. Neurons in the output layer are the quantity A defined by Equation (1) and the quantity S defined by Equation (2).
The structure of the textile transmission line neural network: W – conductive path width; D – conductive path distance; Rs – path surface resistance; T – path thickness; Nwa – number of warp yarns; Nwe – number of weft yarns; A – measure of the difference between the ideal and the real line impedances; S – standard deviation of the measurements of characteristic transmission line impedance from the mean value of this impedance.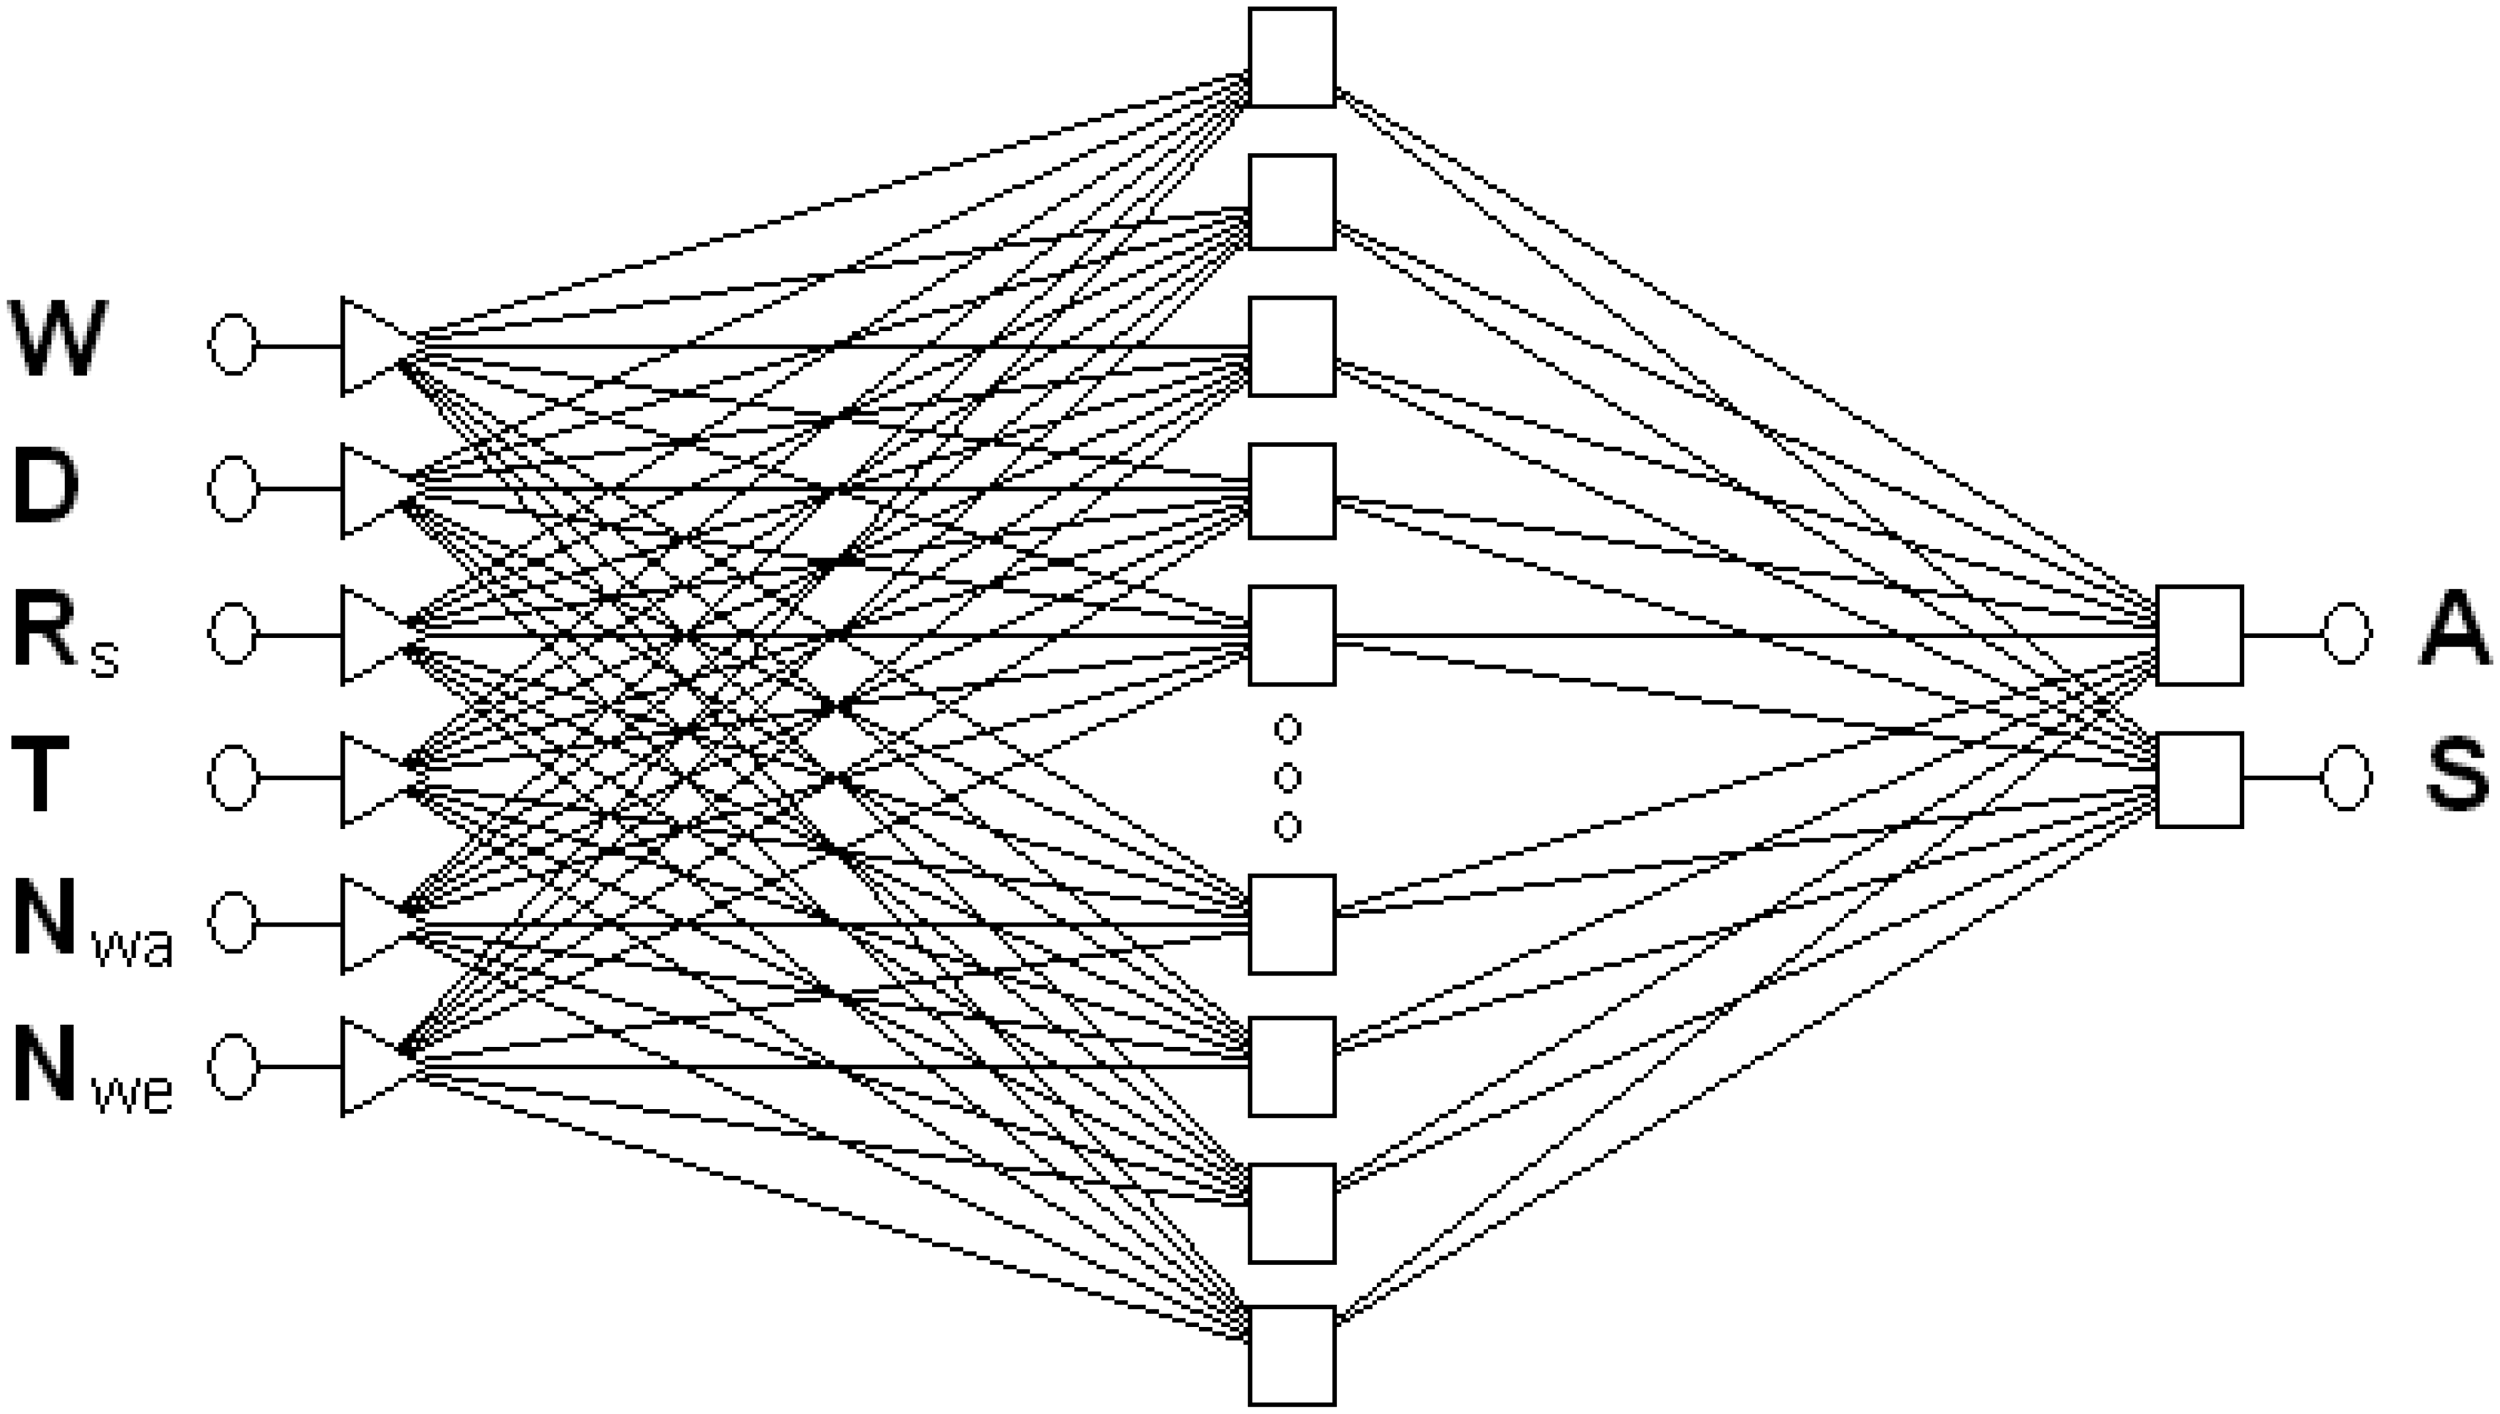
Threshold values and weight factors for neurons

The assessment of the neural model was made based on the proposed quantitative parameters. 25
The first parameter is the quotient of the standard deviations ρw of errors and data for the validation set. The quotient ρw must be smaller than unity. In general, the smaller the quotient value, the better unknown output values are predicted by the network.
The quality of the neural network is also defined by the quotient of the standard deviations ρy of prediction errors and data set of output quantity values. If the network operates effectively, it can be expected that the mean value of prediction errors for known cases will be close to zero. It is assumed35,36 that if ρy ≤ 0.10, then the neural model has been very well fitted to the research results. The closer the ρy values to 0.70, the worse the fitting quality. With ρy = 0.70, the model created by the network should be rejected.
The next parameter is the standard coefficient of correlation RP (R – Pearson’s) between the calculated and the real output values. The coefficient value should be close or equal to unity.
The subsequent parameter is the prediction error for the validation set ɛw, obtained during network training. It is expressed by the square sum of the differences between the preset values and the values obtained at the outputs of each output neuron. This error is subject to minimization during network training. Attention should also be given to the values of the two remaining prediction errors: the error ɛu for the training set and the error ɛt for the testing set. Generally, they should be as small as possible. It is essential that the error for the training set be smaller than the error for both the testing and the validation sets. On the other hand, the errors ɛt and ɛw may not be significantly greater than the error ɛu, otherwise this would indicate a poor generalization ability of the network. Moreover, the errors for the testing set and the validation set should be comparable. Otherwise this would mean that the cases have been selected in a non-representative manner.
Neural network quality parameters
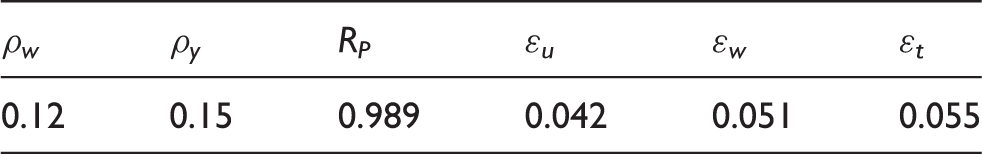
By analyzing the network quality parameters it was found that they satisfied the assumed criteria. Comparable error values were obtained for the validation set (ɛw = 0.051) and the testing set (ɛt = 0.055). Moreover, these errors are slightly greater than the error for the training set (ɛu = 0.042). Therefore, the obtained three-layer perceptron model has generalization capability and the cases have been selected in a representative manner. The obtained neural network can be regarded as a good model of the electric properties of textile transmission lines.
Analysis of the transmission line neural model
The quantitative mathematical model of textile transmission lines in the form of a neural network enables the assessment of the influence of selected model input quantities on the output quantities. By conducting the analysis of network input sensitivity, one can get an insight into the usefulness of individual input variables. The analysis indicates those variables that can be omitted without losing the quality of the neural network and those variables that are essential and may not be neglected. The sensitivity analysis determines the loss suffered by rejecting a selected variable. Each input variable is analyzed separately. However, variables could occur in the model that are interconnected and are only significant when occurring jointly. Therefore, great care should be exercised when drawing conclusions from the performed sensitivity analysis.
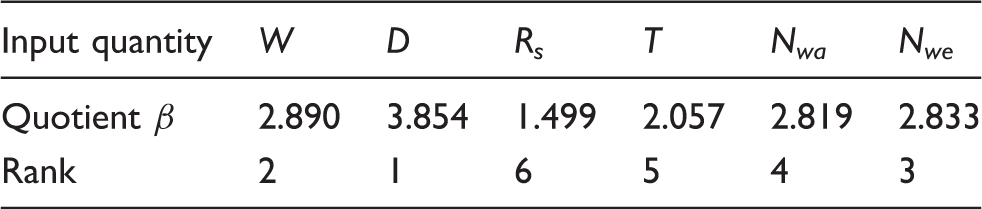
As a measure of neural network quality the quotient β was used. The quotient β indicates how many times the network error increases after removing a single variable. The greater the error after rejecting a variable compared to the original error, the more sensitive the neural network is to the lack of that variable. So, if β ≤ 1, removing a variable does not affect the quality of the obtained network, and even improves it.
After making the sensitivity analysis for all variables, the variables can be ranked by their importance. The ranks indicate the order of variables by the magnitude of the quotient. The variable ranked first is the most important.
Sensitivity analysis of input quantities
From the obtained results it has been found that all of the input quantities significantly influence the values of the input quantities of the three-layered perceptron 6-52-2.
The most important is the distance D occurring between the inner path and the GND paths. The analysis results show that decreasing the path distance D results in a decrease in the output quantity A (Figure 6(a)). The dispersions S of the line impedance measurement results also decrease (Figure 6(b)). The quantity S is a measure of transmitted signal reflections forming on impedance irregularities in the line. In an ideal case, the value of this quantity should equal zero.
Effect of the conductive path distance on the output quantities: (a) quantity A; (b) quantity S.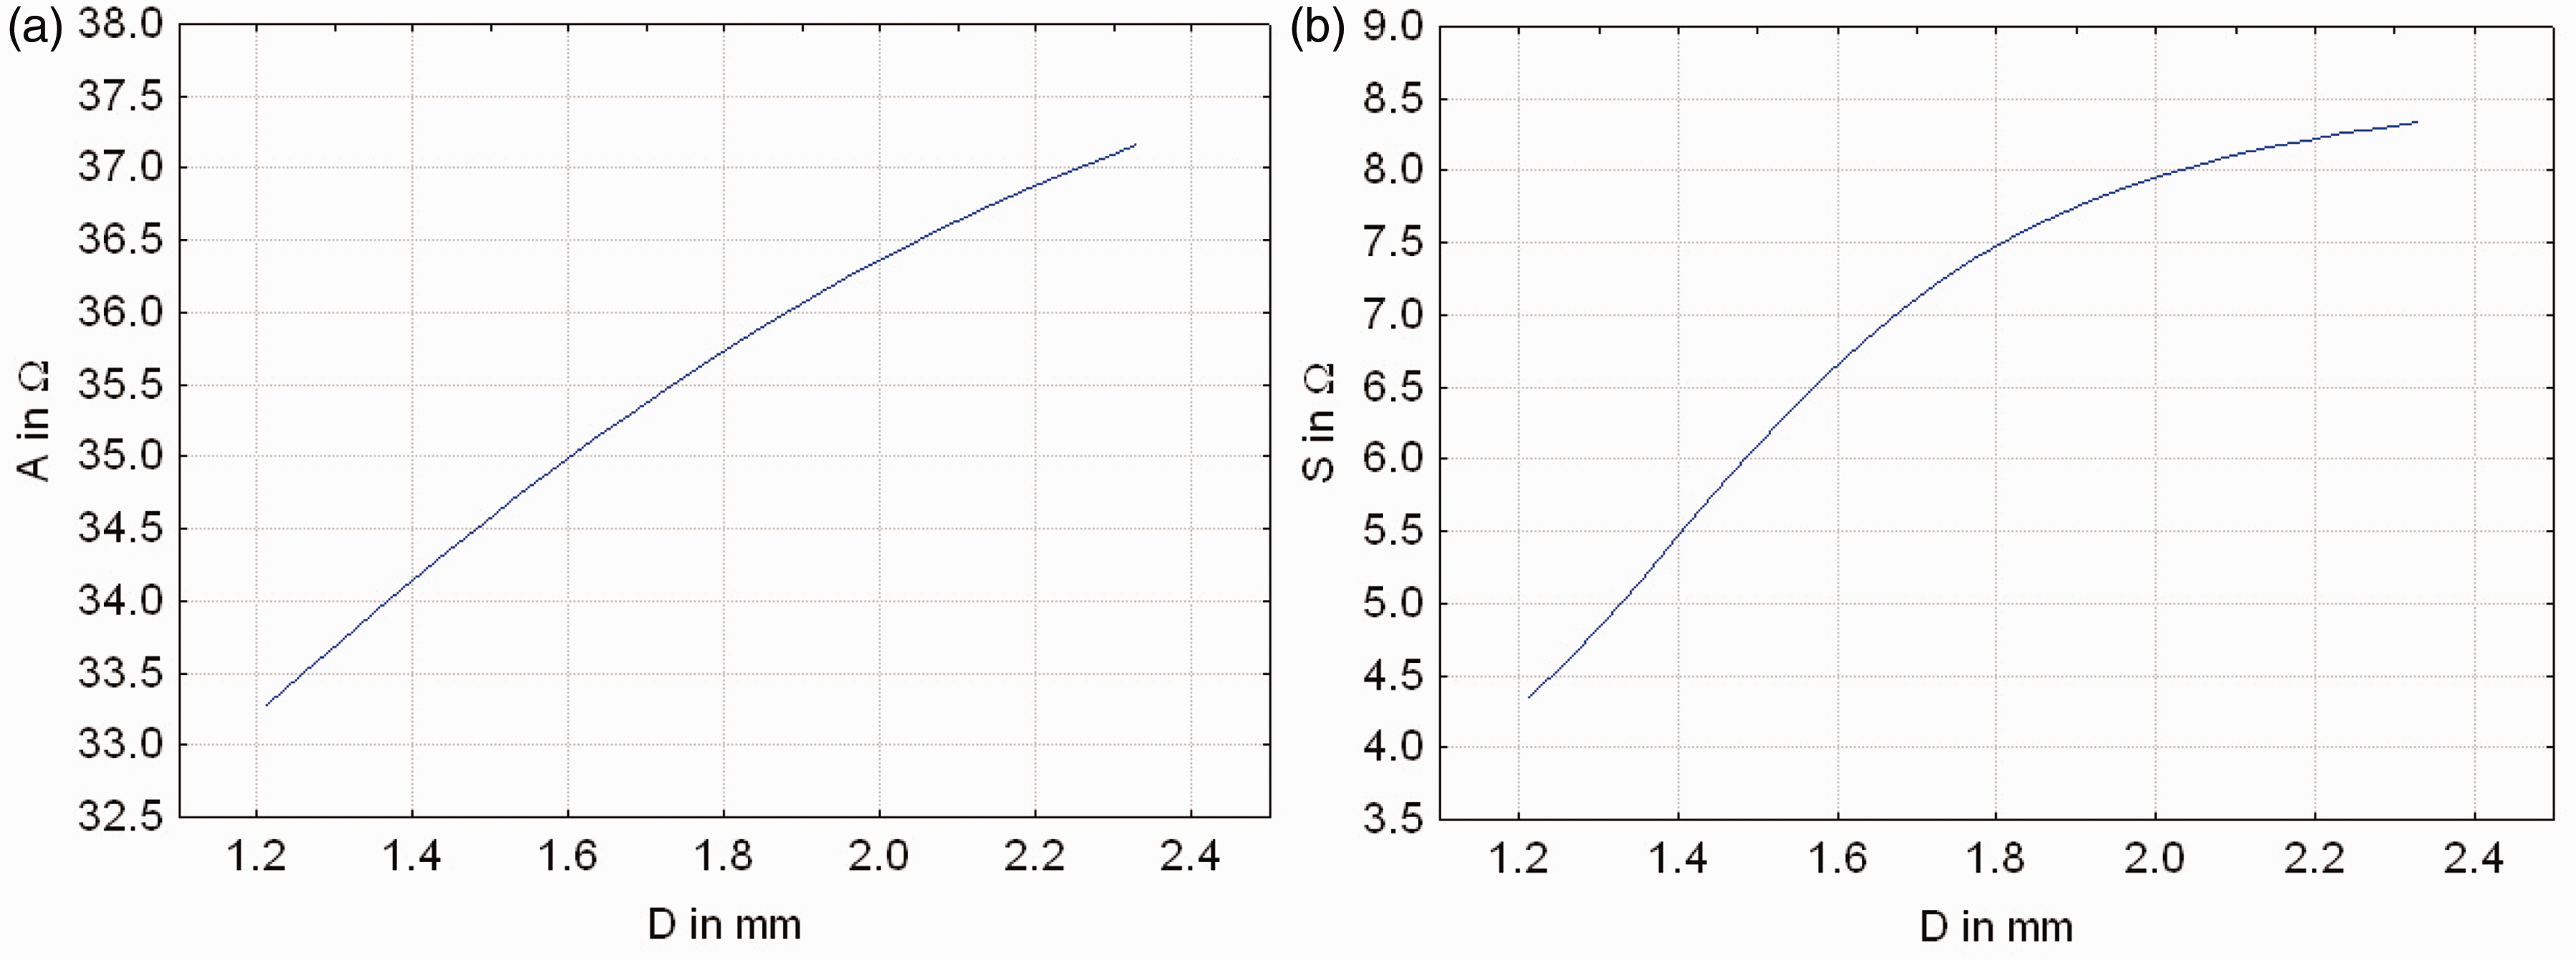
By adjusting the inter-path distance (decreasing it), the value of the textile transmission line impedance can be reduced, bringing it close to the value of 50 Ω. Reducing the distance might lead, however, to short-circuits between the conductive paths of the transmission line, caused by yarns protruding from the uneven edge of the textile path.
The next important input quantity is the width W of the inner conductive path. It has been noticed that the narrower the path, the larger the difference between the real and the ideal lines (Figure 7(a)). Decreasing the path width decreases its electroconductive properties (increases surface resistance). It has also been observed that increasing the width W causes dispersions around the mean line impedance to increase (Figure 7(b)).
Effect of the inner conductive path width on the output quantities: (a) quantity A; (b) quantity S.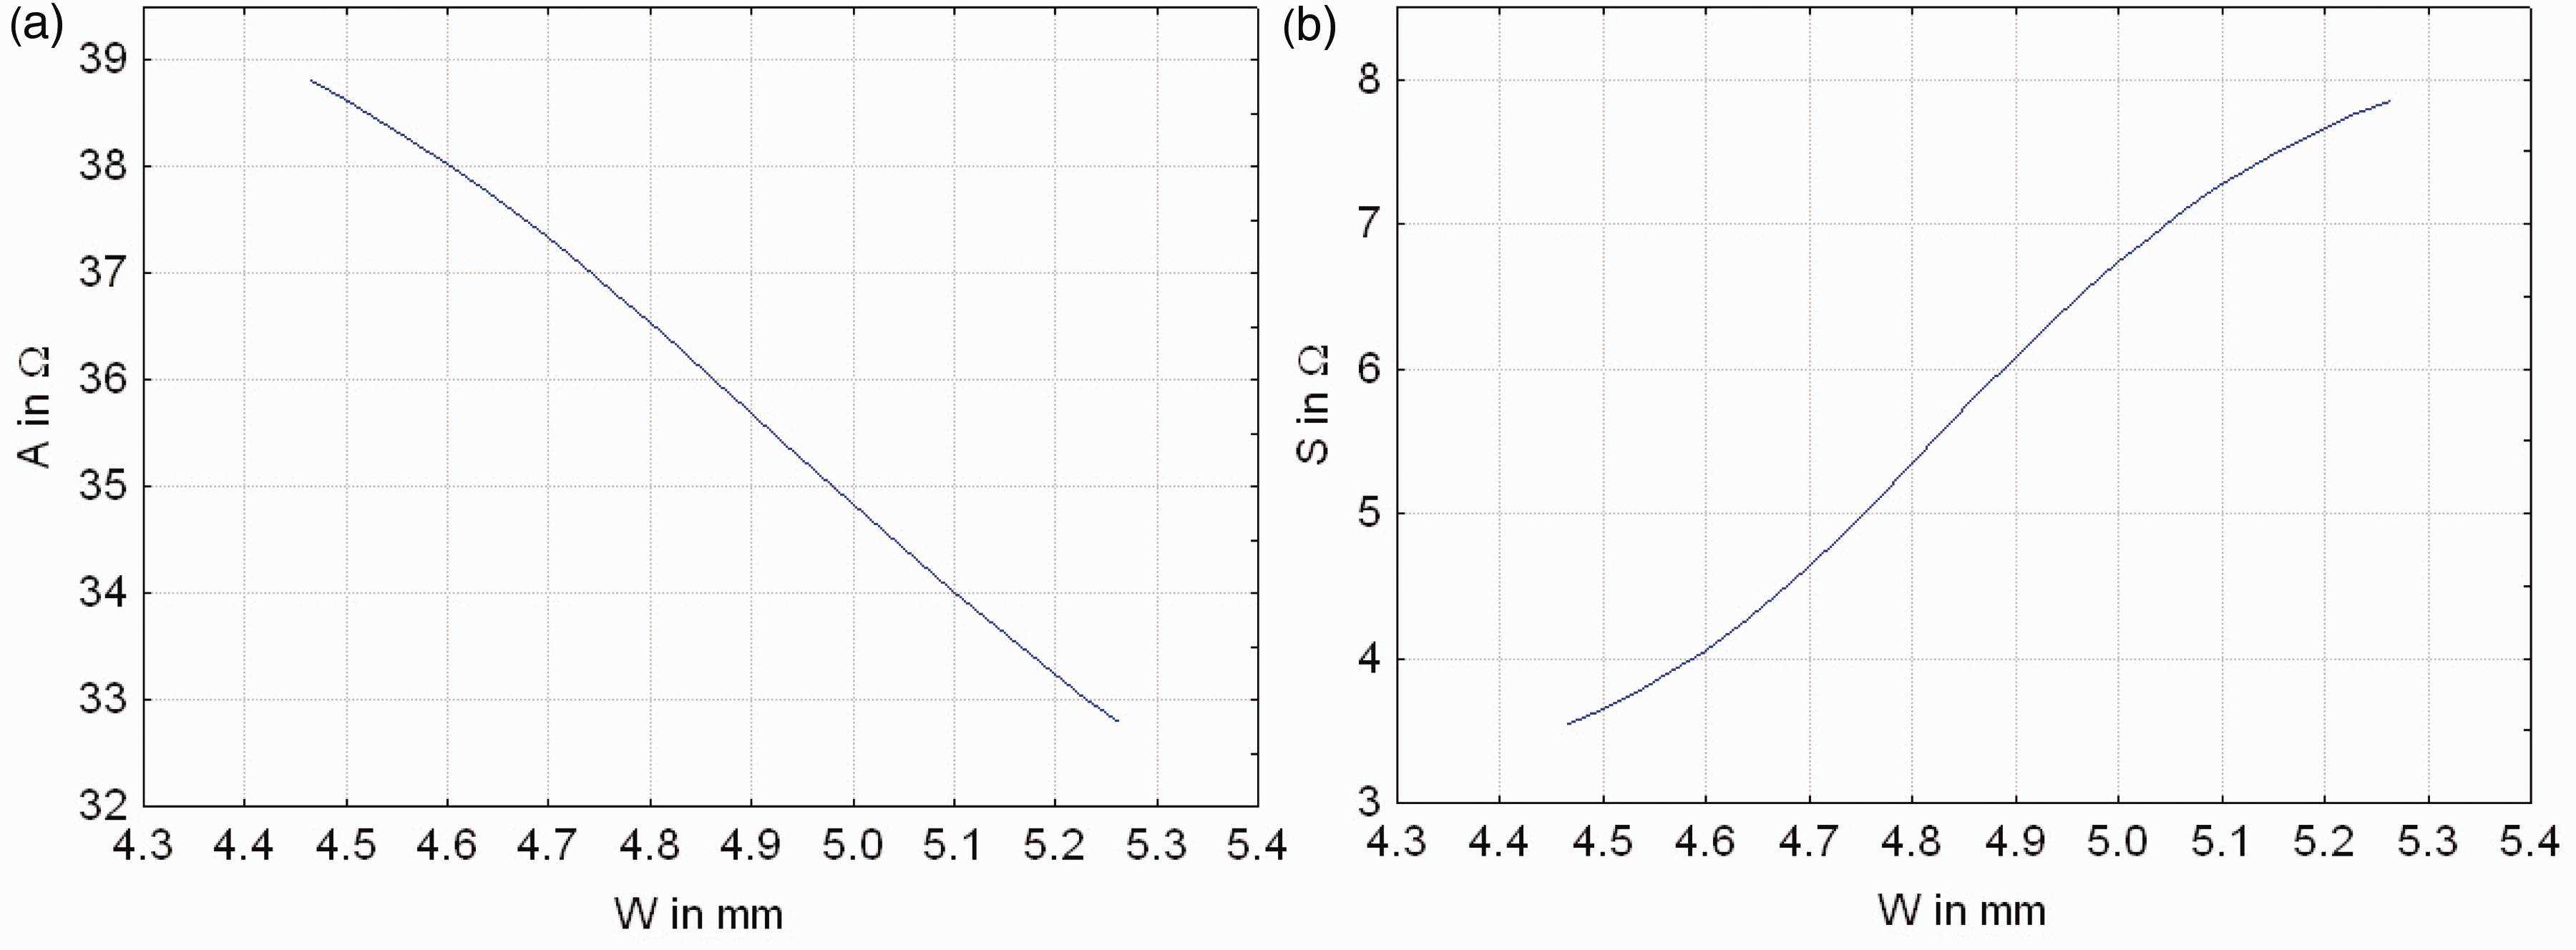
Farther ranked in the hierarchy of importance are the numbers of weft yarns, Nwa, and warp yarns, Nwe, occurring in conductive paths. The effect of yarn density on the values of the output quantities A and S is illustrated in Figure 8. It has been noticed that with the increase in the number of yarns of both systems, the values of the output quantities decrease. This suggests that a more durable, stable fibrous structure favorably influences the electric properties of a textile transmission line.
Effect of yarn density on the output quantities: (a) quantity A; (b) quantity S.
Increasing the number of yarns causes an enhancement of the structural tightness of the fabric and influences weave. Closing up of voids between yarns may result in a greater homogeneity of the textile product. It can also be expected that the electroconductive properties of such a fabric will be enhanced.
The neural network model is less sensitive to changes in the next input quantity, that is, the thickness T of electroconductive fabric intended for conductive paths. The thickness of the fabric from which conductive paths are made is proportional to the differences between the ideal line and real line impedances within a certain range of thickness variation (Figure 9(a)). The shape of the obtained characteristic indicates that the effect of fabric thickness on the output quantity A will, however, gradually decrease. The increase of fabric thickness has an unfavorable effect on the dispersions of line impedance measurements (Figure 9(b)).
Effect of fabric thickness on the output quantities: (a) quantity A; (b) quantity S.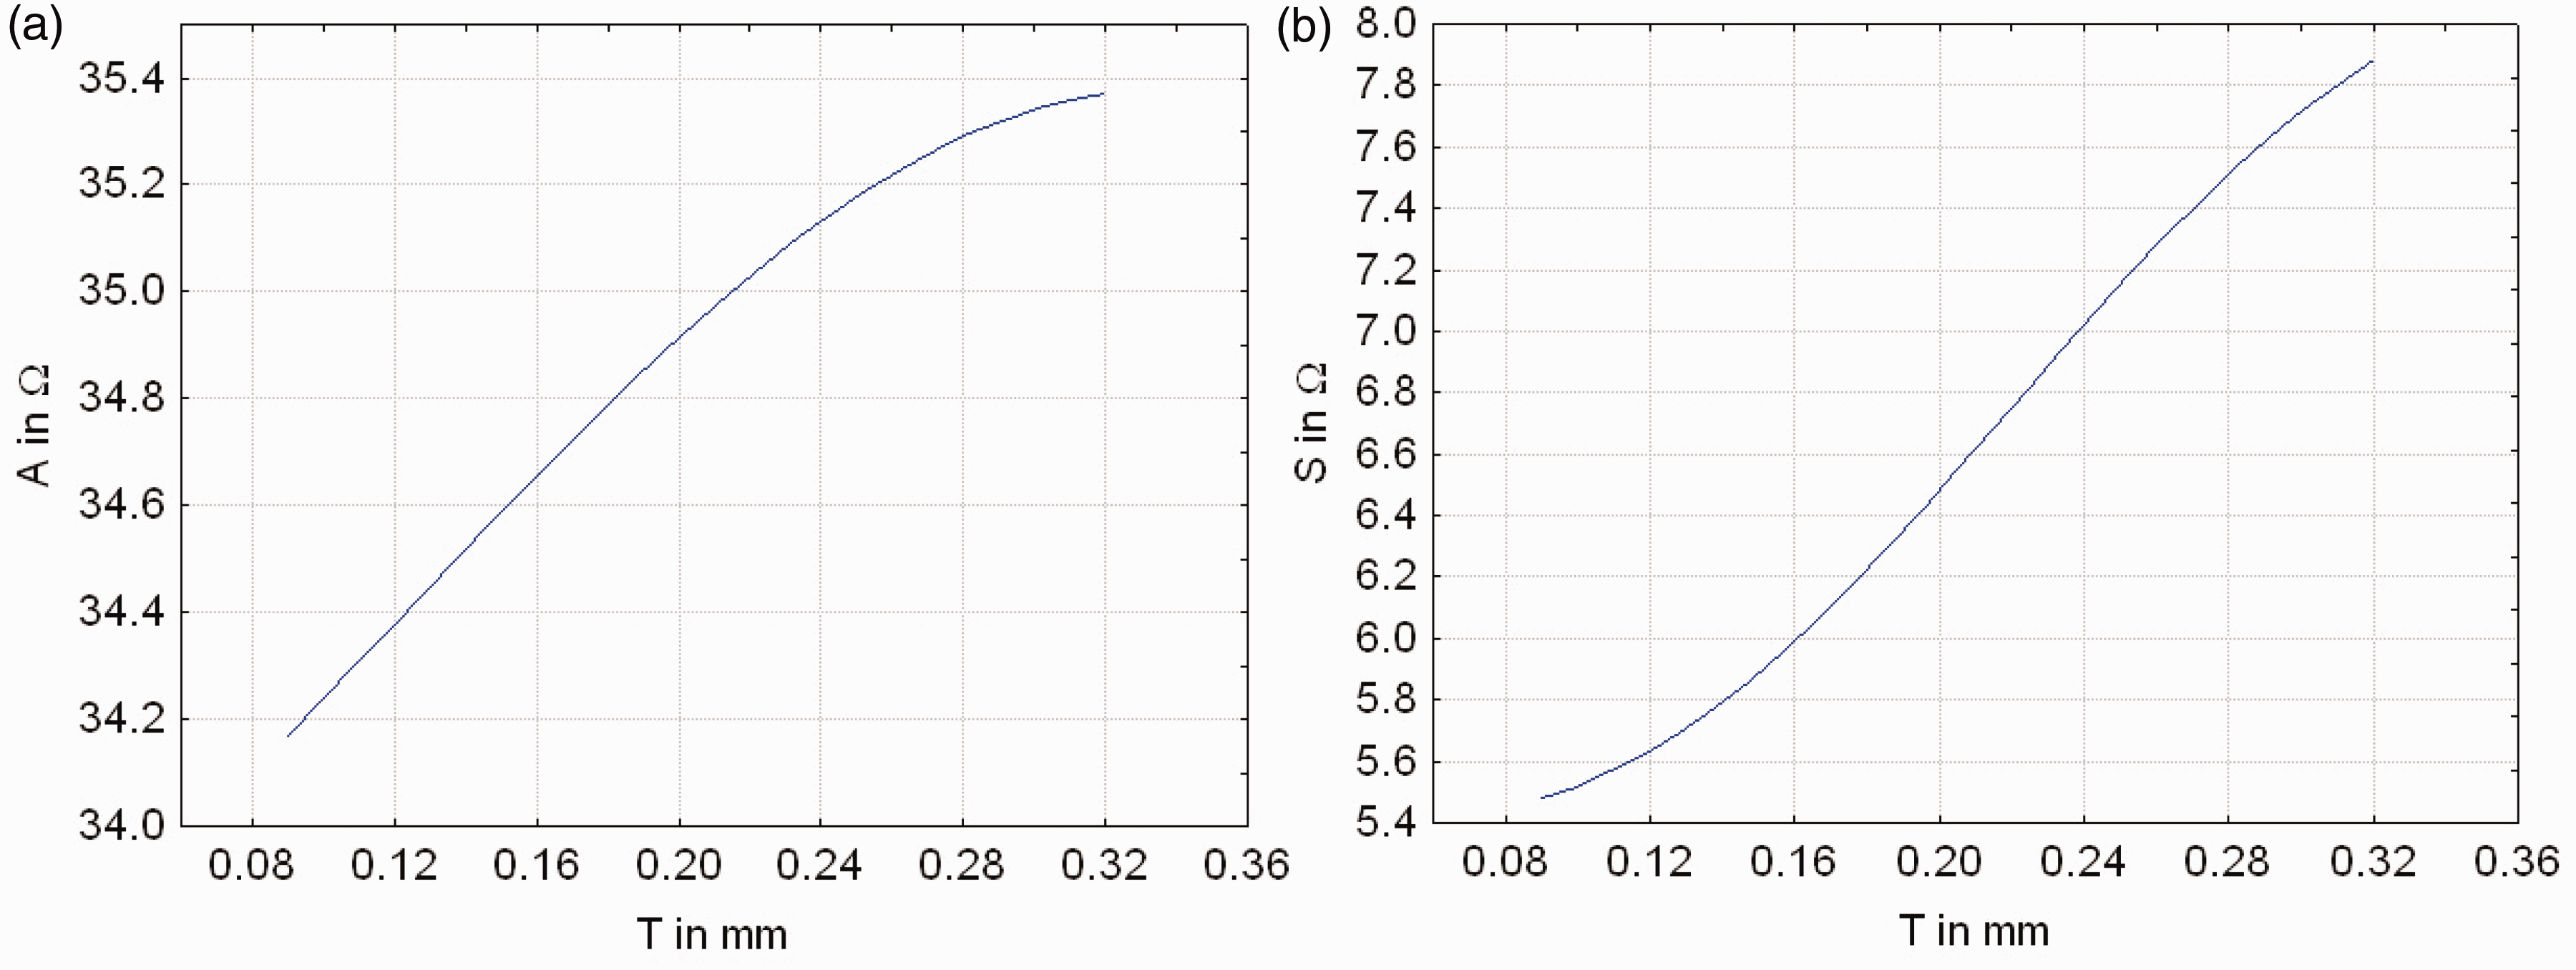
The last important input quantity is the surface resistance, Rs, of the conductive path. The increase in this quantity has the effect of increasing both output quantities (Figure 10). A neural network is, however, the least sensitive to variations in this quantity, as illustrated especially in Figure 10(a). With increasing fabric surface resistance, the influence on the variation of transmission line impedance decreases.
Effect of fabric surface resistance on the output quantities: (a) quantity A; (b) quantity S.
Summary and conclusions
Neural networks, used as a regression tool of multidimensional non-linear models, enable the definition of the quantitative mathematical model of the research object.
The derived transmission textile line electric properties model in the form of a neural network is marked by good quality. This means that the network has generalization and extrapolation ability.
The neural network model in the form of the perceptron 6-52-2 was used for assessing the influence of selected input quantities, such as inner conductive path width, W; conductive path distance, D; path surface resistance, Rs,; path thickness, T; the number of warp yarns Nwa; and the number of weft yarns, Nwe, occurring in a conductive path on selected electric properties of textile transmission lines.
The results of sensitivity analysis have indicated a significant effect of the selected quantities on the electric properties of the textile transmission line, as described by the quantity A – a measure of the difference between the ideal and the real line impedances, and the quantity S – the standard deviation of the measurements of characteristic transmission line impedance from the mean value of this impedance.
The ideal transmission line should exhibit zero values of output quantities. The investigated textile transmission lines require treatments aimed at reducing their characteristic impedance. This is possible through:
reducing conductive path distances; increasing the width of the inner conductive path; increasing the yarn densities of the electroconductive fabric; decreasing the thickness of this fabric; decreasing the surface resistance;
within the boundaries of variation of the selected input quantities.
The reduction of the surface resistance can also be achieved indirectly by increasing the width of the inner conductive paths and increasing the yarn densities of the fabric from which the paths are made.
The investigation has shown that increasing the innertransmission conductive path width causes an increase in the impedance measurement result dispersions.
Any operation aimed at enhancing the electric properties of textile transmission lines requires great care. In the model created by the neural network, interrelated input quantities may occur, as well as quantities that only jointly influence the output quantities of the model.
Understanding the degree in which the input quantities influence the electric properties of a textile transmission line will make it possible in the future to construct a good quality textile transmission line of a normalized characteristic impedance of 50 Ω and to implement it in a textronic system.
Footnotes
Funding
This work is (partially) supported by Structural Founds in the frame of the project titled “Textronic system to electrical stimulation of muscles”, financed by Operational Programme Innovative Economy, 2007–2013, Sub-measure 1.1.2.