
Abstract
Research in modeling and simulation of woven fabrics has been quite intensive in the past decade. The simulation studies presented confined consideration of crimp and extension roles in the damage deformation process, in particular tensile and puncture. Most simulation works are struggling to relate internal yarn interactions with respective damage modes due to the unit cell approach. Hence, in the present study, an alternative finite element analysis approach was proposed to model yarn crimp and extension response during puncture based on the validated uniaxial tensile and puncture models. Puncture stress–strain, post-impact kinetic energy and damage evolution of full-scale woven fabrics models were evaluated with two impactor shapes and three friction levels. The results show that puncture damage behavior is the critical dependent of the magnitude of impactor shapes and yarn frictional contacts. Good comparisons with the experimental and previous studies demonstrate the approach’s suitability for modeling textile in composites.
Woven fabrics’ service in technical textile applications is invariably exposed to many deformation modes, in particular tensile and puncture loadings. During its use, woven fabrics will be exposed to the puncture effect of sharp objects in perpendicular direction to that of in-plane tension.1–4 Woven fabrics used as roofing, protective gloves and tubing structures are examples of products that are liable to such deformation modes. To the best of the author's knowledge, Sun et al. 5 have reported details of three-dimensional simulation work on the crimp and yarn extension rolls of plain woven fabric under puncture deformation mode. Woven fabrics under puncture impact damage demonstrate crimp interchange, yarn extension and eventually yarn pullout effect.5–8 Yarn friction simulation works are discussed by Duan et al.9–11 and Boisse. 12 However, according to these papers, woven fabric models are developed either in unit cell or symmetrical scaling approaches. Large geometrical woven fabric models result in the massive amount of meshes and eventually degrade computation analysis time.
As their model predicts excellent results when compared to the experimental results, however, the complicated nature of transverse isotropic material property is inconsistent with many researchers. The inconsistency has appeared from the difficulty of estimating yarn transverse modulus 13 and solving numerical convergence. 14
The emphasis is on the integration of the uniaxial tensile model framework to puncture model development. 15 Other simulation issues related to the puncture model are highlighted. Therefore, the objective of the study is to develop large-scale woven fabric models according to a physical experimental puncture test with isotropic material property.
Modeling and simulation procedure
Yarn and woven fabric model development
Woven fabric models were developed with a computer-aided design (CAD) pre-processor tool available with finite element analysis software, Abaqus. Woven geometry model were developed as solid three-dimensional yarn structures. Yarns were assumed not only to be solid,8,16 but also to have lenticular cross-section17,18 and monofilament structure.
15
Yarn geometry was established as solid to reflect model damage evolution effect. Monofilament presented better analysis time than multifilament yarn structure due to mesh and yarns interactions reductions. The lenticular cross-sectional shape was adopted as it was consistent with previous work.
15
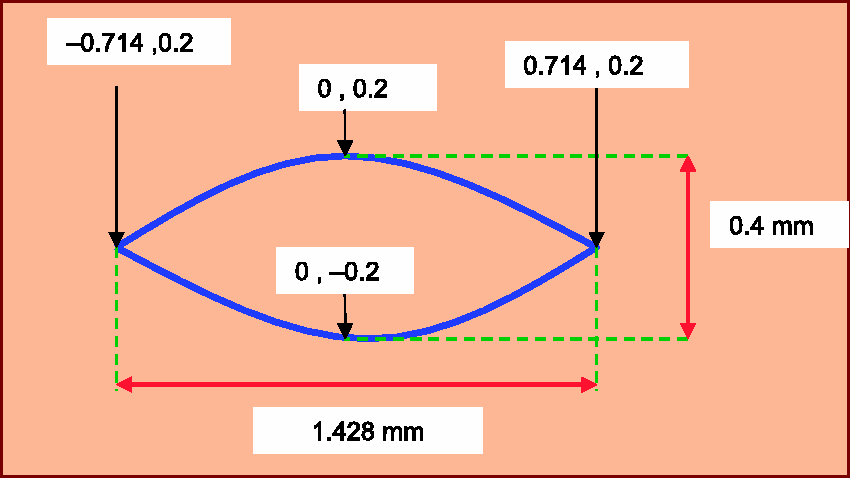
The yarn model was determined from critical stages, namely yarn cross-sectional and yarn path developments. The yarn cross-sectional shape in mm2 was measured with a digital stereo microscope at 1.428 mm width and 0.4 mm height. Four coordinate’s positions were established with yarn width and height and formed the basis for lenticular yarn cross-sectional shape, as shown in Figure 1. Equation (1) was formulated to represent yarn lenticular shape, y1 based on yarn width, x. Yarn path was defined by positioning two lenticular shapes with 0.4 mm spacing between them in a straight line. Both lenticular shapes were symmetrical and yarn path was constructed by connecting three coordinate positions, as shown in Figure 2. Equation (2) presents the lenticular equation formulated to represent yarn path above fabric plane. The third equation was established to show yarn path movement below the fabric plane. Yarn path above fabric, y2, and yarn path below fabric plane, y3, in Equations (2) and (3) were determined according to the yarn width, x, changes.
Yarn lenticular shape. Yarn path in woven fabric.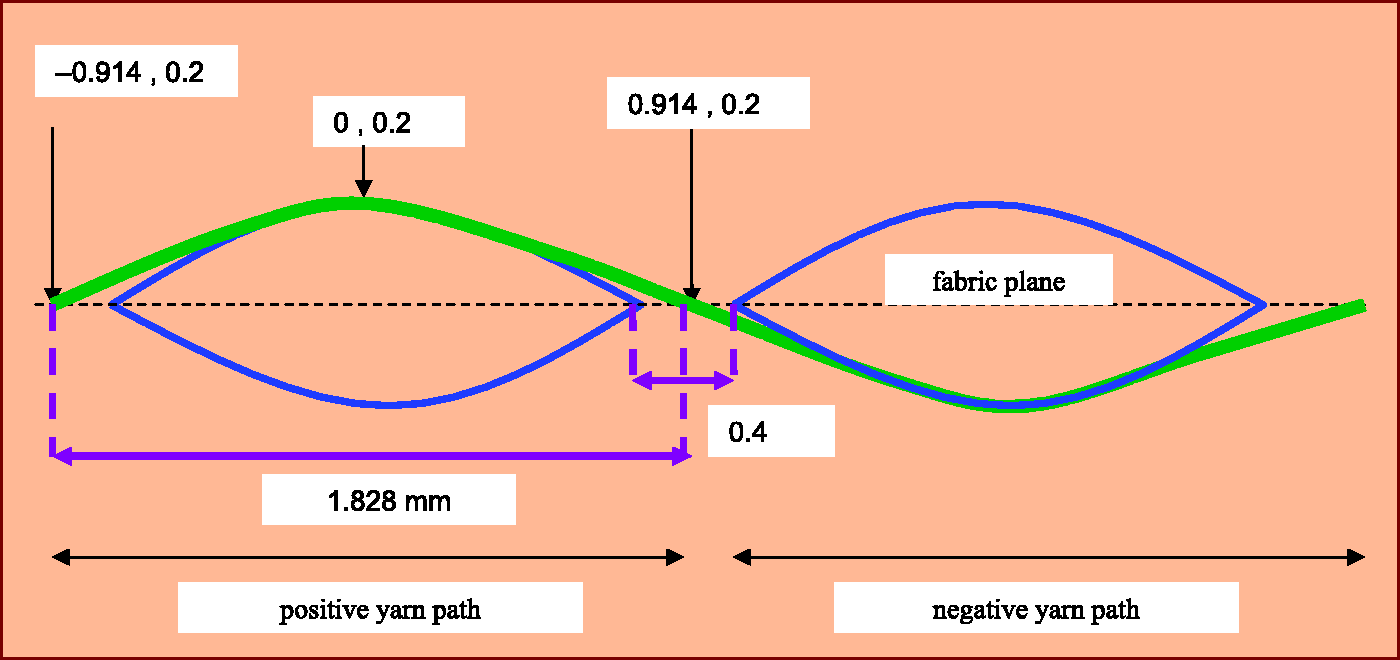


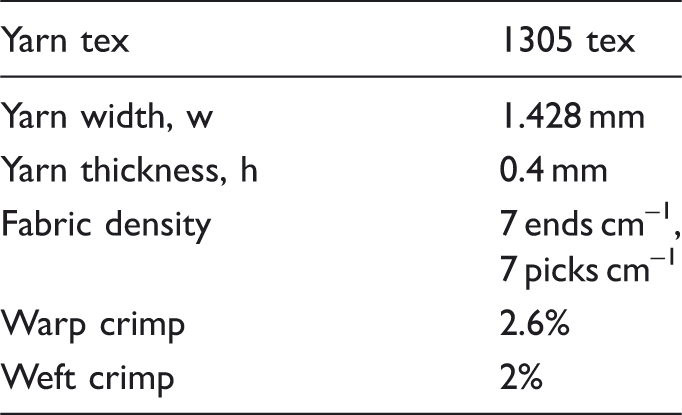
The yarns required for each warp and weft direction were resolved by multiplying ends per cm with a fabric sample width. With 64 cm2 physical fabric sample dimensions and 7 ends cm–1 yarn density, the yarns required for each warp and weft direction were determined at 56. The woven fabric model was generated in a square shape to simplify woven fabric model development. Large element faces were created by correctly positioned the nodes on the yarn paths, which allowed meshing and efficient computation time, and prevented model penetration problems. Detailed fabric properties selected for the simulation are shown in Table 1. Two different impactor shapes were embraced for the research: flat and conical impactor shapes. The impactor density was measured at 7.8 gm cm–3 by using the BS EN ISO 1183-1:2004 standard. The impactor geometries were developed according to its actual physical dimension. The impactor’s dimension is illustrated in Figure 3.
Impactor shapes: (a) flat; (b) conical. Yarn and fabric properties
Material property
Material property for simulation was based on yarn mechanical property and density. In the simulation, the yarn was assumed to have isotropic properties. Previous work was done to develop uniaxial tensile validation of plain woven fabric and provide a framework for current publication. 15 The yarn tensile test was performed according to the single yarn strength method, BS EN ISO 2062:1995. The specimen length required for the tensile test was 250 mm and the load applied was 5000 N. Yarn tensile testing was performed using the Instron tensile tester machine at 100 mm m–1 loading rate. From the test, yarn elastic modulus was determined at 10.86 GPa. With the results, the yarn elastic-plastic property was calculated according to the equation described in an earlier publication. 15 These values would address the yarn transitional behavior from the elastic to plasticity phase once the yield point had been exceeded. Aramid yarn density was determined at 1.41 gm cm–3 based on an earlier prescribed density standard.
Material interactions, loading and meshing
Yarn interactions between warp, weft yarns and impactors were employed in the finite element model to simulate appropriate stress–strain development and distributions. Both warp and weft yarns were assumed to have yarn frictional interaction at 0.7 coefficient of friction. The frictional value of 0.7 was selected as it provided the closest experimental and simulation validation results. The assumption was selected as it imposed tight close interactions between yarns. An additional two yarn friction settings at 0.5 and 0.9 coefficients of friction were imposed to the woven fabric model. The approach was necessary to demonstrate yarn friction effect with conical and flat impactor shapes. While warp and weft yarns were assigned to initiate analysis at defined initial position, the impactor was configured to react as a rigid body and move at a constant rate through the woven fabric model. This approach provided optimized stress accuracy as well as avoiding stress noise build-up at element contact surfaces. As a result, efficient stress distribution can be fully captured for later analysis. The advantage of a rigid body against a deformable body is that analysis would be performed at the reference point with a maximum six degrees of freedom (DOFs). On the other hand, a deformable body will have many DOFs and result in extensive analysis time.
The puncture effect of plain woven fabrics was established by assigning appropriate load for achieving displacement, strains and stress. Abaqus requires a load to be converted to stress in MPa. Stress magnitude, σ
m
, was calculated by dividing the maximum applied load, Lmax, with the yarn areas exposed to the puncture force. Puncture force was applied in the top cross-sectional area of the fabric. Stress magnitude (σ
m
) formulation is presented in Equation (4). With the equation, stress magnitudes for the flat and conical impactor were determined at 99.5 and 78.6 MPa, respectively:

The puncture damage progression was initiated when the impactor starts to move through fabric center while the fabric's edges were firmly clamped. This procedure not only prevented the fabric slippage issue in experimental work, but also improved simulation analysis time. The boundary condition imposed the geometrical model movement limitation during puncture model analysis. In the research work, warp and weft yarns were restricted to move either lengthwise (U) or rotationally (UR) within all material directions. Yarn boundary conditions for all four fabric edges were configured to remain unchanged throughout the finite element analysis. The impactor was constrained to move only in the vertical direction, or U2. The boundary condition configurations for the simulation are presented in Equations (5) and (6).
Warp-weft boundary condition:

Impactor boundary condition:

Four linear nodes with a tetrahedral element shape at 0.2 seeding were used to mesh the yarn. The tetrahedral element shape was selected in the research to account for the geometrical non-linearity of woven fabric models due to the presence of crimps and floats. The element shape type directed three DOFs formation at four nodes, for a total of 12 DOFs per element. The total elements for modeling plain woven fabric consisting of 113 components of warp, weft and impactor were 215,555. Finite element analysis commenced when all the geometrical parts had been successfully seeded and meshed.
Puncture experiment
A puncture test was performed with the Instron test machine. The fabric was securely clamped on the puncture test rig with the impactor and placed at the centermost position. The puncture moves at a constant rate of 100 mm min–1 through the fabric using a universal strength tester with a load cell capacity of 5000 N. The puncture result was recorded in MPa and validated with its respective simulation results.
Results and discussion
Puncture simulation and experimental stress–strain validation
Figures 4(a) and (b) outlined the stress–strain validation of two different types of impactor surface shapes: flat and conical. The stress–strain progression in the woven fabric models had shown that the stress was distributed from the impact area to fabric edges by following the principal yarn interlaced paths in the woven fabrics. Principal yarns refer to yarns that have direct contact with the impactor. From the figures, higher puncture impact stress–strain was achieved by adopting the flat shape impactor than the conical shape. Both flat impactor experimental and simulation results accounted for maximum stress at 9 and 9.2 MPa with 18% and 19% strain, respectively. With the flat impactor shape, large sections of plain woven fabrics were exposed to a puncture force within the equivalent analysis time. This resulted in a massive yarn interactions scheme with the impactor and substantially progressed stress–strain performance. Figure 5(a) shows high “stress-ring” formation around the contact region of the flat impactor surface with yarns. In contrast, the conical shape impactor reported a higher stress formation region at the center fabric, as shown in Figure 5(b). Due to the nature of the pointed impactor shape, the puncture impact force initiated from the model center towards fabrics edges or the boundary condition. At this point, warp and weft yarns commenced the decrimping phase in accordance to the puncture load applied. Interestingly, both simulated stress–strain diagrams in Figure 4(c) show close resemblance with the crimp unbending phenomenon as in the uniaxial tensile test.15–19 The non-linear nature of puncture stress–strain behavior suggested that crimp interchange in woven fabric occurred during lower strain percentages puncture impact and was later followed by yarn extension. Stiffer simulation stress–strain results were denoted by yarn model assumption and mesh assignment. Warp and weft yarns in the simulation were assumed to behave as multifilaments, but represented in the form of monofilaments. With an equivalent basis, a coarse yarn mesh approach was adopted to optimize computation times due to the extreme amount of mesh generated in the simulation.
Stress–strain results: (a) flat shape; (b) conical shape; (c) flat and conical shapes simulated results. Interaction between plain woven fabric with the impactors: (a) flat shape impactor; (b) conical shape impactor.

Simulated conical impactor shape stress–strain with 0.5, 0.7 and 0.9 friction settings
Figure 6 illustrates the stress–strain behavior of plain woven fabric with 0.5, 0.7 and 0.9 yarn friction settings. The lower frictional coefficient value of 0.5 indicated less yarn surface frictional interaction between warp and weft yarns than 0.9 coefficients of friction. It is shown from the figure that woven fabric modeled with lower yarn friction value exhibited lower stress and strain results in comparison to that of higher friction value. With 0.5 coefficients of friction, plain woven fabric presented 5.3 MPa stress and 20% strain. Highest inter-yarn friction, 0.9, showed a stiffer stress increment within small strain. The friction setting reported maximum stress at 7.75 MPa and 17% strain. The stress–strain result showed significant woven fabric ability to resist puncture impact damage by increasing yarn-to-yarn interactions.
Yarn frictional (0.5, 0.7 and 0.9) effect on conical impactor shape stress–strain results.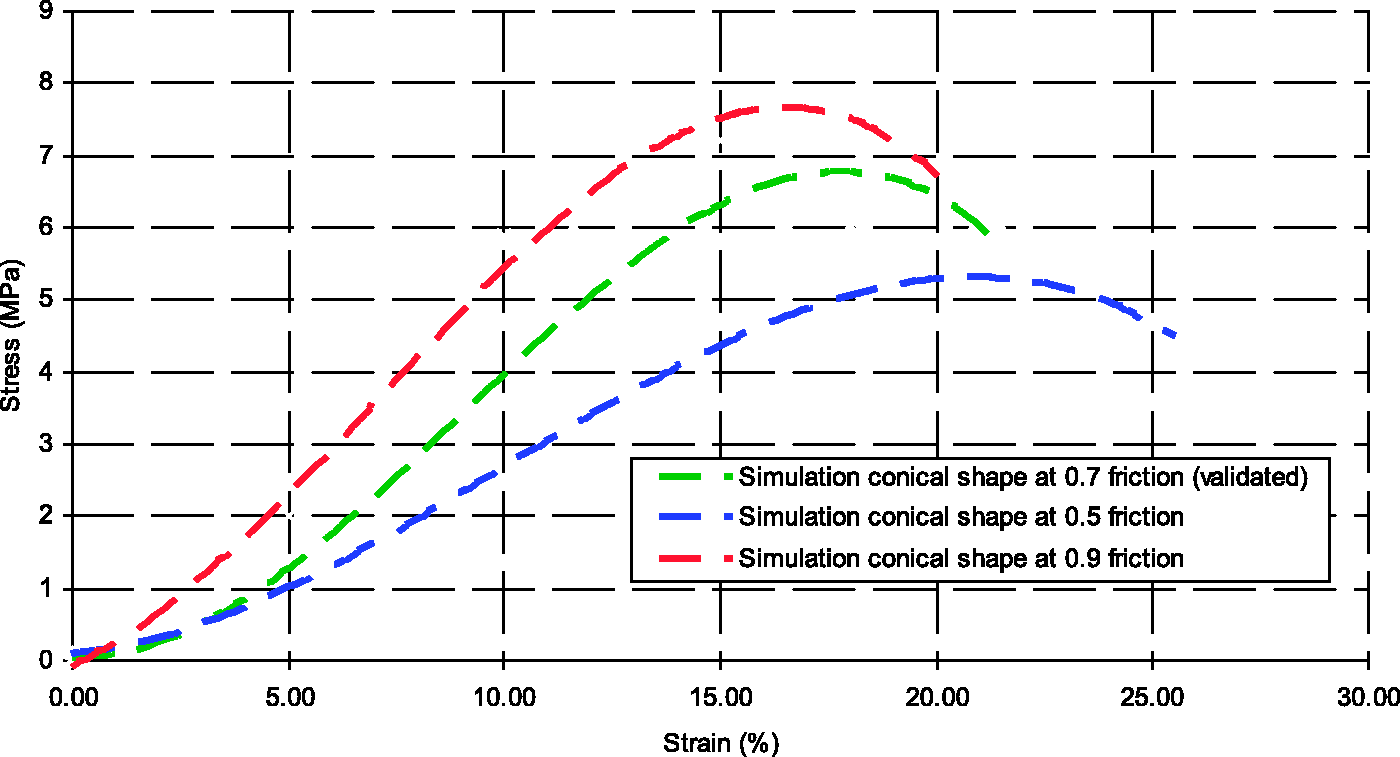
The simulation revealed that 0.9 yarn friction had propagated the stress increment within smaller strains. The fabric shortened its crimp interchange phase in comparison to that of lower friction, 0.5. The small non-linear curve was observed within 1.5% strain, which indicated crimp removal of the impacted yarns and was later followed by yarns extensions. This showed augmented woven fabric structural integrity resisting puncture damage force during the lower strains period. With this finding, it would be suggested that the stiffer puncture damage response was generated by increasing yarn interactions in the woven fabrics. It was shown that woven fabrics with 0.9 friction setting have the best response against puncture impact due to its tightest yarn interactions.
Simulated flat impactor shape stress–strain with 0.5, 0.7 and 0.9 friction settings
Figure 7 presents the stress–strain result of plain woven fabric models with 0.5, 0.7 and 0.9 friction settings. The stress–strain curves were divided into three sections. The first section presented by non-linear behavior within zero to 7% strains. Woven fabric with 0.5 friction setting showed the most non-linear behavior as compared to tighter woven fabrics at 0.7 and 0.9 frictions. This phenomenon suggested that individual yarn in the woven fabric had the ability to move freely due to less friction contact during puncture impact, and eventually contributed to the efficient decrimping phase. The second part of the curves represents the yarn extension occurrence from 7% to 19% strain. In this phase, stress–strain damage of woven fabric was dominated by yarn extension rather than decrimping phase. The third section was the yarn transitional behavior of elastic to plasticity behavior. Yarns in woven fabrics started to develop necking, ultimately causing yarn extension to be unrecoverable and followed by yarn breakage. It was shown that woven fabric with 0.9 yarn friction reported maximum stress at 9.9 MPa and strain at 18.8%, while woven fabric with 0.5 friction setting presented stress of 9.1 MPa and 20% strain.
Yarn frictional (0.5, 0.7 and 0.9) effect on flat impactor shape stress–strain results.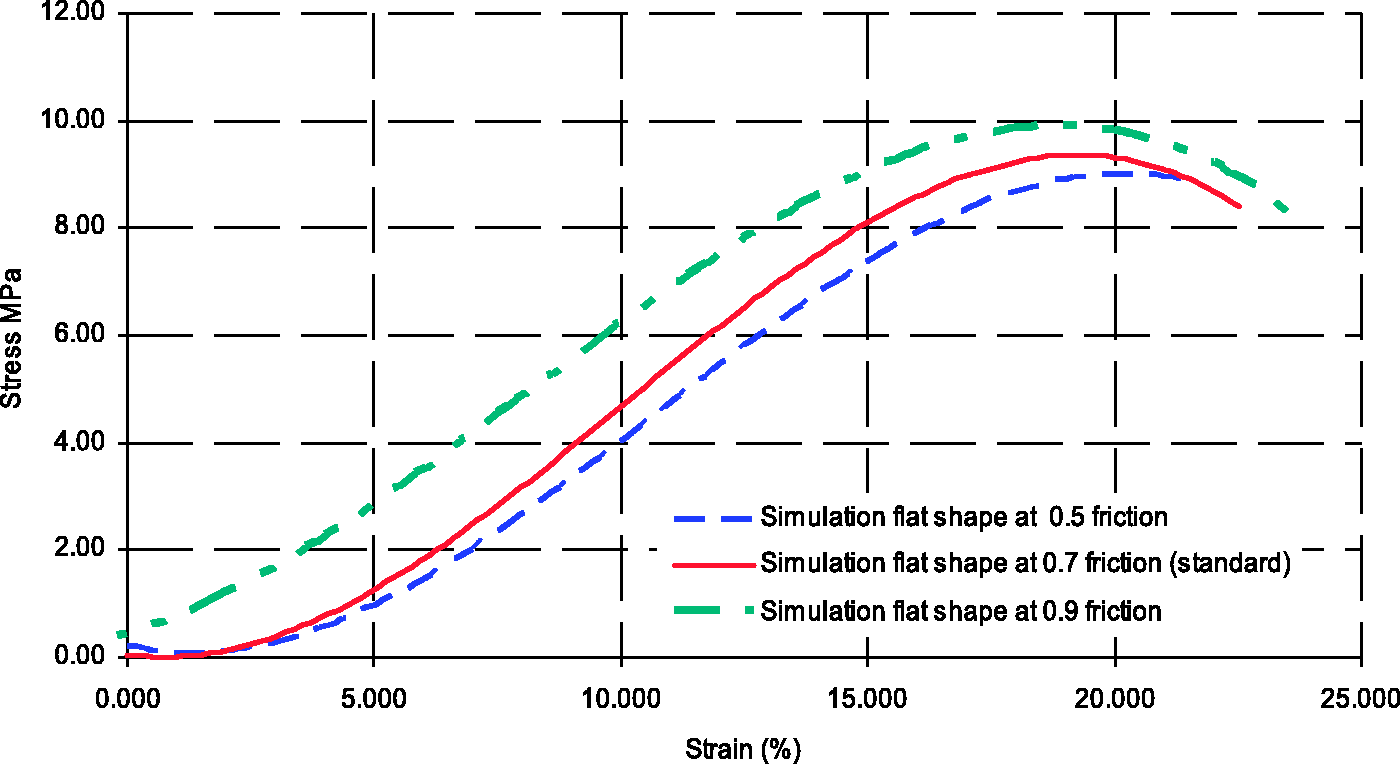
The simulation suggested that woven fabric with the tightest yarn interaction displayed the lowest non-linear behavior during small strain percentages. High yarn frictional interaction restricted individual yarn movement during puncture impact and eventually limited woven fabric decrimping capacity. Equally, the stress–strain result also suggested that woven fabric with tight yarn-to-yarn interaction presented higher puncture stress–strain performance compared to lower yarn-to-yarn interactions. The flat impactor stress strain trend in 0.5, 0.7 and 0.9 friction settings were consistent with the conical impactor, which alleged that yarn frictions make significant contribution to the puncture behavior of woven fabrics.
Simulated conical shape post-impact kinetic energy (IPKE)
Figure 8 demonstrates the energy resistance response of plain woven fabric punctured by the conical shape impactor at three yarns friction levels. It was shown that the lowest friction setting resulted in the highest post-impact kinetic energy (IPKE) at 15% strain percentages. By comparing post-impact kinetic energy (IPKE) resistance of 0.5 friction setting with its stress–strain curve in Figure 6, it was revealed that woven fabric resistance against puncture was attributed to the yarn extension phase. Both woven fabrics with 0.7 and 0.9 friction setting showed intense (IPKE) energy peak frequency fluctuation within smaller strain percentages against the conical shape impactor force. Tight yarn-to-yarn interactions demonstrated the fastest energy resistance response within smaller strain percentage. The result proposed that the post-impact kinetic energy (IPKE) of the conical impactor shape was facilitated by crimp interchange for the medium and stiffest yarn friction setting and yarn extension for the lowest yarn friction setting.
Friction effect on conical post-impact kinetic energy 0.5, 0.7 and 0.9.
Simulated flat shape post-impact kinetic energy (IPKE)
Figure 9 presents the post-impact energy frequency (IPKE) of woven fabric punctured by the flat impactor shape at three different yarn friction settings. All woven fabric models demonstrated maximum post-impact kinetic energy (IPKE) within smaller strain, especially below 5% strain. Within the strain range, woven fabrics with 0.7 and 0.9 frictions presented close to maximum post-impact kinetic energy (IPKE), while woven fabric with a 0.5 friction setting exhibited the lowest IPKE. By comparing with stress–strain curves in Figure 7, it was shown that woven fabric resistance behavior against the flat impactor shape was attributed to the decrimping phase. The flat impactor shape had impacted larger yarn surface areas and resulted in multitude yarn involvement during the puncture damage process. This had activated an immediate crimp interchange response to resist puncture impact force. Equally important, woven fabric resistance at extended strain percentage was influenced by yarn extension due to the presence of post-impact kinetic energy (IPKE) frequencies beyond maximum first peak energy.
Friction effect on flat impactor post-impact kinetic energy at 0.5, 0.7 and 0.9 frictions.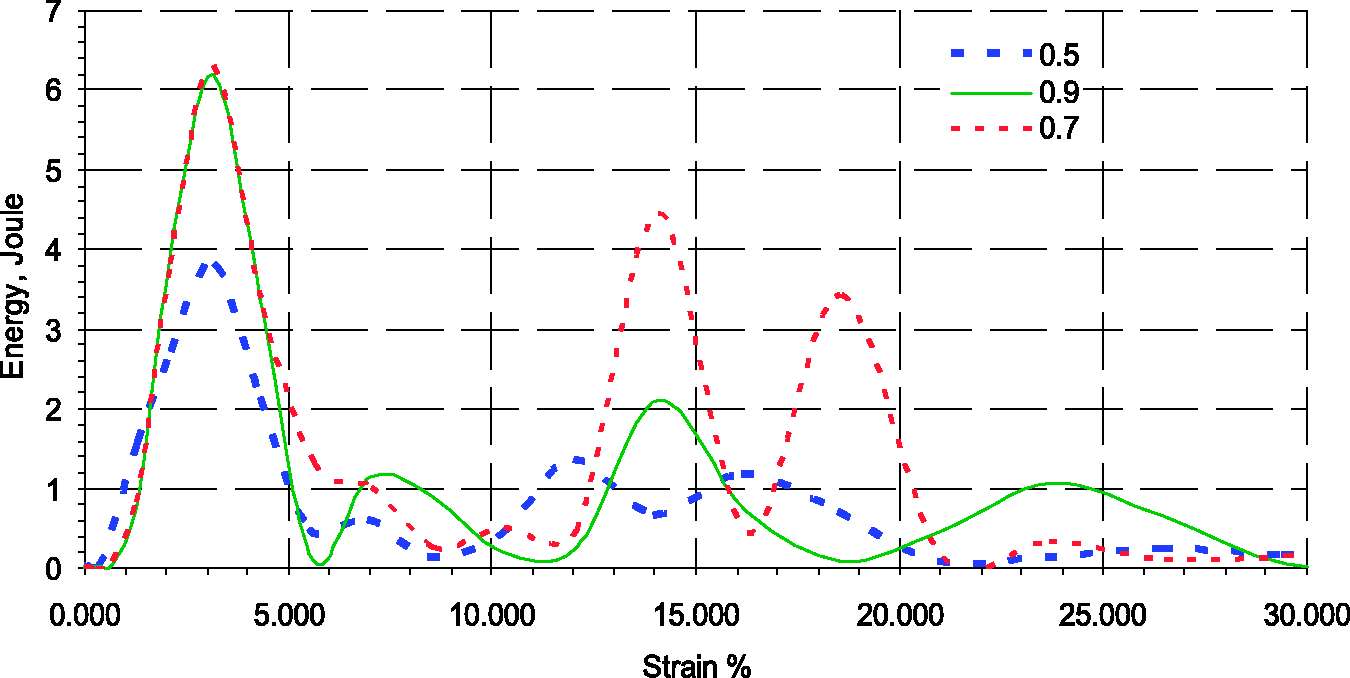
Damage evolution of the conical impactor shape
Figure 10 presents the woven fabric model puncture damage by the conical impactor at 20% strain. Stress wave development for all yarn frictions in woven fabrics were initially commenced from localized principle yarns at the puncture impact region and gradually spread towards the boundary condition. Diagonal stress wave formations were formed along the warp and weft principle yarns.
Woven fabric damage at 20% strain of three friction levels: (a) 0.5; (b) 0.7; (c) 0.9.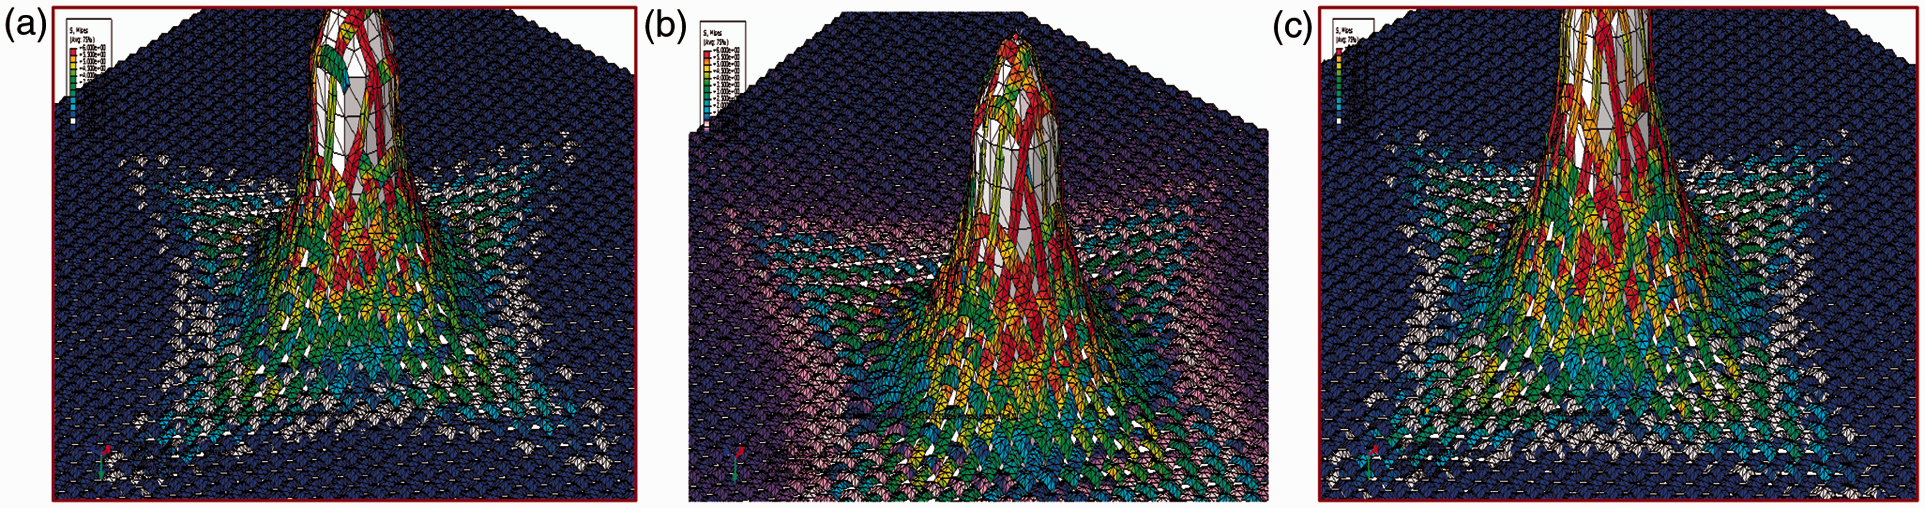
Woven fabric with the lowest friction setting of 0.5 presented the highest number of element removals, as the material property in the model had exceeded its breaking point. Figure 10(a) illustrates the 0.5 friction setting for woven fabric damage at 20% strains. Figures 10(b) and (c) show that woven fabric with the medium and stiffest yarn friction presented fewer element removals in the damage evolution analysis, which demonstrated its ability to distribute the puncture stress out of its impact region. This was achieved by tight yarn-to-yarn interaction in view of propagating decrimping and the crimp interchange phase during puncture impact force.
Damage evolution of the flat impactor shape
Woven fabric damage impacted by the flat impactor shape is illustrated in Figure 11. Within 20% strain, woven fabric models elucidated four critical phases, namely decrimping, yarn extension, yarn breakage and wave propagation from the impact zone. The analysis suggested that the decrimping phase was responsible for stress-ring formations, as woven fabric non-linearities occurred within 5% strains. Yarn extensions started to occur in the cone neck region as soon as the decrimping phase successfully straightened the interlaced yarn path in woven fabrics. All of the models showed yarn breakage or element removal to occur between the stress-ring and cone neck regions when yarn stress exceeded the breaking point. At the same time, stress waves dissipated from the impact zone towards the fabric boundary condition. The stress wave formation was not only formed along principle warp and weft yarns, but also dissipated to its neighboring yarns. The stress wave formation for the flat impactor spread at a faster pace compared with the conical shape impactor. Faster stress wave formation was attributed to a larger impactor and woven fabric interaction surfaces, which led to efficient decrimping and yarn extension phases.
Woven fabric damage at 20% strain of three friction levels: (a) 0.5; (b) 0.7; (c) 0.9.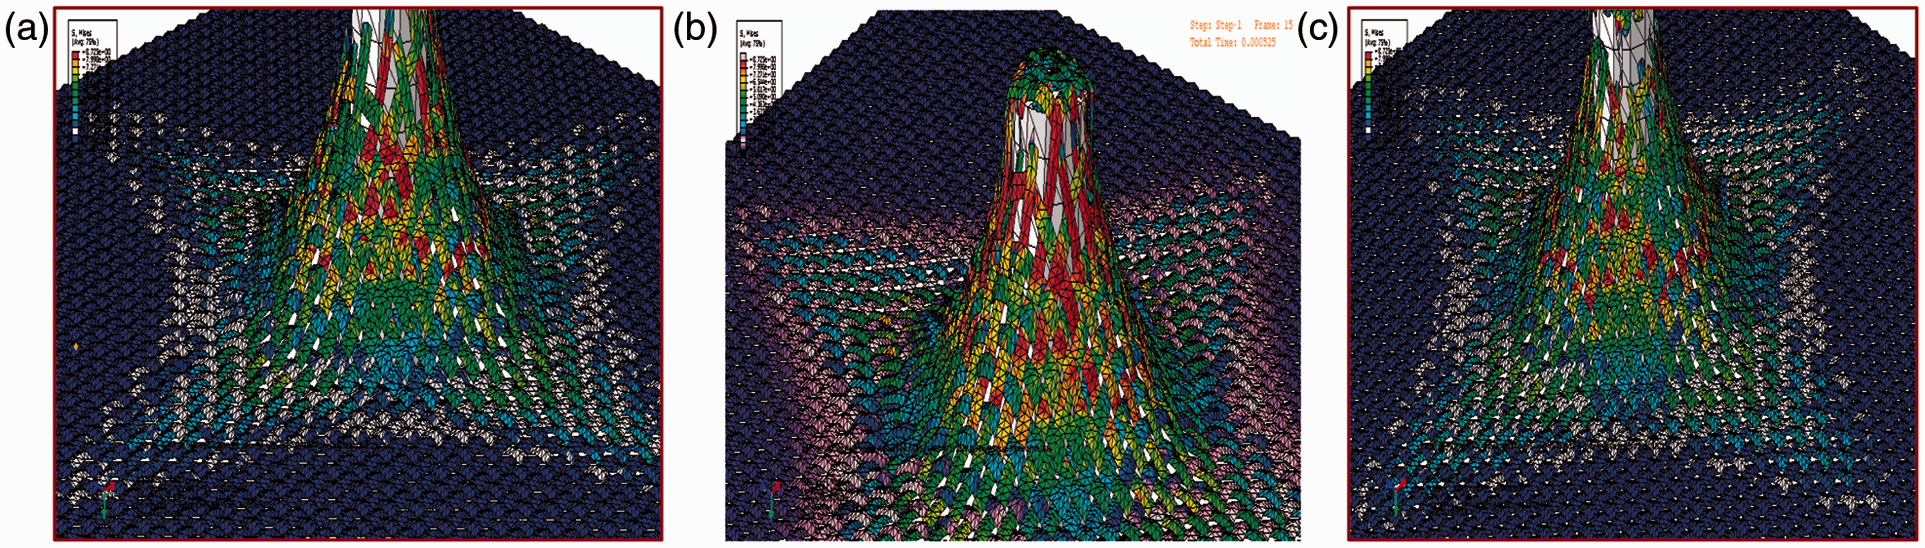
Conclusion
The experiment and finite element analysis of woven fabric exposed to puncture load were reviewed and validated by using isotropic elastic-plastic material properties. The use of a flat shape impactor in puncture impact would establish large yarn involvement in the resisting puncture impact interaction in the cone nose region. On the other hand, the use of the sharper impactor nose would result in yarn stress development as soon as an impactor interacted with the woven fabric model, and eventually weaken the fabric. The impact simulation with the conical and flat shape impactors were performed with three friction levels at 0.5, 0.7 and 0.9. For both impactor shapes, woven fabric with 0.9 friction presented the largest resistance to fail in puncture impact compared to 0.5 and 0.7 frictions. In contrast, woven fabric with the lowest yarn friction (0.5) showed the most non-linear behavior at low strain percentages compared to 0.7 and 0.9 friction settings in stress–strain analysis. The stress–strain analysis suggested that increasing yarn friction settings reduced the non-linear behavior of woven fabrics and at the same time generated larger stiffest fabric response against puncture due to tight yarn interactions. Woven fabric with 0.9 friction setting developed the largest post-impact kinetic energy peak within 5% strain and this was later followed by smaller peaks. This showed that tight woven fabric when impacted by the flat impactor developed a significant crimp interchange phase that was eventually followed by yarn extension at extended strain percentages. On the other hand, woven fabric with 0.9 friction setting when impacted by the conical impactor demonstrated smaller post-impact kinetic energy peak within 5% strains that was followed by larger energy peaks at 10% strain. This finding suggested that the tightest plain woven fabric when punctured by the conical impactor experienced a gradual increase of crimp interchange phase during low strains. The research suggested that it is possible to simulate puncture behavior in woven fabrics by using uniaxial tensile damage modeling methodologies, with higher fabric density specifications. However, the yarn assumptions in the simulation as monofilament and large mesh seeding size lead to stiff stress–strain simulation performance compared to the respective experimental results.
Footnotes
Funding
Yarn plastic true stress–strain conversions
| True stress (Pa) | Plastic strain (mm) |
|---|---|
| 2.52286 E + 12 | 0 |
| 5.42934 E + 12 | 0.414091 |
| 7.85773 E + 12 | 0.508415 |
| 9.23624 E + 12 | 0.600202 |
