
Abstract
The electrical resistance of knitted fabrics embedded with conducting yarns at different temperatures was studied in this paper. Two types of resistance, linear resistance and contact resistance have been considered and discussed by experimental studies and theoretical modeling. Two silver-coated conductive yarns, yarn A and B, with linear resistance of 68.6 Ω/cm and 1 Ω/cm respectively, were embedded into normal knitted woolen fabrics. The temperature effect on the resistance of these two conductive knitted fabrics as a function of applied voltages was extensively explored. The results have shown that the resistance of either conductive knitted fabric decreases significantly (maximum 30%) when its temperature is rising. It can be explained by two main factors: the electrical resistance of the silver-coated conductive yarns decreases as temperature rises; the physical contact of the overlapped conductive yarns extends due to heating on woolen fabrics, which causes a decrease in contact resistance. This research has shown that the temperature effect on the conductivity of the knitted fabrics embedded with conductive yarns should be carefully considered in future industrial applications.
Due to the recent development of wearable electronic textiles and smart textiles, the conductive fabrics and electrically heated garments have been extensively studied and applied in many fields.1–7 Various electrically heated garments have appeared in the current clothing market. However, comprehensive and scientific research on their working principles has neither been conducted nor published. Conductive knitted fabrics, in which conducting yarns are embedded with other normal yarns during fabric production, are the most selected material for the application of heating garments due to their high mechanical stability and flexibility. Heating garments possess some good characteristics that could be widely applied in fields such as body warming and physical therapy, and in assisting drug delivery.8–11 Therefore it is critical to explore the effects on the characteristics of conductive knitted fabrics, under various conditions. In 2010, Li et al. proposed a theoretical model of a two-dimensional network of electrical resistance to explore the characteristics of the conductive knitted fabrics in a static condition. This model details the relationship between the resistance of the knitted fabrics and the number of courses and wales.12–13 Later in 2013, Li et al. proposed another thermal dissipation model to simulate the heating process of the conductive knitted fabrics and proved that wool is one of the best materials for heating fabrics because of its outstanding performance in heat retention. 14 In previous studies, the strain was considered to be the only factor which influences the contact resistance, while the effect from temperature was ignored. However, it is widely known that the resistance of a conducting material will change with its temperature. There are questions to ask: to what extent does the heating temperature affect the fabric resistance? In practical applications, can such effects be ignored or not? In this study, measurements of resistance of fabric under a range of applied voltages were taken to present the answers and give a deep insight into the mechanism of these effects coming from temperature.
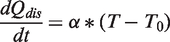
When electrical current flows through a conductive knitted fabric, heat is generated in the conducting embedded yarns in the fabric. The temperature will hence rise. The power of input is:

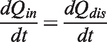
By substituting equations (1) and (2) into equation (3), we can obtain
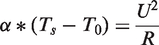
Therefore, the steady-state temperature Ts of the conductive fabric under an applied voltage U becomes:
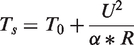
If the resistance is assumed to be constant in the whole heating process, the steady-state temperature of a heated fabric will merely depend on the applied voltage, the fabric resistance and the thermal conductivity coefficient. Thus the temperature of the heating garment can be easily predicated. However, in fact, the temperature may affect the fabric resistance:

By rearranging equation (5), we obtain:
The solution

And equation (5) becomes

Hereafter this relationship will be used instead of the former one, since it is straightforward and less complicated. It can be found that the deviation of the predicted temperature can be very large if the resistance is sensitively dependent on the applied voltage. As a result, the sensitivity in dependency of the resistance of the conductive fabric on the temperature or the applied voltage will determine the level of accuracy in the prediction of the steady-state temperature.
Experimental design
In order to find the main factor that causes the resistance change, the resistances of the fabrics and conductive yarns as functions of temperature and applied voltage were investigated, respectively. The detailed experimental design is introduced below:
Materials, yarn and conductive knitted fabric production
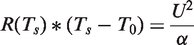
Wool is the most commonly used base material in heating fabrics due to its outstanding performance in heat retention. In addition, the conductive characteristic of knitted wool has been extensively explored before. These are the reasons why wool was chosen in this research. Conductive yarns were embedded into the knitting structure to make the whole fabric conductive. Two kinds of silver-coated yarn A and B, both made by German company named Statex GmbH, were adopted, because of their high stability in resistance. Yarn A, a monofilament with resistances of 68.6 Ω per cm (2.2 tex), was incorporated with woolen yarns to make the heating area (Figure 1(a)). Another silver-coated yarn, B, which is a balanced two-plied yarn made from multifilament single yarns, with resistances of 1 Ω per cm (47 tex), was used to knit conductive paths as the electrodes of electric power supply (Figure 1(b)). The inner fibers of yarn A and yarn B are nylon 6 and nylon 66 respectively. Figure 1(c) shows the SEM of yarn A and yarn B. Three types of heating fabric samples were prepared. Sample 1 (100 courses, 100 wales, loop density: 9 courses/cm and 12 wales/cm) and Sample 2 (100 courses, 100 wales, loop density: 7 courses/cm and 8 wales/cm) were designed with the Stoll M1 programming system and knitted on a Stoll computerized flat knitting machine. Samples 1 and 2 had the same knitted structure (Figure 2(a)) but different loop densities. As a comparison, Sample 3 had a different construction. Sample 3 was a woven fabric and yarn A was weft inserted without overlapping in the heating area of Sample 3, which means that there was only conductive resistance but no contact resistance in the heating area (Figure 2(b)).
(a) Longitudinal view and cross-sectional view of yarn A and (b) yarn B; (c) SEM of conductive yarn: (left) yarn B and (right) yarn A. (a) Knitted structure of Samples 1 and 2. Yarn A (blue) is knitted together with woolen yarn (yellow) from the right; (b) Sample 3 is a woven fabric where yarn A (blue) is weft inserted.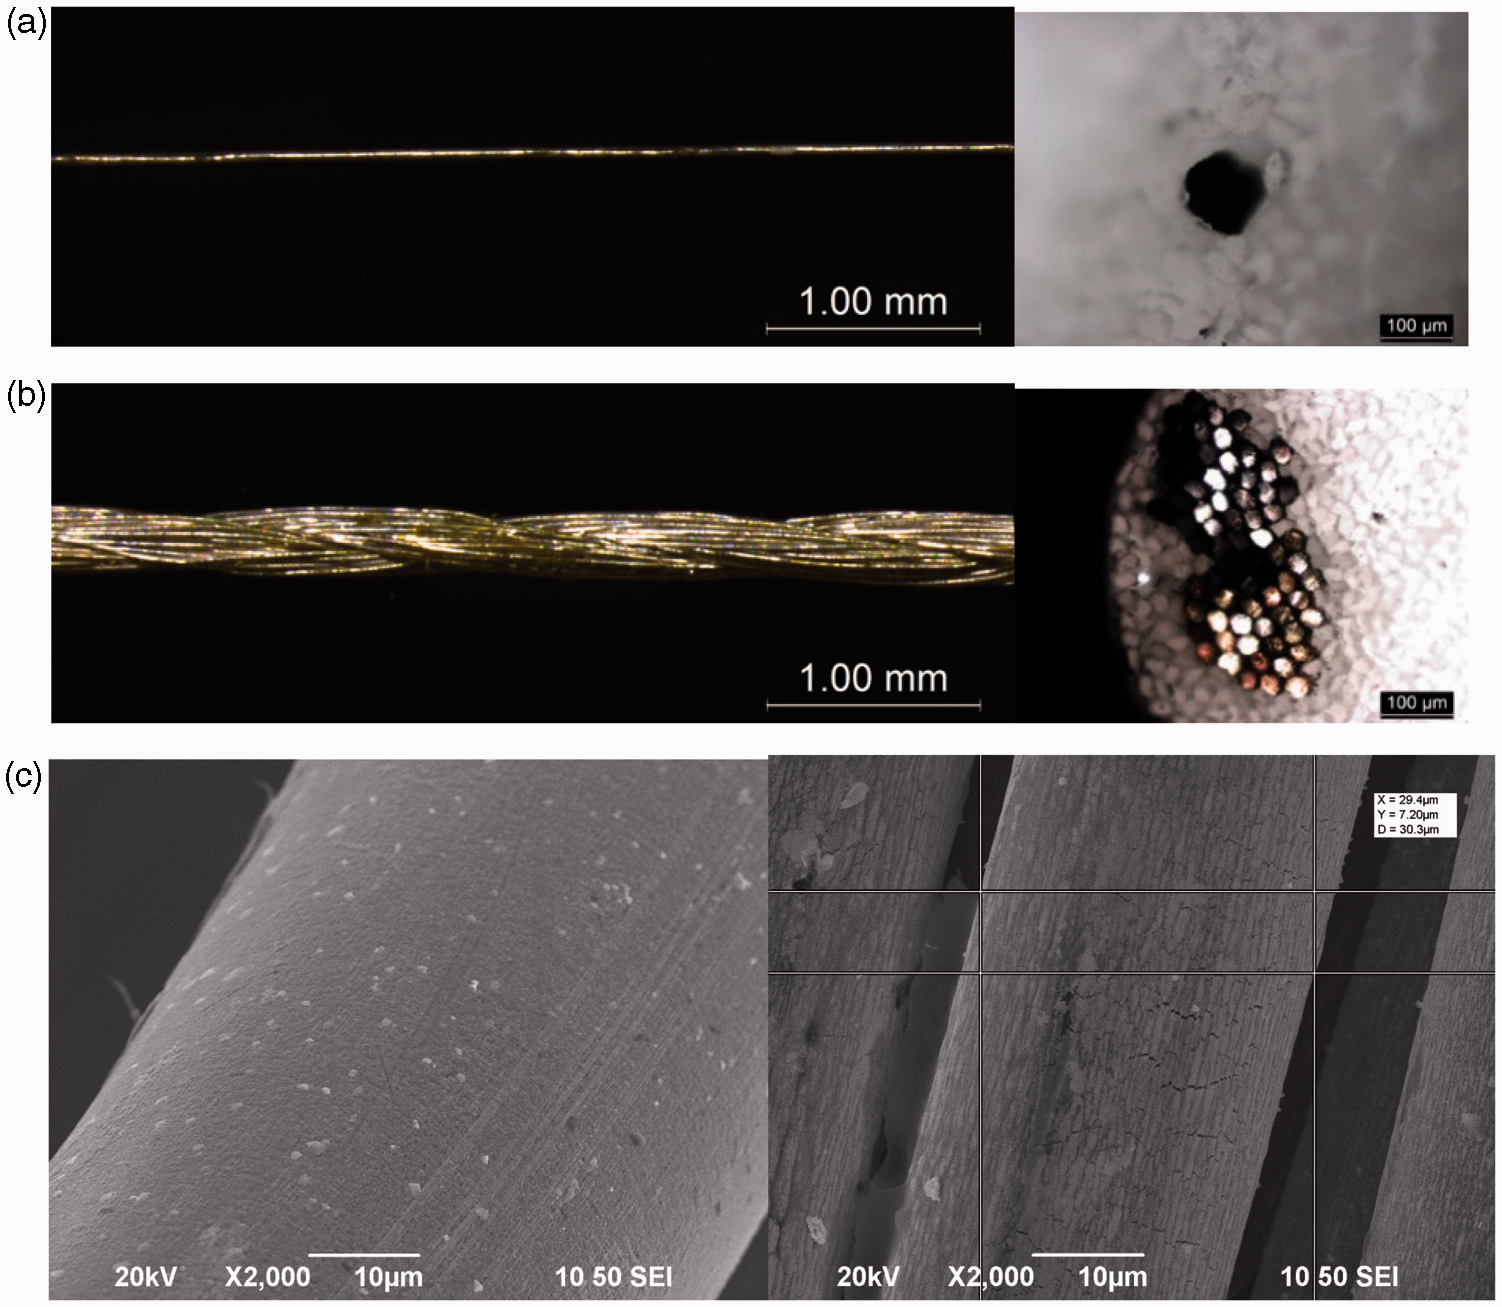

Experimental setup
A variable electric power supply was used to test the samples. The sample was dry relaxed and flattened on a foam board with the help of needles. Nine temperature sensors, which were embedded into different positions of the fabric matrix, were employed to measure the temperature of the fabrics. The sensors were mounted evenly spaced in 3 × 3 matrix in the heating area by using tapes. The temperatures were obtained by the temperature acquisition system with an error of less than 1℃ (Figure 3). Nine measured temperatures were averaged to represent the apparent temperature of the heated fabrics as well as minimize the measurement error.
Temperature acquisition system (left) and Honeywell temperature sensor HEL-705-T-0-12-00 (−200 to 600℃) (right).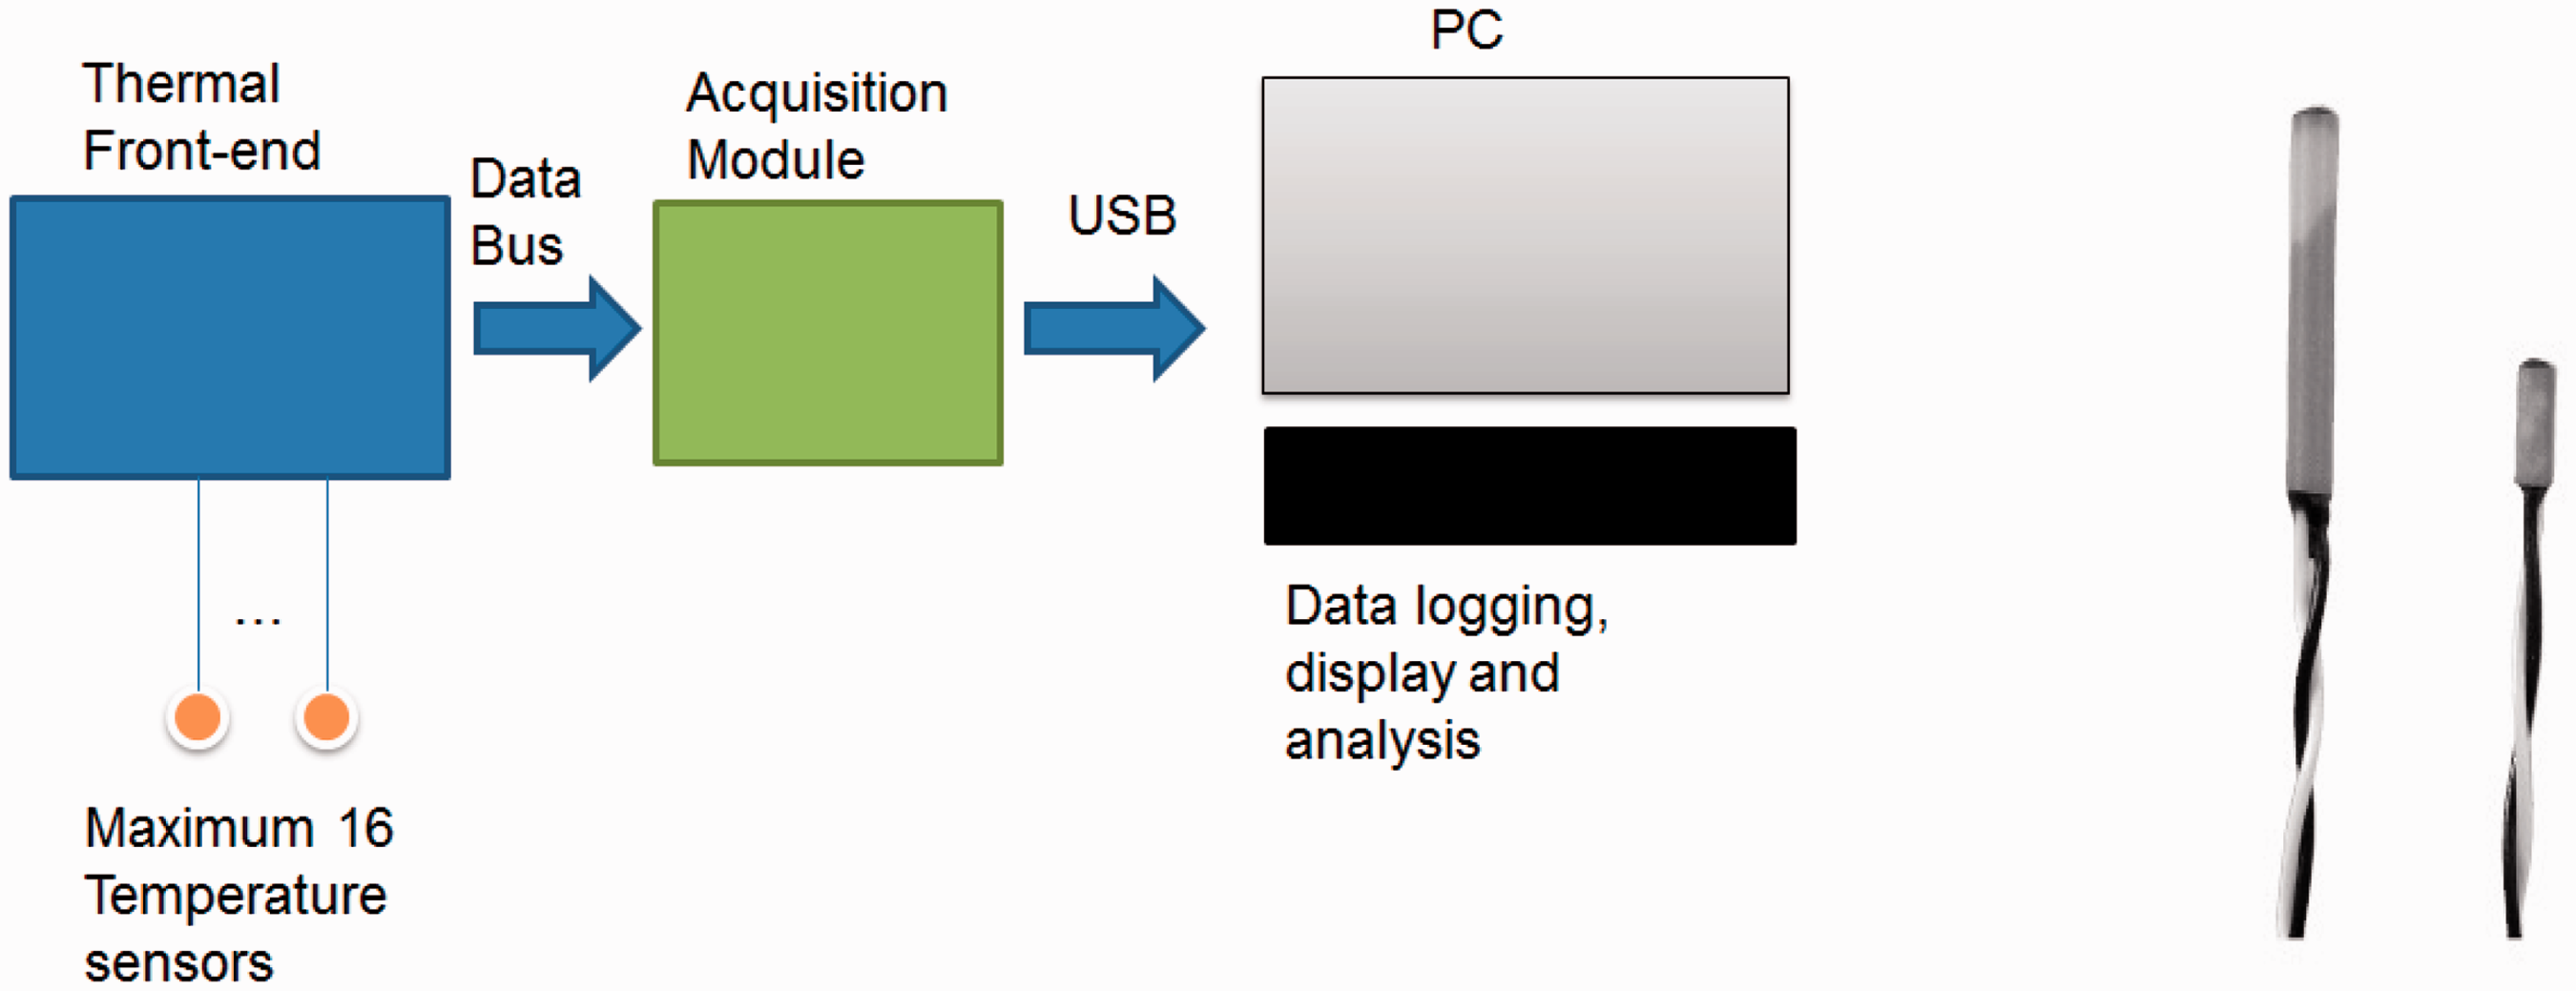
Test of the voltage effect on the conductivity of knitted fabrics
The power supply was used to heat Sample 1 or Sample 2 for 3600 s in each test. The resistance value of the sample was recorded every 10 s during the first 600 s and every 100 s in the remaining 3000 s, since it was observed that the resistance of the fabric changed sharply at the beginning time of heating and become stable after prolonged heating. Each sample was tested with a 5 V, 10 V and 15 V voltage supply, respectively. Each sample was left for 24 h or longer after the test to ensure that the sample could recover to its original condition preparation for next testing. After each test, as soon as the fabric was cooled down (normally in 100 s), the resistance of the sample was measured. Although the temperature of the fabric would still be slightly higher than the ambient temperature, the variation was so small that it could be negligible. Three resistances were measured for each sample under each voltage—the resistance before heating, resistance after a long-period of heating (3600 s) and resistance after cooling down.
Measurement of temperature effect on the conductivity of the knitted fabrics
A heating machine heated Sample 1 and 2 up to three temperatures, 30℃, 40℃ and 50℃, respectively, for 10 min. After heating, the samples were left cooling down for 100 s under standard conditions, and the corresponding resistances were recorded immediately.
Measurement of temperature effect on the conductive yarns
A15V voltage was applied to Sample 3 to heat the fabric for 1200 s. The resistance of the sample was recorded every 5 s in the first 100 s and then every 10 s in the remaining 1100 s. Similar to Experiment 1, the resistance of Sample 3 after cooling down was measured. In the meantime, the resistances of single yarn A and single yarn B were measured under standard conditions and after heating under 60℃, accordingly.
Measurement of R–U and T–U curves of the fabrics
Sample 2 was selected as a case study since its loop density was similar to a common knitted fabric in most applications. Sample 2 was applied with voltages from 5 V to 15 V with 2 V step size, and in each test the heating period was 3600 s. The resistance was recorded at the end of each test and the corresponding R–U curve was obtained. Similarly, the T–U curve was obtained for the same experiment, but the voltages 5 V to 18 V with 1 V step size were applied to heat Sample 2 for 3600 s in each test. Sample 2 was left for 24 h after the test to ensure that the sample could recover its original condition for subsequent testing.
All tests were conducted under standard conditions with an air pressure of 1 atmosphere, temperature of 21.5 ± 0.5℃, and humidity of 60 ± 2%.
Results and analysis
Voltage effect on the conductivity of knitted fabrics
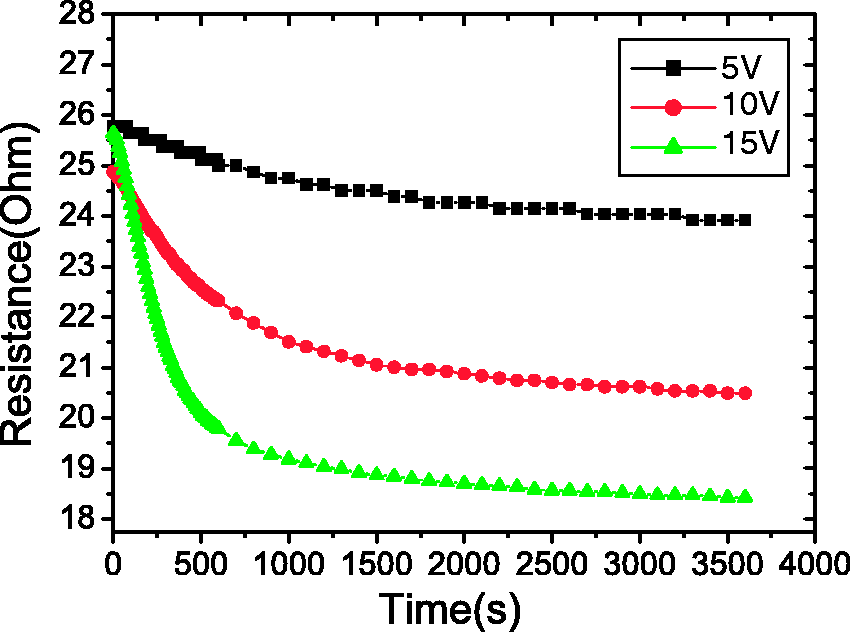
The plots of resistances of Samples 1 and 2 under 5 V, 10 V and 15 V against time are shown in Figures 4 and 5. It is clear that all the resistances go down during the heating process except the slight rise during the very short initial period as shown in the inserted subfigure of Figure 4. The higher voltage applied, the smaller the resistance is. The resistance of every sample drops quickly in the first 500 s when a voltage is applied, and then experiences a continuous and slow decrease during the rest of the heat time. The amount of total resistance drop is significant. As shown, the resistance of Sample 2 decreases by approximately 7%, 18% and 30% at voltages of 5 V, 10 V and 15 V respectively. Such a change may lead to a corresponding error of predicated power of 15%, 30% and 50% respectively.
The resistance of conductive knitted fabric Sample 1 vs. time under the applied voltage of 5 V, 10 V and 15 V, respectively. The resistance of conductive knitted fabric Sample 2 vs. time under the applied voltage of 5 V, 10 V and 15 V, respectively.
Theoretically, the total resistance of the conductive knitted fabric includes the linear resistance of the conductive yarns and the contact resistance between conductive yarns in the samples:

To our best knowledge,
Sample 1 has high loop density, which leads to low thermal conductivity coefficient. When power is applied to Sample 1, its temperature rises very quickly, as evidenced in Figure 4. However, the total resistance of Sample 1 under 5 V voltage will not increase at the beginning because the 5 V is too low to provide the fabric with enough power to increase its temperature quickly. The factor increases the conductive resistance weighed less than the factor decreases the resistance initially. After a few seconds, the rise in temperature slows and the decrease in resistance becomes predominant. Consequently, the total resistance of the heated fabric will fall down and tend to be stable, finally reach the steady state. In Figure 5, the total resistance of Sample 2 goes all the way down under three voltages. This is because Sample 2 has lower loop density compared with Sample 1, and consequently it has better heat dissipating capacity. High thermal conductivity results in slow temperature rise when heating power is supplied. That’s the reason why an increase in the conductive resistance will not stand out in the initial time in Figure 5. In addition, it is illustrated in Figures 4 and 5 that the initial resistances at t = 0 (normal condition) measured at different voltages are not exactly the same because the physical deformation of testing fabric and/or yarn structure is not perfectly reversible and the resistance cannot return exactly to the original value.
The comparison of the three resistances, the resistances in normal condition (before heating), the resistance in steady state and resistance after cooling down (about 100 s after the power is discontinued) under different voltages are shown in Figures 6 and 7.
The comparison between Sample 1’s three resistances (resistance before heating, resistance in steady state and resistance after cooling down) under 5 V, 10 V and 15 V. The comparison between Sample 2’s three resistances (resistance before heating, resistance of steady state and resistance after cooling down) under 5 V, 10 V and 15 V voltage.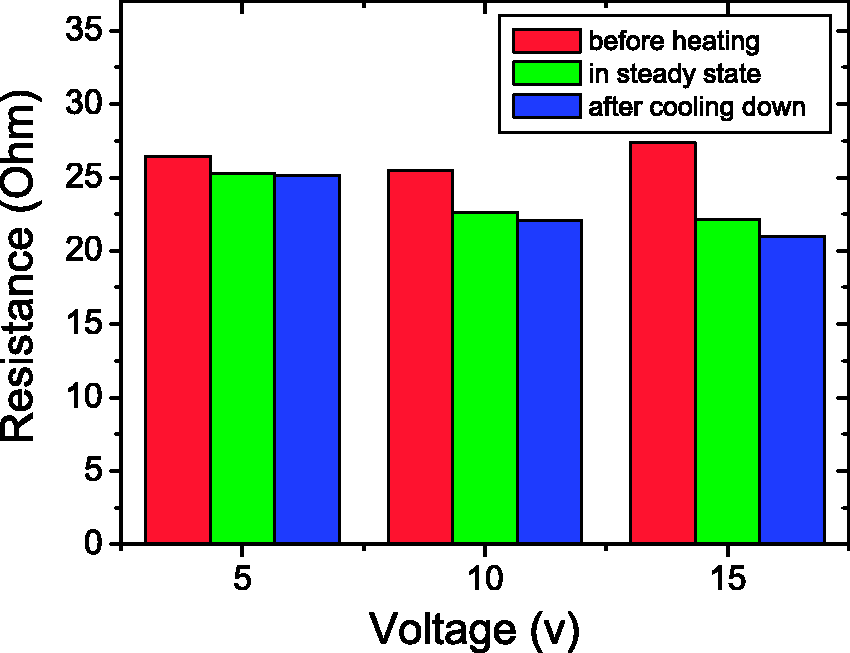
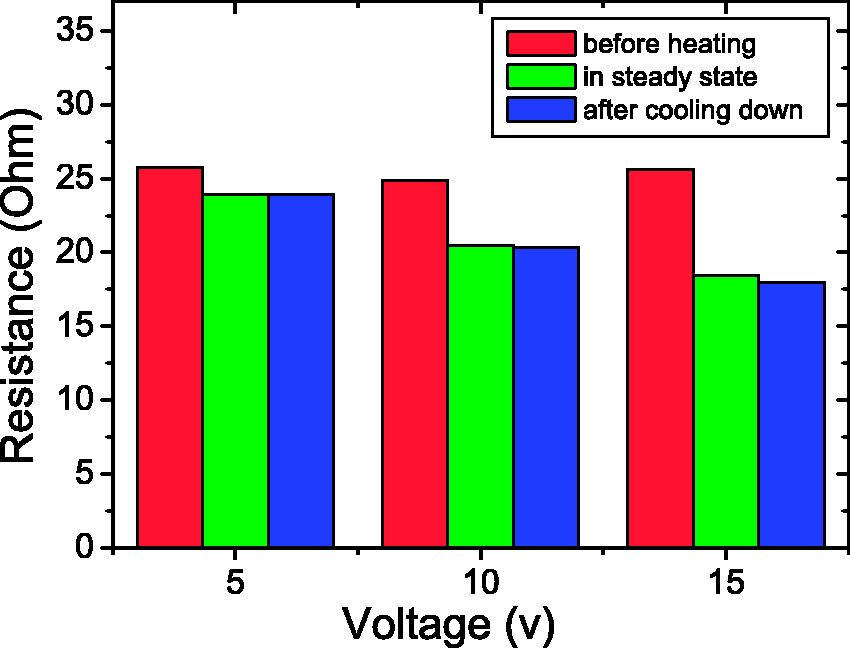
When the power applied to the heated fabric is removed, the physical condition of the fabric and its conductive yarns would not be changed immediately, which means that it would take a while before the fabric recovers from the steady state to the normal condition. Therefore, the total resistance after cooling down will decrease due to the decrease in the resistivity of silver. This has been verified in Figures 6 and 7: the resistance after cooling down is smaller than the resistance during heating. It is interesting that a conductive knitted fabric can stay in “working condition” with merely thermal heating and it takes a long time to get out of the “working condition.” This is the reason why we set the time interval to be 24 h. It is observed in both Figure 6 and 7 that a higher voltage contributes to a larger drop in the resistance after cooling down (comparing the green and blue columns), since higher voltage contributes to higher temperature, and in turn leads to larger resistivity of silver.
Comparing Figure 6 with Figure 7, we can observe that the drop in the resistance after cooling down under the same voltage is more obvious in Figure 6. This is because of the fact that Sample 1 has a higher temperature than Sample 2 due to its higher loop density and thermal capacity. In fact, Figure 6 and 7 can also show that the resistance drop from working condition to normal condition is much larger than the conductive resistance change caused by the decrease in temperature.
The temperature effect on the conductivity of knitted fabrics
Resistances of Samples 1 and 2 after heating up to 30℃, 40℃, and 50℃ and in standard conditions are shown in Figure 8.
The resistance of Samples 1 and 2 after being heating to 30℃, 40℃ and 50℃ and cooling down is compared with resistance under standard conditions (21℃).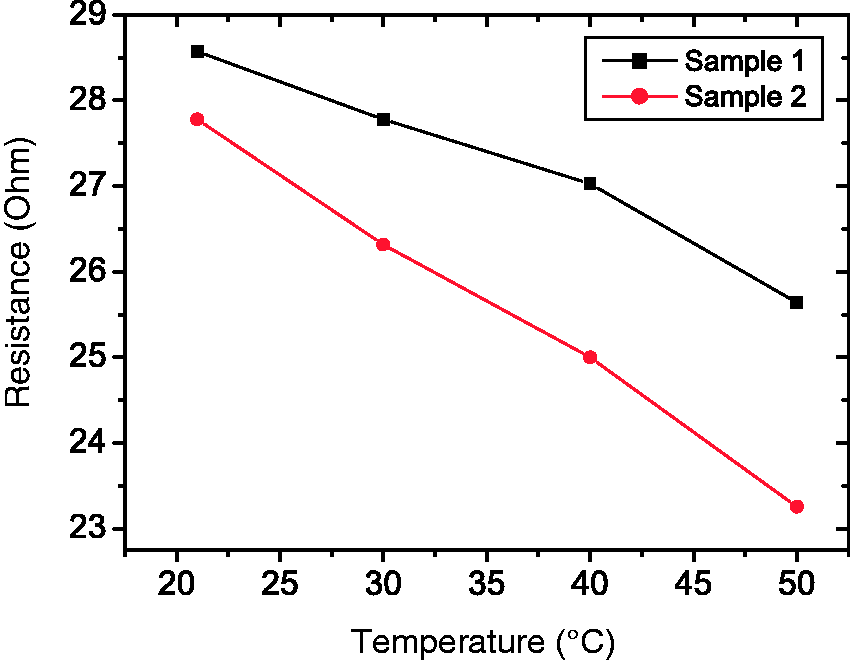
Figure 8 clearly shows that even without electric power, the resistances of these two samples will go down after merely thermal heating. This result strongly supports the conclusion that the rise in temperature is the main factor which is responsible for the change in resistance of the conductive fabrics.
The temperature effect on the conductive yarns
It has been previously mentioned that the conductive yarns in Sample 3 are perfectly parallel and have no contact with each other. However, Figure 9 shows that total resistance of Sample 3 also goes down when the power is applied in the same way as that for Sample 1 and 2. This result illustrates that The resistance of Sample 3 vs. time under 15 V voltage.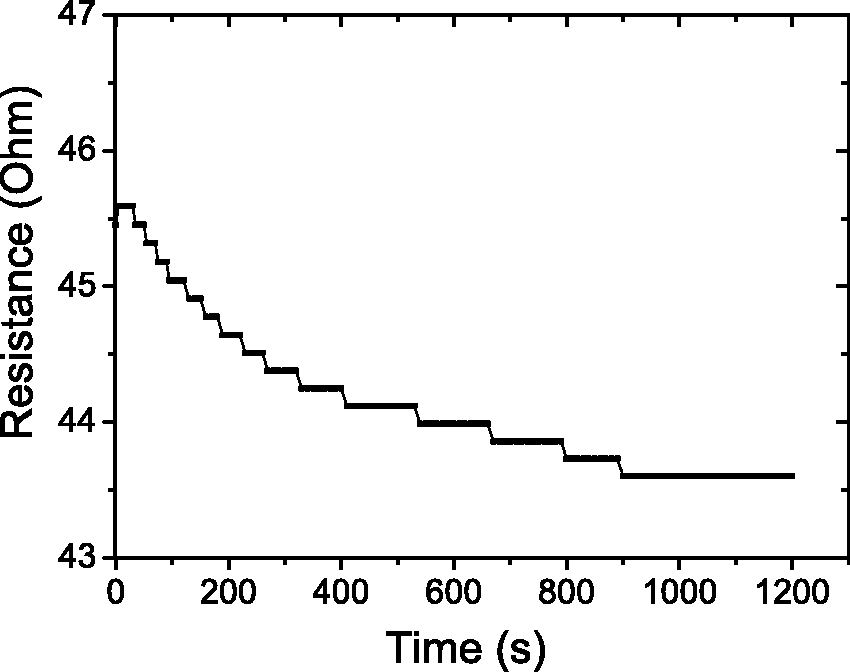
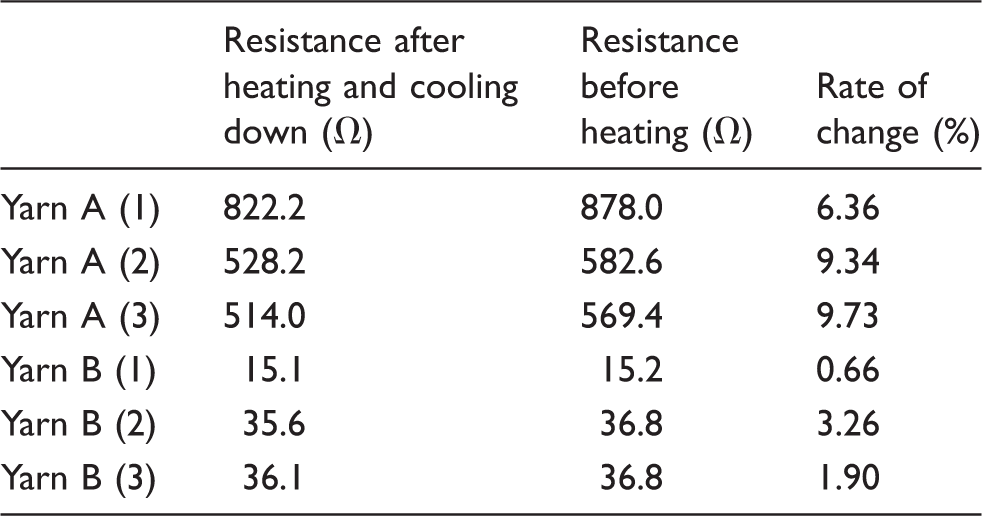
Resistances of yarns A and B before heating and after heating at 60℃
The fact that the heating process can decrease
Resistances of Samples 1, 2 and 3 and yarns A and B before and after heating
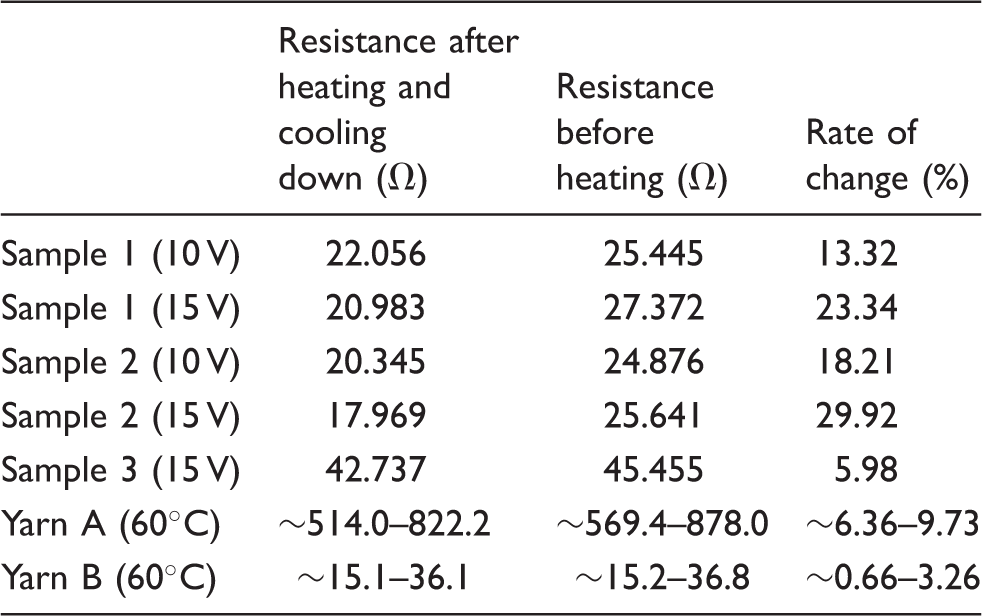
In fact, the resistivity of yarn A is much larger than that of yarn B, so we could ignore the influence from yarn B on the total resistance. Table 2 shows that the rate of change in resistance of yarn A is close to that of Sample 3. However, this rate of yarn A and Sample A is far smaller than that of Sample 1 and 2, which has been observed in Table 2. It could be deduced that the reduced contact resistance must play a vital role in total resistance deduction when the conductive knitted fabric is heated. It is speculated that the thermal expansion of the woolen fibers and fabrics makes the conductive yarns contact tightly at high temperatures.
So far, we have clarified that both the linear resistance of yarns and the contact resistance between yarns are sensitive to the temperature, and they should both be taken into account when we apply conductive knitted fabrics for heating.
R–U and T–U curve for the fabric
Resistance R of Sample 2 as a function of voltage U is shown in Figure 10, where R is the resistance in the steady state.
R–U curve for Sample 2 and the linear fitting of the data (dotted line).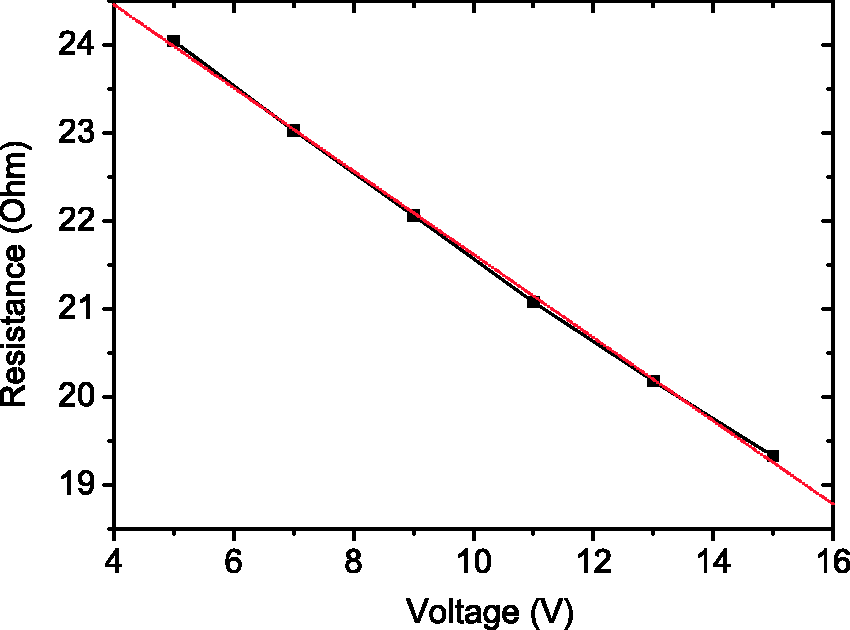
Linear fitting is used to fit the R–U curve. The fitting equation is y = 26.35 − 0.47x and the correlation coefficient is 0.99, which indicates a linear relationship between the resistance of fabric and the voltage applied. The function R(U) is:

And equation (7) becomes

Equation (9) is used to fit the measured T–U curve and both of the curves are shown in Figure 11. The fitted heat dissipating coefficient α = 0.5176 (W/℃) and the correlation coefficient is 0.99, which indicates equation (9) can be used for temperature prediction for the whole voltage range. Substituting The measured (solid line) and fitted (dotted line) temperature of Sample 2 as a function of voltage.
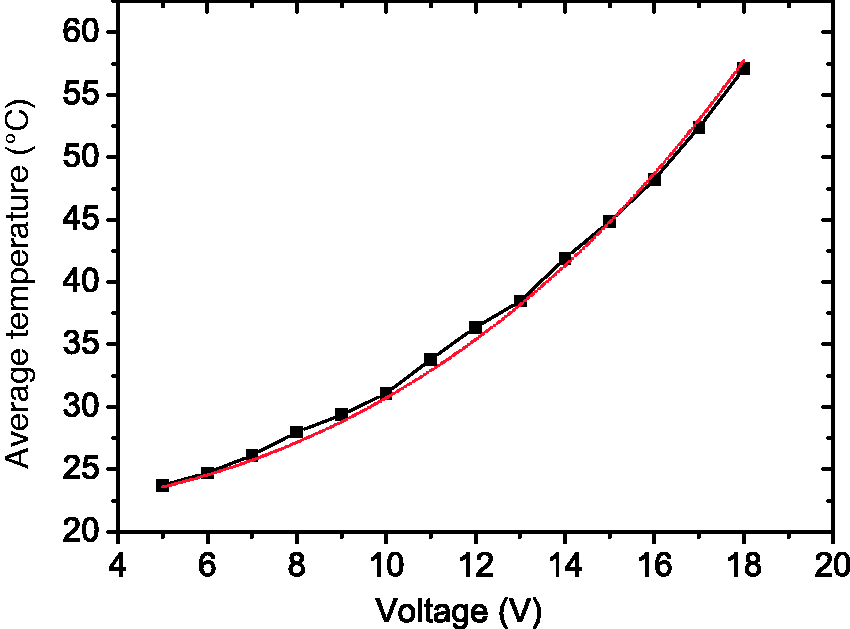
Equation (10) can be used to predict the steady state temperature of the conductive knitted fabric. As shown in Figure 11, one can see that the error is within 1℃. On the other hand, a large error exists if the change in resistance is not properly considered.
As shown in Figure 12, without considering the change in resistance, the error of the predicted temperature is more than 10℃ when an 18 V voltage was applied.
The temperatures of Sample 2 vs. applied voltage for two cases: (a) the resistance change is considered and (b) neglected.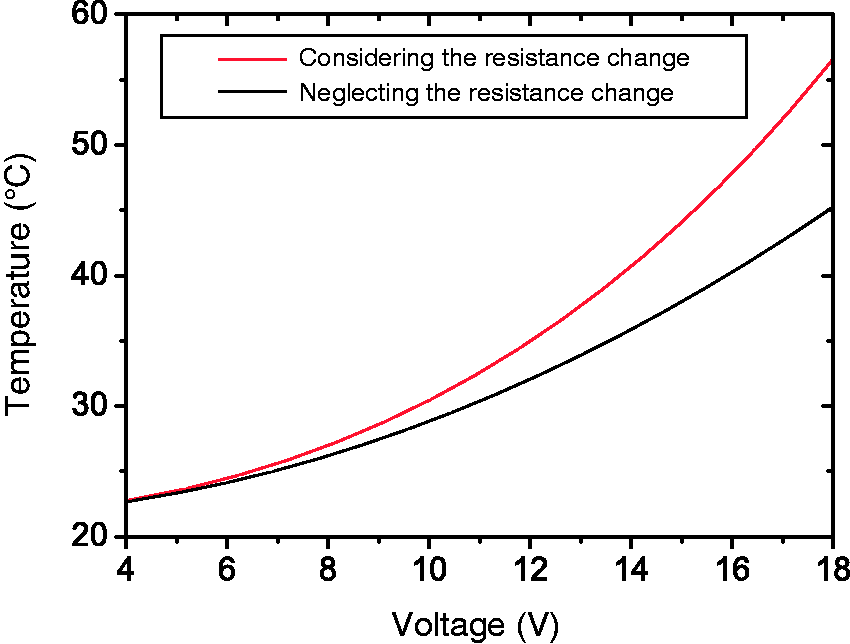
Conclusion
Not only the linear resistance of the conducting yarns, but also the contact resistance between conducting yarns, will play an essential role in the total electrical resistance of the conductive knitted fabric. They will both decrease with increasing temperature. In summary, the total resistance of the conductive knitted fabric will change dramatically when the fabric is heated. As a result, we have to pay more attention to this characteristic of conductive knitted fabrics in future applications. Furthermore, the relationship between the temperature of a fabric and the voltage applied is analyzed and this discovery can be further used for practical heated temperature prediction.
Footnotes
Acknowledgment
This work is financially supported by the Research Grants Council (RGC) of Hong Kong, China (project number: RGC Ref No.532412).