
Abstract
In the color difference inspection system based on machine vision, two types of dyeing effects need to be evaluated quantitatively according to color measurement results: the color consistency – the color matching degree between the dyeing product and the target; and the color levelness – the color uniformity in different regions of the same dyeing product. The purpose of this paper is to develop the color consistency and levelness evaluation algorithms and a new evaluation model of dyed fabrics based on the Support Vector Machine (SVM). Firstly, the evaluation goals were quantitatively classified into five different levels according to ISO 105-A02:1993; secondly, six color difference-related features from two color spaces were defined as the evaluation indexes, among which several independent ones were chosen using the Principal Components Analysis method from the training data and test data to improve the speed of the evaluation while retaining the accuracy. Finally, the evaluation model was built by employing the SVM method and its parameters were optimized with the Genetic Algorithm. The SVM model was then used to evaluate the dyeing effects according to the measured color difference-related features. Experimental results show that compared with the traditional Naive Bayesian algorithm, the proposed evaluation algorithms and model in this paper can evaluate the color quality of dyed fabrics quickly and decisively, with prediction accuracy increasing by 9% and relative error reducing by 0.0985.
Color difference refers to the difference between two color samples in color perception, that is, the integrated performance of chrome, lightness and hue. 1 In the textile dyeing and printing industry, color difference evaluation is a very important process during the dyeing process and before the final dyed fabrics leave from the factory. The purpose of color difference evaluation is to find the following: (1) the color matching degree between the dyeing product and the sample; and (2) the color uniformity of the dyeing product.
At present, the color difference evaluation of dyed fabrics in many dyeing factories is mostly done by workers, depending on their eyes and instruments, which can be greatly improved in accuracy and speed. The adoption of the color difference evaluation system based on machine vision is becoming popular because it can not only improve evaluation efficiency better, but also can overcome the subjective influence of human beings, making the evaluation results more objective. Many research institutions and companies have studied and developed many color difference inspection systems based on machine vision. For example, Nobbs and Connolly 2 proposed a colorimeter based on a video camera. Yang and Sun 3 utilized the Digital Signal Processing (DSP) and Complex Programmable Logic Device (CPLD) embedded processing platform with a PC structure to develop a machine vision color difference measurement system. Other similar systems included the Qtex system 4 developed by Sedo Treepoint GmbH in the city of Mengerskirchen in Germany.
In the machine vision system of color difference evaluation, the evaluation results, that is, color consistency and color levelness, should be classified and quantified first. Then, the algorithms for determining how to calculate the values of color consistency and levelness of the dyed fabrics, as well as color difference-related features used for evaluation, should be designed and chosen carefully. Finally, a color difference evaluation model should be designed to obtain the evaluation results in terms of the chosen evaluation indexes. So far researches2,3 have paid more attention to the evaluation system itself, but less to the classification and quantification of color difference evaluation results, as well as the selection of evaluation indexes and the evaluation model. There were many disadvantages in previous color evaluation systems; 4 for example, only single evaluation feature in single color space was used without considering the effects of lighting conditions and background noise. Standard algorithms for color consistency and levelness have been insufficient up to now. Many systems 4 only provided certain color difference specific data, so manpower still was necessary for classification and quantification of evaluation results, leading to them being unable to realize automatic color difference evaluation.
The evaluation model of color difference aims to create a mapping from the color difference-related features to the evaluation results, which essentially is a kind of nonlinear classification model. For this model, many machine learning methods, such as the Bayesian, neural network, Support Vector Machine (SVM), etc., can be very effective. Ji and Qi 5 proposed color classification using the Bayesian method and the image classification based on an image texture feature; Kuo et al. 6 analyzed the color system of embroidery fabric using the neural network method; Chen et al. 7 also carried out color evaluation and clustering in the color measuring system using a neural network; The SVM algorithm proposed by Vapnik and his collaborator is widely used in many fields, such as pattern recognition, image processing and nonlinear process modeling and intelligent control, 8 which can be used as the classifier with obviously higher performance than that of the Radial Basis Function (RBF) Neural Network. 9
The purpose of this paper is to develop the color difference evaluation model for dyeing products in three important steps: (1) classifying and quantifying the evaluated results; (2) developing the color evaluation algorithms and selecting color difference-related features; (3) establishing a color difference evaluation model based on the SVM. This study is the first attempt to resolve the problem for the machine vision color difference inspection system, which has important significance for improving the evaluation speed and credibility of dyed fabrics.
Research methods and color difference evaluation algorithms
The experiment equipments used in this paper include three kinds of light source: A, D65 and D50; a SSC-DC398BP color industrial camera with SSV0358GNB industrial lens made by SONY company; a VT-FA300 image acquisition card; and a common PC installed with image processing software. The finished polyester woven fabrics were used for evaluation. The experimental platform is shown in Figure 1.
Experimental platform of color difference evaluation.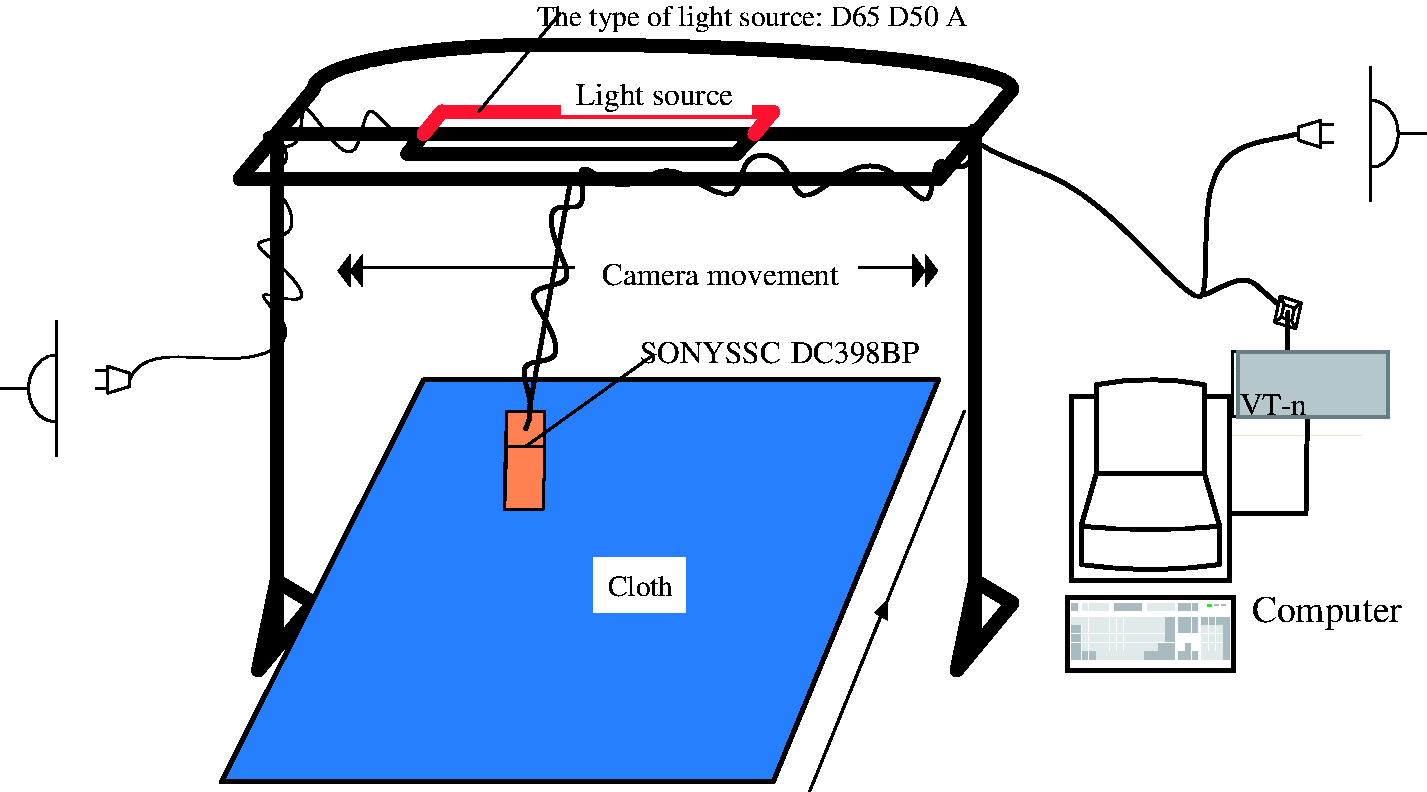
The algorithms involved in this paper were programmed with MATLAB 7.1 under Microsoft Windows XP. The research framework of this paper is shown in Figure 2.
Framework of this paper.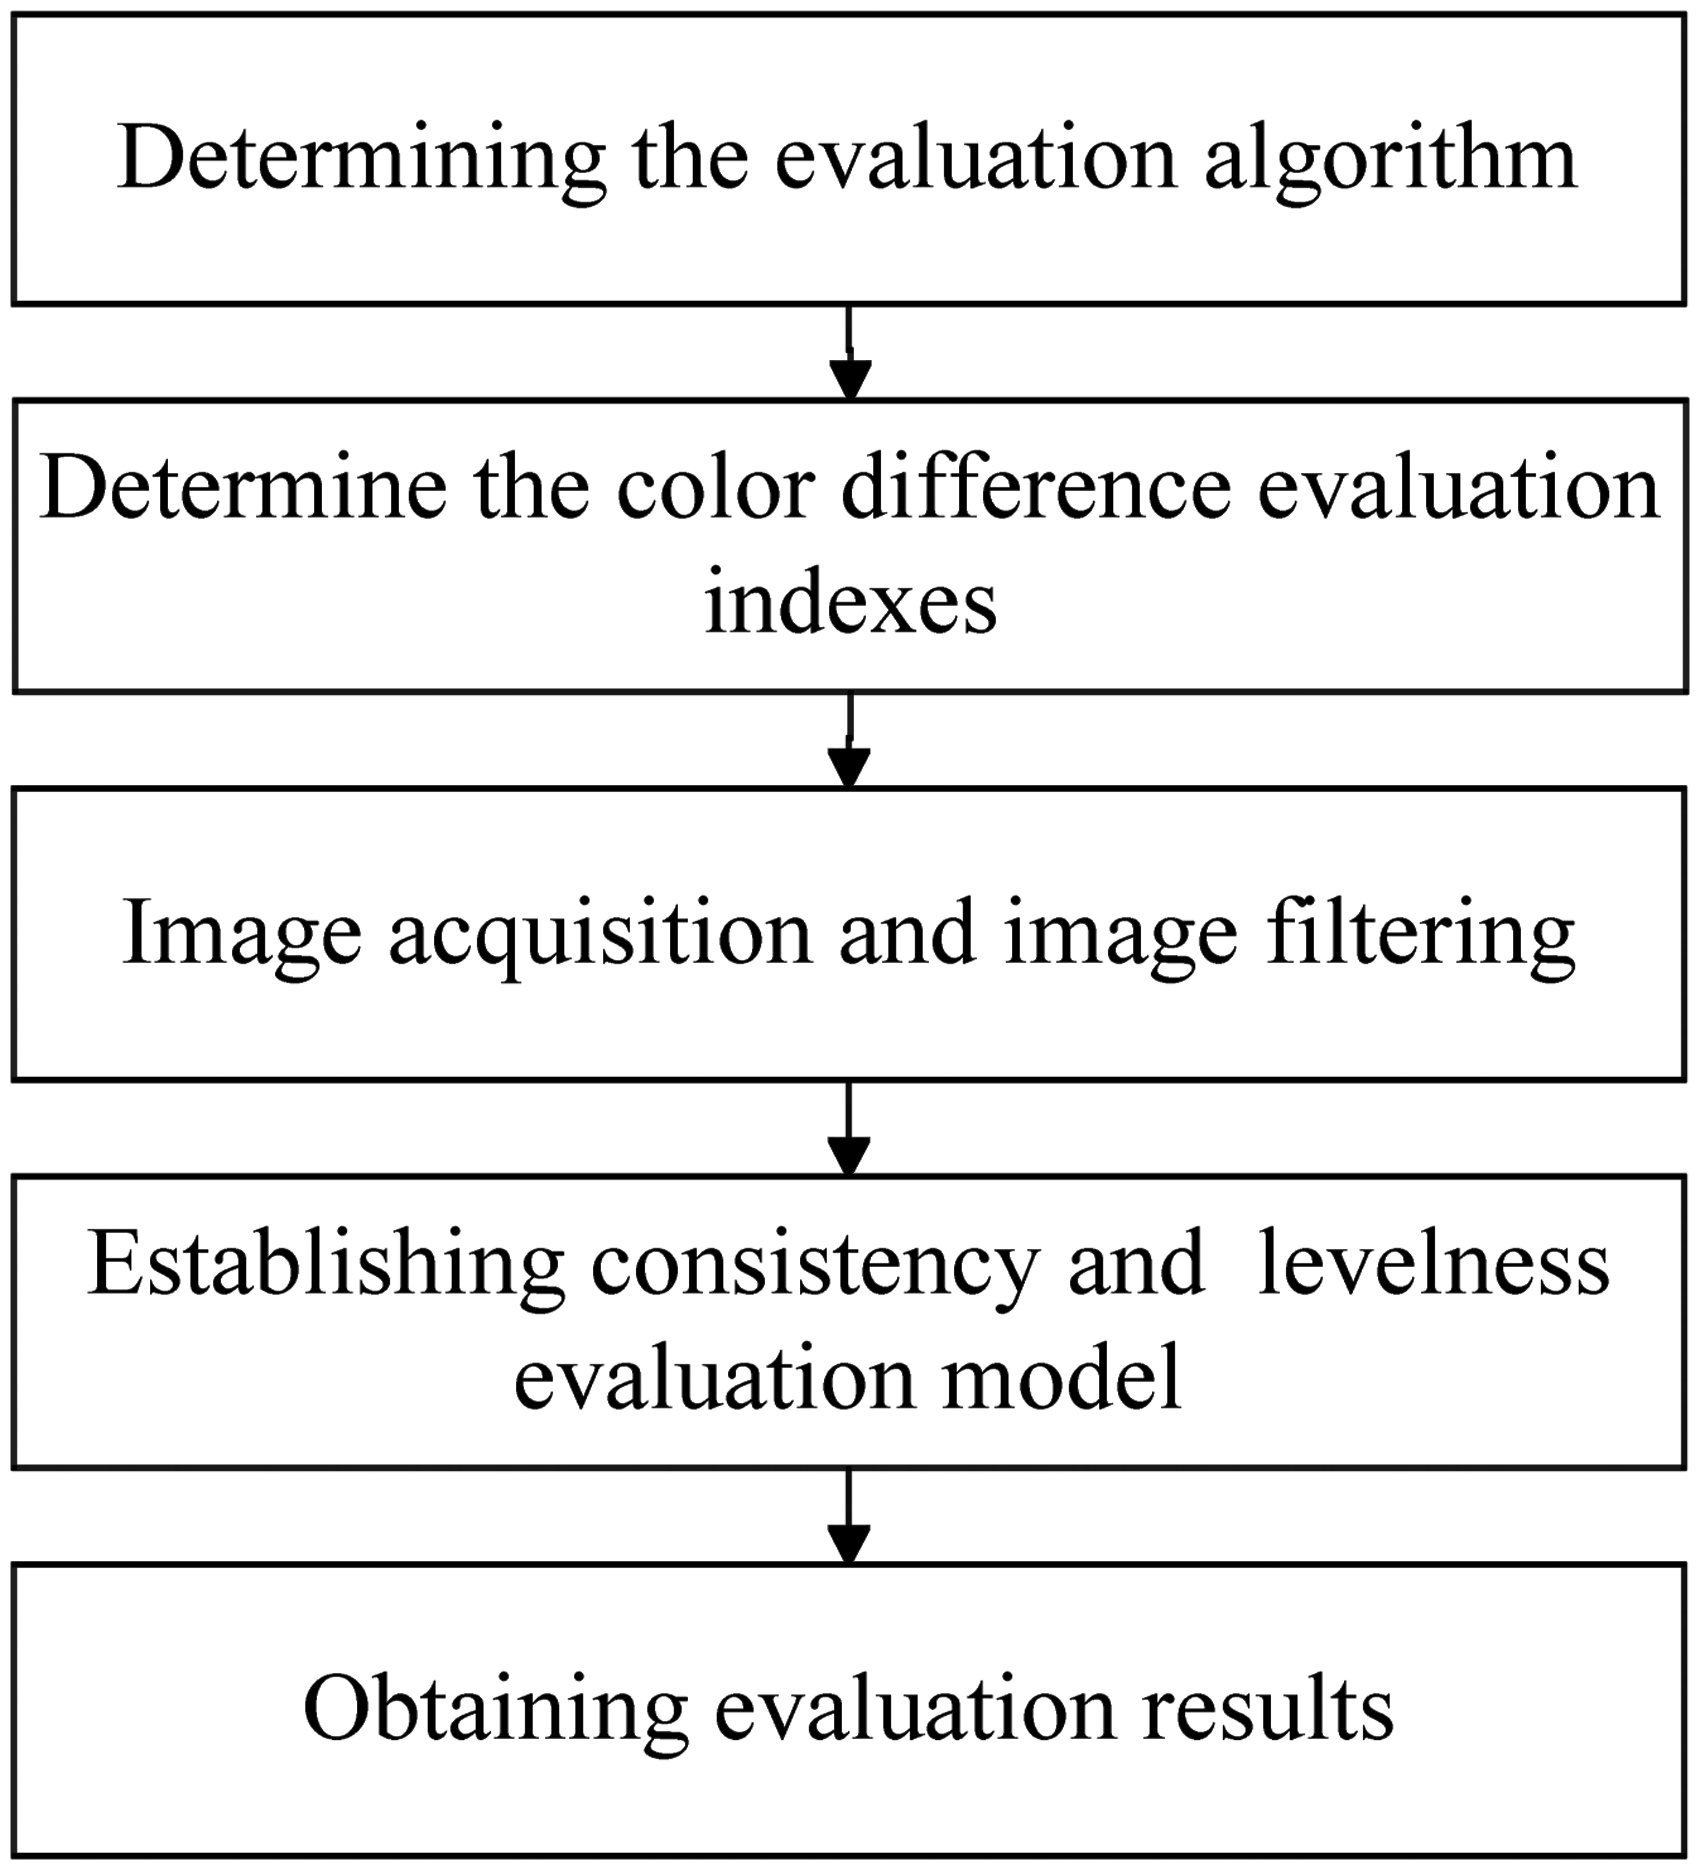
Color space and color difference formula
It is important for a color difference evaluation model to select the appropriate color space. In a machine vision system of the color difference inspection, the color values of the acquired original images are expressed by red, green, blue (RGB) values. However, the RGB color space cannot reflect the color cognitive attributes intuitively, and moreover it is one of the most uneven color spaces. Therefore, this paper selected the color difference features from both hue saturation value (HSV) and CIE 1976 (L*, a*, b*) color spaces for developing the evaluation model, which can better make use of humans' color feelings and also take the independency of the device into consideration compared with the single color space.
HSV color space
The HSV color space defines color information in a way more familiar to human beings. It is made up of three components: H, S and V, where the H component represents hue, S saturation and V brightness. The V component is independent of the color information, but H and S are closely related to the manner of color feeling by human beings. The transformation equation from RGB space to HSV space is shown:

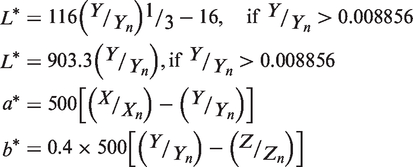
CIELAB color space
CIELAB space is a uniform color space
9
based on human vision and independent of device. The CIELAB color space (also called CIE 1976 (L*, a*, b*)) contains three vertical color coordinate axes, where column coordinate L* represents lightness (0–100), a* is the red–green coordinate and b* is the yellow–blue coordinate. These three values are obtained by nonlinear transformation from the XYZ tristimulus space (obtained through linear transformation of RGB space) as shown:
10
Color difference formula
There are many color difference formulas, among which the preferred color difference formula in textile industries is

Color difference evaluation indexes and levels
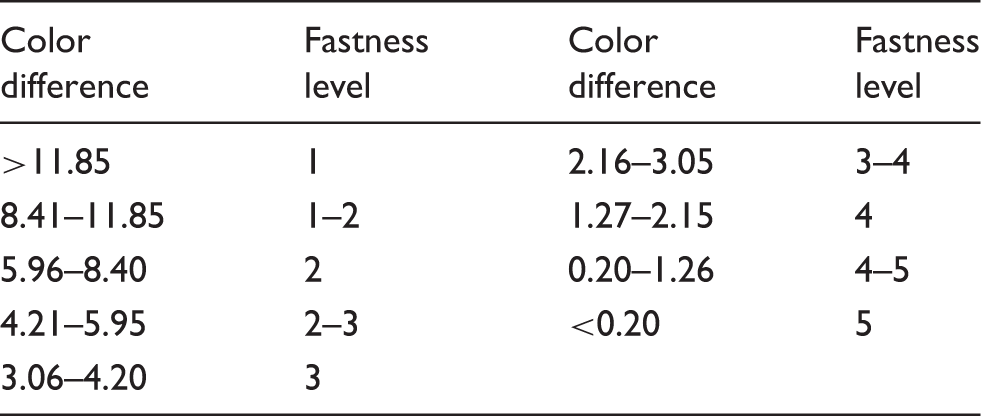
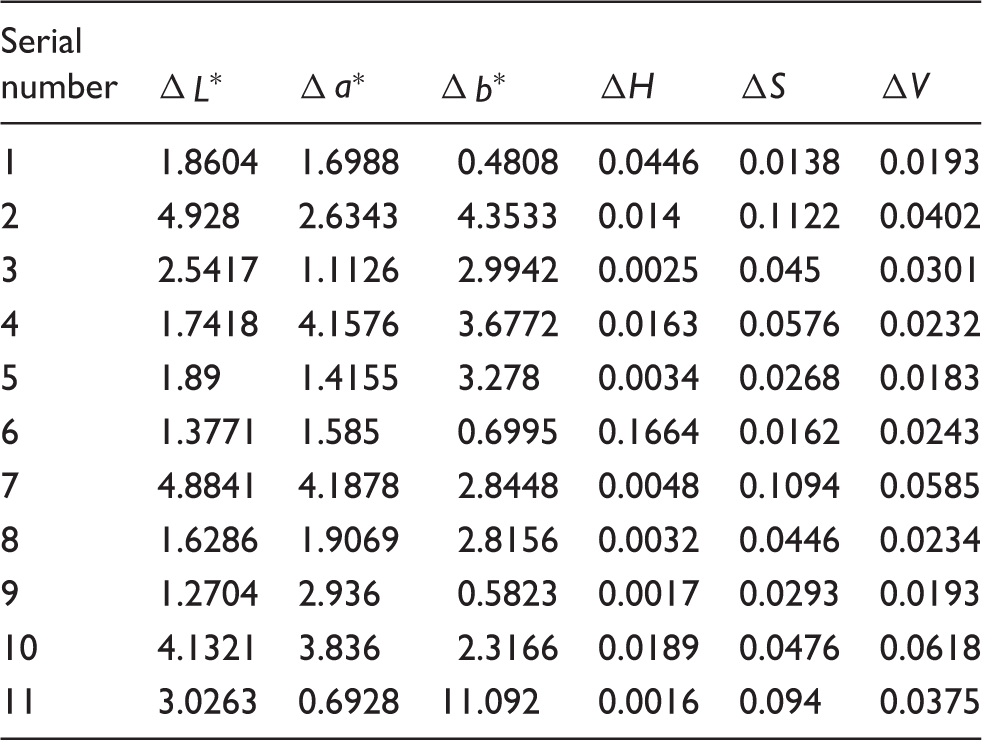
The evaluation index is used to describe certain features in different aspects that the evaluated object owns. Different from the traditional color difference measurement instruments, this paper used six color-related attributes in two color spaces: lightness difference
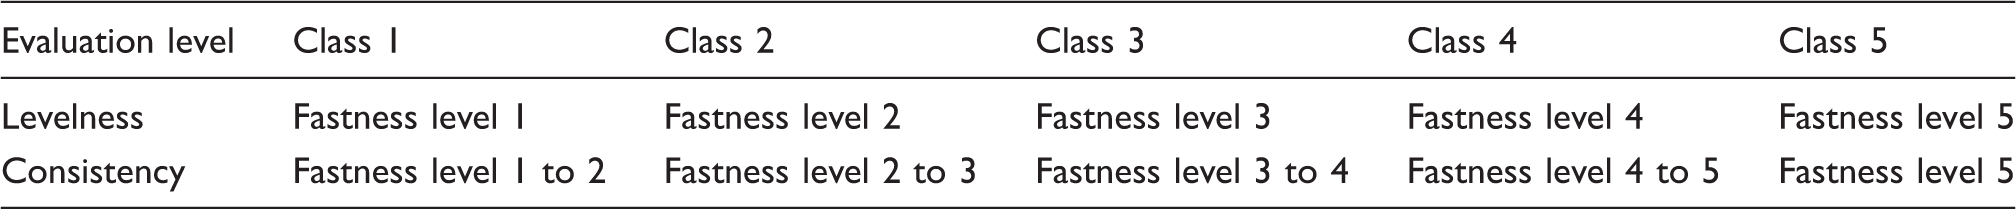
Relationship between color difference and fastness level 10
Evaluation levels
Evaluation algorithm
For consistency evaluation, the size of the inspection region was 10 cm × 10 cm, where the evaluation region is chosen as 2.5 cm × 2.5 cm ( adopting the mean filter template adopting the mean filter template calculating making for the next 10 cm × 10 cm region, the above steps are repeated. Inspection region.
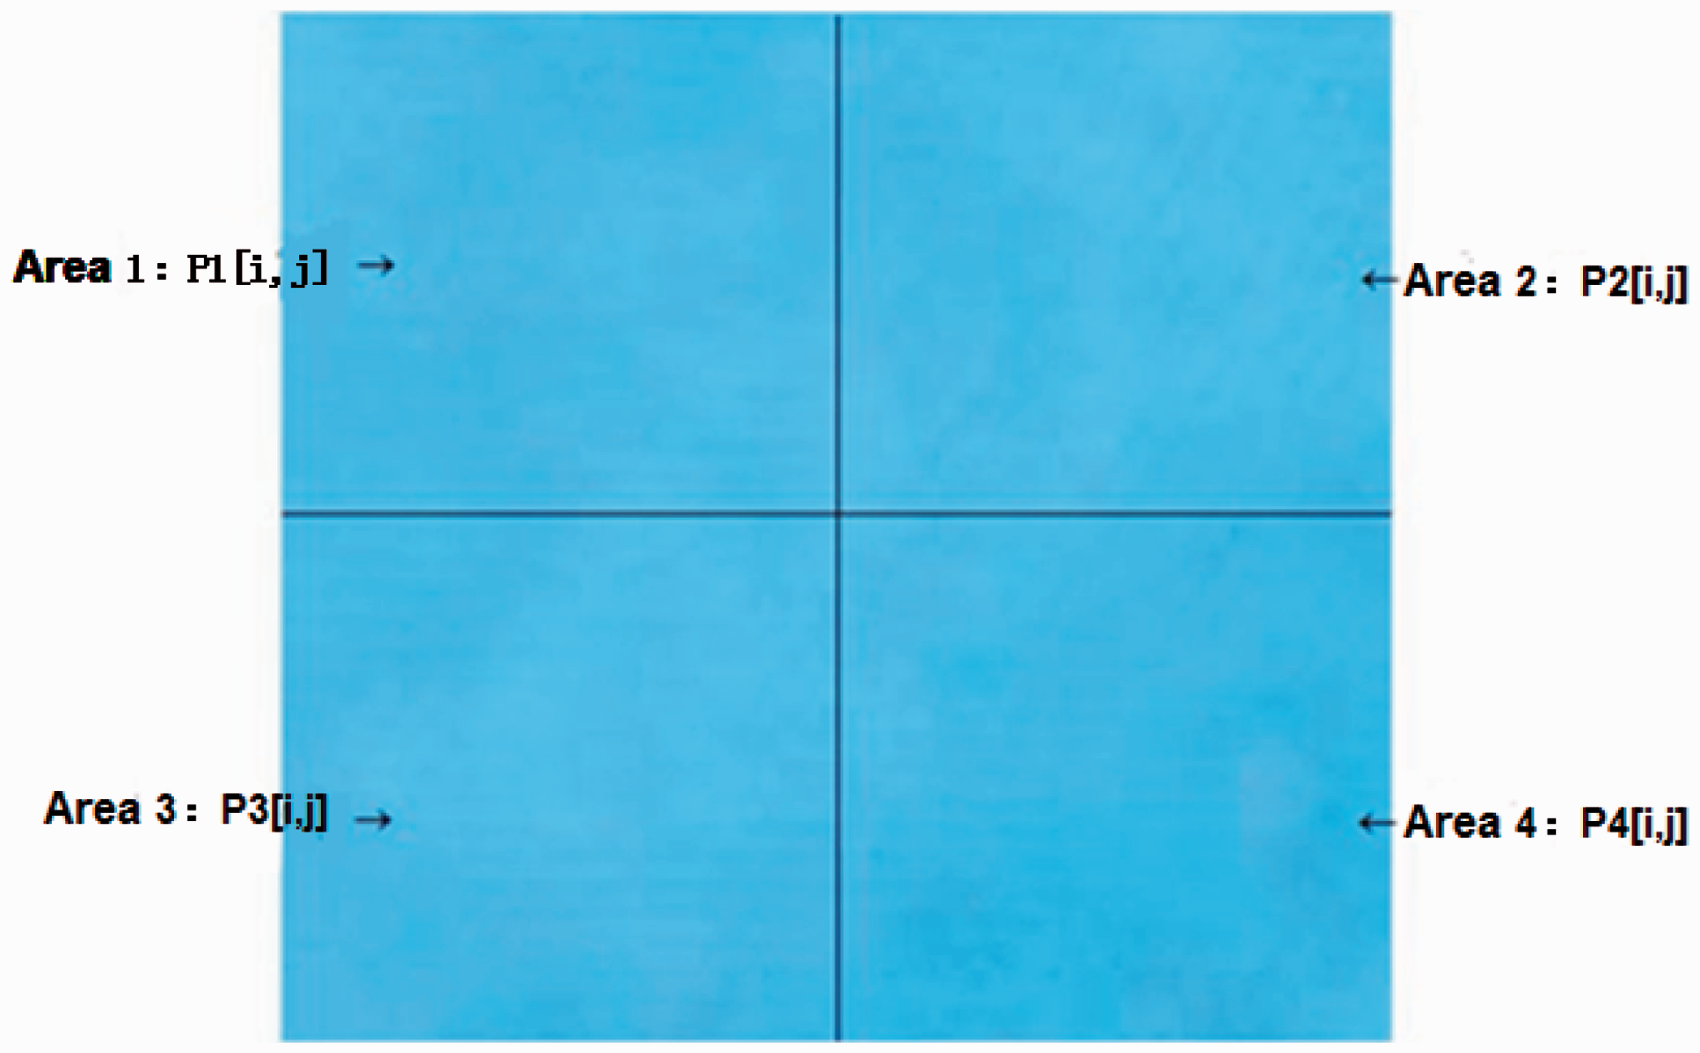
For levelness evaluation, the selected inspection region is the same as the consistency evaluation. In this region, the color mean values of the four regions (2.5 cm × 2.5 cm) are compared with that of the whole region (10 cm × 10 cm), and then the levelness levels are determined using the evaluation model based on the SVM. If the number of evaluation regions with levelness level less than or equal to 3 is more than three, the inspection region of 10 cm × 10 cm is treated as unlevel. The levelness evaluation process is similar to the consistency evaluation.
Related algorithms for the evaluation model
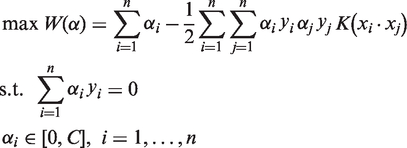
SVM algorithm
The SVM algorithm is a machine learning approach for classification and regression problems. So far, research progress shows that the SVM demonstrates superior performance gains and robustness in many applications over traditional methods. 12 The SVM has a learning ability that is independent of the dimensionality of the feature space, because the SVM measures the complexity of hypotheses based on the margin with which it separates the data, not the number of features. So it is an ideal candidate for addressing the classification problem on high precision and high dimensionality with a small sample. In the color difference evaluation system based on machine vision, the mapping relationship between the evaluation indexes and the evaluation results is complex because many factors, such as selections of color space, illumination condition and background noise, etc., can influence the evaluation process. In this paper, we used the standard SVM and the Least Squares SVM (LS-SVM) algorithms to develop the nonlinear evaluation model. In terms of the learning ability of the SVM, the influences exerted by environmental conditions can be reduced, making the evaluation results more objective.
Standard SVM
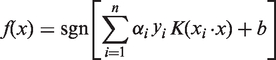
The SVM is based on the Structural Risk Minimization principle from computational learning theory. The idea is to find a hyper-plane that separates the positive examples from negative ones in the training set while maximizing the distance of them from the hyper-plane. For classification problems, the SVM calculates the classification surface of a region according to the attributes of samples in it, so that the categories of the samples could be determined through that surface.
Suppose that the sample x is an m-dimension vector and there are n samples in a certain region, given by a set of n data pairs:

If a hyper-plane that can separate the training samples without error, it will satisfy


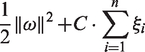
A minimum objective function is defined as
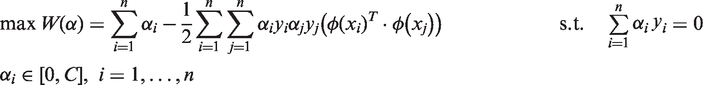
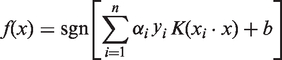
For the nonlinear case, it can be transformed into the linear case with a kernel function K(·,·) in a higher dimensional feature space, where the kernel K(·,·) must satisfy the condition stated in Mercer's theorem so as to correspond to some type of inner product in the transformed (higher) dimensional feature space Φ(X). So the new maximum objective function is
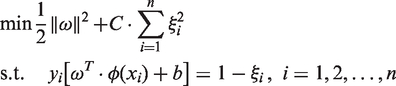
Least Squares SVM
The LS-SVM is a reformulation of the standard SVM that uses equality constraints (instead of the inequality constraints implemented in the standard SVM) and a quadratic error term to obtain a linear set of equations in a dual space. In this way the LS-SVM allows one to reduce the learning cost and speed up the operation compared to the SVM.
The LS-SVM expresses the classification problem as the optimization problem constrained by equality according to the structural risk minimization principle. The objective function to solve the optimization problem of the LS-SVM is
The optimization problem in (11) can be solved using the Lagrange method:
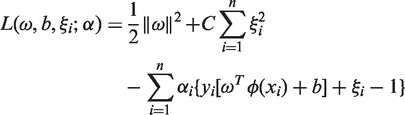
According to the optimizing condition 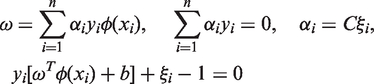
After eliminating 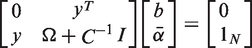

There is no doubt that the efficient performance of the LS-SVM model depends on an optimal selection of the kernel function 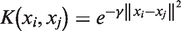
The optimal selection of the parameters of penalty factor C and γ in kernel function is implemented by using the Genetic Algorithm (GA).
Principal Components Analysis
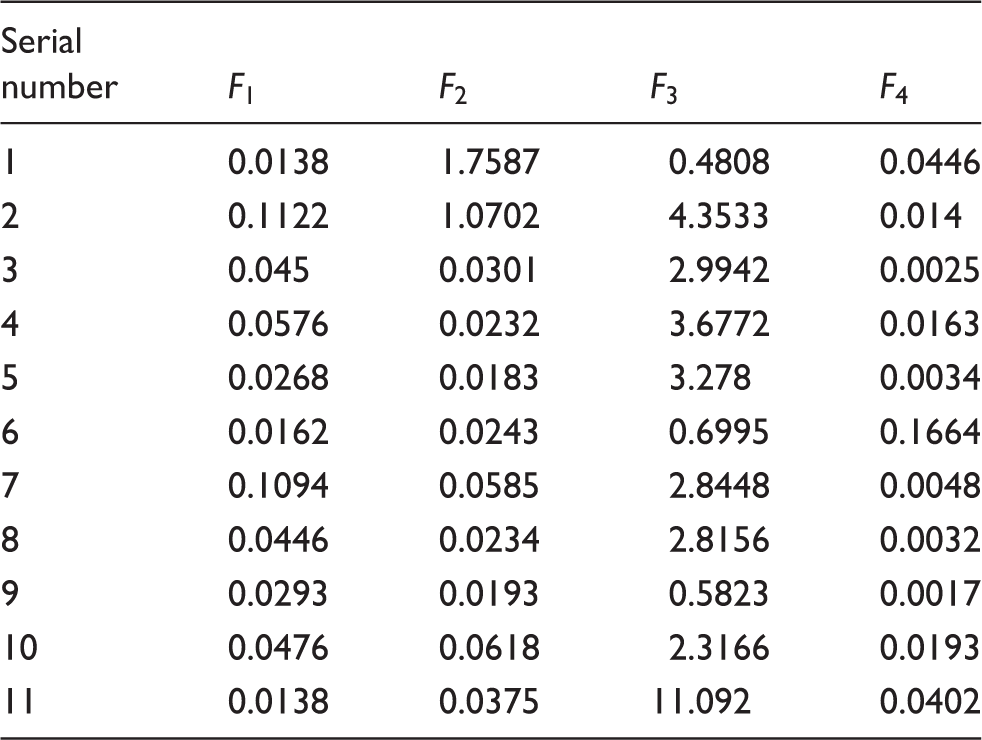
In this paper, we used the PCA method to refine the evaluation indexes. PCA is a mathematical procedure 13 that converts a group of observations of possibly correlated variables into a set of values of linearly uncorrelated variables called principal components by using the orthogonal transformation.
The number of original variables is more than or equal to the number of principal components. The first principal accounts for as much of the variability in the data as possible (that is, it has the largest possible variance); in addition, each succeeding component in turn has the highest variance possible under the constraint that it be orthogonal to (i.e., uncorrelated with) the preceding components. If the data set is jointly normally distributed, principal components are guaranteed to be independent.
Genetic Algorithm
In this paper, we used the GA to search the optimal parameters of the SVM, which is a search heuristic that mimics the process of natural selection in the field of artificial intelligence. This heuristic is routinely used to generate useful solutions to optimization and search problems.
In a GA, a population of candidate solutions (called individuals) to an optimization problem is evolved toward better solutions. Each candidate solution has a set of properties (its chromosomes or genotype) that can be mutated and altered. The evolution usually starts from a population of randomly generated individuals, and is an iterative process, with the population in each iteration called a generation. In each generation, the fitness of every individual in the population is evaluated. The more fit individuals are stochastically selected from the current population, and each individual's genome is modified to form a new generation. The new generation of candidate solutions is then used in the next iteration of the algorithm.
Experimental details
In the experiments, the inspected materials were woven plain polyester fabrics, which were dyed with Disperse Red FB, Disperse Yellow M-4GL and Disperse Blue 2BLN. The dyed fabrics were then clipped to a size of 10 cm × 10 cm for evaluation modeling.
Original evaluation indexes of 11 dyed fabric samples
Four new evaluation indexes through Principal Component Analysis
The next step was to develop the color difference evaluation model using the new four independent evaluation indexes. Here, nine images of dyed fabrics were acquired under three kinds of light sources D65, A and D50 using a charge-couple device (CCD) camera, and thus in total 27 images were obtained. The images under D50 are shown in the appendices.
Results and discussion
Results of evaluation model based on the standard SVM
The parameters of penalty factors C and γ in the kernel function of the standard SVM model are optimally determined with the GA method. The population size, the maximum iterating times, the crossover and the mutation probability for the GA are 20, 100, 0.4 and 0.01 respectively. After optimization of parameters, a 10-fold cross-validation is executed 10 times, that is, the color difference set of dyed fabrics is divided into 10 sub-parts, with nine parts training data and one part testing data in turn. The average of 10 validations is used as the accuracy estimation of SVM parameters.
Modeling of color consistency
In order to construct more experimental data for training the evaluation model, an image was chosen randomly from 27 images as a standard sample and others were compared with it for calculating the evaluation indexes according to the color consistency algorithm described in the Evaluation algorithm section, and then in total
Training results with six evaluation indexes

Training results with evaluation indexes screened by Principal Component Analysis
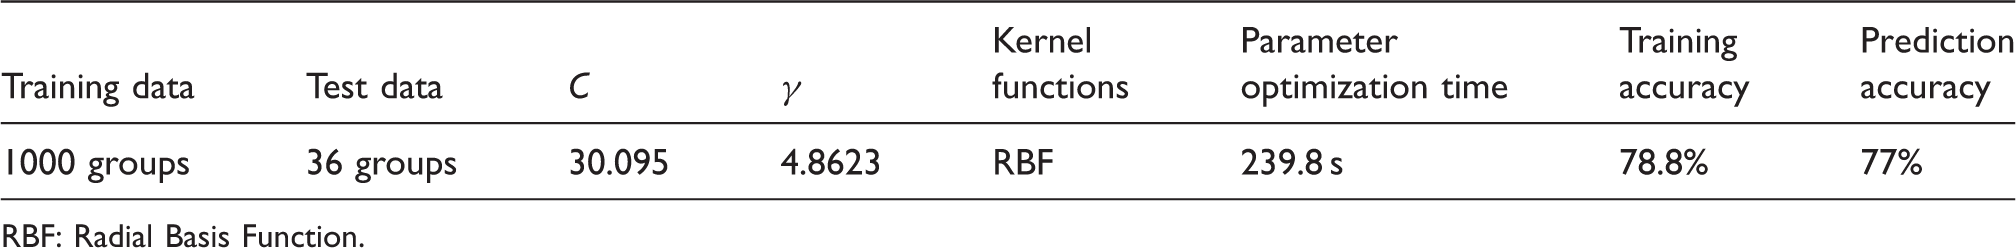
RBF: Radial Basis Function.
Modeling of color levelness
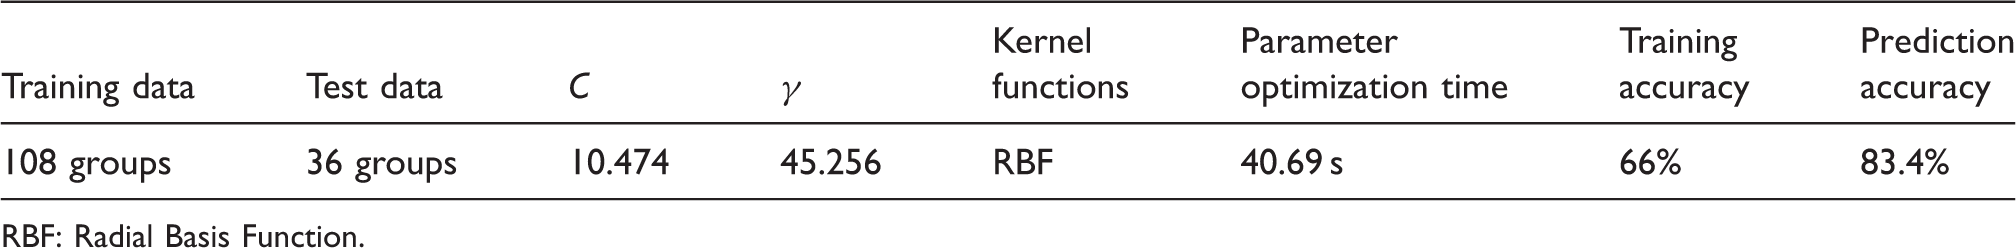
The same 27 images as in the Modeling of color consistency section were acquired under three kinds of light sources – D65, A, D50 – a total of 108 sets of data were used as the training data for modeling of color levelness. Thirty-six sets of data under light sources A and D50 were selected for testing. The modeling algorithm was described in Evaluation algorithm section and the modeling process is similar to that in the Modeling of color consistency section. Appendices III and IV respectively show 28 sets (evenly selected from a total of 1000 sets) of training data and 36 sets of testing data.
Model training results of six indexes
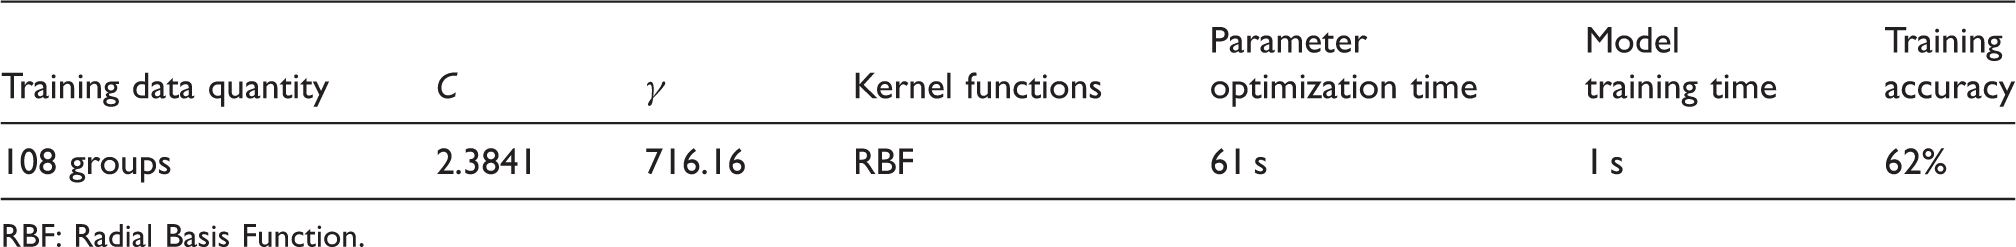
RBF: Radial Basis Function.
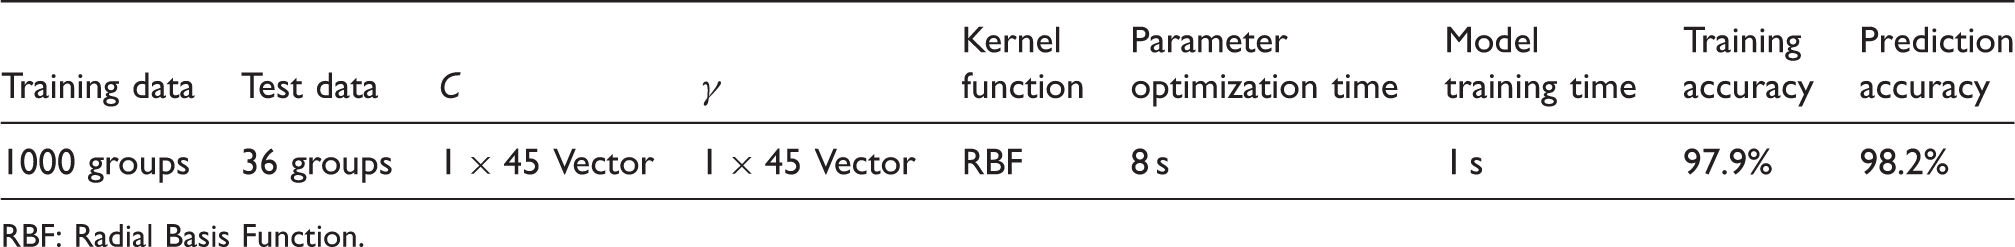
Model training and testing results of four indexes screened by Principal Component Analysis
RBF: Radial Basis Function.
Validation of the evaluation model developed by the standard SVM
Comparison between the SVM and Naive Bayesian algorithm
Comparison between two methods
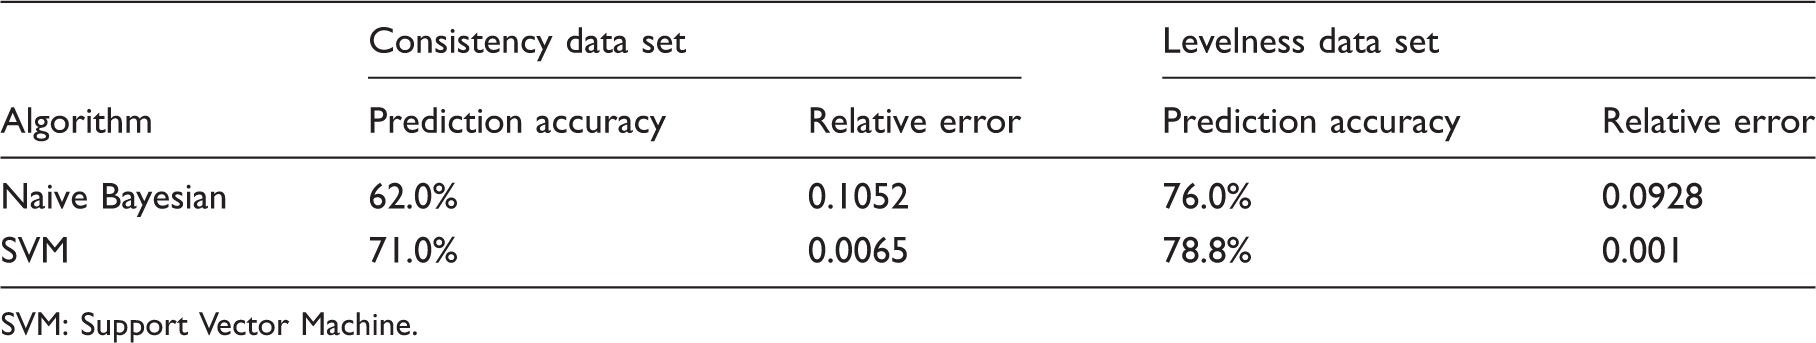
SVM: Support Vector Machine.
Prediction effect of evaluation model of the Least Squares Support Vector Machine
RBF: Radial Basis Function.
Comparison between the SVM and LS-SVM
It can be seen from the former experiments that the performance of the SVM is not so good. In this section, the LS-SVM was used again to model the same data sets in Appendices I and II with the same parameter optimization algorithm as the standard SVM, where the initial penalty factor was set to be 10 and the kernel function parameter γ to be 2. The results are shown in Table10, where the accuracy of the LS-SVM is improved significantly.
Conclusions
The purpose of this paper is to propose the evaluation algorithm of color difference in the machine vision system for evaluating the dyed fabrics and developing the evaluation model based on the SVM. While comprehensively considering the characteristics of humans' color perception and the need for color consistency and levelness, six evaluation indexes were chosen from the HSV and CIELAB color space. In order to improve the speed of parameter optimization and model training, the PCA was employed to extract four independent evaluation indexes, which can compress the redundant and secondary information in the six evaluation indexes. The evaluation algorithms of color consistency and color levelness were proposed and the color difference levels were defined based on ISO 105-A02:1993. For evaluating the color difference accurately and automatically, the standard SVM and the LS-SVM algorithms were used to develop the model between the evaluation indexes and the color difference levels. Compared to the NB algorithm, the SVM model has better stability and can maintain higher prediction accuracy without considering the prior probability of the samples. Moreover, its performance can be highly improved by using the Least Squares algorithm. In conclusion, the SVM model has many prominent characteristics so that it can adapt to such conditions as different light sources or background noise in the machine vision inspection system, and maintain better accuracy. In future research, the evaluation index and the division of the evaluation region for the color difference of the dyeing product sample can be optimized further.
Footnotes
Funding
This material is partially based upon work funded by National Natural Science Foundation of China under Grant No.61074154, and by the Program for Changjiang Scholars and Innovative Research Team in University (PCSIRT) under grant No.IRT13097.