
Abstract
This study was conducted to investigate the effect of multilayer protective clothing on heat and moisture transport under various ambient conditions. By using the Human-Clothing-Environment simulator, a four-layered clothing system was exposed to a high rate of sweat pulse for a duration of 3 hours in seven different ambient conditions: extremely hot and humid (EH, 40℃, 90% relative humidity (RH)), extremely hot and dry (ED, 40℃, 30% RH), hot and humid (HH, 34℃, 75% RH), hot and dry (HD, 34℃, 30% RH), warm and dry (WD, 27℃, 30% RH), slightly cold (SC, –3℃, 20% RH) and cold (CO, –10℃, 20% RH). The temperature and RH in the microclimate were measured and the distribution of within layers was analyzed. Several dynamic stage changes of the microclimate were observed throughout the test. Variations in ambient condition have an effect on the microclimate and the distribution of moisture accumulated within layers. Heat and moisture transport through the clothing system would be influenced by the condensation within layers. In cold conditions, 80% of the moisture accumulated in the clothing system was located in the thermal liner and moisture barrier, whereas in other conditions, most of it was accumulated in the thermal liner.
Keywords
Clothing for firefighters requires very high thermal insulation against the extremely adverse environments to which the wearer might be exposed. This type of protective clothing ensemble is very thick and multilayered, consisting of a flame resistant outer shell, water resistant moisture barrier, thermal liner and inner layer. The thermal stress related to performance of the protective clothing is highly affected by its heat and moisture transfer properties. The flow of heat and moisture from the external environment to the human body can be certainly reduced by this multilayer system; however, the flow away from the human body to the environment is impeded as well, which can give heat stress to the wearer1–3 and impair their ability to carry out the work. Moreover, with the highly insulating thermal liner and the waterproof moisture barrier, sweat cannot easily evaporate from the skin surface and may accumulate in clothing layers over prolonged periods of use.4,5 This sweat, which increases both the thermal conductivity and heat capacity of the fabric, is good for the heat release from the body to the environment to some extent, but it strongly affects heat protection and comfort properties of these garments.6–8
Generally, it has been perceived that firefighters are mainly responsible for fighting fires; however, in reality, only a small percentage of time is devoted to this task9,10 and more and more towards special services (non-fire incidents). 11 Non-fire activities include road traffic incidents, rescue operations, urban search, overhaul and salvage.10,11 During all of these tasks, firefighters are expected to face a wide range of thermal hazards, including both exposure to high temperatures and subzero temperatures. 11 However, to our knowledge, prior studies have not investigated the effects of these subzero temperatures for firefighters’ clothing.
Several researchers have investigated the influencing factors on the heat and moisture transport of protective clothing by either objective or subjective evaluation methods. Traditionally, most of these studies have been conducted in specified environmental conditions. Keiser et al. 4 analyzed the distribution of moisture in firefighter protective clothing with a sweating torso and a sweating cylinder. Both the sweating torso and sweating cylinder were performed at standard climatic conditions 20 ± 2℃ and 65 ± 5% relative humidity (RH). Li et al. 12 examined the effect of a material component and design feature on thermal insulation and the moisture permeability index of the firefighter turnout clothing system by using a sweating manikin in what would be a mild working condition for a firefighter (25℃, 65% RH). Wang et al. 13 carried out two separated wear trials under the temperature of 28℃ (warm) and 15℃ (cool) to evaluate the comfort property of six different combinations of firefighter protective clothing. The range of microclimates within six clothing ensembles were shown at 28.61–29.69℃ with RH of 77.6–82.0% when exposed to 28℃, and it maintained at 20.9–22.1℃ with 63.4–71.3% RH within the microclimate at 15℃. Cui et al. 14 investigated the moisture transmission through firefighter clothing in a controlled environment of 38 ± 1℃ and 95 ± 2% RH, which was set to simulate the hot and humid climate that would be encountered by firefighters. Considering that firefighters are often exposed to a flash fire, several models have been developed for heat and moisture transport in firefighter protective clothing during flash fire exposure. 15 There is, however, a lack of laboratory study concerning the range of environments normally faced by firefighters, and the performance of firefighters’ clothing under different ambient conditions is still not fully understood. The studies were carried out with different purposes, various testing textiles and different testing methods. It is difficult to compare the results in terms of moisture and temperature distribution in a multilayer protective ensemble, condensation, re-evaporation and the moisture accumulation within the layers under various ambient conditions including subzero temperature and low RH.
One of the primary purposes of the protective clothing is to maintain the body core temperature under different environmental conditions and to prevent the accumulation of sweat within clothing layers; this is achieved by allowing the perspiration to evaporate in the skin to the outside atmosphere when activity levels rise. The assessment of the heat and moisture transport performance of protective clothing can be achieved using manifold testing technologies. Apparatus such as the thermal manikin and the hot plate primarily referring to heat and vapor resistance are widely used instrumental means at present.16,17 However, the performance of the protective clothing under various conditions, particularly at the transient state and during the dynamic process, has not been sufficiently investigated. A survey of wear trials provides a comprehensive evaluation for the performance of protective clothing, but extreme conditions could not be achieved due to the safety of the human subjects. 18
By using a Human-Clothing-Environment (HCE) simulator,18–20 this laboratory study aimed to assess the dynamic heat and moisture transfer related to microclimate temperature and humidity changes and to analyze the distribution of moisture accumulation when the multilayer fabric system was exposed to different kinds of ambient conditions, including not only high temperatures but also subzero temperatures. This knowledge will contribute to getting a better understanding of the heat and moisture transfer under different ambient conditions and help one to choose more effective materials in order to minimize the influence of ambient conditions.
Methods
Apparatus
The heat and moisture transfer performance of the protective fabrics system under various ambient conditions were investigated using a HCE simulator (US patent 7,680,638 B2) (Figure 1).18–20 The accuracy of the apparatus and reproducibility of the test results have been reported in the previous study.
18
This instrument consists of two adjoining climate chambers, a vertical guarded hot plate and a data-logging system. Two chambers are independently controlled between 10℃ and 50℃ and between −30℃ and 20℃ with a RH of 10–98%. The accuracy for the controlling of temperature is ± 0.5℃ and the RH is ± 2%. Sweating is simulated by supplying water through six nozzles on the hot plate connected to a micro pump (ISM937, ISMATEC, Switzerland). A filter paper is placed on the hot plate to ensure that the sweat spread throughout its surface quickly and evenly. The sample used is a circle of 25 cm in diameter, while the testing area is 20 cm in diameter. Fabric layers are first mounted on frames before they are added next to the hot plate with a sample holder in the same manner. The sample holder is used to keep the fabric system closed tightly so that heat and moisture would only pass through the testing area and there is no loss from the edge of the sample system. The sample mounted hot plate can be rotated easily and moved from one chamber to another. Microclimate temperature and humidity within layers are measured with time by sensors (CHS-APS, TDK, Japan), meanwhile data are recorded through a computer connected to a data-logger.
Human-Clothing-Environment simulator: (1) high temperature chamber (from 10℃ to 50℃); (2) low temperature chamber (from –30℃ to 20℃); (3) hot plate and clothing system; (4) sweat supplying micro pump; (5) data-logging system.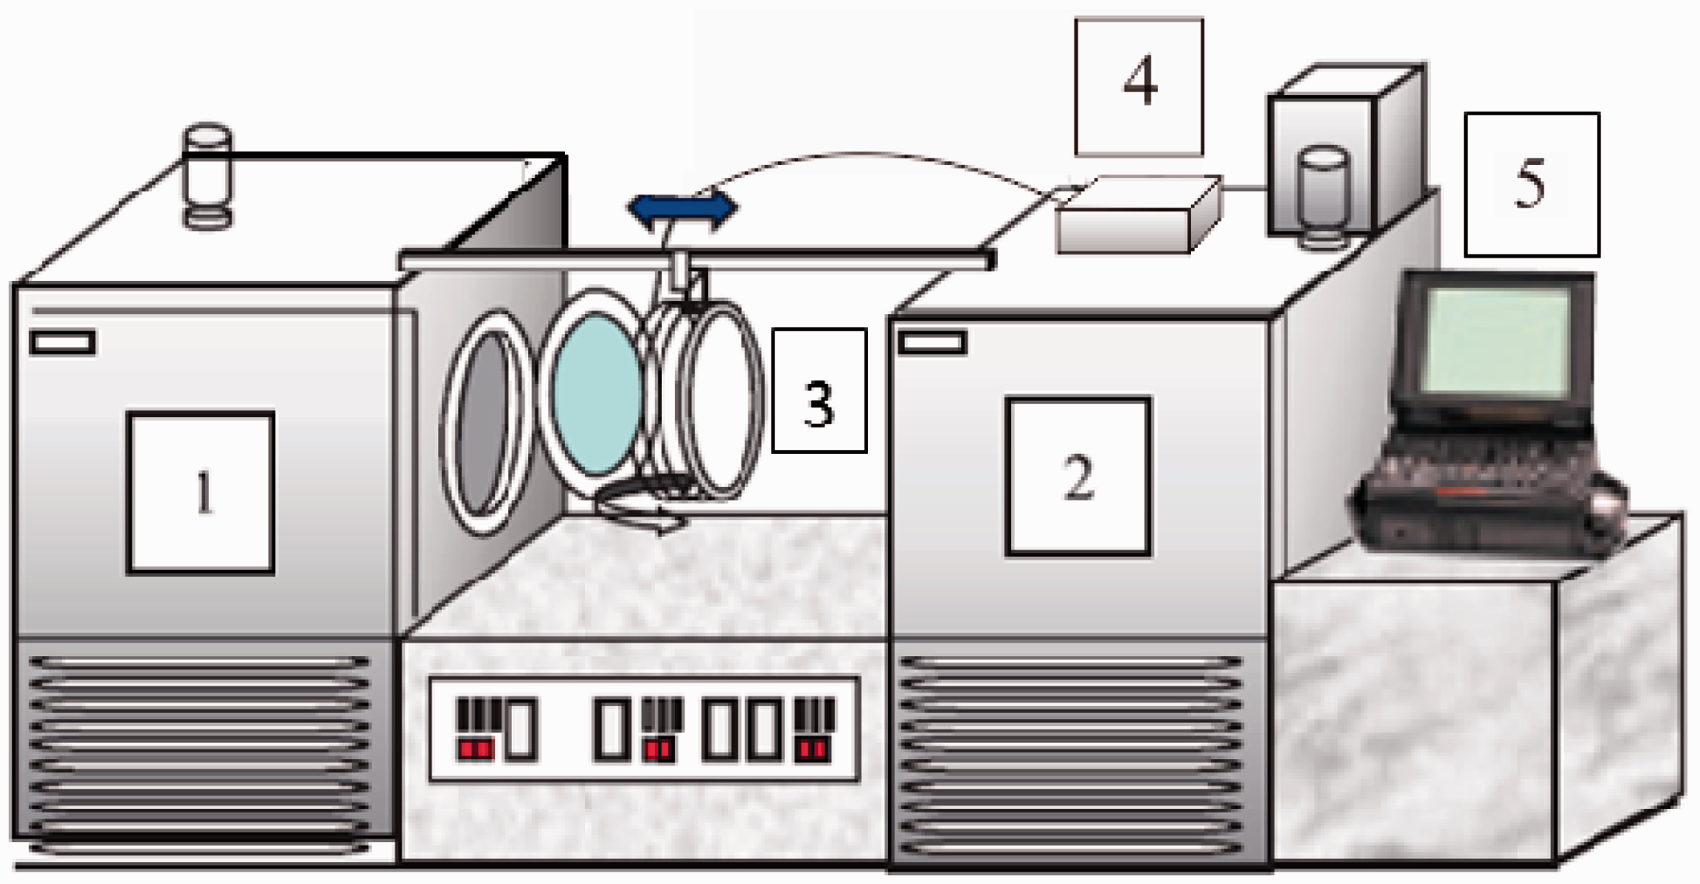
Materials
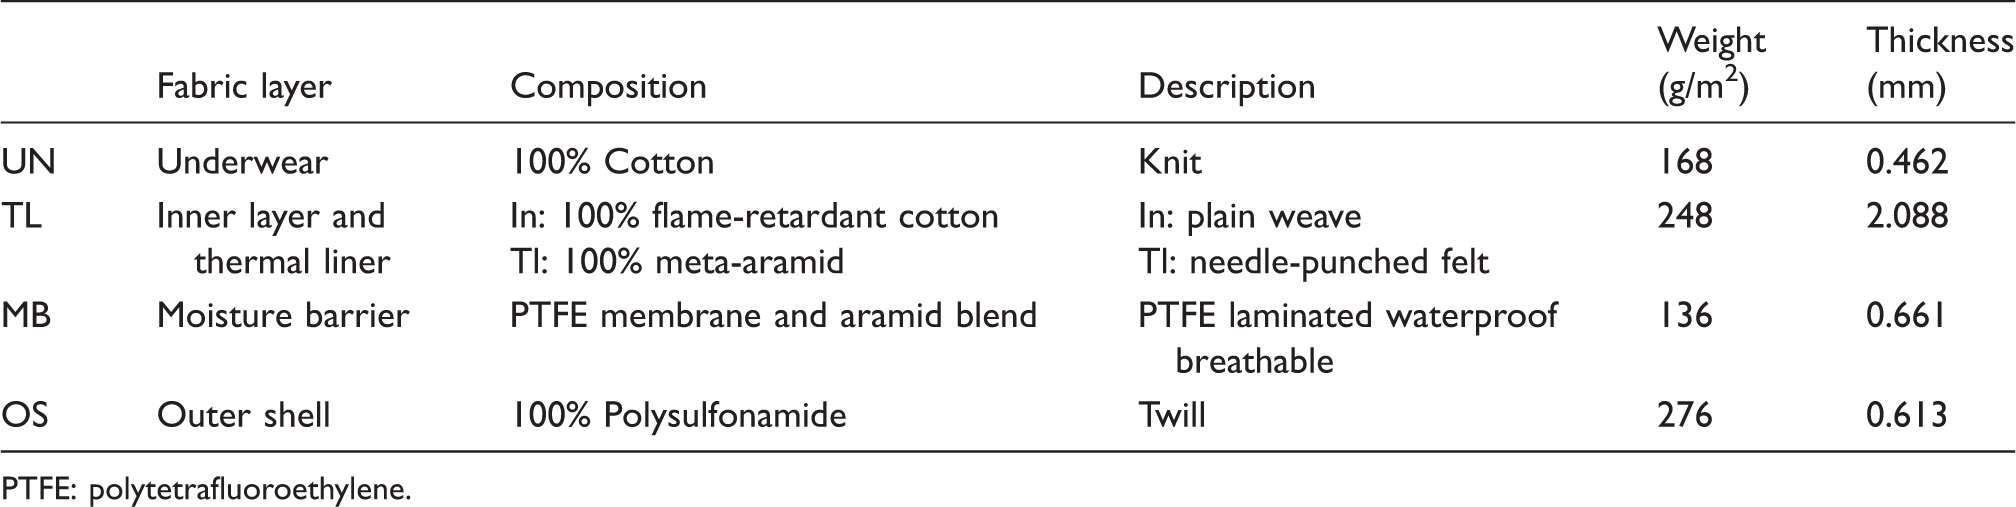
Fabric layers were composed of underwear, inner layer, thermal liner, moisture barrier and outer shell. The characteristics of the specimens are provided in Table 1. All the selected layers for firefighters’ clothing are commercially available and popularly used in the protective clothing field. Five layers of fabric were mounted on the hot plate in the proper order (Figure 2). Next to the hot plate, a filter paper was used to spread the sweat. Cotton underwear was selected as the innermost clothing layer. The inner layer and the thermal liner were put together with no extra air gap, in order to simulate the real situation. The thickness of the air layer between each fabric was 5 mm in this study (Figure 2).
Schematic diagram of the skin model and location of fabrics and sensors: (1) hot plate; (2) filter paper to spread sweat; (3) underwear; (4), (5) inner layer and thermal liner; (6) moisture barrier; (7) outer shell; (A)–(D) sensors. Characteristics of the specimens PTFE: polytetrafluoroethylene.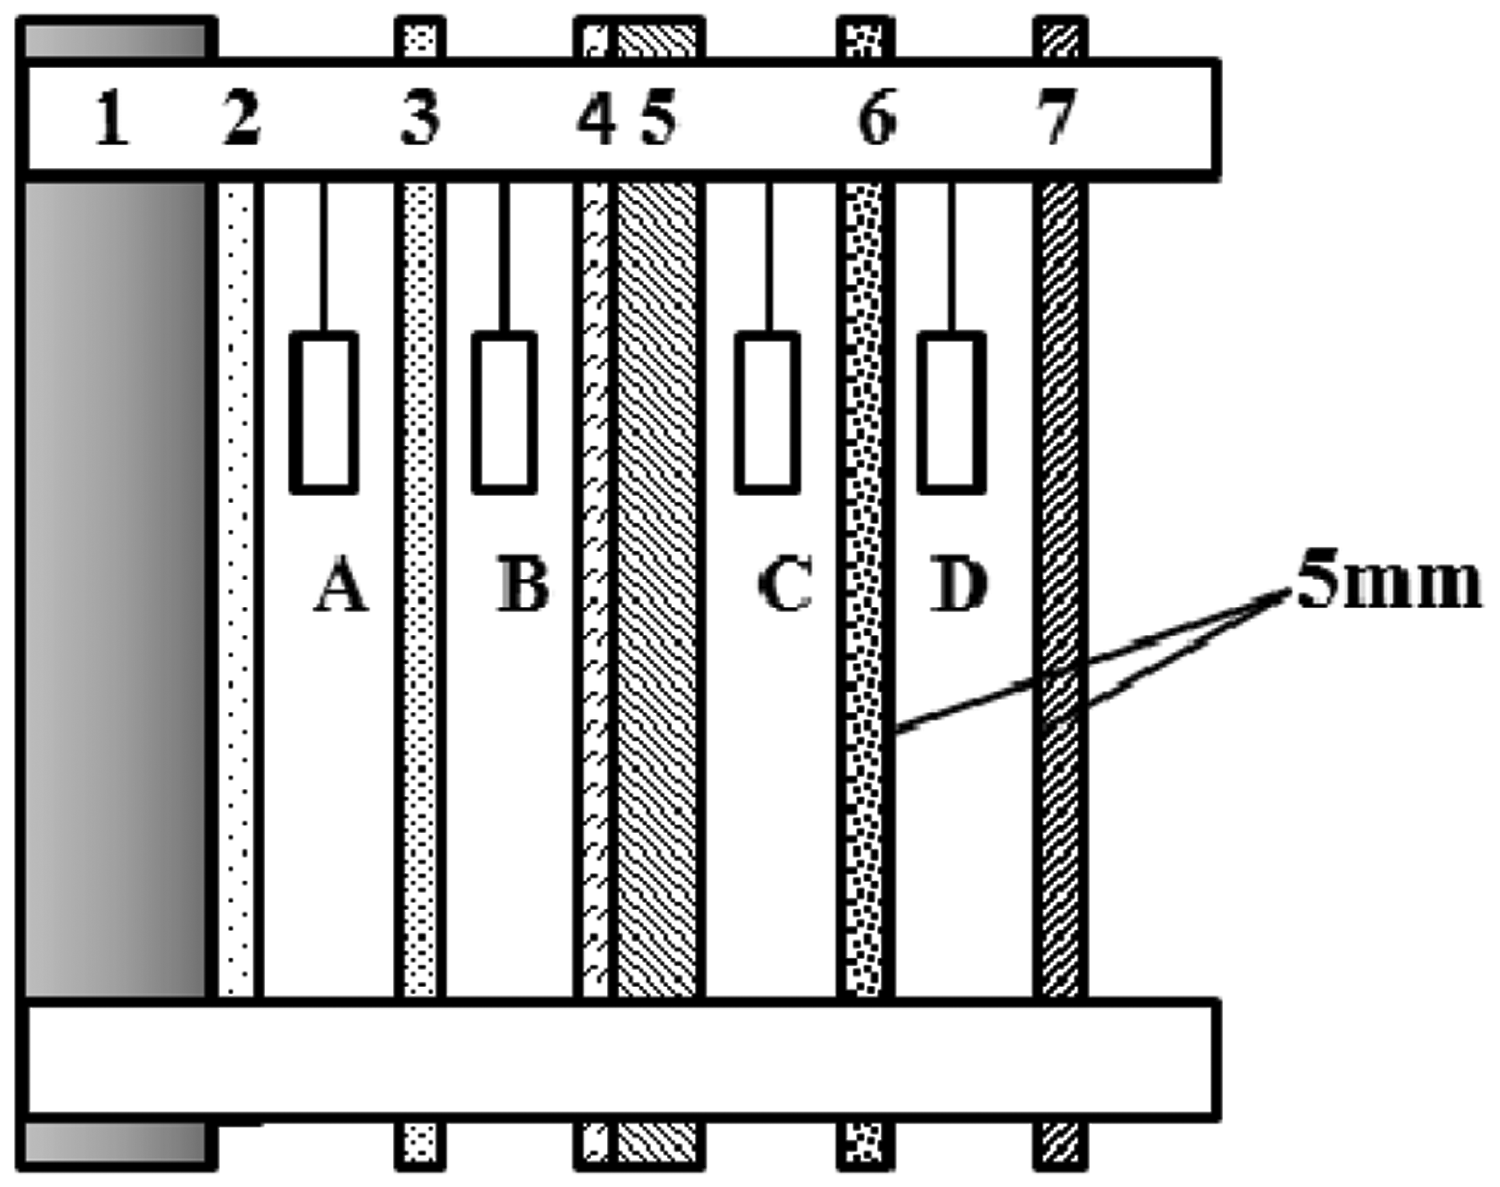
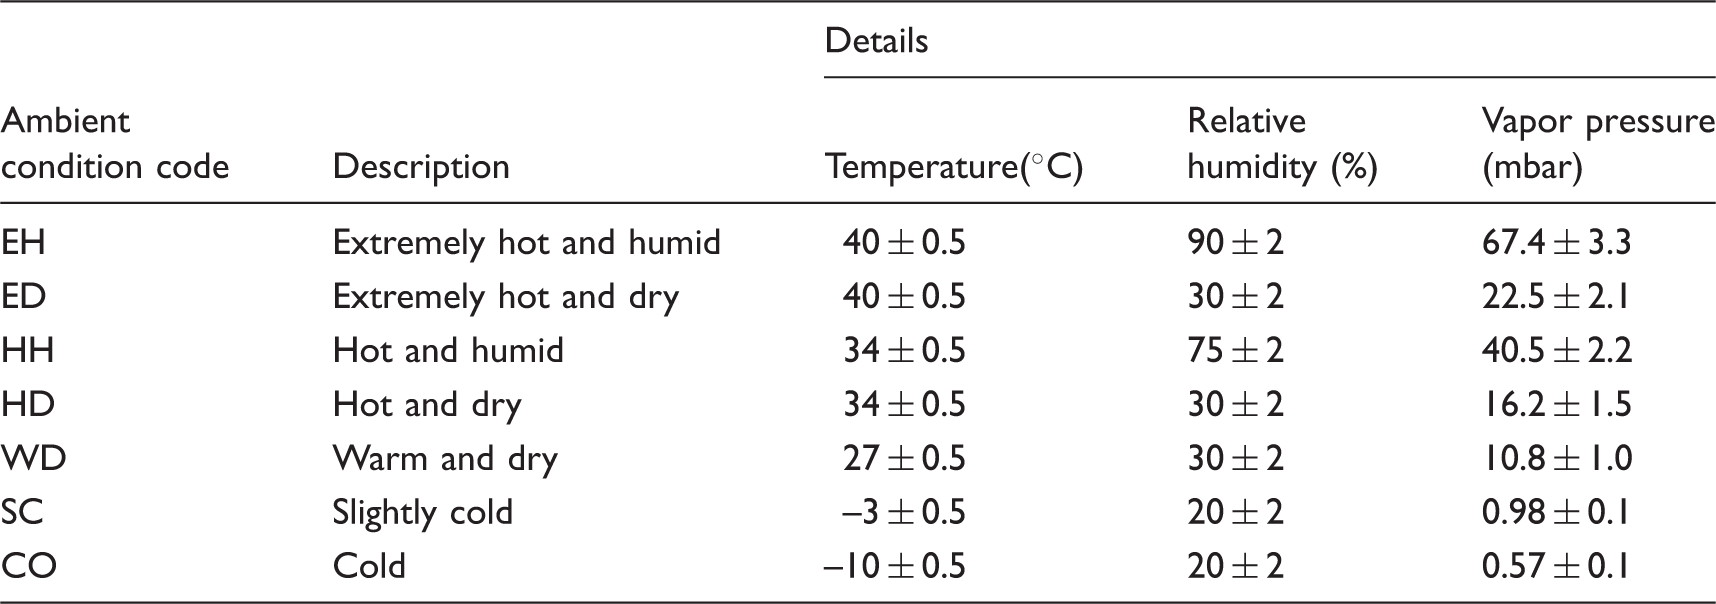
Ambient condition
Ambient conditions set
Test protocol
All samples were dried for an hour before the test. After determining the weight of each sample, the four-layer ensemble was mounted over the hot plate. A constant hot plate temperature control mode was used in this study. The hot plate was maintained at 34 ± 0.1℃ to simulate the skin temperature of the human body.16,21 The samples mounted on the hot plate were stabilized in one chamber (20℃, 10% RH) for 1 hour, and then quickly moved to another chamber with one of the test conditions. In order to simulate the high work load of firefighters, 5 ml of water (34 ± 0.5℃) was then applied over the surface of the hot plate in a span of 10 min. This sweat pulse corresponded to 955 g/m2 per hour. It was exposed there for another 3 hours after the sweat pulse. During the test, the microclimate temperature and RH were collected and recorded every minute. The weight of the filter paper and each clothing layer were measured before and after the test using an electronic scale (LTH-400, Lawson Hemphill Inc, USA). The moisture that collected in the filter paper after the test can be regarded as the water remaining on the skin. The weight difference of each layer before and after the test corresponds to the amount of moisture accumulated within layers; meanwhile the amount of moisture evaporation is equivalent to the difference between the amount of total water supplied and the sum of water accumulated within clothing layers and water remaining on the filter paper. Each set of samples was evaluated three times at the same condition and subsequently averaged.
Data analysis
In order to characterize its behavior during each step change, the microclimate temperature was summarized by the following three stages: Stage 1 (the short temperature increase) was due to the combination effect of both ambient temperature change and the heat of sorption from water vapor by cotton (used as the first layer) as applying for the sweat pulse; Stage 2 (the temperature decrease after State 1, dT/ dt < 0) occurred since moisture evaporates through the clothing system taking away the latent heat; Stage 3 (temperature increases again after Stage 2, dT / dt > 0), indicated that the fabric system had become dry. Here only Stage 1 and Stage 2 were discussed since Stage 3 was after the drying of the sweat pulse (Figure 3). ΔT1 is the temperature difference between initial and the highest state at Stage 1; ΔT2 is the temperature difference between the highest and the final state at Stage 2; t1 is the time to finish Stage 1; t2 is the time to finish Stage 2.
Determination of ΔT and t at each stage.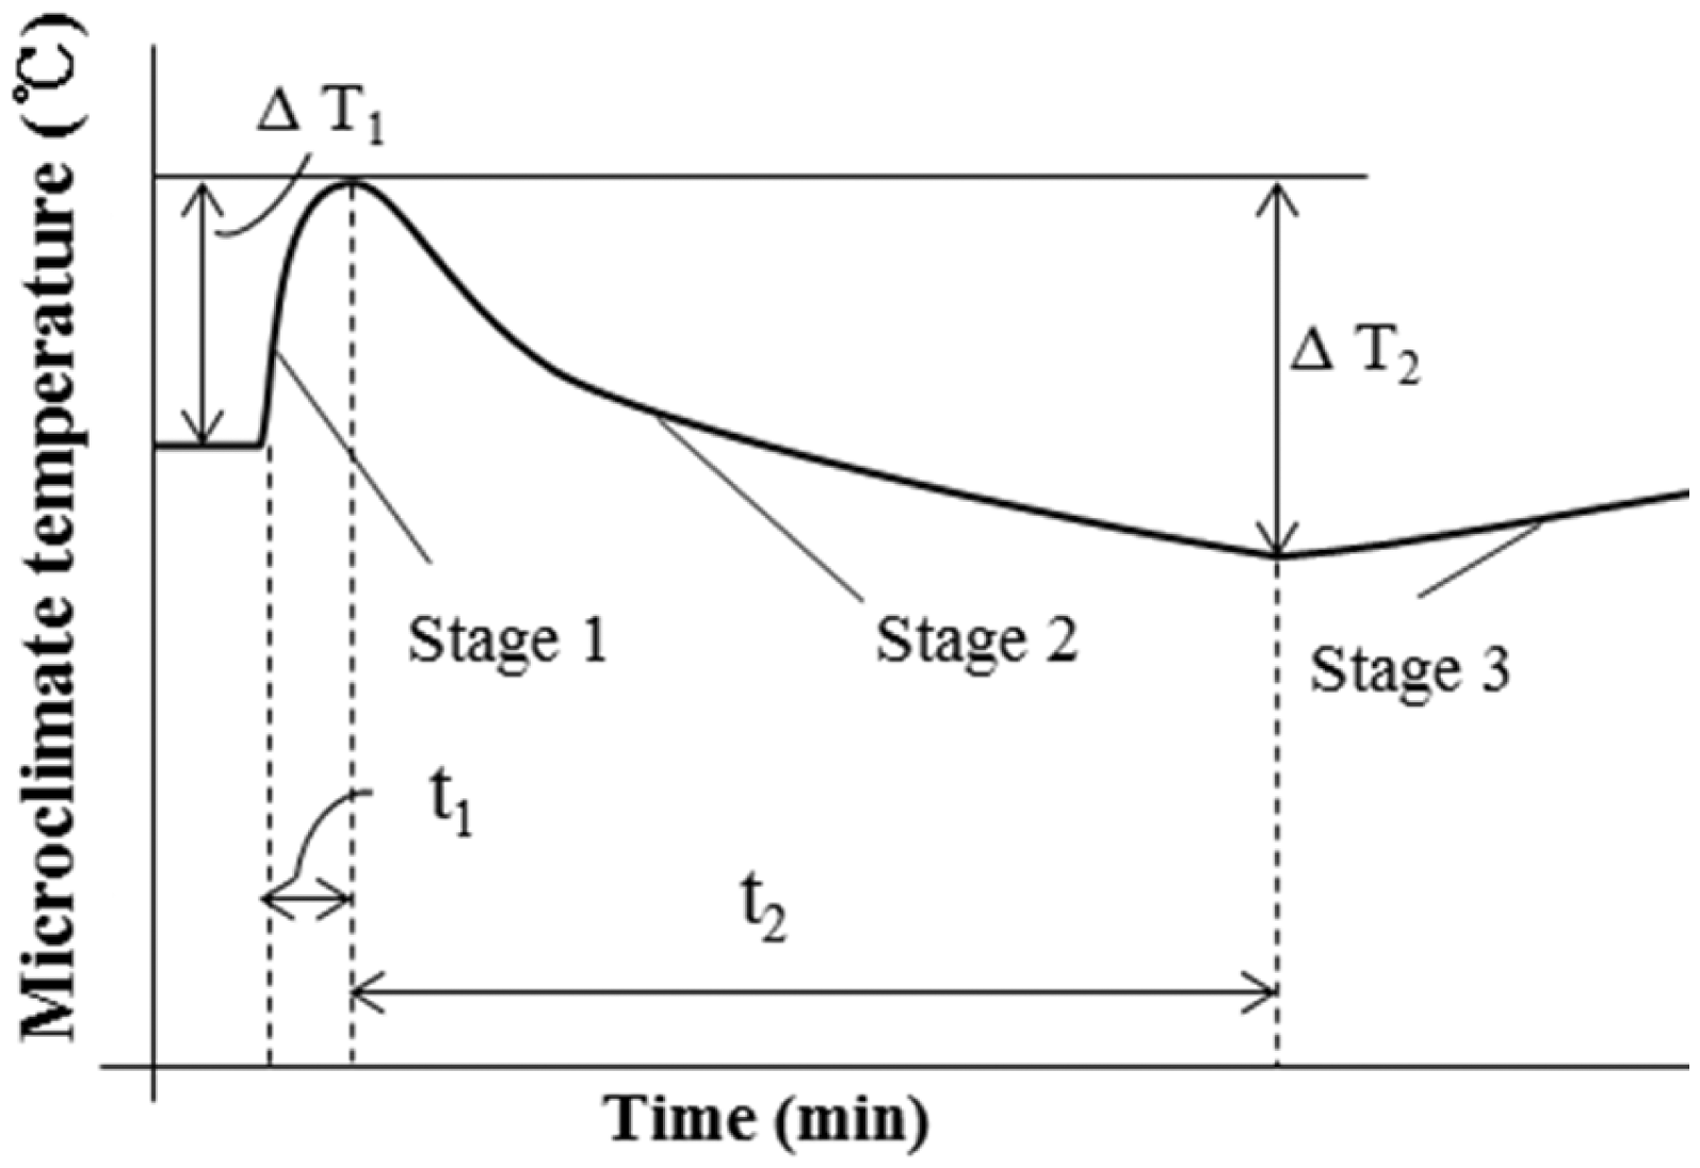
Results and discussion
Microclimate temperature
Figure 4 shows the time series results of temperature in the first air layer, formed by the hot plate covered with filter paper and underwear in each experimental condition. The temperature maintained around 31℃ during the stabilization period, but when the sweat pulse was applied to the hot plate, there was an immediate short increase in the microclimate temperature. As the sweat was added to the hot plate, the cotton fabric acted as the underwear absorbed the moisture and heat was produced, which is known as heat of sorption. When the skin model was moved from one chamber (20℃) to another with higher temperature, the microclimate temperature increased quickly in a span of time due to the positive effect of both ambient condition change and the heat of sorption from water vapor. However, under slightly cold (SC) and cold (CO) conditions, the positive effect of heat of sorption was greater than the negative effect of ambient temperature, resulting in just a slight increase in the microclimate temperature. In the extremely hot and humid (EH) condition, it reached the highest temperature at 37.5℃, followed by that in the hot and humid (HH; 35.9℃), extremely hot and dry (ED; 35.5℃), hot and dry (HD; 34.8℃), warm and dry (WD; 33.6℃), slightly cold (SC; 32.0℃) and CO (31.5℃). After this initial increase, temperature decreased slightly throughout the test at EH and HH conditions, while it dropped until a certain point and increased again in other conditions, indicating that the clothing system began to dry. At EH and HH conditions, no Stage 3 appeared during the 3 hour test period as the environment temperature and humidity were too high to remove the heat and moisture from the air layer.
Changes of microclimate temperature between skin and underwear at various conditions.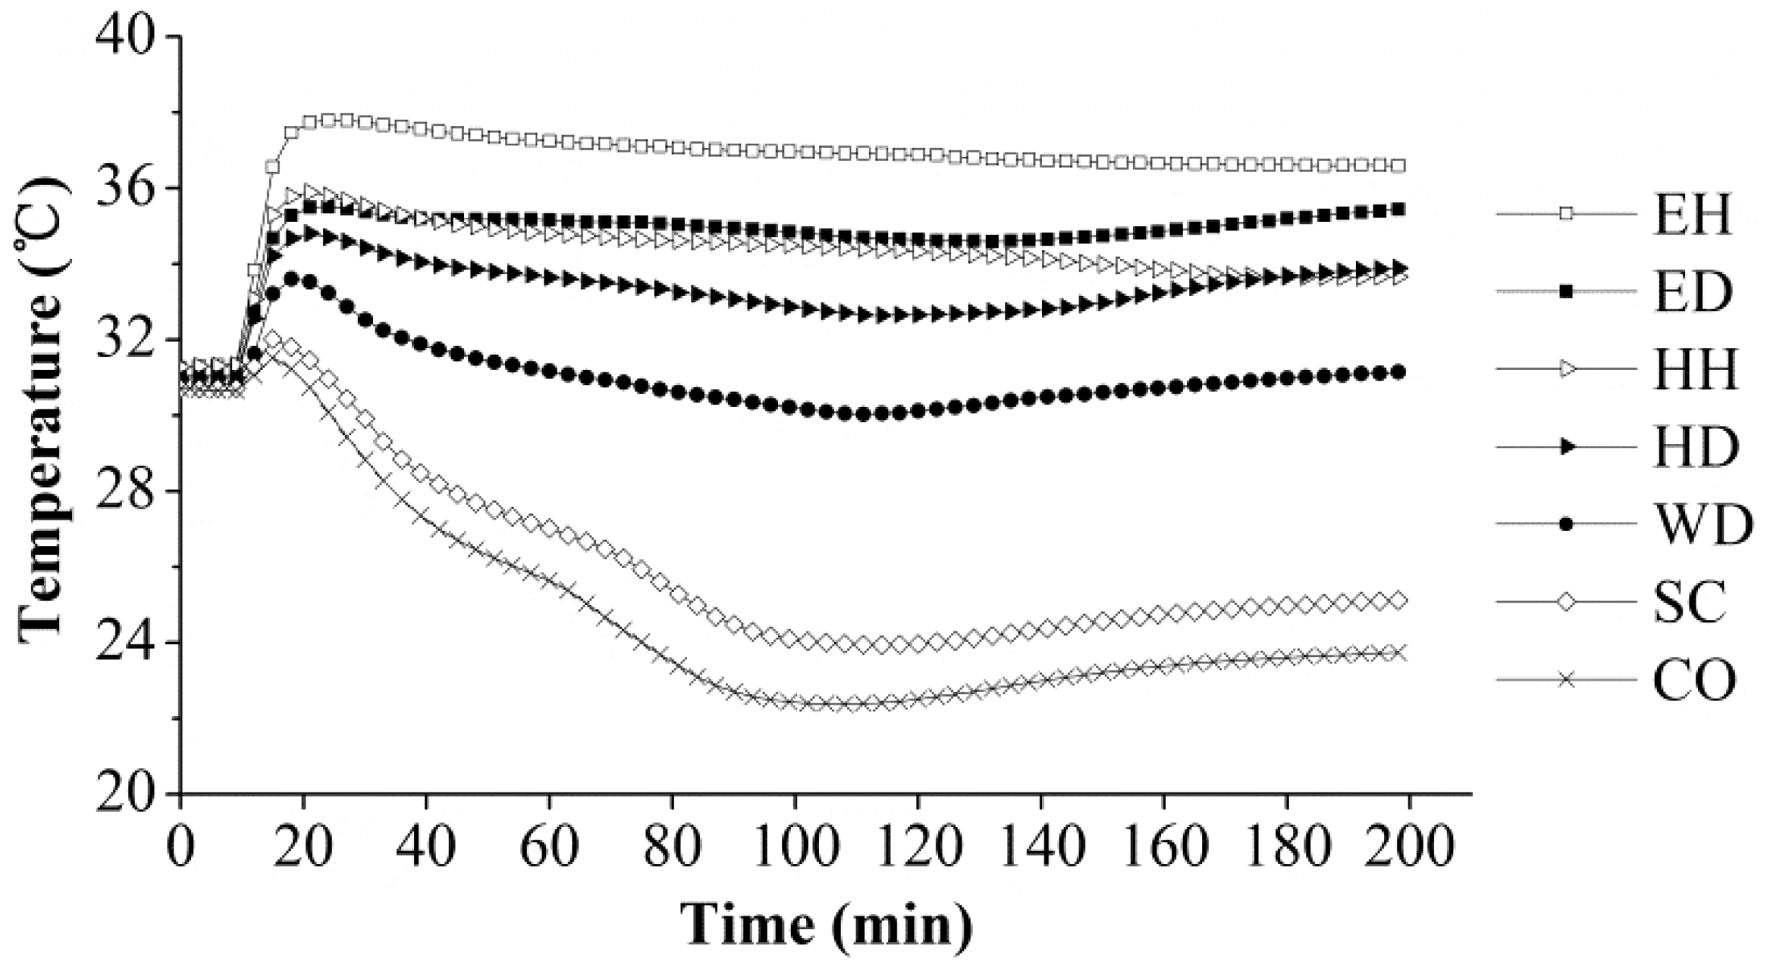
Comparing the temperature at ED, HD and WD conditions with the same ambient RH, the influence of the ambient temperature on the microclimate temperature was significantly different (p < 0.01), and the average temperature at the ED condition was 1.5℃ higher and 3.9℃ higher than those at HD and WD conditions, respectively. It indicated that at 1℃ increase in the environment with 1 m/s air speed, average elevation of 0.3℃ was in the microclimate temperature.
The temperature at the EH condition with higher RH was significantly greater than that at the ED condition with lower RH (p < 0.01). However, ED and HH allowed for similar trends and there was no significant difference until the end of Stage 2; in other words, a 6℃ difference in ambient temperature compensated 45% difference in ambient RH.
Figure 5 shows the result of temperature change (△T) and the time to take (t) in each stage. t1 was only 6–14 minutes, depending upon the test condition, while t2 was 9–16 times longer than that compared with the same condition, indicating that there was a slow process that took place between several quarters or a few hours to complete the evaporation. Comparing the conditions with the different ambient temperatures, it took 8 minutes and 17 minutes longer time to accomplish the Stage 1 and Stage 2 at ED condition than those at HD and WD conditions, respectively. At higher temperatures, there was a smaller potential for heat loss to the environment and a smaller potential for the sweat that was produced on the skin to move through the clothing layers and to evaporate, in which here we found a longer time to finish the evaporation. What is more, at EH and HH conditions, with very high ambient RH, Stage 2 lasted until the end of the test (Figure 5) and t2 was observed for much longer, which was almost twice more than those measured at other conditions. It indicated that the process of evaporation from the clothing system may be more negatively impeded at the high ambient RH, showing that the latent heat loss was unlikely to be achieved in these conditions. On the other hand, the temperature gradient between the skin and atmosphere was greater under SC and CO conditions, but it still took more time to finish Stage 2, which can be explained by the steady state it had achieved during Stage 2 (Figure 4).
Microclimate temperature change (ΔT) and the time to take in each stage (t). Note: the t2 values at extremely hot and humid (EH) and hot and humid (HH) conditions were obtained by subtracting t1 from total testing time as there was no Stage 3 until the end of test period.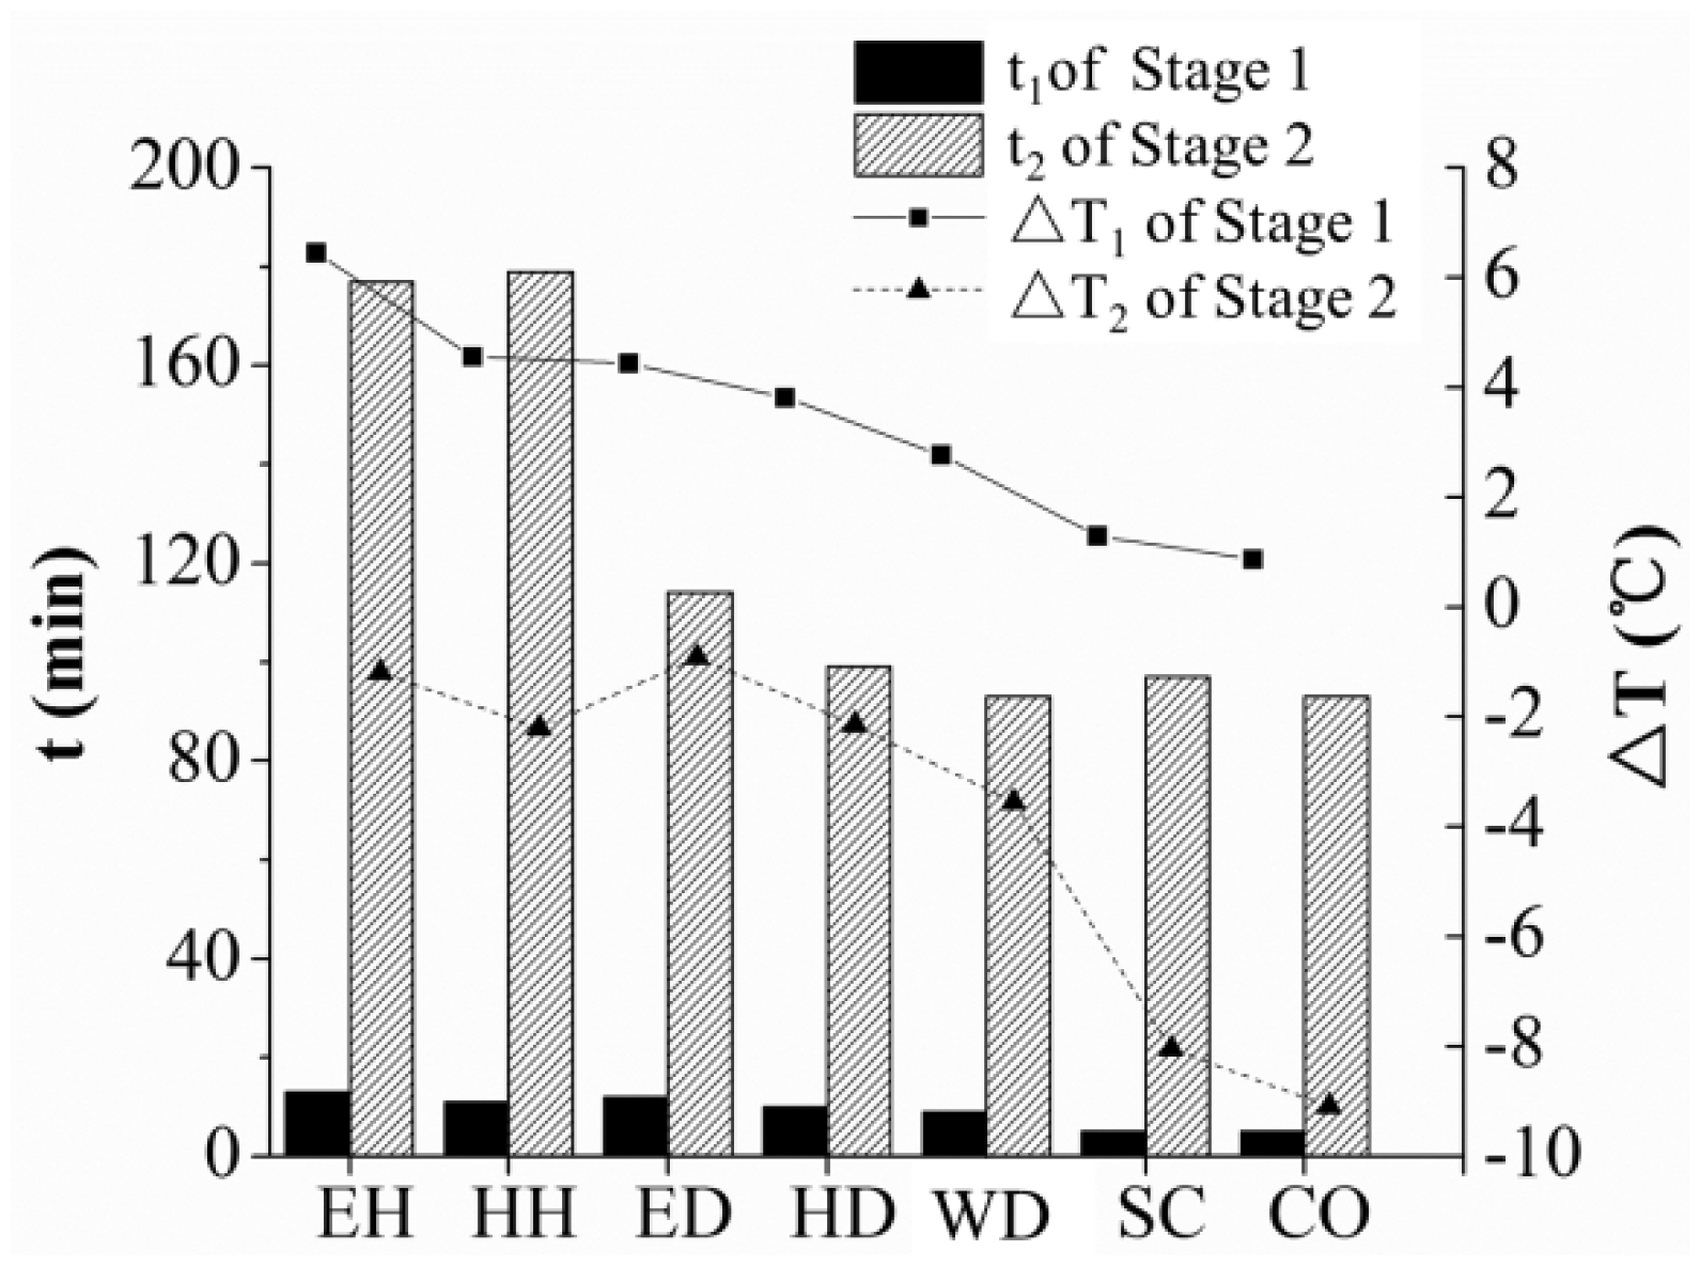
△T1 varied from 6.4℃ to 0.9℃, while △T2 varied from −1.2℃ to −9.1℃ depending on the test conditions. It was found that △T1 was higher when exposed to higher ambient temperatures and also to higher ambient RH, where water vapor was impeded in the microclimate due to the low vapor pressure gradient. During Stage 2, it was clear that the absolute values of △T2 were much greater at CO and SC conditions, indicating that greater heat exchange through conduction, convection and evaporation occurred between the clothing system and the atmosphere. On the other hand, at high ambient temperature, the heat transfer process by conduction and convection was difficult to achieve as the gradient was low, causing a slight microclimate temperature change and consequently maintaining continuous high temperature (Figure 4). The microclimate temperature that makes humans comfortable should be maintained at 32 ± 1℃, 22 whereas the average microclimate temperature under EH, ED, HH and HD conditions was 36.6℃, 35.0℃, 34.4℃ and 33.4℃, respectively, anticipating deviation from thermal comfort. Therefore it is required that the active focus be on using effective materials or systems to cool firefighters when exposed to thermal environments.21,23,24 On the contrary, adequate thermal insulation is needed under cold conditions for firefighters due to the highly negative temperature change when evaporation occurs.
Figure 6 demonstrates the relationship between all layers in terms of microclimate temperature and ambient temperature at 30, 60 and 120 min after the stabilization. To create fitting curves for microclimate temperature at different ambient temperatures, polynomial regression methods were employed for the first three layers respectively, and a linear regression method was employed for the fourth layer. It was clear that there were significant correlations (R2 > 0.9) presented at three time points (30, 60 and 120 min) for all layers, which meant a good fit for the selected data. A greater rise in the macroclimate temperature was observed with the increasing ambient temperature at the fourth layer, which indicated that the outermost air layer was affected more directly by the environmental temperature than the inner air layers. In this figure, we can also learn that when the ambient temperature was not higher than the skin temperature, the microclimate temperature for all layers at 30 min was higher than that at 60 min and then at 120 min due to the occurrence of heat transfer from the skin to the environment. However, microclimate temperature for all layers was almost unchanged as time passed at 40℃. After 120 min exposure to the chamber, there was around 13.8℃, 18.8℃, 27.3℃ and 34.8℃ rise in the microclimate temperature of the first layer, second layer, third layer and the fourth layer, respectively, as the ambient temperature increased from −10℃ to 40℃.
Relationship between microclimate temperature and ambient temperature at 30, 60 and 120 min after the stabilization.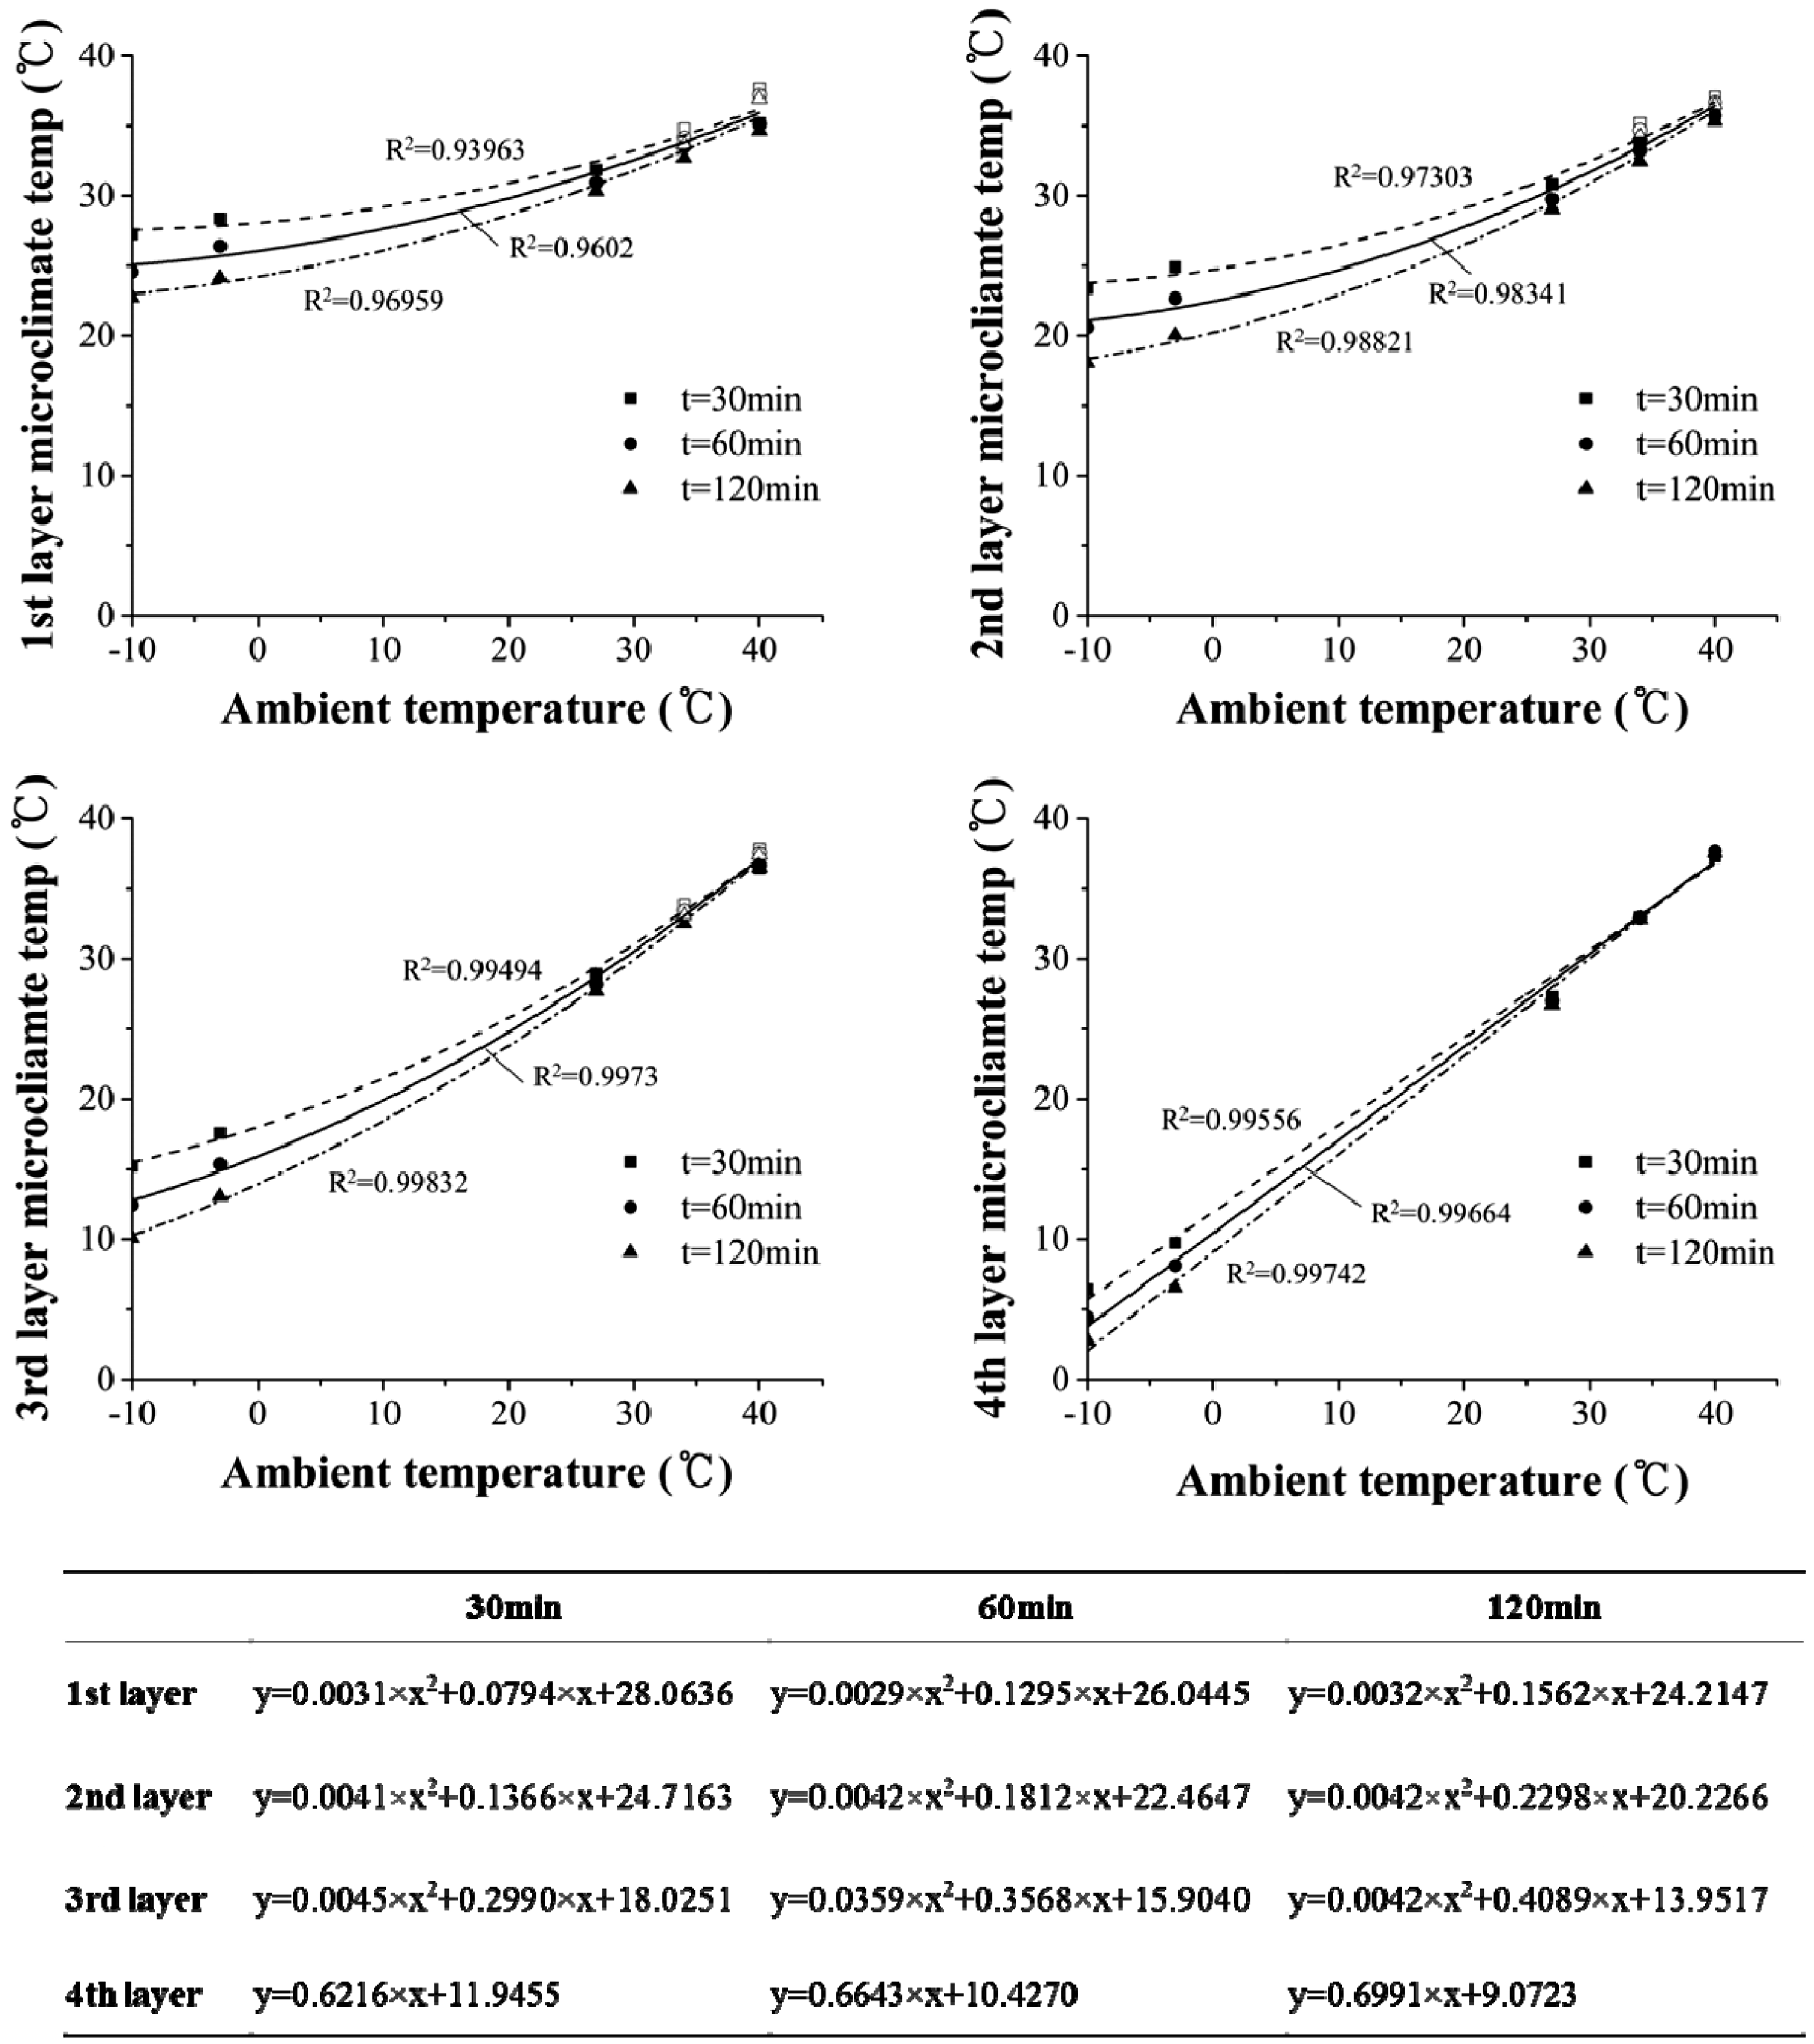
To get a further study of the temperature distribution within clothing systems, it is plotted against the distance from the skin at 60 minutes after the stabilization in Figure 7. When the ambient temperature was no higher than the skin temperature at HH, HD, WD, SC and CO conditions, the temperature across the clothing system decreased from the innermost air layer to the outermost air layer; however, the situation was conversed at EH and ED conditions. When the ambient temperature was higher than the skin temperature, heat may be gained by the body rather than lost by regular heat transfer processes for the negative temperature gradient. The highest temperature difference between innermost and outermost air layer was obtained at the CO condition, owing to the highest temperature gradient from the skin to ambient. The temperature distributions from high to low at SC and CO conditions did not follow approximate straight lines as it did under other conditions, since the condensation took place and changed the heat and moisture transfer through the clothing system, raising the partial microclimate temperature of the clothing system.
20
This condensation may lead to an increase of heat loss, as the thermal conductivity of water is approximately 24 times that of air.
Microclimate temperature distribution at 60 min after the stabilization under various ambient conditions.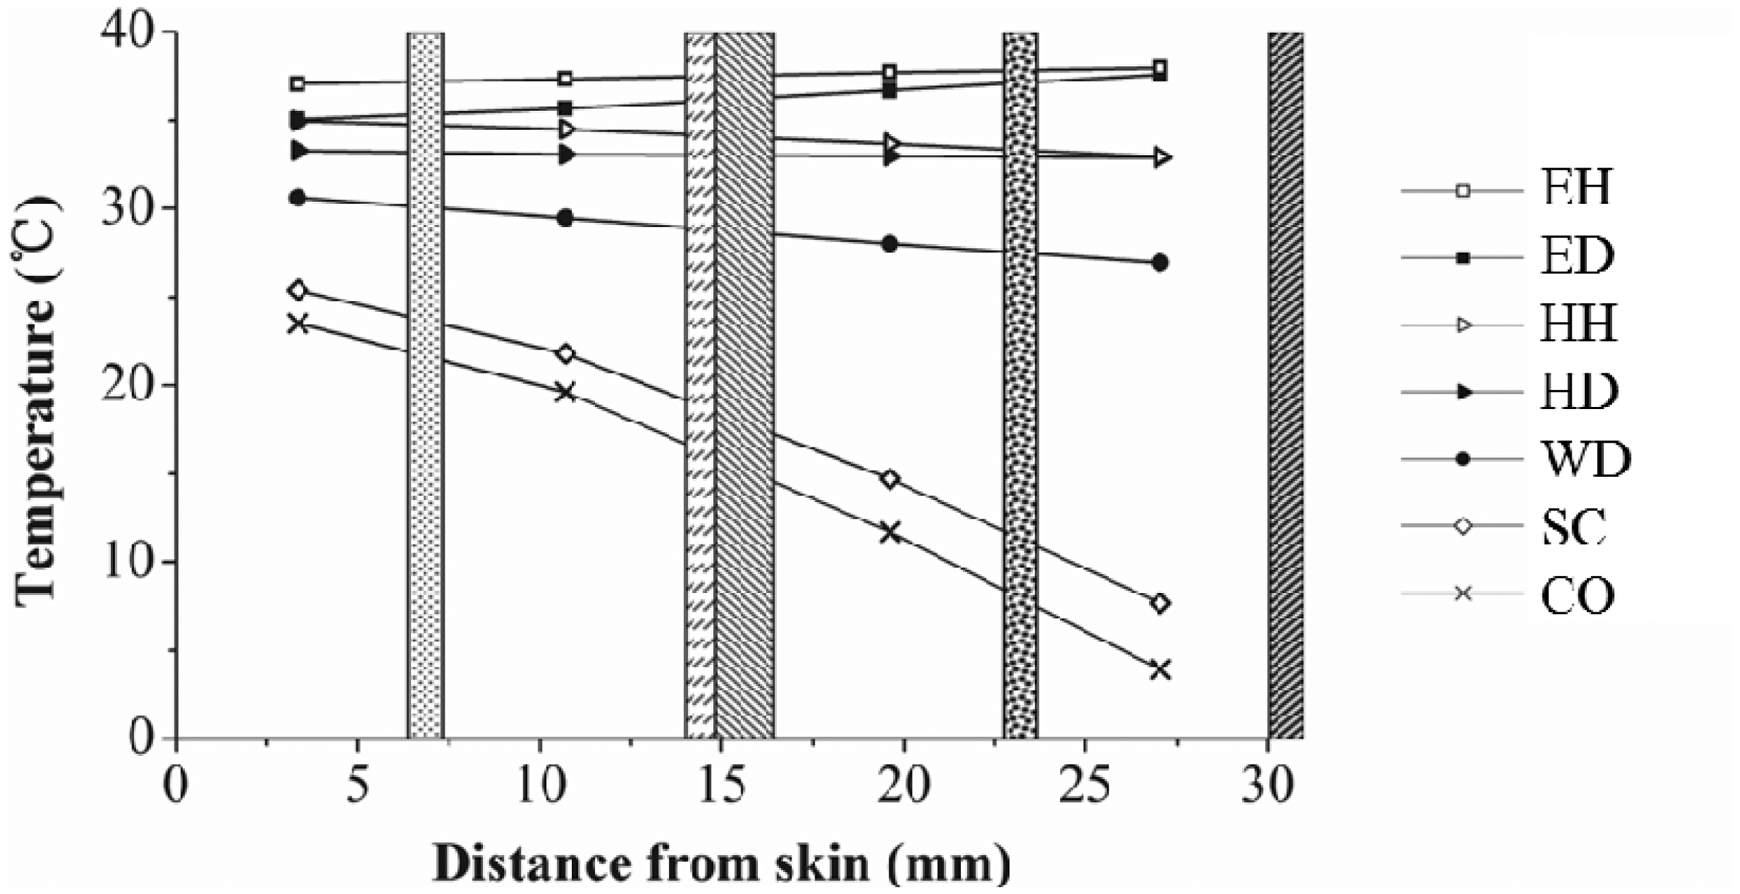
Microclimate vapor pressure
Figure 8 shows the results of microclimate vapor pressure over time in the first air layer under various conditions. The vapor pressure increased immediately after the sweat pulse was applied to the skin model, and it was significantly different among these test conditions (p < 0.01). The vapor pressure of the microclimate was increasing with ambient vapor pressure and it maintained very high vapor pressure continuously following the sweat pulse at both HH and EH conditions (50 and 62 mbar, respectively). The high RH of the ambient condition reduced the vapor pressure gradient between skin and atmosphere, thus reducing the rate of vapor diffusion. These conditions require sweat to be absorbed by the clothing nearest to the skin and passed through to the outer layer of the fabric by a wicking action. Under SC and CO conditions with very low ambient temperature, the trend of the vapor pressure after the increase period departed from what it showed under other conditions, which would be explained by the condensation in the clothing system. Condensation occurs at some locations in the clothing system when the water vapor pressure exceeds the saturation temperature at that temperature, which in turn blocks some of the pores in textiles,20,25 thus reducing the water vapor transport.
Changes of microclimate vapor pressure between skin and underwear at various conditions.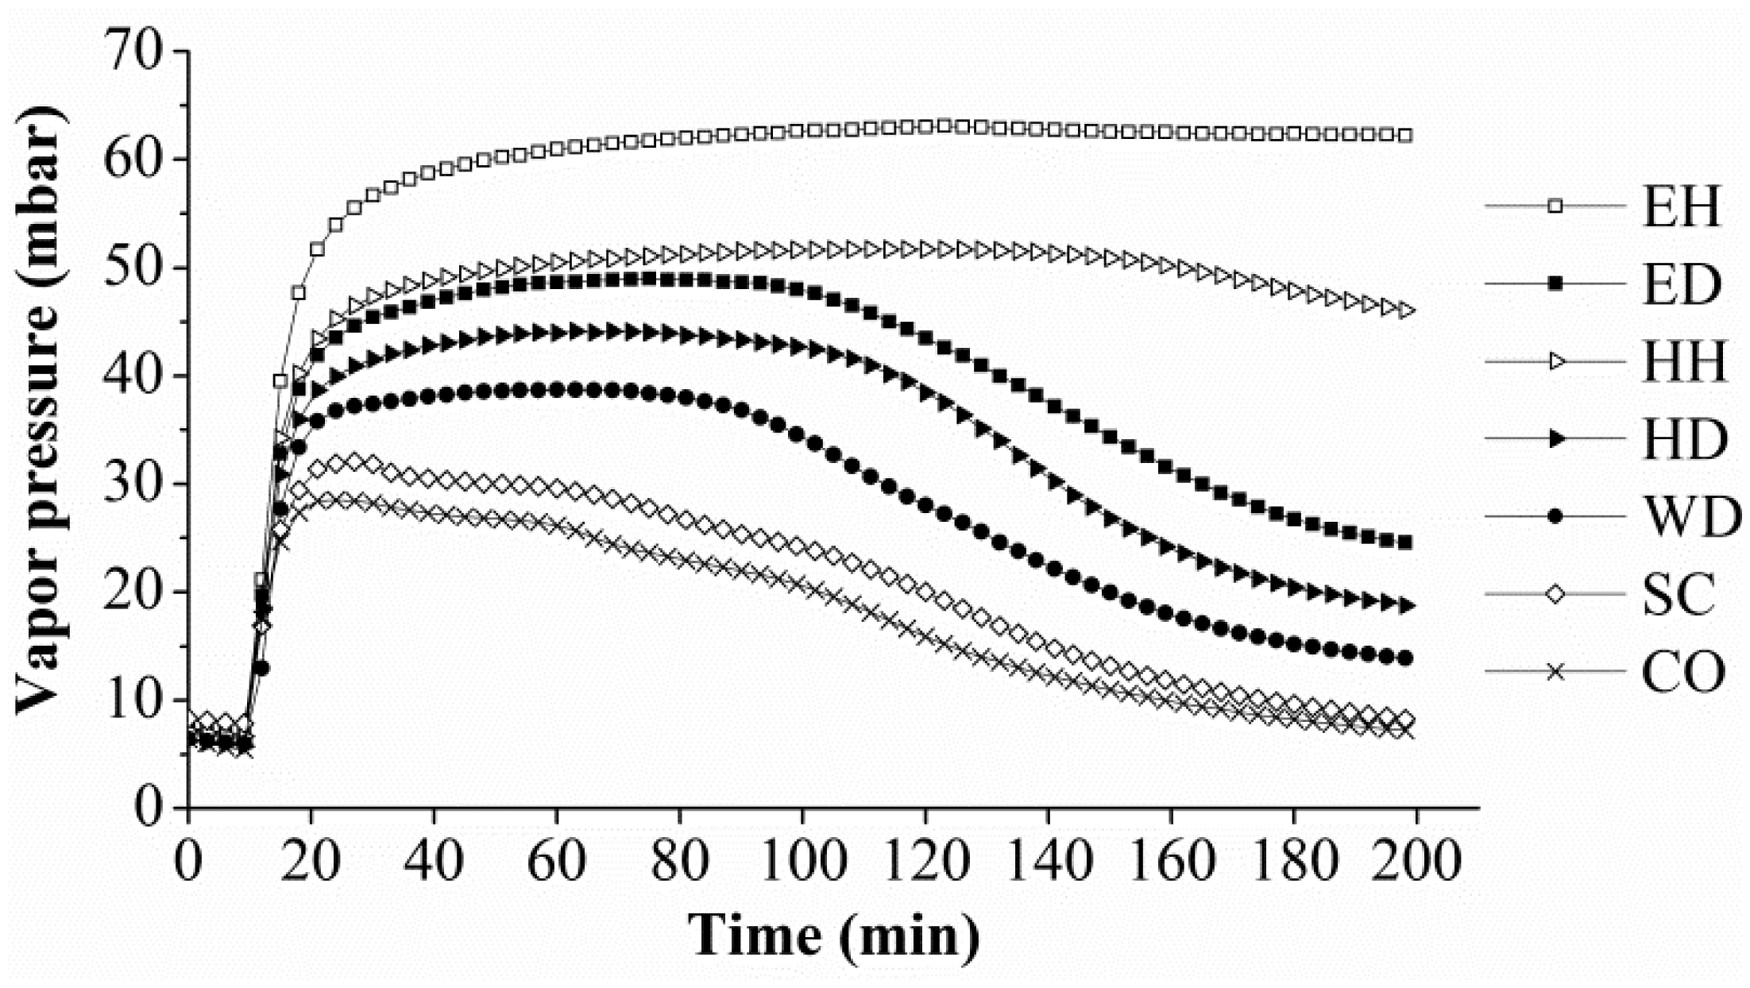
Similarly, partial correlation analysis was carried out to investigate the correlations of microclimate vapor pressure with ambient vapor pressure at 30, 60 and 120 min after the stabilization (Figure 9). The polynomial regression methods were applied to curve fitting for the first three layers respectively, and a linear regression method was employed for the fourth layer. At three time points, significant correlations (R2 > 0.9) were observed in the relationship between the microclimate vapor pressure and the ambient vapor pressure for all layers. The microclimate vapor pressure in the fourth layer went up linearly as the ambient vapor pressure increased, indicating that the most direct impact was played on the outermost air layer by the ambient vapor pressure change. The microclimate vapor pressure in the first, second and third layers seemed complicated when the results at 30, 60 and 120 min were compared. At lower ambient vapor pressure, such as CO, SC and WD conditions, microclimate vapor pressure at the first three layers observed at 120 min was lower than that at 60 and 30 min, since the water vapor transferred from the skin to the environment with the lapse of time. However, at higher ambient vapor pressure, such as the EH condition (67.4 mbar), microclimate vapor pressure was observed to be higher at 120 min than that at 60 min and similarly higher at 60 min than that at 30 min, as the water vapor accumulated in the microclimate with the lapse of time. After 120 min exposure to the chamber, the microclimate vapor pressure in the first layer, second layer, third layer and fourth layer increased by 48.0, 49.9, 50.4 and 63.1 mbar, respectively, as the ambient vapor pressure increased from 0.57 to 67.4 mbar.
Relationship between microclimate vapor pressure (VP) and ambient vapor pressure at 30, 60 and 120 min after the stabilization.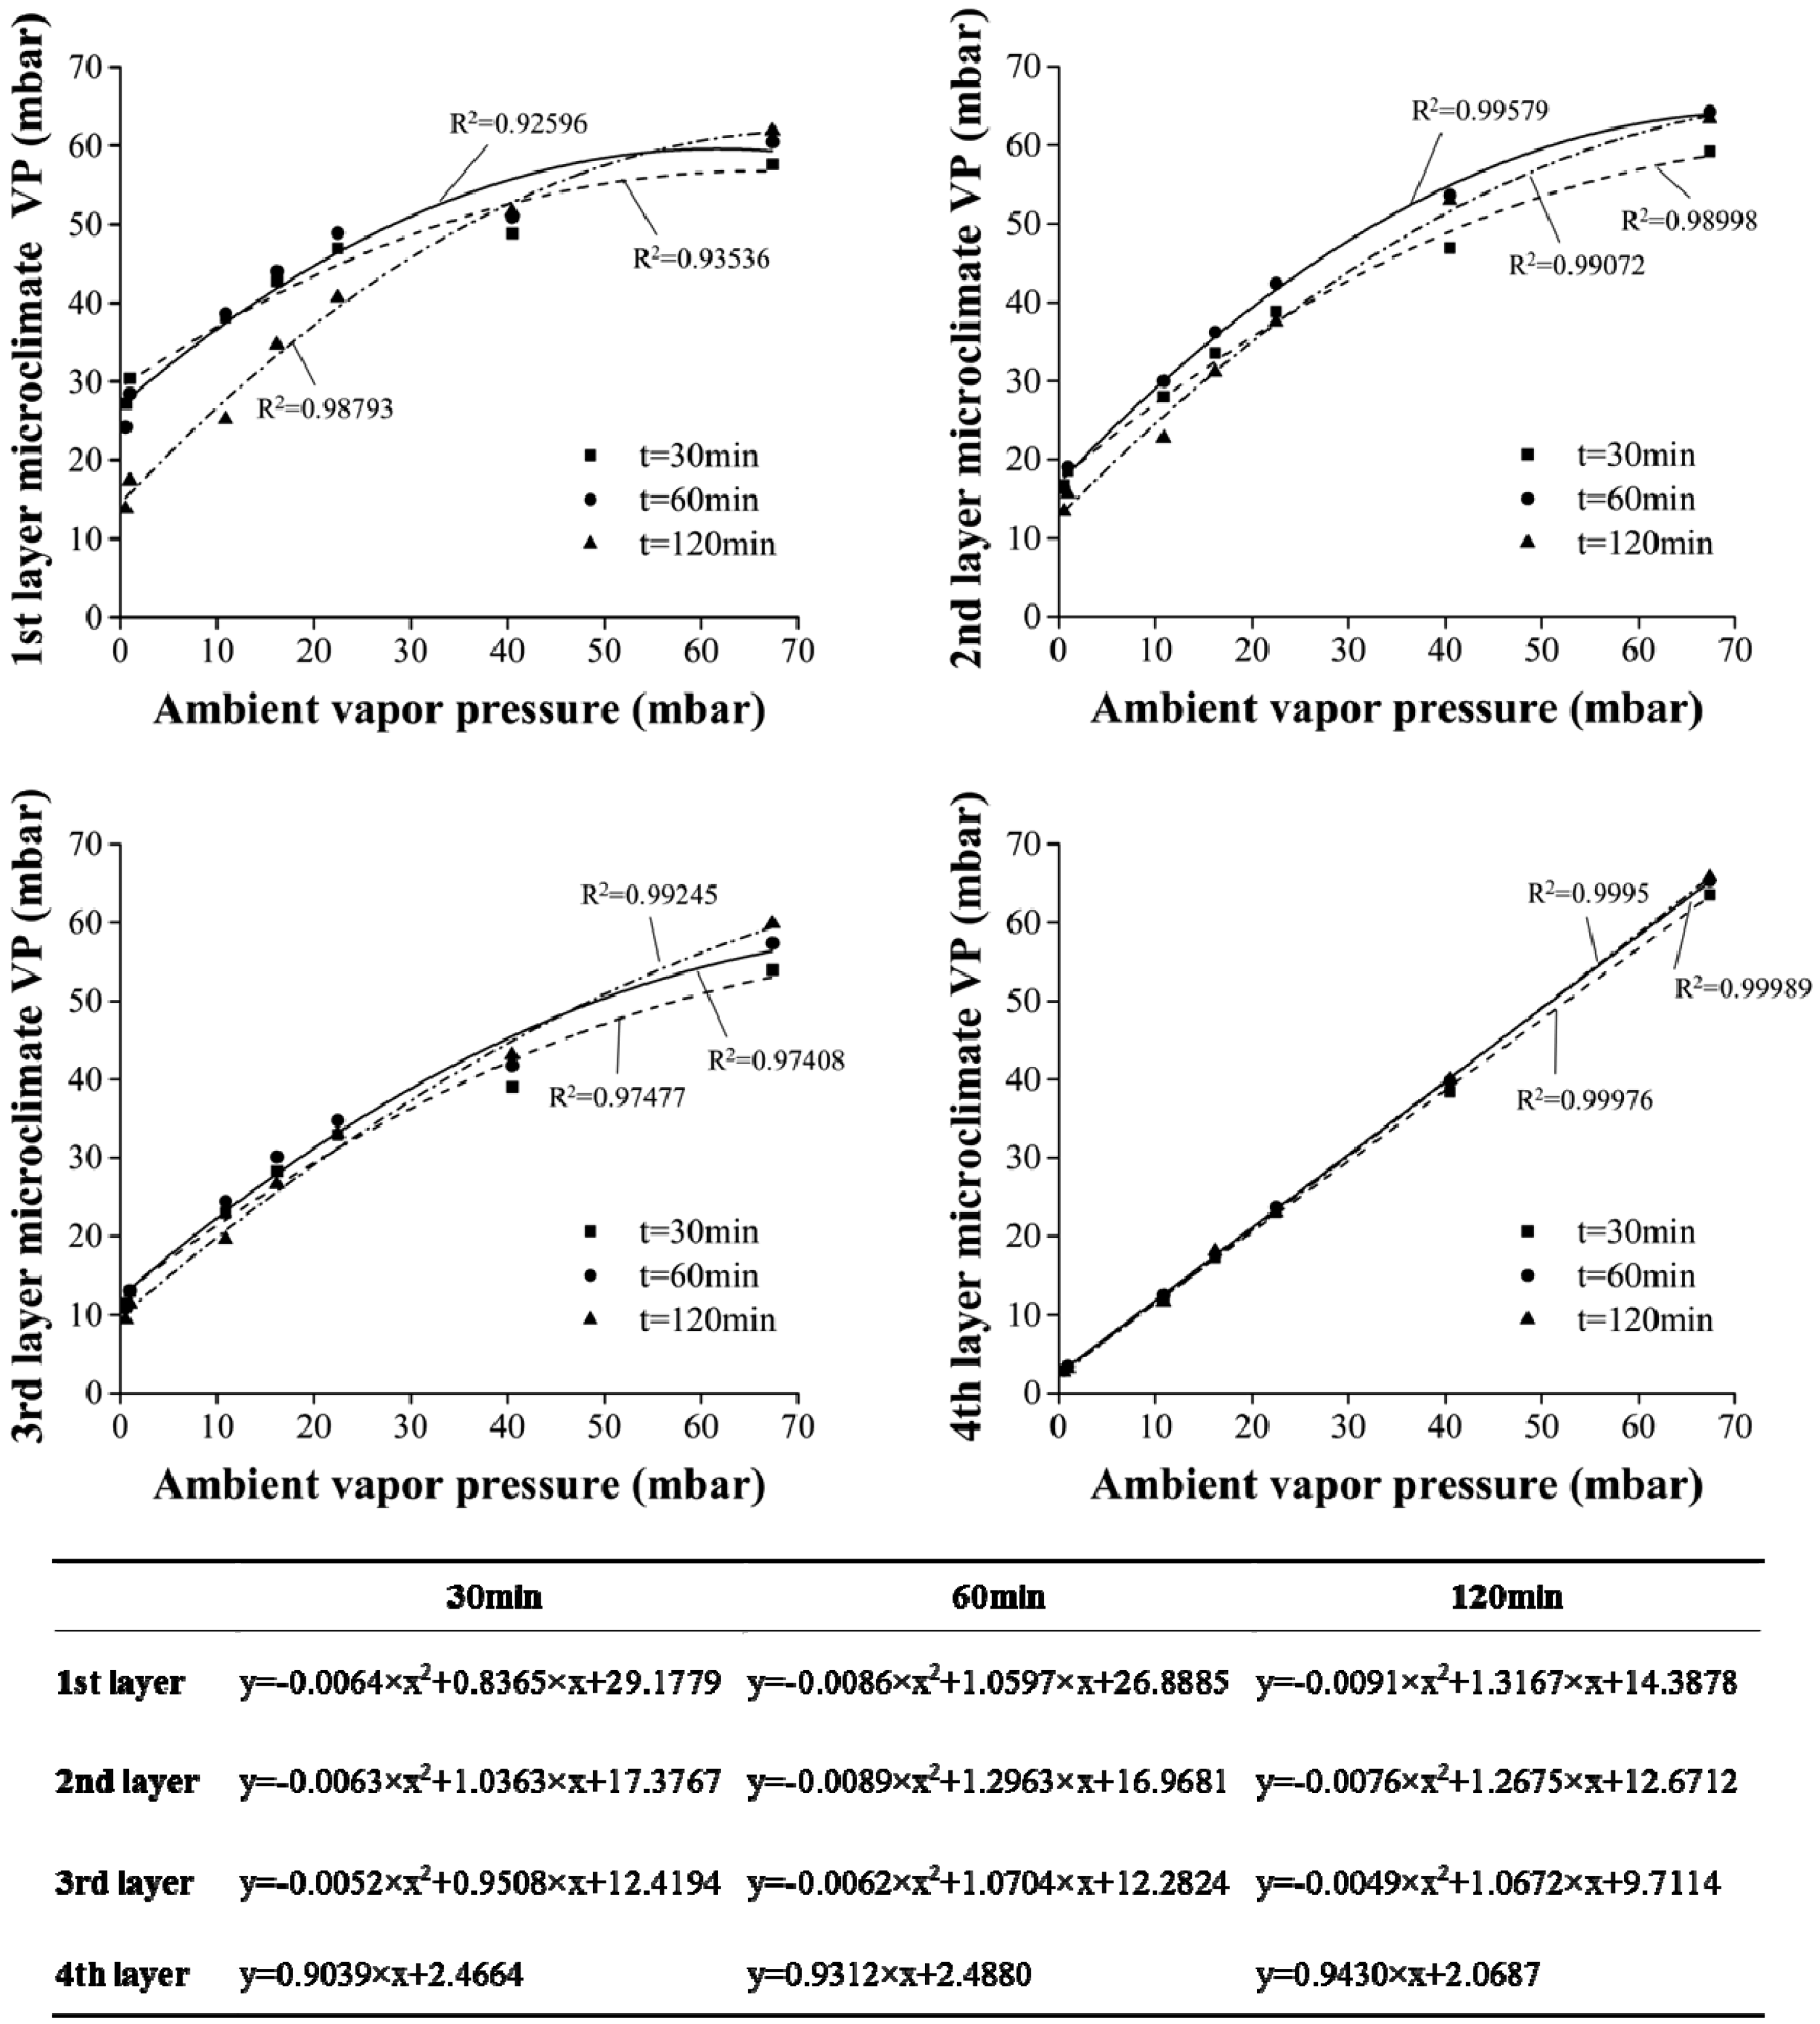
Figure 10 shows the vapor pressure distribution within microclimate at 60 min after the sweat pulse. The distribution of the vapor pressure across the multilayer clothing system seemed complicated under HH and EH conditions, while it gradually decreased from the innermost air layer to the outermost air layer under other conditions. The vapor pressure within the second air layer, formed by the underwear and thermal liner, was much higher than that of the first air layer and third air layer under HH and EH conditions, which meant that the water vapor could not be efficiently transported to the outer air layer due to the high water vapor resistance of the thermal liner. Moreover, at HH and EH conditions, the vapor pressure of the outermost air layer was about 40 and 65 mbar, respectively, both of which were smaller than that of the corresponding ambient vapor pressure. Therefore, the transport of the water vapor would also be from the ambient to the outermost layer of the clothing system under these conditions.
Sweat accumulation
Figure 11 shows the average moisture accumulation in the clothing system and the moisture remaining on the skin under various ambient conditions. The total moisture accumulated within clothing layers and left on the skin was over 5.4 g under the EH condition, which was greater than the total supplied water (5 g), indicating that the clothing system would have been able to absorb moisture not only from the sweat but also from the atmospheric moisture. Around 82% of supplied water evaporated from the clothing system under ED, HD and WD conditions; however, the percentage of evaporative water vapor was 59% and almost zero in HH and EH conditions, respectively. The amount of water vapor evaporated from the clothing system in the HH condition would be overestimated because it also might absorb the moisture from ambient with high humidity. When exposed to high RH, sweat accumulation within clothing layers and moisture absorption from the atmosphere (much higher moisture obtained in the outer shell) were significantly greater, which in turn reduced the water vapor transport as the water intake caused the fiber to swell, and furthermore increases the risk of steam burns under sudden heat flux exposure.
26
Moisture accumulation in the clothing system and moisture remaining on the skin under various ambient conditions.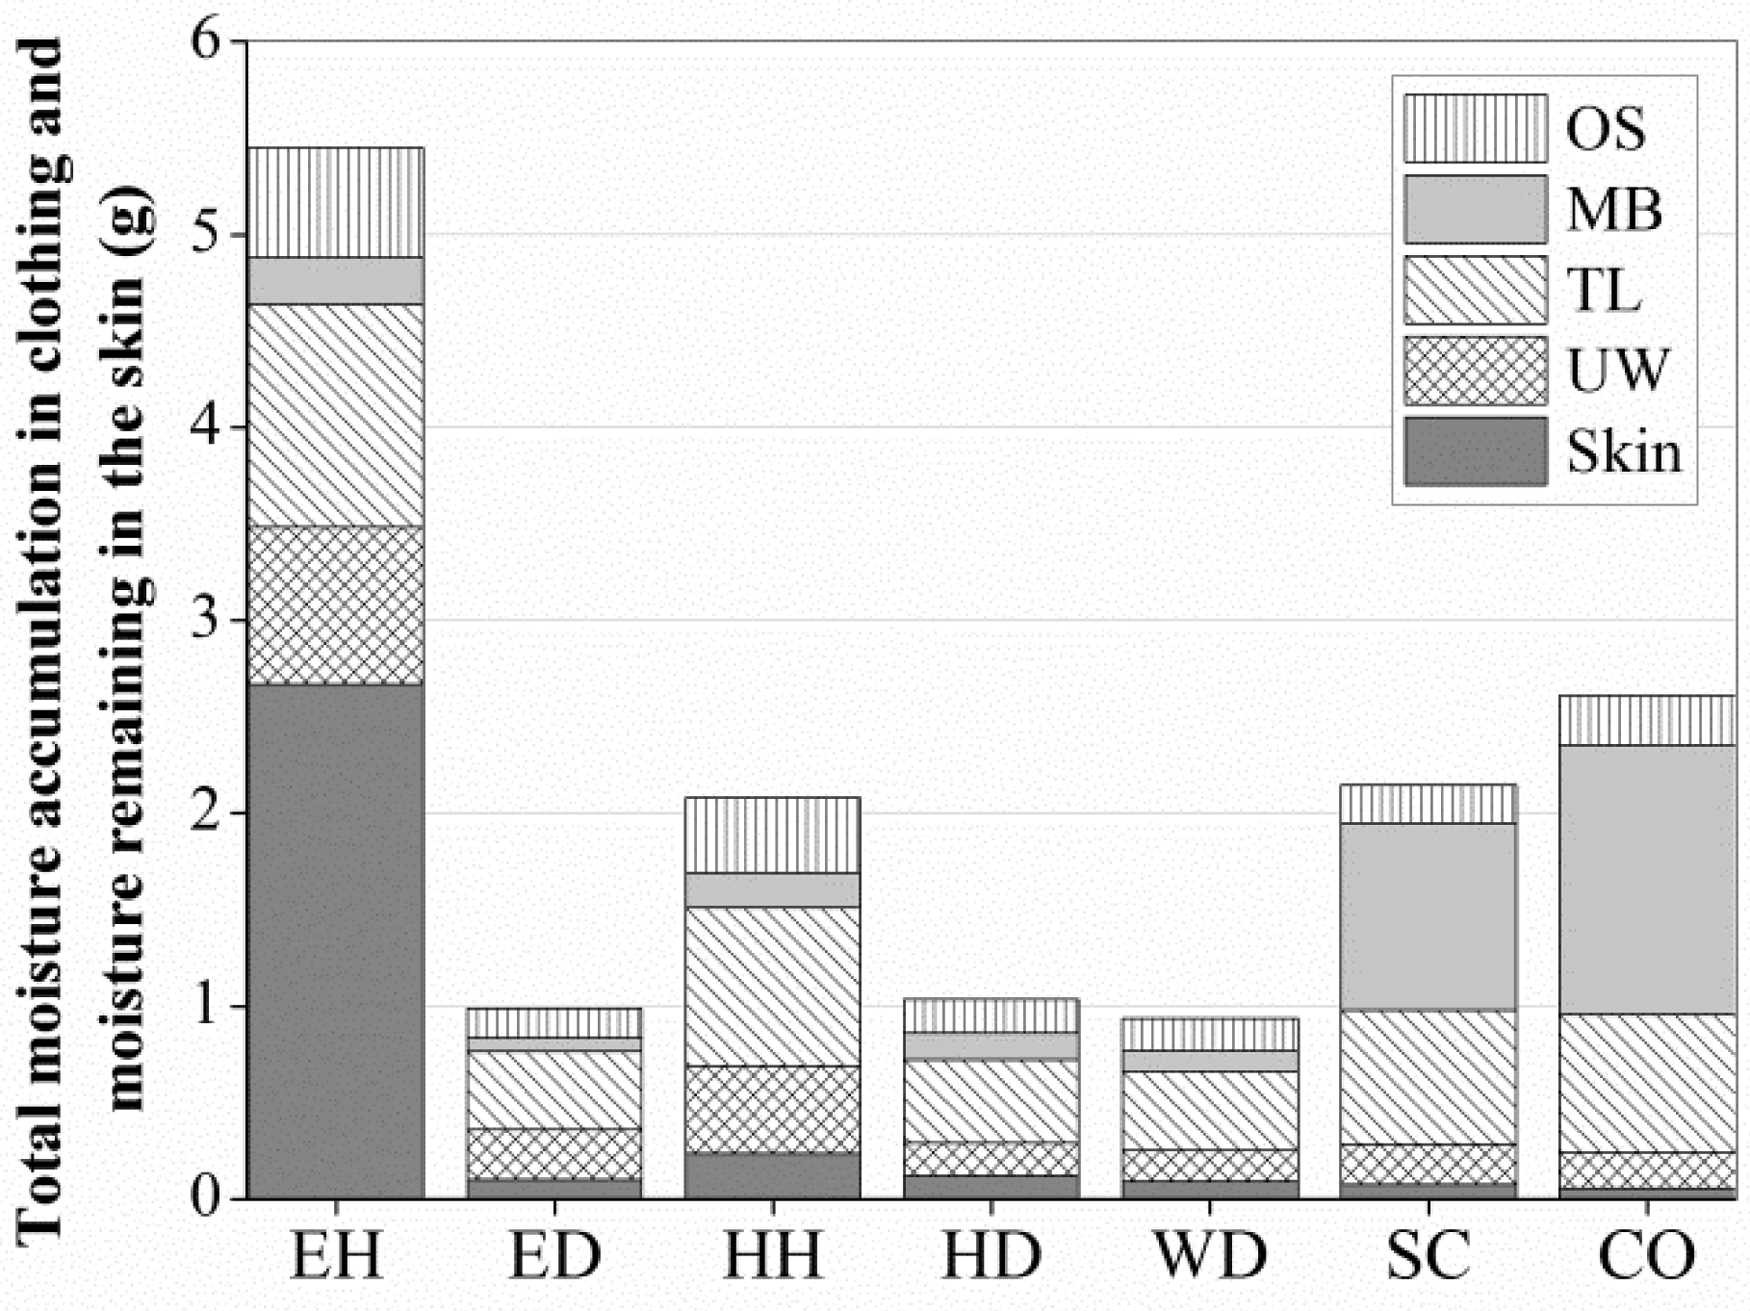
Although the evaporative moisture from the clothing system was expected to be greater under cold conditions, moisture accumulation was 1.2 and 1.5 g greater than that at the WD condition, and moisture accumulation corresponded at 43% and 52% of the total amount of supplied water under SC and CO conditions, respectively. It is reasonable to believe that there was some condensation within the clothing layers. In the CO condition, moisture accumulation for both condensation and absorption within the clothing system was 0.5 g higher than that in the SC condition. This result agrees well with Finn et al. 27 They pointed out that both condensation and the amount of absorbed water increased with decreases in ambient temperature, since fewer water molecules had enough energy to escape adsorption at a lower ambient temperature. Even under these cold conditions, firefighters are always in a high rate of physical activity to produce sensible perspiration; however, it cannot evaporate as much since the moisture transfer through the layers is complex and much of it is absorbed or condensed in the layers. To some extent, it is helpful to heat transfer but the detrimental factor is that moisture remaining in the clothing dries out and takes the heat from the skin, 28 which is not wanted when activity slows down or rest is taken.
Sweat remaining on the skin was 0.24 g under the HH condition, which was significantly greater than that in HD, WD, SC and CO conditions. What is more serious is that 2.67 g of sweat was accumulated on the skin in the EH condition. At high temperature with high humidity, the sweat that cannot move out from the skin surface would give a sense of discomfort to the wearer. Under EH, ED, HH, HD and WD conditions, the maximum moisture accumulation was located in the thermal liner (1.15, 0.4, 0.82, 0.43 and 0.41 g, respectively), corresponding 42–48% of the total moisture that was contained within the clothing system. However, under SC and CO conditions, around 0.97 and 1.4 g of moisture accumulated mainly in the moisture barrier, following that in the thermal liner with 0.70 and 0.71 g, respectively (altogether there was over 80% of moisture accumulation within clothing layers). As the waterproof breathable moisture barrier contains microspores that are only for water vapor transmission and consequently the condensed sweat is prevented from reaching the clothing surface where it can evaporate, the moisture would accumulate and it might eventually freeze. 29 Then the pores would be blocked with the condensation, which would worsen the water vapor transport of the clothing.20,25 The region of condensation on the inner surface of the moisture barrier was thus expanded and eventually most of the moisture accumulated on both the thermal liner and moisture barrier. Yoo and Kim 20 also found in their study that most of the moisture accumulated in the second and third layers but not very much in the outermost clothing layer at −15℃, where they used a polytetrafluoroethylene (PTFE) laminated waterproof breathable fabric as the outermost layer.
Conclusion
This study showed the heat and moisture transport performance of the multilayer protective clothing under seven different ambient conditions. Several stage changes of microclimate were conducted throughout the process of the test. As ambient temperature increased, microclimate temperature was observed to be higher and the microclimate vapor pressure rose with the increase of ambient vapor pressure. It also revealed that the overall moisture accumulation distribution in multilayer clothing could be influenced by the ambient condition.
The results are important in the context of the non-fire situations for firefighters, including not only high temperatures but also low temperatures. It reveals that microclimate, the nearest environment surrounding the human body, is closely associated with the ambient conditions, and also that it changes with the periods of time, indicating that the wearer is exposed to a changeable microclimate instead of the constant ambient conditions. The next step of the study is to investigate whether these changes of the microclimate would affect the physiological and psychological responses of the wearer. The results of this study challenge designers and producers of firefighters’ clothing to put more effort into improving the properties of the materials or the designs of the protective clothing in order to adapt to the ambient conditions.
Microclimate vapor pressure distribution at 60 min after the sweat pulse under various ambient conditions.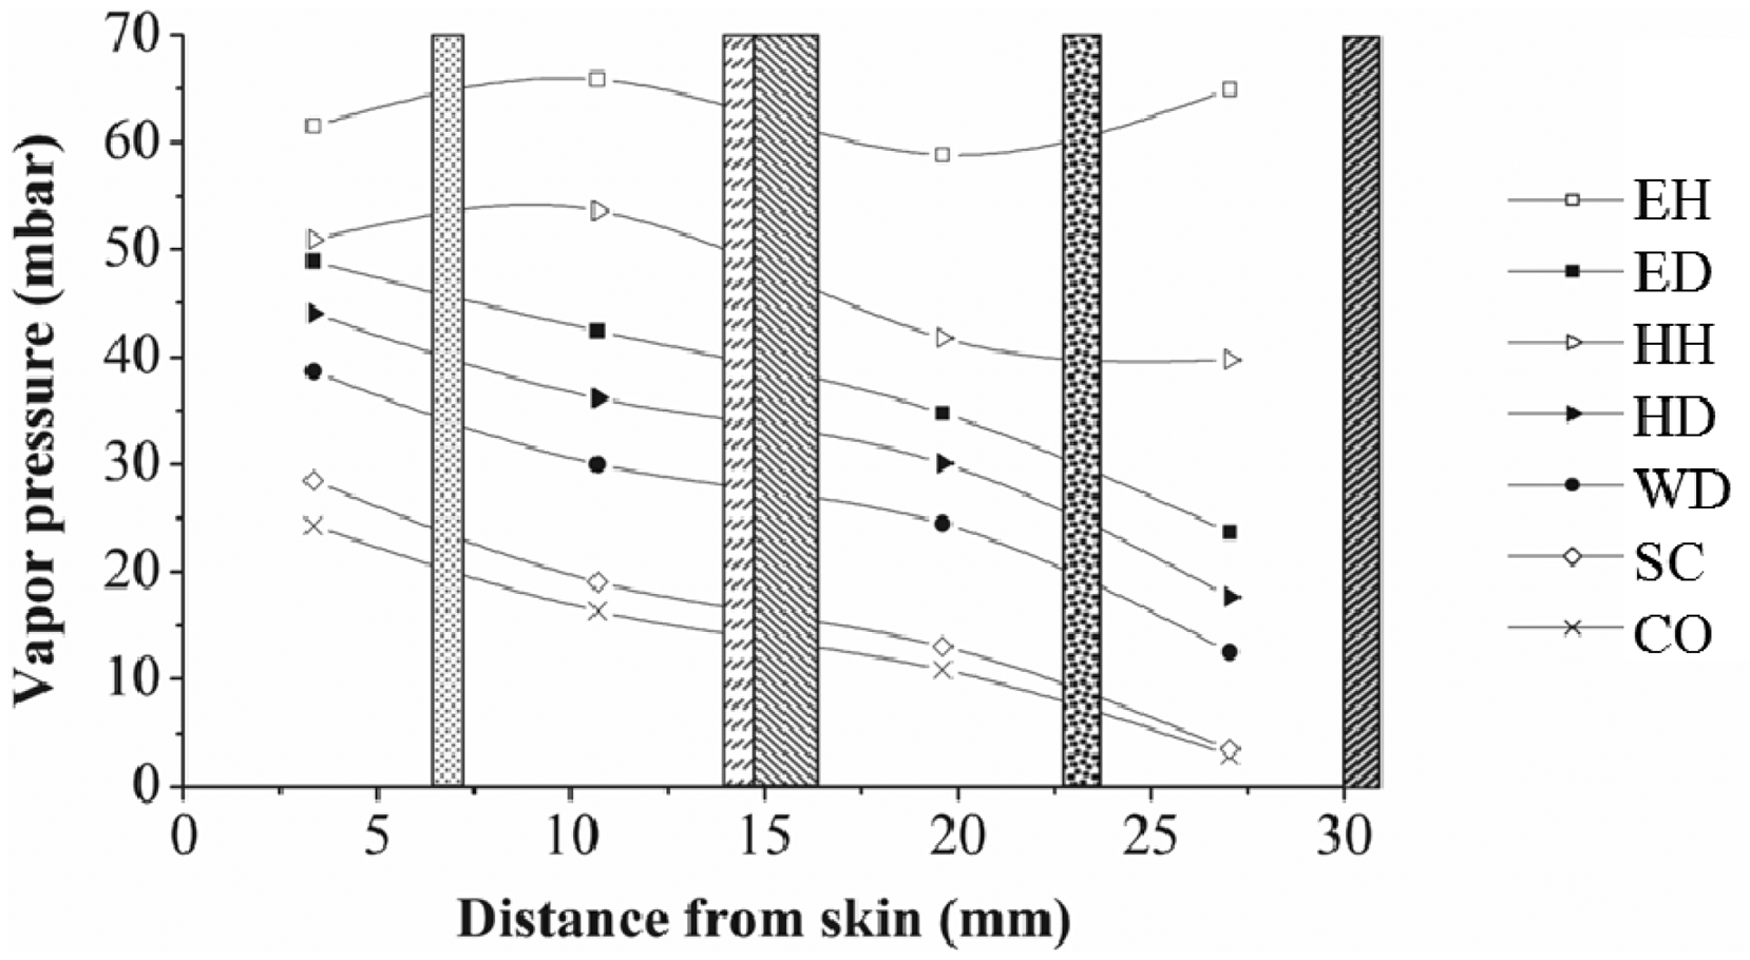
Footnotes
Funding
This work was supported by the National Research Foundation of Korea (NRF) grant funded by the Korea government (MEST) (No. NRF-2012R1A2A2A03047265). The authors in the first affiliation express their gratitude for the financial support of the Program for New Century Excellent Talents in University of Ministry of Education (NCET-10-0321), the Innovation Program of Shanghai Municipal Education Commission (12ZZ068) and the Doctoral Program of Higher Education of China (20110075120009/20110075110005).