



Abstract
A new method to measure the warp or weft yarn crimp in fabric is proposed. The method is based on the analysis of yarn tensile characteristics. In the proposed method, yarns with predetermined distance are removed from fabric and clamped between the jaws of a tensile-strength machine (Instron) without any pretension in the yarn and, accordingly, yarn crimp is measured. The results were also compared with the other two existing methods. The results of yarn crimp in the warp and weft direction of the fabric are found to be sensitive to selection of the applied force range. Peirce’s model of plain weave was used to predict the fabric thickness from the estimated values of yarn crimp. It is also observed that predicted and measured fabric thickness have statistically significant correlations.
The crimp of warp and weft yarn in woven fabrics is influenced by various factors, such as loom setting, type of fabric, sets of fabric, fabric weave, yarn diameters, weft and warp yarn bending rigidity, compression of yarns (at binding points), etc. The yarn crimp also changes during the fabric production on the loom, fabric relaxation in cloth roll and chemical processing of the fabrics. The yarn crimp also influences the economics of the fabrics due to change in fabric contraction, extensibility of fabric during finishing, fabric tensile properties, fabric weight and thickness and shape stability. It means, yarn crimp is highly governed the consumption of material to a specific application of a fabric. Crimp, crimp amplitude and length of the yarn axis are generally used as input data to predict the fabric properties, but these parameters are complicated to define and measure.
Several researchers have studied the phenomenon of yarn crimp in the fabric and proposed different models of cloth geometry.1–7,13,14 The existing methods15,16 have their own merits and demerits while studying the cloth geometry. The study of real geometry of crimp in a woven fabric is very tedious due to variation in fabric structure, because each wave is independent and differs from the other wave, yarn is not uniform and it is often problematic to find out the position of the yarn axis. In the ASTM D 3883-99 16 “Standard Test Methods for Yarn Crimp and Yarn Take-up in Woven Fabrics” method, yarn crimp is measured on a crimp tester or tensile testing machine at a constant rate of extension. The force required to remove the crimp in the yarn is determined by analyzing the stress–strain curve of the yarn.
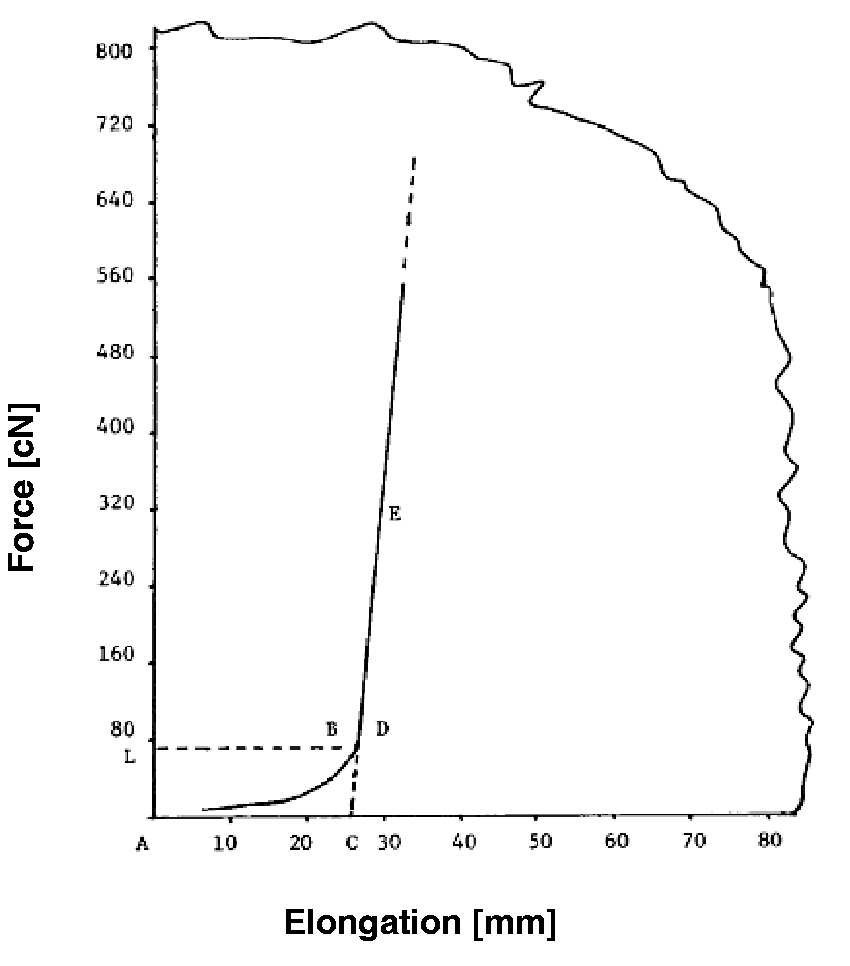
Establish point A as the point where the force extension curve begins, that is, zero force and zero extension. Extrapolate the straight-line portion of the force–extension curve through the extension axis, line CE. The portion of the curve AD represents the removal of the crimp and initial stretch of the yarn. Establish point D where the force–extension curve separates from the line CE. Establish point B by constructing a line from Point C, parallel to the force axis to curve AD. Establish point L by constructing a line from point B through the force axis, parallel to the extension axis. The force corresponding to point L is the required tensile force to remove the crimp without stretching (see Figure 1). The testing length (initial length) in this standard is 250 mm.
Chart to determine the tensile force according to ASTM D 3883.
16
To address the above-mentioned problems, Kovar
8
has proposed another method to measure the yarn crimp. In the proposed method, two points were marked at a distance of 200 mm on a relaxed fabric sample in both warp and weft directions and, accordingly, a set of warp and weft yarns were taken out from the fabric for the required analysis. A gauge length of 200 mm was maintained precisely to accommodate the marked points on the yarn sample between the jaws of a dynamometer. The critical point C in Figure 2 represents the end of the de-crimping.
Position of critical point C in the stress–strain curve
8
.
Point C is the point of intersection of the horizontal axis that defines the de-crimped portion of the yarn and the secant of the measured stress–strain curve at the point of maximum slope M. Accordingly, yarn crimp is defined as the ratio of the de-crimped portion of yarn (PC) and initial length of the yarn in the fabric before elongation.
The difference between the ASTM 16 and Kovar 8 methods is in different techniques to determine point C, which means different methods to determine the force to remove yarn crimp.
The main difference between the above-mentioned methods and our proposed method is the processing and comparison of stress–strain curves of two yarns: pull-out yarn and parent yarn.
We use the term pull-out yarn for yarn removed from a fabric (yarn which is crimped). The parent yarn is yarn from the cone that was used for fabric production.
Why is a new method needed? Yarn crimp in fabric has a major influence on material usage, so an important impact on fabric production. Existing methods are inaccurate, complicated or expensive for praxis. Our effort was to find a new, more precise method, but one that does not demand laboratory equipment and is not time-consuming.
Considering the importance and different issues related to the study of cloth geometry, the following objectives are framed for the present paper:
to propose a new method to measure the crimp in a woven fabric; to compare the results of the proposed method with other existing methods; to calculate fabric thickness, using measured crimp values.
Theory of the proposed method
In the present section, a new theoretical approach is described to measure the yarn crimp in fabric and the theory is based on the analysis of tensile characteristics of parent yarn and yarn taken-out from the fabric with crimp.
Consider the length of yarn Straightening of crimped yarn on tensile tester – general situation.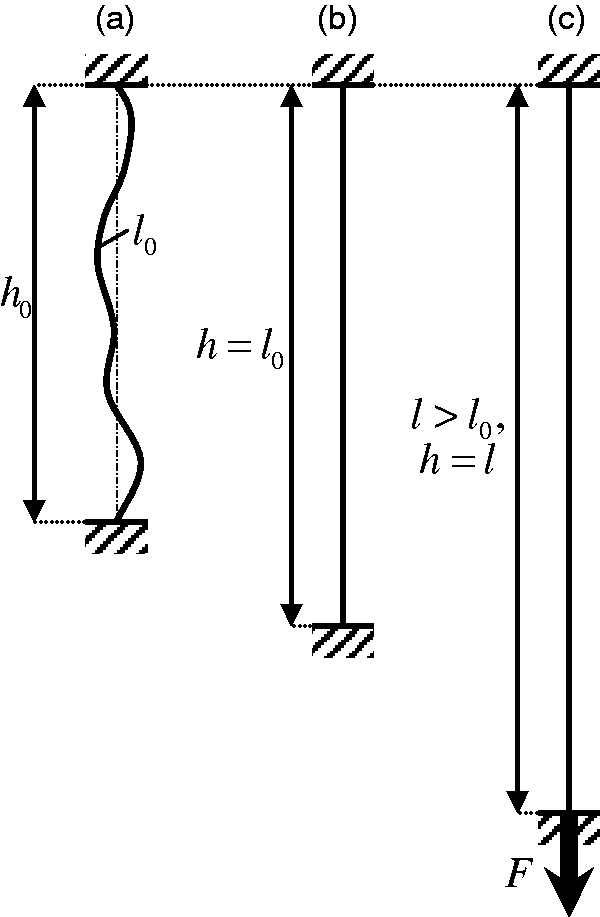
If


As per Figure 3(a), the following conditions are valid at the starting stage:


Because the jaw displacement

During yarn elongation (Figure 3(c)), the following conditions are now valid:

Now, it is valid that

According to Figure 3(b), it is assumed that the axial force

Nevertheless, it is more advantageous to use the so-called specific stresses (let us understand that specific stress, i.e. mechanical stress divided by fiber density, is equal to the ratio of force and yarn fineness) σ on the places of forces F. If the yarn fineness (yarn count) is T, then the specific stress is


This is the first function that is to be determined experimentally with the help of the standard tensile tester.
Because the experimental function

This inverse function can be recalculated from experimental values by using Equation (10). Using Equations (7) and (11), we obtained

Further, let us consider the following relationship:

Hence,

Equation (14) expresses the relation between applied specific stress σ and relative jaw displacement
As a special case for parent yarn, the relation
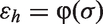
Nevertheless, inverse function
The tensile characteristic of the original parent yarn is shown in Figure 4 as curve 1. On the other hand, the dotted curve 2 illustrates the tensile characteristic of the relaxed yarn, which had a longer length Tensile yarn specific stress σ in relation to relative jaw displacement ɛ
h
: (1) parent yarn, Equation (15), 
In order to measure the yarn crimp in the fabric, a length Clamped yarn pulled-out from fabric – regularly crimped yarn.
Nevertheless, the tensile characteristic of such pulled-out yarn will not be fully identical to the dotted curve 2 of Figure 4 because of some axial forces F. This means that specific stresses σ are necessary for straightening of the pulled-out yarn in reality. Figure 6 illustrates all three curves, that is, curves 1 and 2 from Figure 4 and curve 3 related to the pulled-out yarn.
Tensile yarn specific stress σ in relation to relative jaw displacement ɛ
h
: (1) parent yarn, Equation (15), 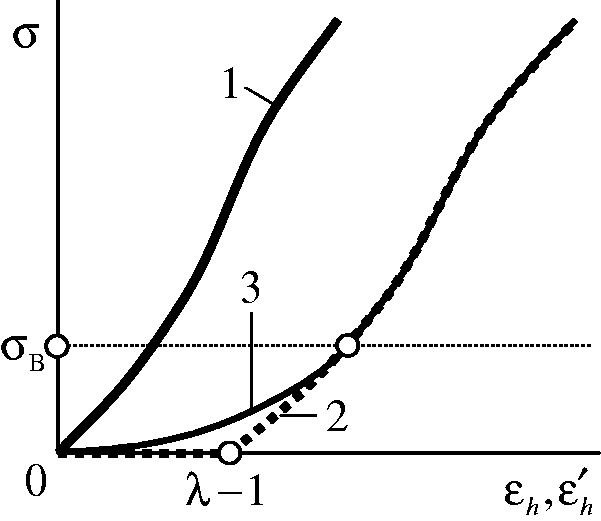
However, we assume that curve 3 will be identical with dotted curve 2, as obtained from Equation (14) after complete straightening of the yarn. This means that specific stresses
Let us consider that the relative movement of jaws is

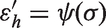
This inverse function is an “indirect experimental” function according to Equation (17) and is calculated from the experimentally determined Equation (16).
Let us consider that the part of curves 2 and 3 in Figure 6 are (practically) the same, when
specific stresses for the right value of λ in Equation (14).
Firstly, it is required to determine the suitable value of “border” specific stress
Secondly, it is required to determine the right value of λ. Let us imagine either we know or experimentally determined one increasing progression
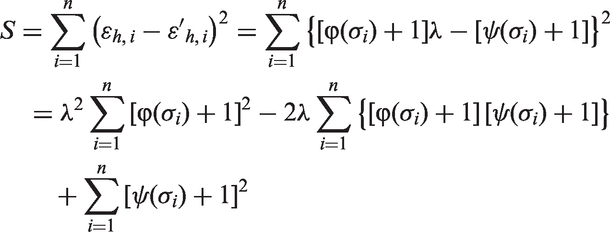
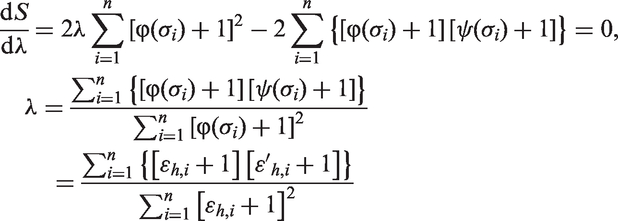
Finally, we calculate the crimp s of pulled-out yarn in the fabric and it is defined by the following equation using Equation (13):

Once we calculate the value of λ from Equation (19) then the calculation of yarn crimp becomes very simple by using Equation (20).
Peirce’s model of plain weave
In order to use Peirce’s model
6
for the present work, the authors have attempted to derive Peirce’s theory in their own ways for better understanding and use (equations are in the notation that is used at the Technical University of Liberec). Peirce’s model illustrates, among other things, the geometrical interpretation of crimp and crimp amplitude, assuming the cross-sections of the yarns are circular and consist of straight and curved segments, as shown in Figure 7. Due to the symmetry of the crossed segments at point I, it makes it possible to consider only the first half portion for the present analysis; details are illustrated in Figure 8. (According to the Czech convention, the subscripts “o” and “u” are used for warp and weft yarns, respectively, for all the symbols.)
Crossed segment of weft yarn according to Peirce’s model. Geometry of the half-segment of Peirce’s model.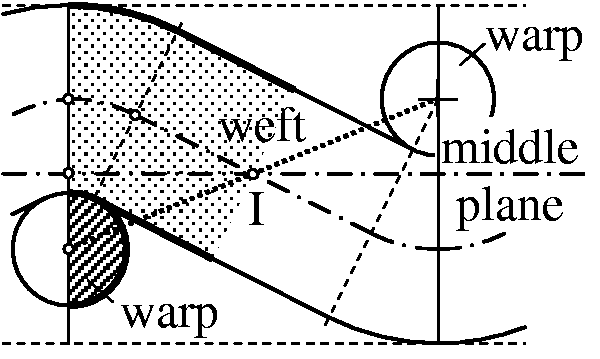
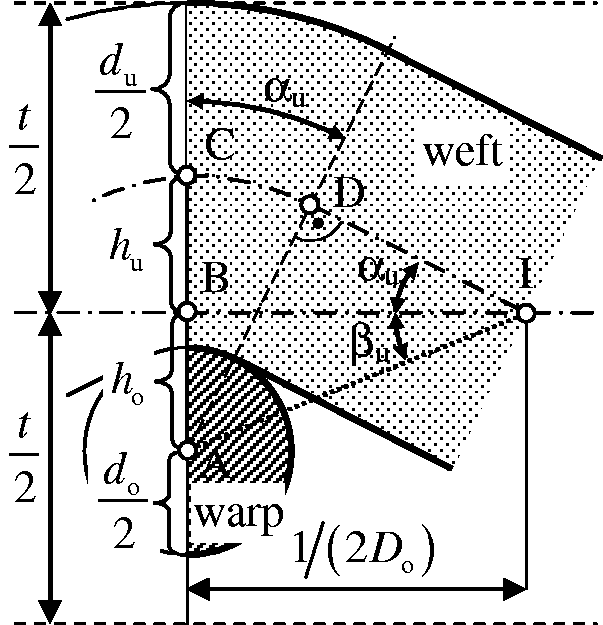
The following symbols are used for the present analysis:
t – thickness of fabric.
Accordingly, the relative wave heights are defined as given below:

The length CDI and BI from Figure 8 determine the weft yarn crimp
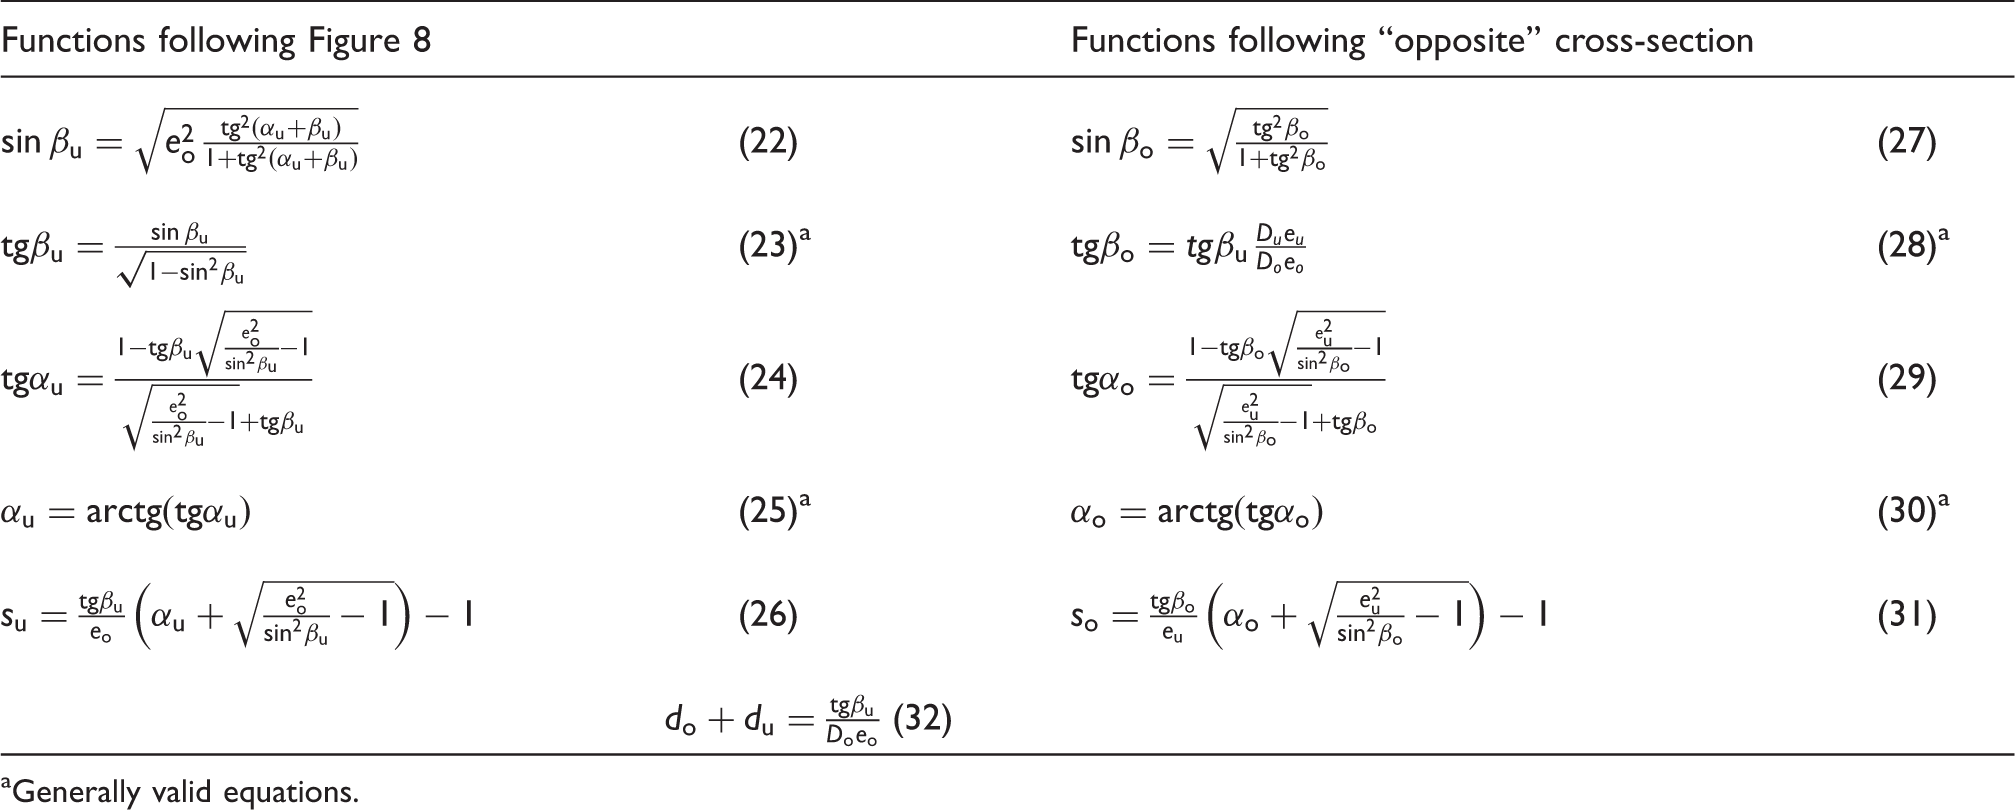
Generally valid equations.
Note: Each equation6,9 in Table 1 is also valid for both the subscripts “o” (warp) and “u” (weft). Nevertheless, we introduce only such expressions that will be needed for the following calculations.
The tightest arrangement of Pierce’s woven structure is expressed as a limit set and Figure 9 illustrates the Peirce’s warp limit set. Accordingly, the “opposite” cross-section can be expressed for the weft limit set. The equations6,9 for yarn crimp for warp and weft limit sets are given in Table 2.
Geometry of the warp limit set.

The maximum value of
It is noticed from Figure 9 that the value 
If, in an experimentally analyzed fabric, 
The values of
The relation 
The calculation of the algorithm is as follows.
Let us assume that we know (a) sets Choose Repeat K-times:
– Calculate – Choose – Repeat Q-times:
Calculate Solve Equations (22)–(26) step by step. If (Practically Calculate Solve Equations (27)–(31) step by step. If (Practically Solve Equation (32).
Except the effective yarn diameters, we can now calculate all geometrical parameters of Peirce’s model using the above explained algorithm. We have also calculated the sum 
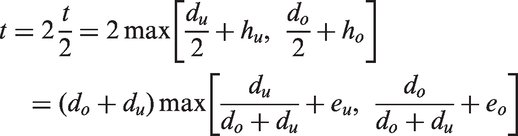
Now, using Figure 8 and Equation (21), the thickness of the fabric can also be calculated by the following equation:
Materials and method
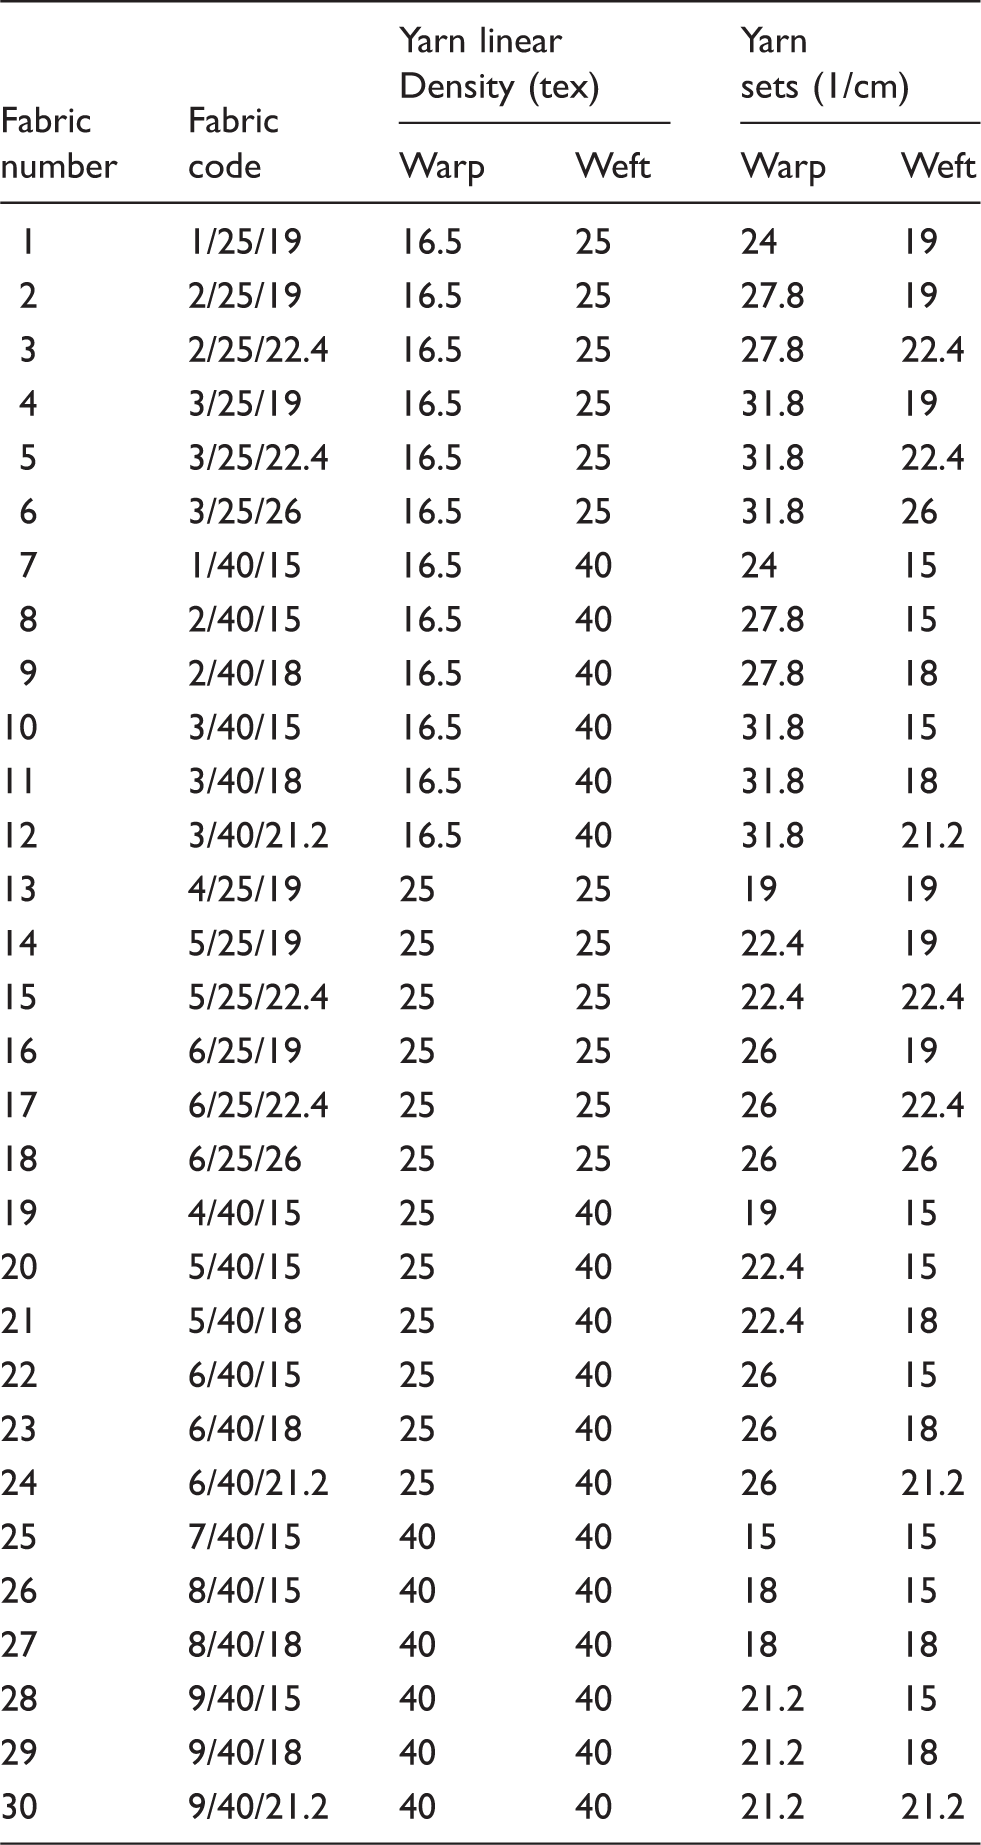
Yarn and fabric parameters
Measurement of yarn crimp
Two points at a distance of 500 mm along the length of yarns of the considered woven fabric are marked for both warp and weft directions. For the present study 50 yarn specimens each from the warp and weft directions are pulled out from the fabric. Pulled-out yarns consist of undulations or waves introduced during the weaving process. While pulling out the yarn from the fabric, utmost precautions were taken that yarn should not get strained and untwisted. Subsequently, the yarn was clamped on the Instron tensile-strength tester with a gauge length of 500 mm, assuring that the marked points on the yarn exactly match with the nip point of the jaws. Now, yarn is allowed to break and the average specific stress–strain curves of 50 yarns are plotted with the help of the software. For comparison, the average specific stress–strain characteristics of the original parent yarn are also evaluated from an experimental set of 50 individual curves.
We compared the curves of parent yarn and pulled-out yarn at an interval of specific stress values One example of specific stress–strain average curves of yarns (fineness 40 tex, fabric 9/40/18 in Table 3). One example of inverse functions of specific stress–strain average curves (fineness 40 tex, fabric 9/40/18 in Table 3).
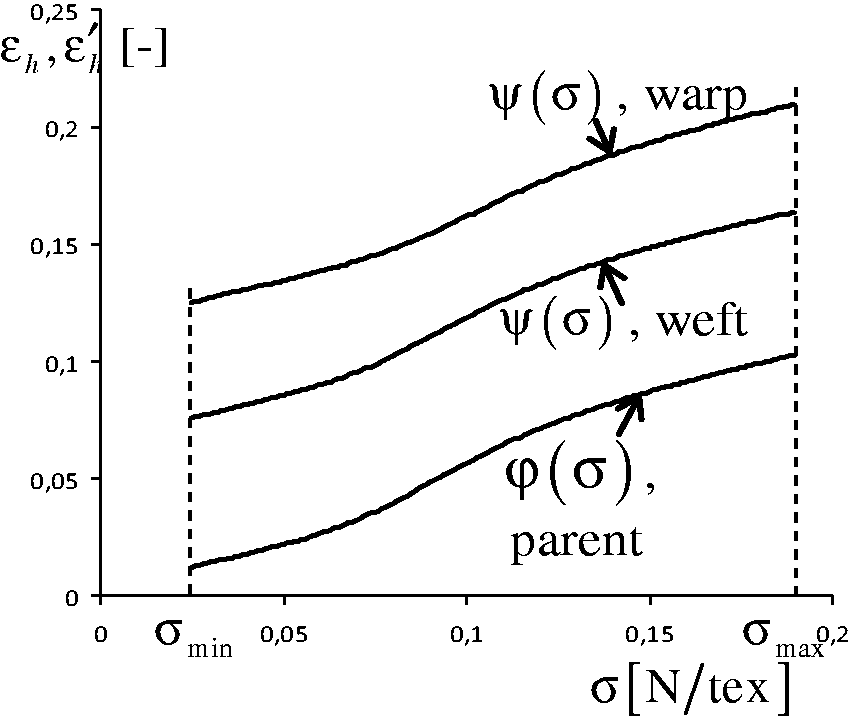
The right λ-value describes the comparison of parent and pulled-out curves in a suitable range of specific stresses Evaluated yarn crimp in relation to the introduced value σB (fineness 40 tex, fabric 9/40/18 in Table 3). Evaluated yarn crimp in relation to the introduced value σB (fineness 25 tex, fabric 4/25/19 in Table 3).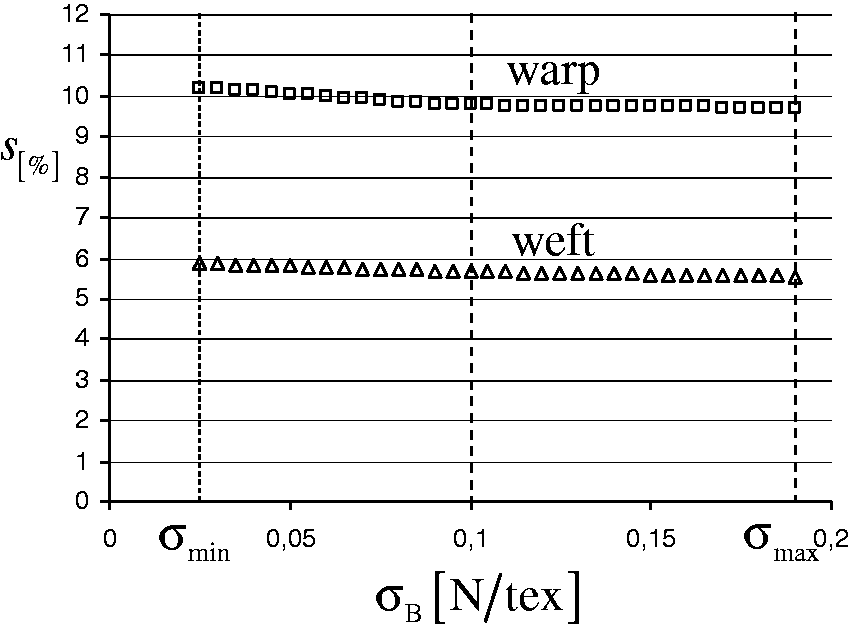

In all cases, we obtained very flat curves with slightly decreasing trend. This decreasing trend was a little explicit to values
Other methods of yarn crimp measurement
Experiments are also carried out to measure the yarn crimp using two other different methods. The measurement procedures of the different methods are given below.
For first method, soft cutting and the image analysis method
10
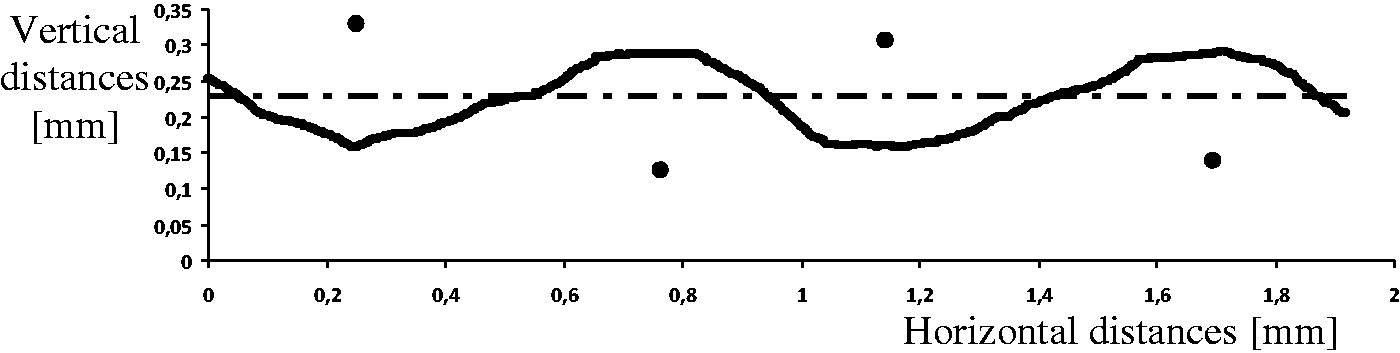
were used to prepare and process the cross-sections of the considered fabrics. The image analysis system was used for processing the individual images and Excel programming was used for data evaluation. Evaluation methodology of fabric geometry11,12 was used in the present work. It is now possible to define the basic geometry of yarn interlacement in the transverse and longitudinal cross-section from the obtained data and individual coordinates. Accordingly, warp and weft yarn spacing, fabric thickness, phases of interlacing (degrees of waviness of warp and weft yarns) and yarn crimp in both the directions are determined. Twenty cross-sections in each direction (warp and weft) were prepared and evaluated for each experimental fabric. The typical cross-sections of the fabric are given in Figure 14. Subsequently, Figure 15 illustrates the evaluated (software of Kolčavová and Vyšanská
12
was used) yarn axis trajectory.
Transversal and longitudinal cross-section images – example. Evaluated cross-section – example. •: centers of gravity.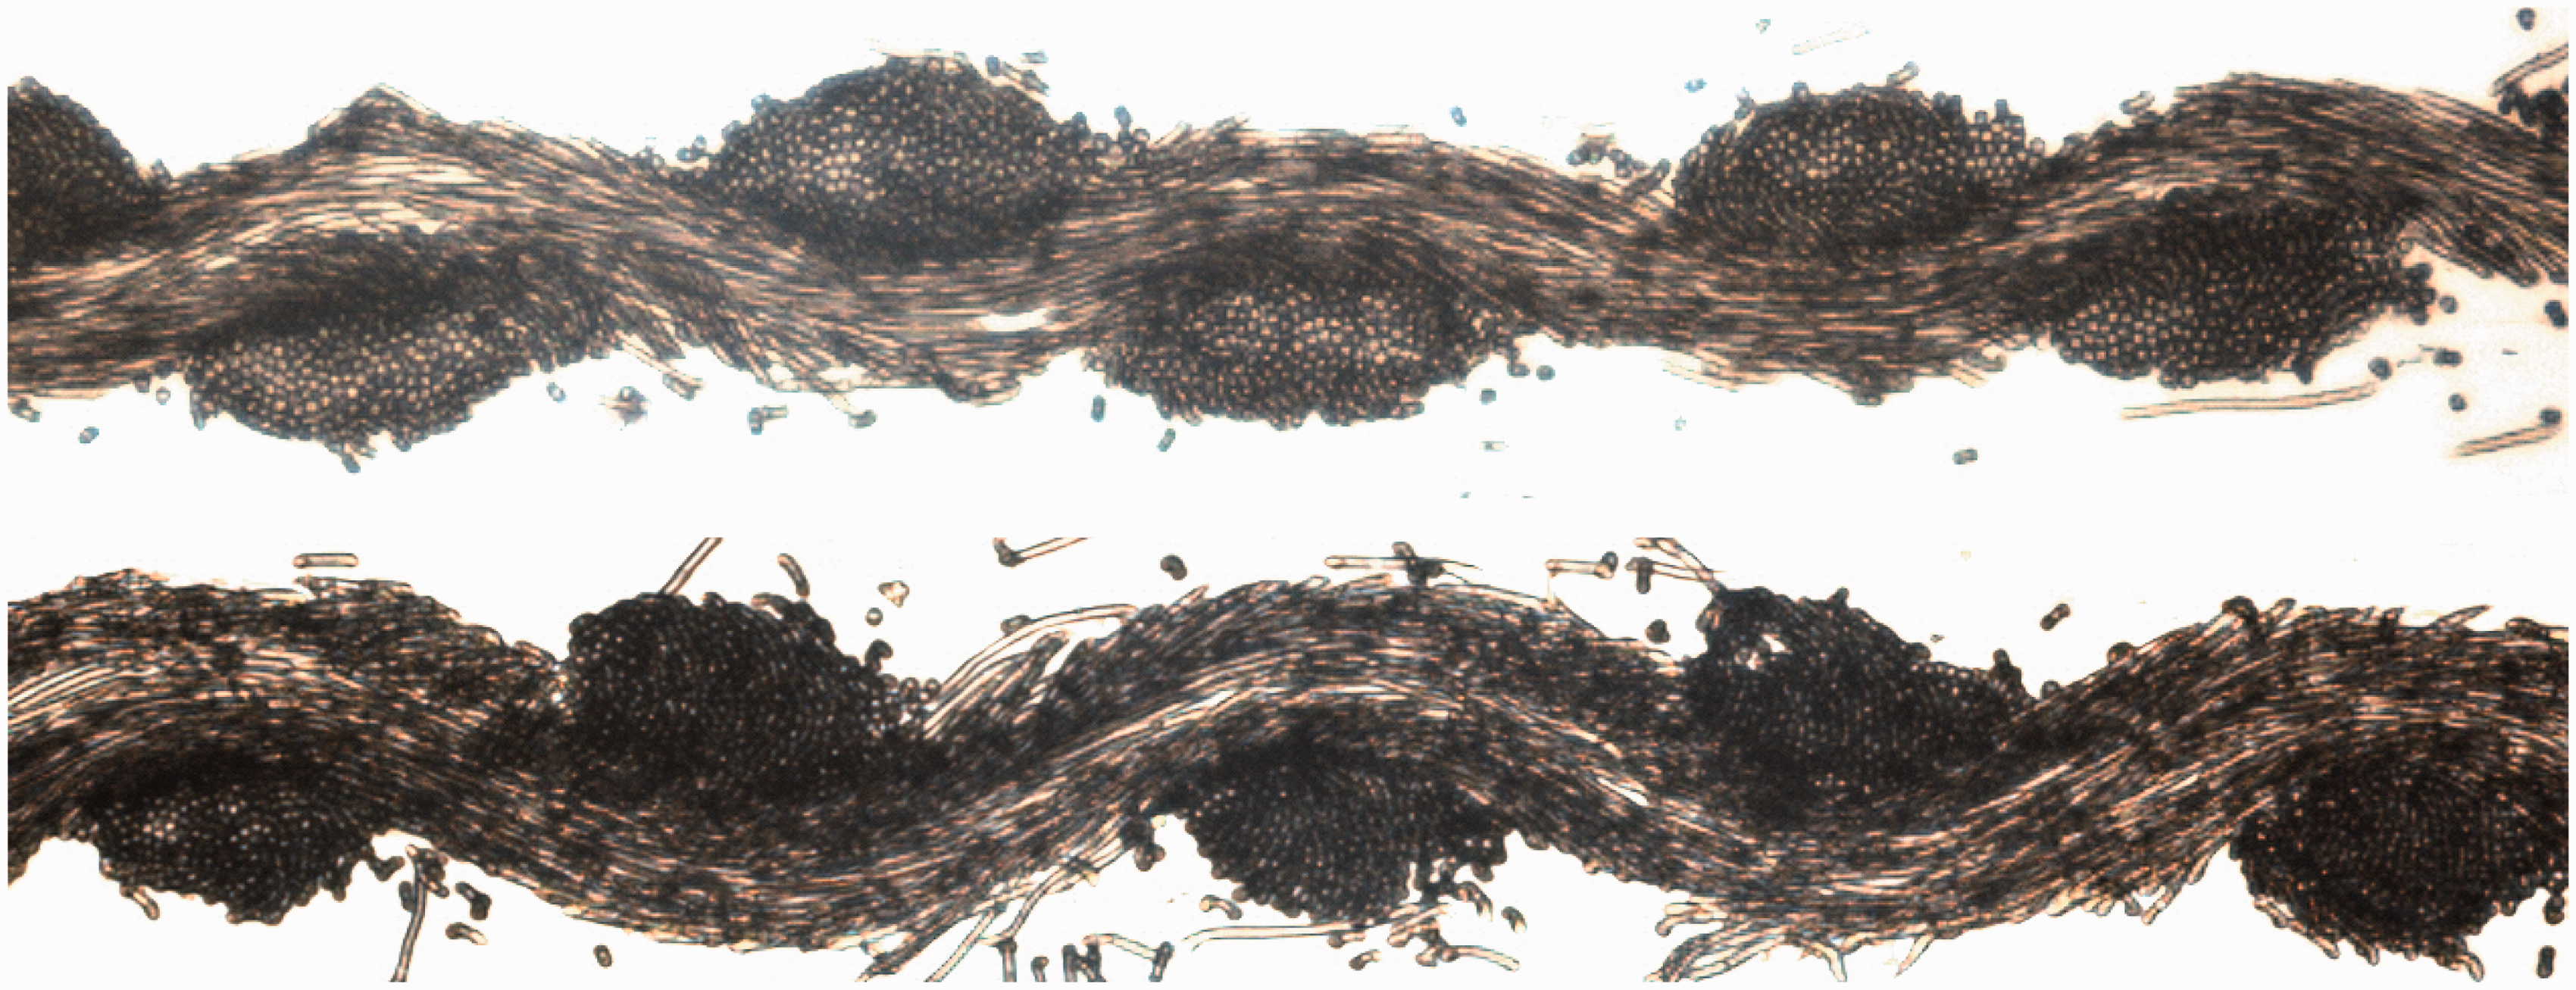
The second method is the old “raveling” or “thumb-method”. In this method, the yarn specimen from fabric part length
Experimental results of all methods

Confidence interval (at the confidence level of 0.05%).
The approaches to measure the length of fabric and corresponding yarn length inside the fabric of all methods are similar. The merits and demerits of three considered methods are given below.
The length of the considered sample. The proposed “Instron” method considers fabric measuring 500 mm, which provides yarn lengths slightly more than 500 mm. Consideration of such long lengths results in better “averaging” of yarn crimp value. On the other hand, the “raveling (thumb) method” uses usually 100 mm of fabric lengths only. Further, evaluation of yarn length using image analysis worked with fabric sections of 3 mm length only, which accented the local variability of yarn crimp. Determination of the yarn length in fabric. Theoretically, the measurement of yarn length according to image analysis is most precise because the proposed method measures the yarn length in the original state of woven fabrics. Nevertheless, due to significant problems with interpretation of image of fabrics (borders of yarns, etc.), the software provides a little saw-toothed line. Therefore, the system gives a slightly longer length of yarn than the actual value. Our proposed “Instron” method and “raveling (thumb) method” work with the assumption that the pulled-out yarn can be straightened in such a manner that the structure of the considered yarn length is unaffected and corresponds to the parent yarn. The “raveling (thumb) method” determines the “right” straightening of yarn by means of pressure on the thumb but here subjective influence is very significant. However, in the proposed “Instron” method yarn straightening is much more objective; nevertheless, it has also one empirical element, that is, determination of specific stress Demands of the laboratory technique. The measurement of yarn length inside the fabric using image analysis has special requirements, such as a microscope, microtome, special software (image analysis, for example NIS-Elements AR 2.30), etc., that are usually found in research centers. The proposed “Instron” method needs a tensile-strength tester (Instron or another) with output of stress–strain curves and such instruments are easily available in industrial laboratories. The “raveling (thumb) method” needs only a flat table and a ruler. Its advantage is only in its flexibility.
Comparison of results – crimp measurement
The graphical comparisons of crimp measured from different methods are given in Figures 16 and 17. Table 5 illustrates the observed correlation coefficients between experimental methods. Correlation coefficients are statistically significant.
Comparison of yarn crimp – Instron and image analysis method. □: warp crimp; Δ: weft crimp, — diagonal. Comparison of yarn crimp – Instron and raveling method. □: warp crimp; Δ: weft crimp, — diagonal. Correlation coefficients of yarn crimp
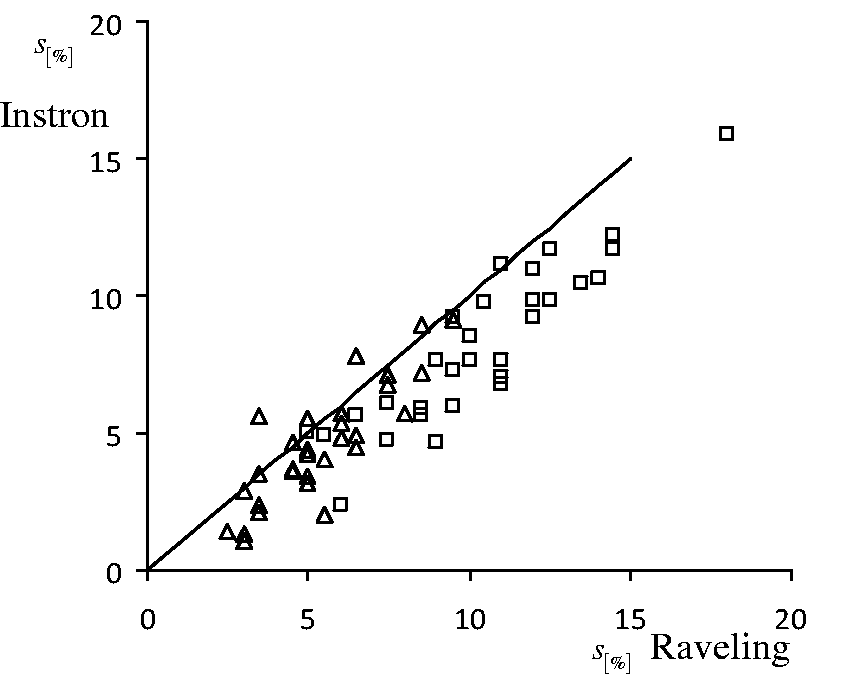
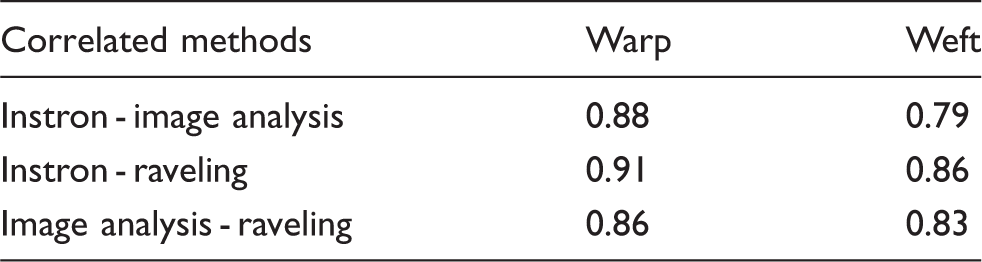
It is evident from our results that, in general, trends of all the considered methods are identical but the crimp values measured from the Instron (proposed) method are systematically slightly lower in comparison to the other two methods.
The image analysis method gives probably an overestimated length value of measured crimped yarn (Figure 16), because the experimentally determined central line of the binding wave is not fully smoothed and is clearly visible from Figure 15 also.
The raveling method is likely to measure the crimped yarn length accurately after straightening with the help of thumbs, because it raises the question of whether yarn is “fully straightened” or “longitudinally elongated” during yarn straightening. This is mainly due to the application of uneven force of the thumbs. If we use a little more forceful straightening then the measured crimp is higher, as shown in Figure 17.
Comparison of results – thickness of fabric
The results of measured and predicted fabric thickness are given in Figure 18. The fabric thickness is calculated on the basis of measured crimp values obtained from Equation (33) of the proposed method by using the input data of yarn diameters of parent yarns, warp and weft sets. Fabric thickness was experimentally measured by using two different methods, firstly on a thickness meter (standard ČSN EN ISO 5084) at 1 kPa pressure and secondly by image analysis of fabric cross-sections as proposed by Kolčavová and Vyšanská.
12
It is evident from Figure 18 that the results of both the experimental methods have statistically significant coefficients of determination (thickness meter 0.70, image processing 0.76) with fabric thickness calculated from Equation (33).
Comparison of measured and calculated fabric thickness. □: image analysis; Δ: thickness meter, — : diagonal.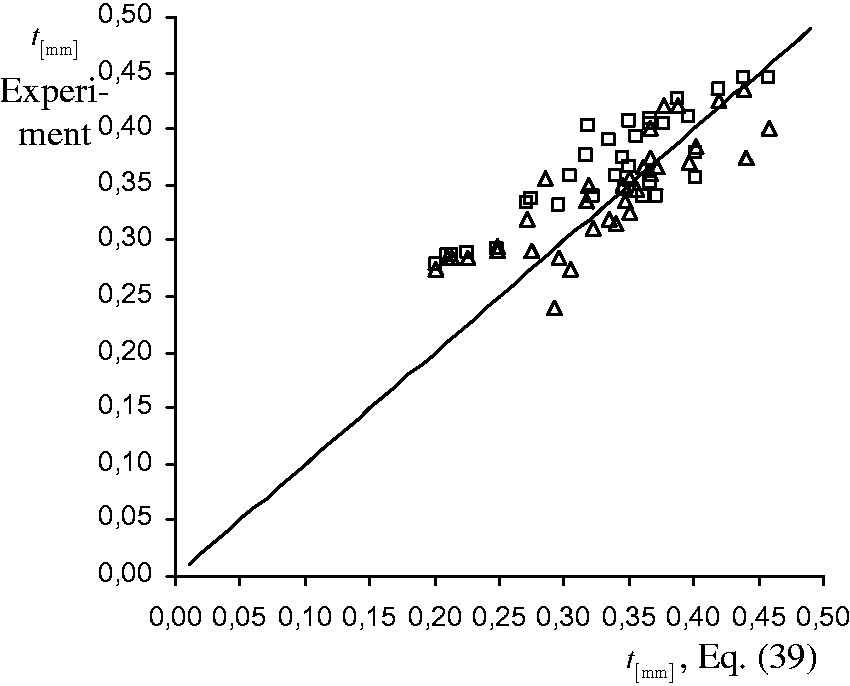
It is further noticed that the results of fabric thickness measured on the thickness meter as well as by the image analysis approach show slightly higher values for thinner fabrics and slightly smaller values for coarser fabrics in comparison to our calculated values. The used experimental methods are probably also influenced by the following factors. Firstly, the density of binding points is higher for finer fabrics of similar covering. Secondly, due to yarn hardness, the finer yarns give a slightly higher value of packing density than coarse yarns. Thirdly, due to yarn hairiness, the characteristics of fiber hairs on the yarn surface are different for fine and coarse yarns. On the other hand, the calculation of fabric thickness is not directly influenced by these phenomena.
Conclusion
The measurement of yarn crimp in fabric and fabric thickness on the two considered methods and proposed methods is somewhat influenced by inherent problems of measurement techniques and yarn characteristics. Therefore, it was difficult to arrive at “fully right” values of yarn crimp in fabric and fabric thickness for comparison and testing of different methods used.
Nevertheless, with the proposed new method it is relatively easy and more accurate to measure and reproduce the warp and weft crimp, as well as the thickness of the fabric. The proposed method has great potential for adaptation in industrial laboratories.
Footnotes
Declaration of conflicting interests
The authors declared no potential conflicts of interest with respect to the research, authorship, and/or publication of this article.
Funding
The authors received no financial support for the research, authorship and/or publication of this article.