
Abstract
A hygiene mask covers the wearer’s nose and mouth to prevent exposure to viruses, pollen, dust, and so on. To produce the anticipated effect of wearing a mask, it is important to develop a mask with high fitting performance while closing and opening the mouth. Moreover, masks are to be used by individuals as well as many users. Therefore, flat patterns for a mask that fits a wider variety of face shapes are needed to effectively accommodate more people. As a first step, in this paper the mean flat pattern for a mask that is appropriate for a greater variety of face shapes with a closed mouth was developed. A three-dimensional (3D) motion analyzer was used with consideration of further research of facial motion. Four kinds of flat patterns of masks of different sizes for the closed mouth were analyzed and proposed. First, confirmation tests of 3D motion analysis were conducted using a basic model. Second, using the data of the basic model and a head mannequin, a geometrical analysis method for two-dimensional (2D) patterns from 3D coordinates using triangular combination was proposed. For evaluation of the analyzed pattern, draping patterns for the basic model were acquired by draping the head mannequin with nonwoven sheets, and the match between the analyzed pattern and the draping patterns was assessed. Moreover, 2D mean patterns derived from the 3D coordinates of 62 subjects were proposed. It was confirmed that the distance difference over the circumference was 0.99 mm with a standard deviation of 5.0 mm.
In many parts of the world, hygiene masks are worn for protection from particles at the workplace, 1 pollen in farms, 2 and droplet infection in hospitals.3,4 In Japan, industrial workers, farmers, and healthcare professionals, as well as men and women of all ages, use them daily. The reasons for wearing a mask vary but typically involve the prevention of influenza and common cold, 5 protection from pollen,6,7 etiquette, to minimize oral and skin dryness, and hide the faces of women who do not wear makeup. 8 In any case, hygiene masks should be comfortable and highly functional to improve the quality of life. 9
There have been many studies focusing on the benefits of wearing a hygiene mask for medical and industrial purposes,10–13 but fewer focusing on textile engineering, 14 human ergonomics, 15 or comfort. In each research, the main tests conducted for filter evaluation of the sheet were bacteria filtration efficiency (BFE) and particle filtration efficiency (PFE).16,17 In addition, measurements of the leakage rate and respiratory fit testing of worn masks were employed.18,19 However, to date, little research and standards regarding mask design from the perspective of shape and size have been reported. 20
The typical hygiene mask consists of a sheet that covers the mouth and nose, and an ear string that holds the mask in place. The majority of the sheets consist of three or four layers of nonwoven cloths.21–23 Each sheet offers trapping and filtering. The shape of the nonwoven mask sheet is square with more than two long horizontal pleats. Other types of masks include the plane type gauze mask and the molded nonwoven mask. In the case of the gauze mask, there is a gap at the nose-wing in the static condition. 24 This air gap negates the use of a mask because pollen, dust, particulate matter, and viruses can enter the mouth and nose through the air gap. Therefore, better fitting is important.25,26
In the present paper, four patterns with different sizes for 62 nonmoving subjects were analyzed by a three-dimensional (3D) analyzer.27–29 Each pattern is intended for specific use. The smallest pattern strictly covers the nose and the mouth. The second and third largest patterns, which have a smaller gap between the mask and facial surface, are designed for protection from pollen, the influenza virus, and the common cold. The largest pattern, which covers a broader facial area, is designed to prevent throat and skin dryness. Nonetheless, the selection of sizes depends on individual preferences in addition to the intended use.
First, the 3D analysis tests were confirmed. Second, the 3D coordinates of the basic model were established, and the geometric analysis of two-dimensional (2D) patterns composed of triangles from 3D coordinates was proposed. Also, evaluation methods with draping were proposed. Third, the 3D coordinates of a mannequin with closed mouth were measured, and four patterns with four different sizes were acquired by using the proposed analysis method. Then, matching between analyzed patterns and draping patterns was conducted. Fourth, 3D coordinates for 62 young men with closed mouth were analyzed, and four mean patterns were obtained. Fitting confirmation of analyzed mean patterns was conducted with draping pattern. Additionally, the differences between mean pattern and each subject were calculated.
The long-term goal of this study is to develop flat patterns for masks that coincide with both the closed and open mouth positions. The part of the study discussed in this paper deals with fitting a wide variety of face shapes with a closed mouth. The proposed pattern was placed on the face surface without an angular difference. The results of the research provide basic information for the design of a mask with good fitting.
Test method
3D analysis
A 3D motion analyzer (DITECT Co., DIPPMotion Pro) was used to observe the facial shape of the subjects. The instrument was used for the open mouth in further research. The 3D coordinates of the calibration box, grid board, ball, basic model, manufactured 3D mannequin head, and the facial shapes of 62 subjects were examined and discussed. The 3D coordinates (x, y, z) consisted of a 3D rectangular coordinate system. Three infrared cameras were placed at a distance of 400 mm from the front, left, and right sides of the observation targets. The recording rate of each camera was 60 frames/s. Each test was calibrated using a calibration box with a reflective marker (ϕ = 6 mm), which was nearly in the same spot on each target. The experiments were conducted at 25℃ and 60% R.H.
Confirmation test
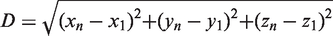
The effect of the calibration ball size, the reflective marker placement, and the declination in the measurement area were examined using a cuboid box, a flat plate, and a ball, as shown in Figure 1. The calibration tests for measuring the 3D coordinates were automatically carried out using a hexahedral crate (Figure 1(a)) with eight, commercially available, berrylike reflective markers (ϕ = 6 mm). Manual measurements of the 3D coordinates were performed using the cuboid box for the calibration markers of two different sizes: commercially available markers (ϕ = 6 mm) and manufactured markers (ϕ = 3 mm). From the observed 3D coordinates (x, y, z), the distance D between #1 and each point, n = 2–7, was calculated with the following equation:
Calibration box (cuboid box) (a), grid board (b), and berrylike reflective markers (c).
Additionally, actual distances were measured with a caliper (Niigata Seiki, D300W). Targets were manufactured having eight reflective markers.
To examine the limitations owing to the placement of the reflective markers, seven markers (ϕ = 3 mm) were closely placed on the grid board and their 3D coordinates were measured using the 3D analyzer and a caliper.
To observe the declination in the measurement area, each 3D coordinate at the horizontal and vertical direction was measured using the grid board. The reading ranges on the board were 240 mm in the vertical direction and 320 mm in the horizontal direction. The markers were put on the grid board on a cross shape, as shown in Figure 1(b), at an interval of 10 mm. The vertical direction in the measurements represents approximately the total head height of the subjects. In addition, each 3D coordinate of the reflective markers lies on a circle (ϕ = 80 mm) about half the distance from the tip of the nose to the lower lip. On the board, 12 markers were placed on a circle (ϕ = 240 mm) at an interval of θ = 0.52 rad in the rotation direction of an arrow.
The markers at an interval of 10 mm on a cross shape were positioned on the ball (ϕ = 250 mm) shown in Figure 1(c). The reading ranges on the ball surface were within the horizontal and vertical directions at 240 mm or 1.92 rad. On the ball surface, 12 markers were positioned in a circle (ϕ = 44.2 mm) at an interval of θ = 0.52 rad in the rotation direction of an arrow. In each test, the distances between the original point #C and each circularly arranged point were measured with the caliper.
3D coordinates of the basic model
The complex facial shape is modeled as a ball (ϕ = 250 mm), which is considered the basic model (Figure 1(c)). The ball has the approximate height of a human head. From the observed 3D coordinates and the measured distances with a caliper, the patterns on the ball were analyzed on the basis of the geometrical method of triangular combinations.30,31
From the 3D coordinates of the basic model, the 2D pattern was analyzed according to the following procedure. First, the lengths between the origin point #C and each point in the ring, and the distances between adjacent points were calculated with equation (1). Second, the internal angle θ between adjacent points was calculated according to the second cosine law. Third, from the calculated internal angle θ and the length between the origin point #C and each point, the 2D coordinates (Xi, Yi) were calculated according to the cosine function and sine function, respectively. Fourth, each pair of coordinates (Xi′, Yi′) was rotationally transformed with the value of θ’ integrated from the bottom point #7. The coordinates in the left side at the first quadrant (X′ > 0, Y′ > 0) and fourth quadrant (X′ > 0, Y′ < 0) were calculated using θl′ and equation (2). The coordinates in the right side at the second quadrant (X′ < 0, Y′ > 0) and third quadrant (X′ < 0, Y′ < 0) were calculated with θr′ and equation (3).

Evaluation of the analyzed pattern on the basic model
For evaluation of the reliability of the analyzed pattern, draping patterns were made of nonwoven rayon sheet for medical use (Taketora, Torakurosu 30301). The marker points were marked with a pen from the bottom to the top in the right and left sides of the draping pattern. After marking, the sheet was removed from the ball, put on graph paper, and the individual points were pinpricked on the graph paper. The 2D coordinates of the pin holes were read with the caliper. This was repeated three times for each pattern.
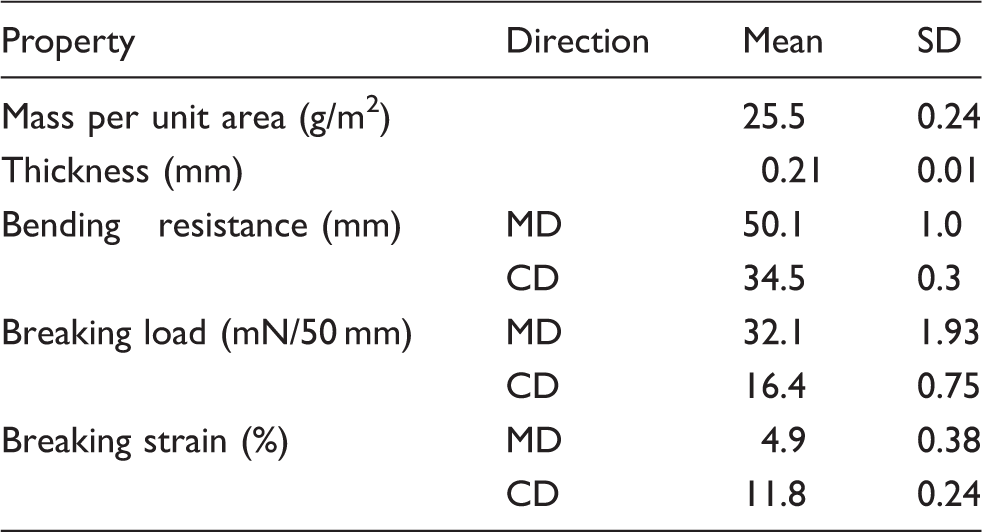
The general properties of the sheet were measured according to Japanese Industrial Standards. The mass per unit area was measured according to JIS L 1913:2010. The thickness was measured with a thickness gauge (Mitutoyo, FS-60DS) according to the A-method of JIS L 1913:2010. Bending resistance was measured with the 45° cantilever method (JIS L 1096:2010). Finally, tensile properties were measured using a tensile tester (Toyo Baldwi, Tensilon/UTM-20) and the JIS L 1913:2010 standard test method. Experimental conditions were 20℃ and 65% R.H.
3D coordinates on the mannequin head
The head of a subject, with physical properties falling within standard variations of reference data (Anthropometric Database of Japanese Head 2001, H16PRO-212 collected by the National Institute of Advanced Industrial Science and Technology), 32 was scanned using a 3D scanner (OPT, Artec 3D Eva). 33 The subject was a healthy young man who maintained a closed mouth throughout the scanning process. Using the 12,000 polygons acquired from the scan, a mannequin head was built using a 3D printer (Stratasys, uPrint SE Plus). The 3D coordinates of the human head replica were measured using the 3D motion analyzer, as in the test on the subject.
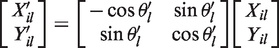
In this experiment, four rings on the face were considered. The first ring denotes the minimum required area to cover the subject’s nose and mouth. For that purpose, 18 markers were used. Subsequently, three concentric rings were placed around the mouth and nose at almost equal distances of 10 mm. Figure 2 shows the marker positions.
34
Facial marker positions.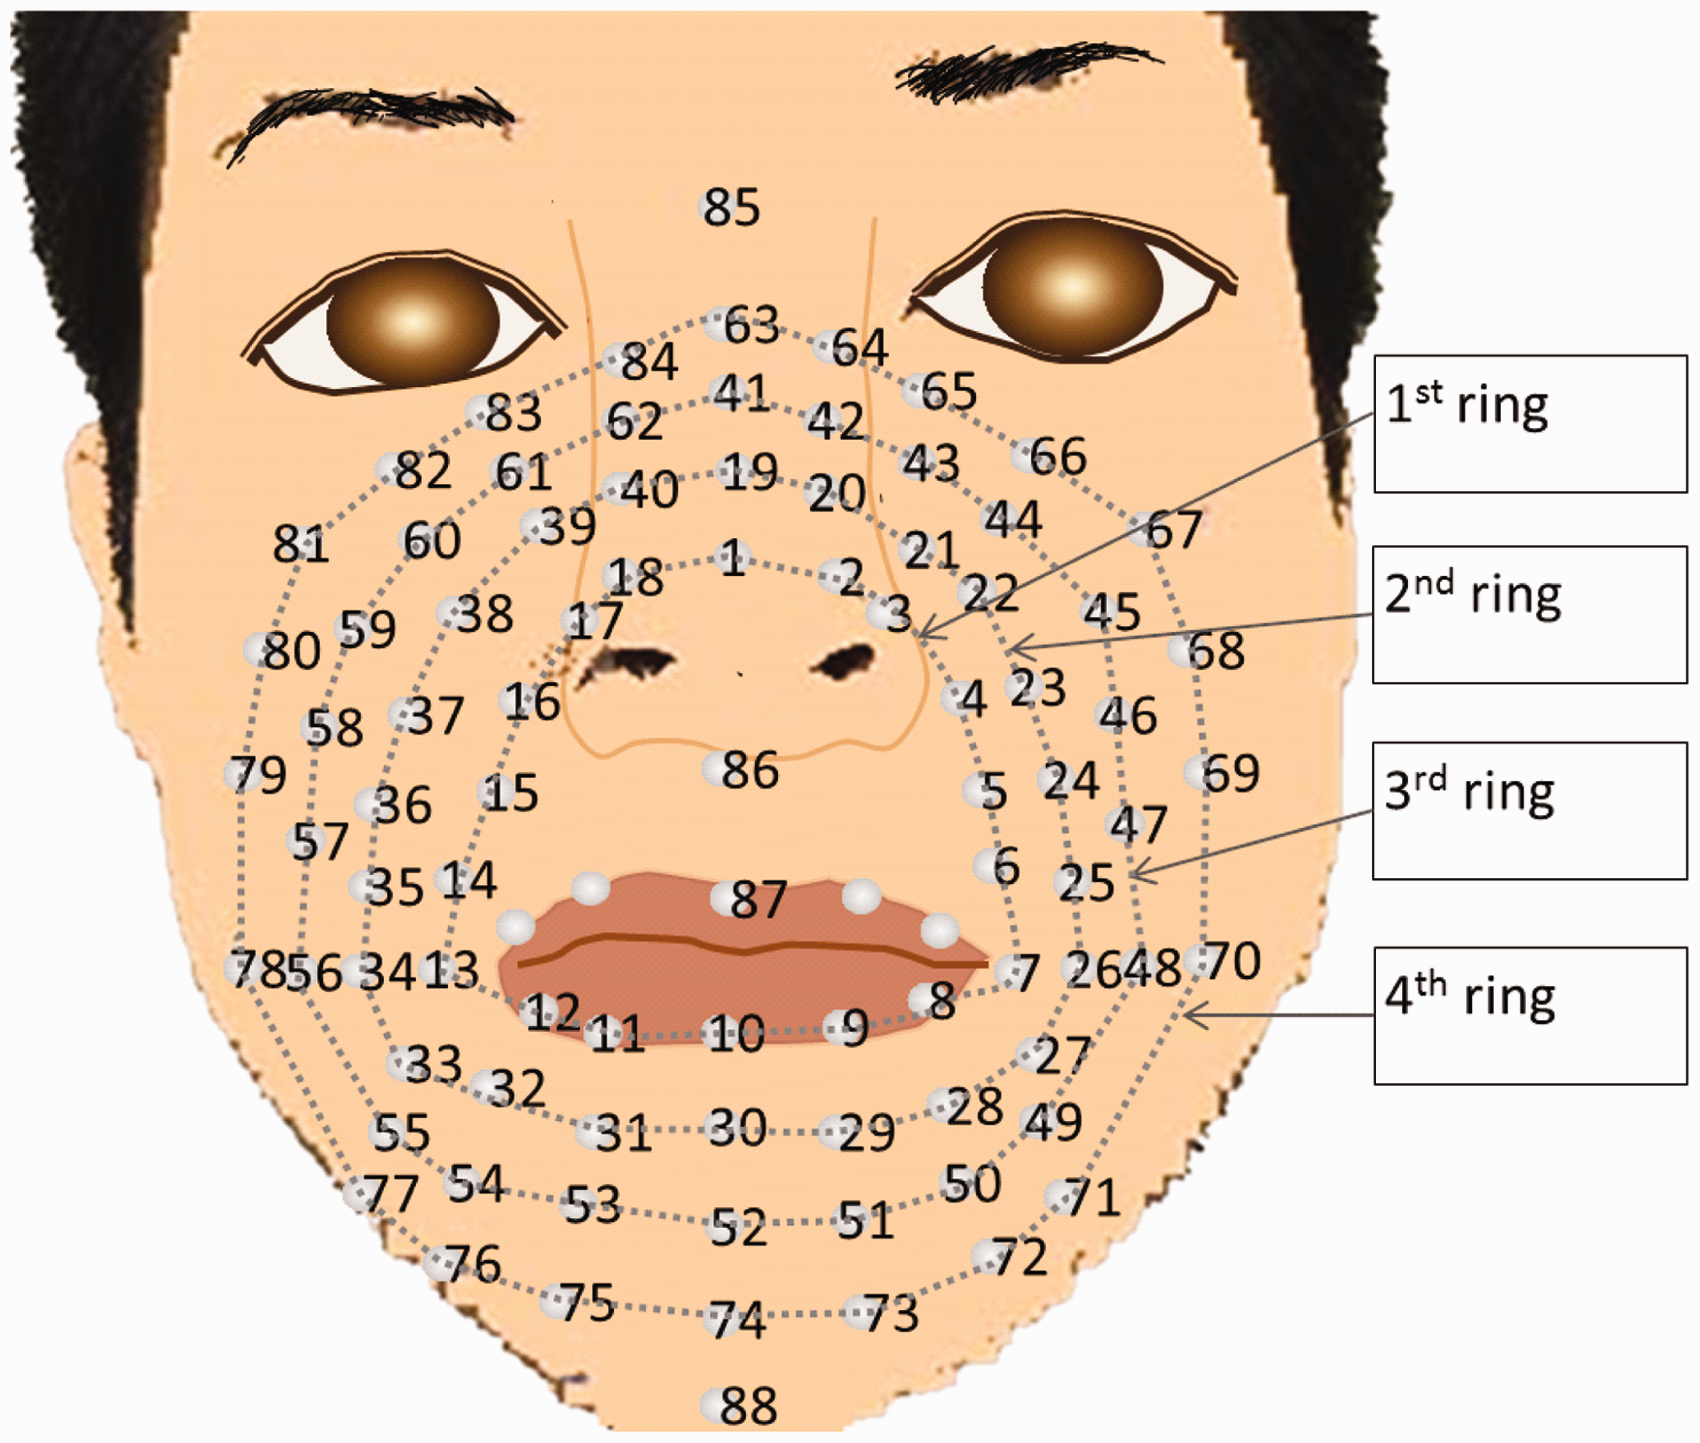
The markers were placed according to the following procedure. First, the tip of the nose was benchmark #1, the positions besides the nostril were marked #4 and #16, points #7 and #13 were beside the mouth corner, and point #10 was for the mid-lower lip. To take into account the mouth movement, two markers #7 and #13 were placed 6 mm from the edges of the mouth corners. This did not prevent mouth movement or covered the whole mouth. Second, the points between the abovementioned positions, #1–4, #4–7, #7–10, #10–13, #13–16, and #16–1, were placed at equal intervals for consideration of the expansion and contraction of facial muscles while opening the mouth. Additionally, to measure the facial characteristics, three markers were placed on the glabella #85, subnasal #86, and mentum #88. These ϕ = 3 mm manufactured markers were made of a refractive sheet and plastic half-balls. The three markers were placed on the subject’s face by double-stick tape for fixing electrodes (Nihon Kohden, adhesion color 8). From the observed 3D coordinates, the mask patterns of the four different sizes were analyzed.
Head characterizations of the mannequin model and subjects

Repaired data by distance (2.9 mm) from outermost nose wing to position of landmark point.
Repaired data by distance (5.9 mm) from mouth corner to position of landmark point.
Evaluation of the 3D mannequin analysis
To evaluate eight patterns of four different sizes for the left and right sides of the face were made by draping on the manufactured 3D mannequin. The marker points were at the same positions as for the mannequin. The sheet in this case was the same as the ones in the basic model. In the draping pattern, the sheet along the lines of the marker points in each ring was cut and fixed using scotch tape and marked with a pen. Subsequently, the 2D coordinates were read with the caliper. This was repeated three times for each pattern.
Measurement of 3D coordinates for male subjects
To design mask sheets that would fit most people, the 3D coordinates of the facial shape of 62 healthy male subjects, 22.1 years old (SD = 1.2), were measured with the 3D analyzer. 35 The measurement methods of the 3D coordinates and head characteristics were the same as in the experiments of the mannequin head. The physical properties of subject are listed in Table 1. Calibration tests were performed with the calibration box after recording the facial shape of each subject. The study protocol was approved by the ethics committee of Shinshu University (Permitted IRB no.104).
Results and discussions
Confirmation test results
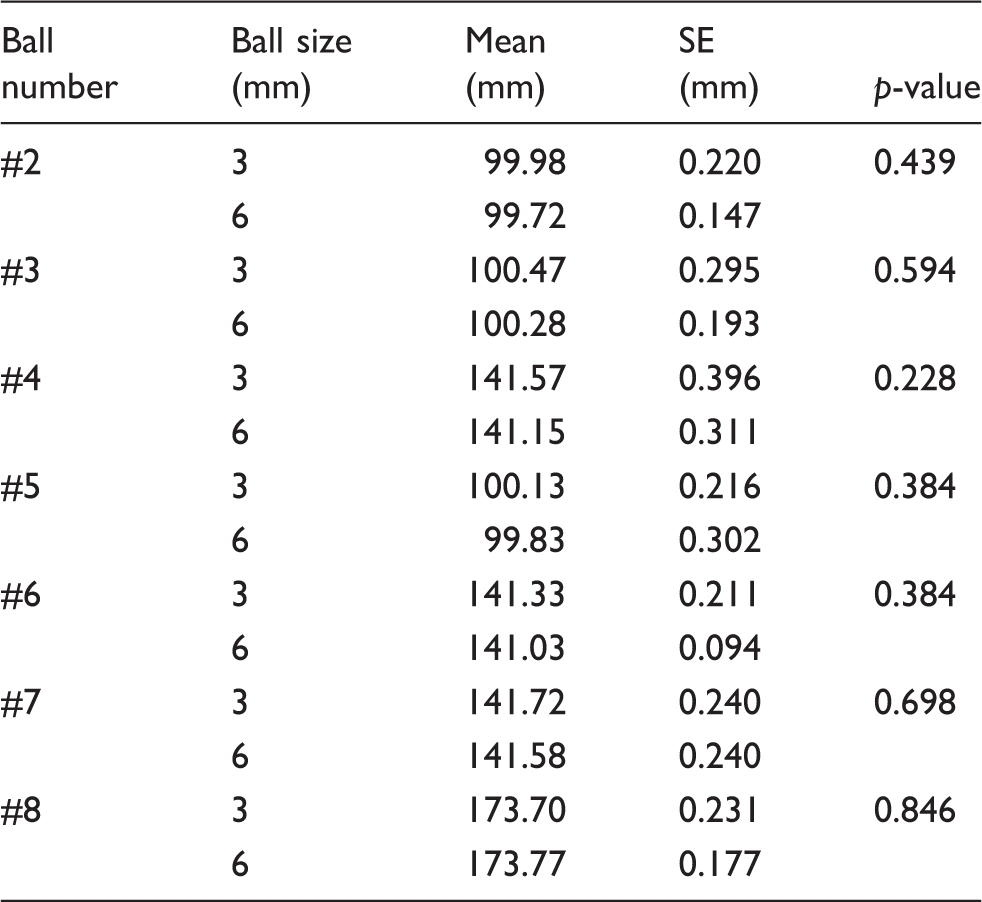
Influence of the calibration ball size
Result of statistical test for different ball size of calibration in ANOVA
Location of the landmark points
The average distance between adjacent markers was 3.60 mm (S.D. 0.22) with the 3D analyzer and 3.61 mm (S.D. 0.23) with the caliper. Thus, the minimum distance between adjacent markers could be 3.60 mm.
Limits of measurement accuracy
To examine the limits of the experimental error, the distance D between point #C and each point was calculated with equation (1). Figure 3 shows the calculated distances with the 3D analyzer and the measured distance with the caliper. In these tests, the difference between the measured and calculated distances did not depend on the location of the markers. Statistically, there were no significant differences (p = 1.000, chi-squared test).
Distances calculated by the 3D analyzer and measurement distance by the caliper.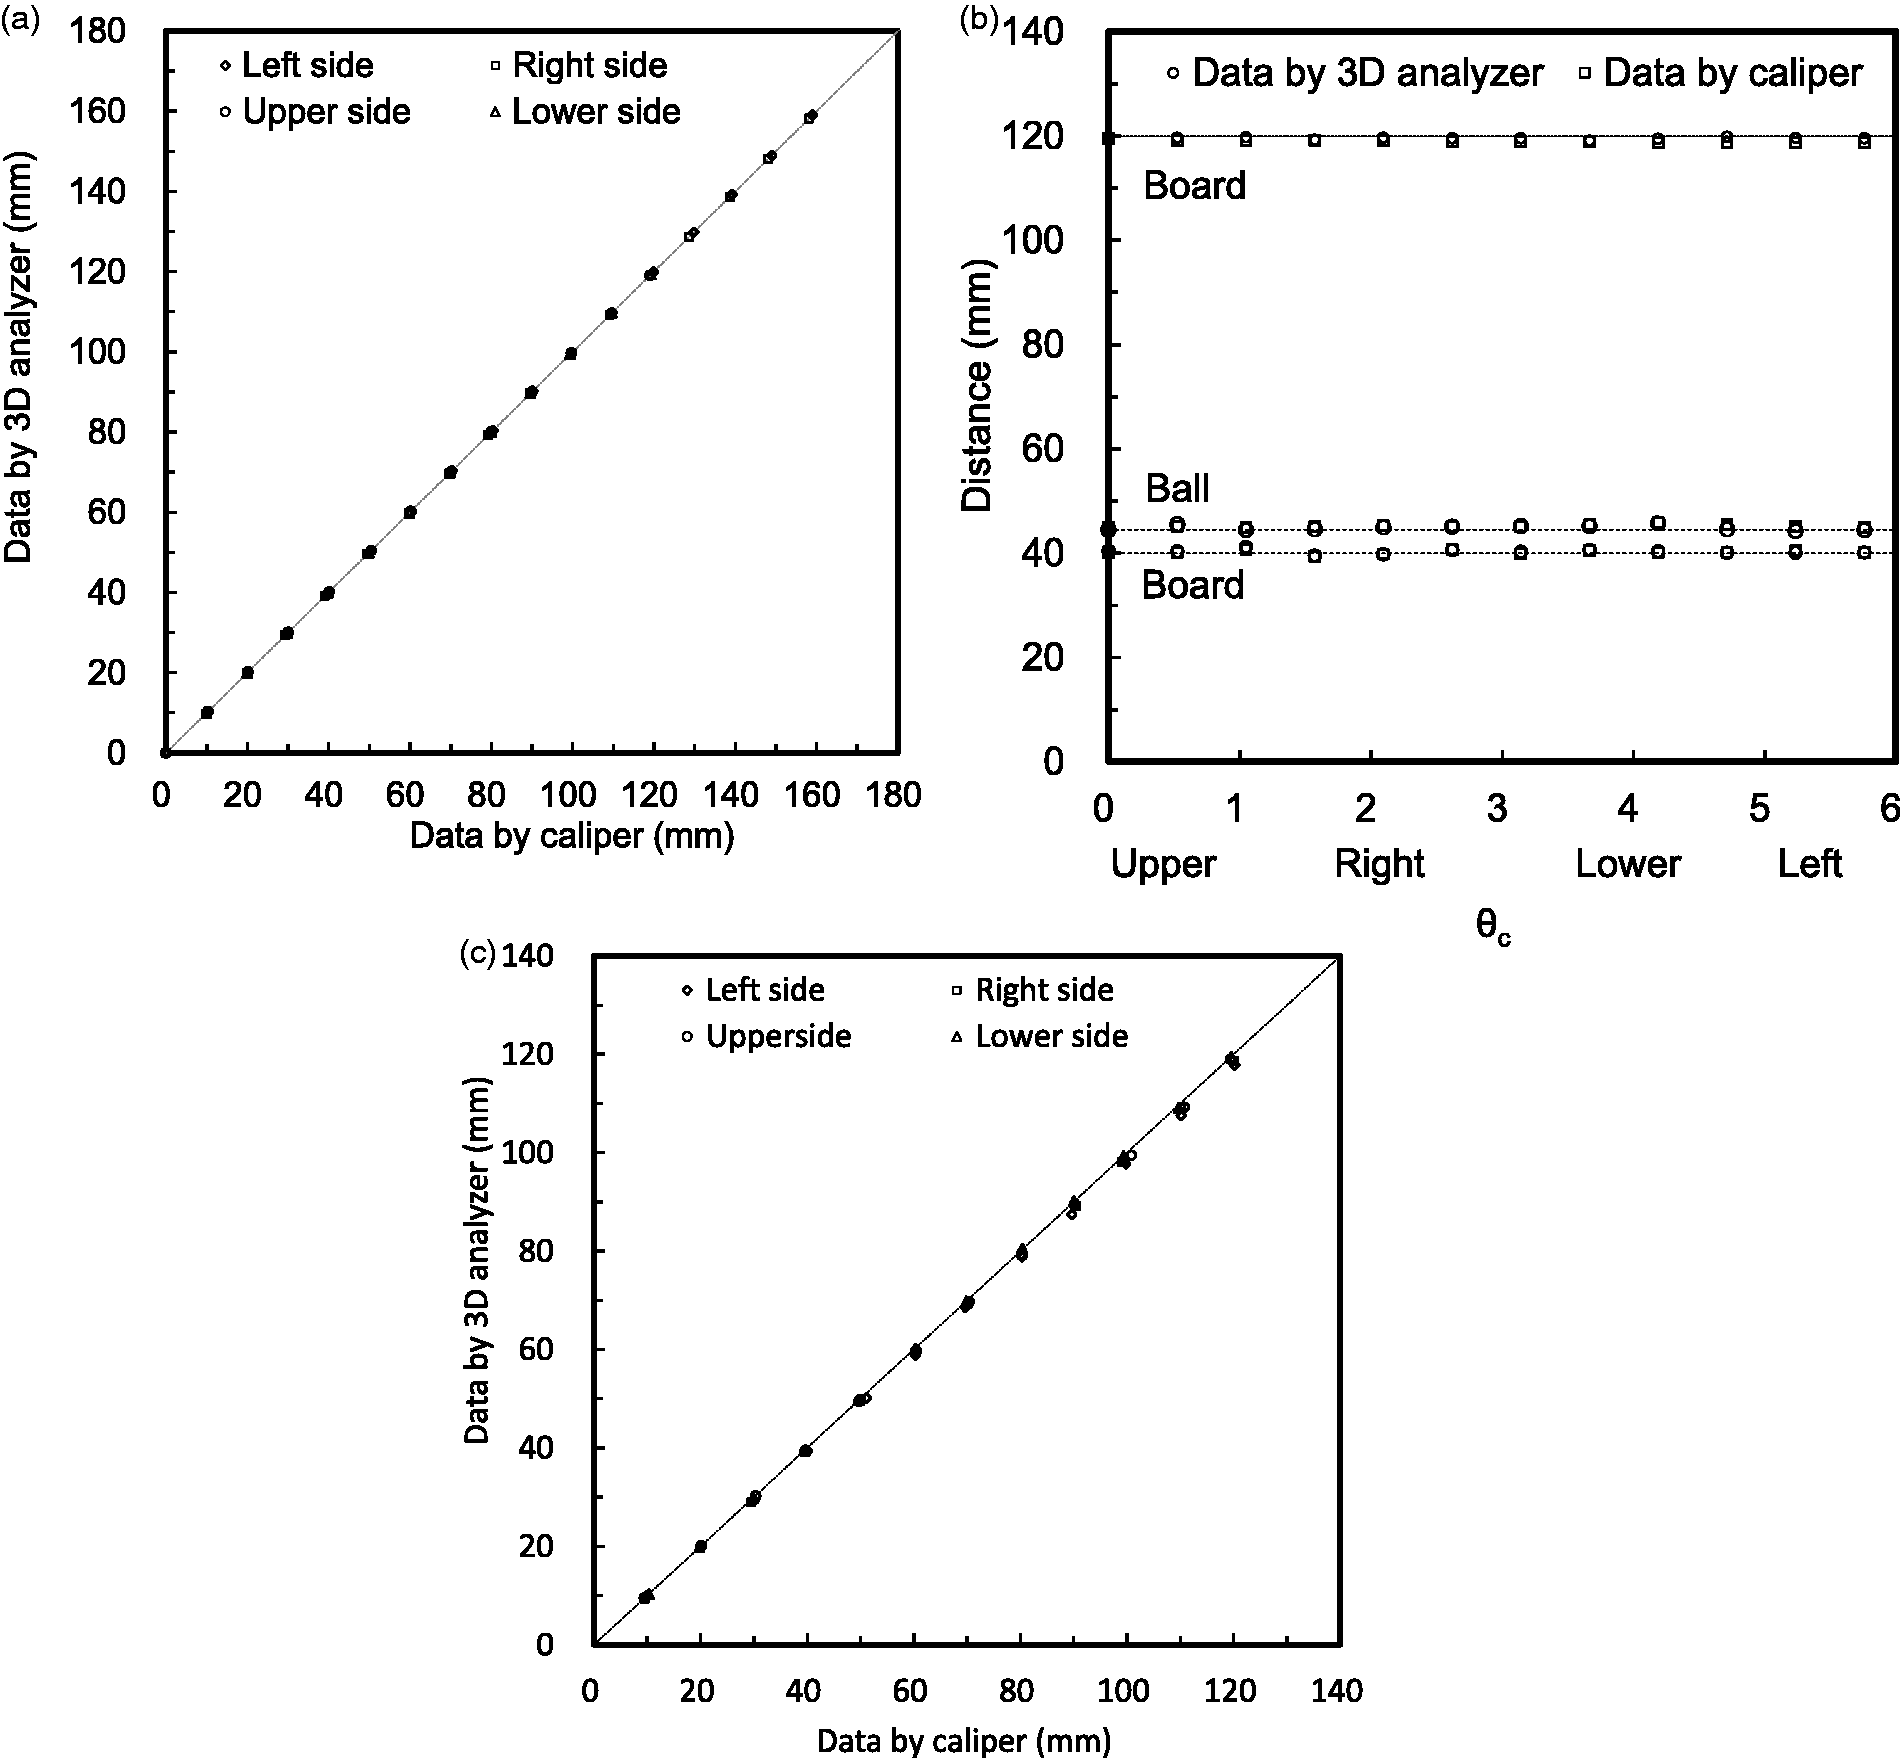
Figure 3(a) shows distance D for the cross shape on the grid board. The mean deviation of the distance calculated with the 3D analyzer from the distance measured with the caliper was −0.30% or −0.13 mm (S.D. 0.78) for the upper side, 1.54% or 0.75 mm (S.D. 0.63) for the lower side, −0.22% or −0.21 mm (S.D. 0.29) for the left side, and 0.14% or 0.08 mm (S.D. 0.37) for the right side.
Figure 3(b) shows distance D for the two circular shapes on the board and the circular shape on the ball. The mean deviation of the distances was 0.19% or 0.08 mm (S.D. 0.23) for the ϕ = 80 mm circular board shape and 0.47% or 0.55 mm (S.D. 0.30) for the ϕ = 240 mm circular share. For the ϕ = 88 mm circular shape on the ball, the mean deviation of the distances was −0.80% or −0.36 mm (S.D. 0.36).
Figure 3(c) shows D for the cross shape on the ball. The mean deviation values were −0.71% or −0.58 mm (S.D. 0.48) for the upper side, −0.24% or −0.10 mm (S.D. 0.17) for the lower side, −1.84% or −1.36 mm (S.D. 0.89) for the left side, and −1.52% or −0.85 mm (S.D. 0.40) for the right side. Among the observed data, the mean deviation was −0.30%, or −0.19 mm (S.D. 0.38), and the range of the experimental error was −1.37 to 1.38 mm.
Pattern for the basic model
Figure 4 shows the 2D coordinates from the 3D analysis (solid line), measurement by the caliper as reference (square), and draping (triangle). The 2D coordinates represent the pattern that covers the surface of the basic model. Additionally, the diagram of the analysis is shown with the dashed line. Each pattern has nearly identical coordinates at each point.
2D coordinates from 3D analysis, measurement by the caliper as reference, and draping.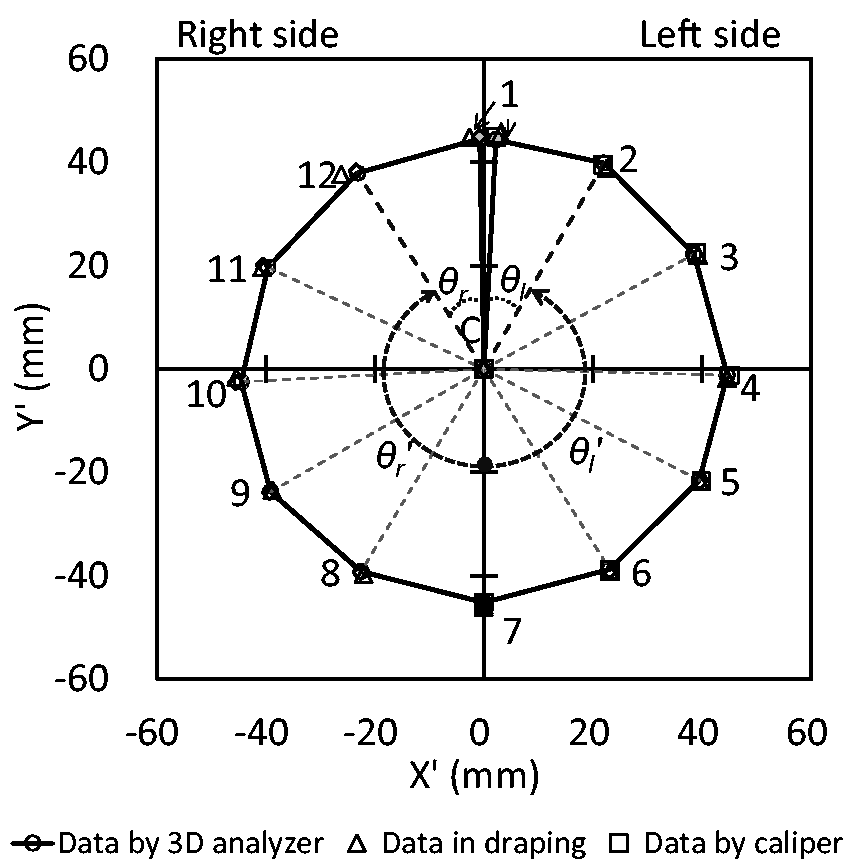
Point #1 has two coordinates on each side and was shown experimentally to have a conical shape. If the ball is a perfect sphere, the pattern is a circle with a circumference of 278.1 mm. The integrated value of chord in each triangle is 275.0 mm. The experimentally observed value is 273.9 mm, which is deemed appropriate.
Properties of the nonwoven sheet
The shape of the patterns obtained with the 3D analyzer and the draping patterns were statistically analyzed for distances between the tip of the nose and each point using a chi-squared test. No significant differences were detected, when p = 1.000 > 0.05 for both left and right sides. In addition, the mean differences between the distance from the draping pattern and the distance from the 3D analysis at each point were 0.79% (0.35 mm, S.D. 0.57) in the right side and 1.24% (0.55 mm, S.D. 0.58) in the left side. Thus, the chosen analysis method is deemed appropriate for describing the shape of the basic model with the nonwoven sheet.
Mannequin head pattern
The scanned data and manufactured mannequin head are shown in Figure 5(a) and (b), respectively.
Scanning data (a), manufactured head mannequin (b), and trial mask sheet in fourth ring for 62 subjects (c).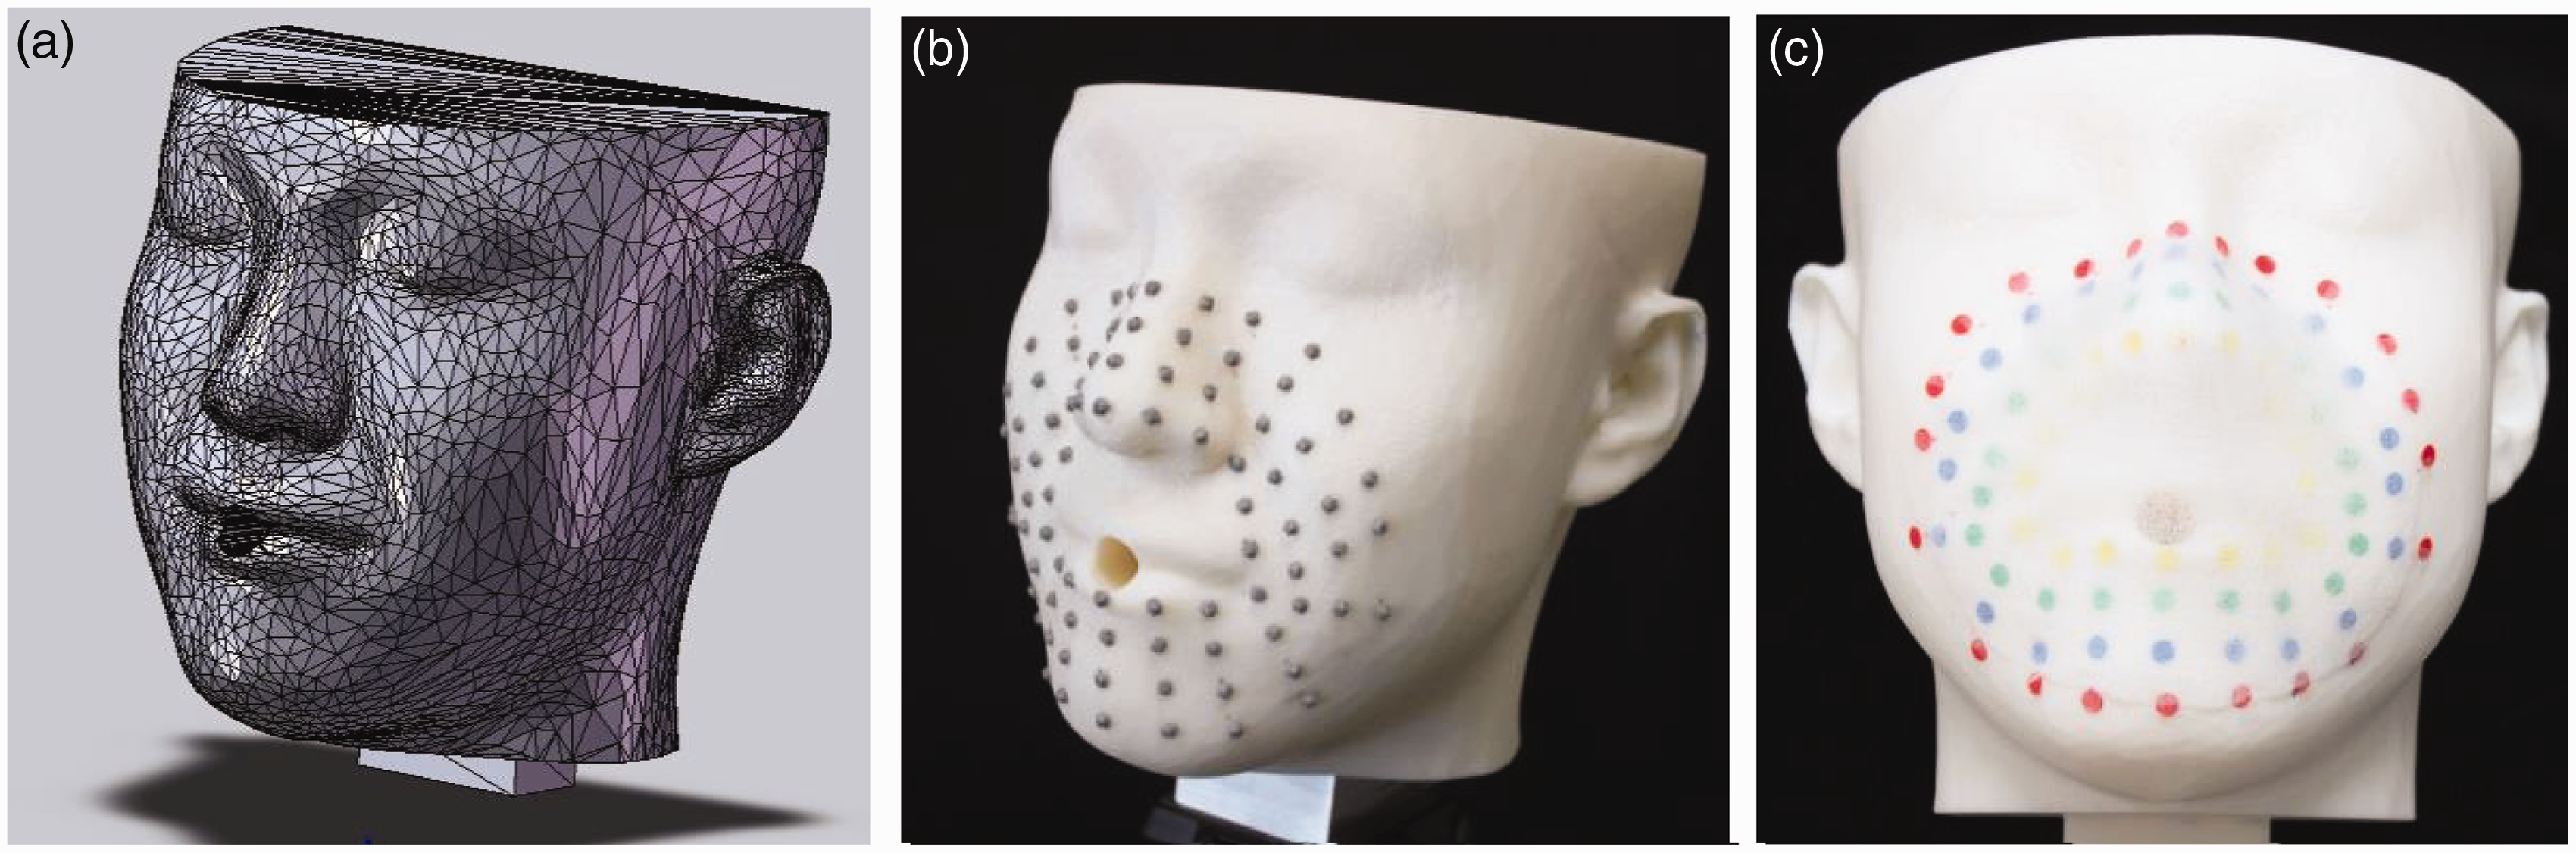
In this experiment, the 3D coordinates were measured on the mannequin. From the 3D coordinates, the four patterns were analyzed by using the previous method. From the calculated distances between the origin point #1 of the tip of the nose (Figure 2) and each point, the distances between adjacent points, and the inner angles, the 2D coordinates were calculated for each ring. Subsequently, the 2D coordinates of each point were calculated with equation (2) for the left side and equation (3) for the right side. Moreover, the 2D coordinates in each ring were transformed by integrating the inner angles from the bottom point #10 in the first ring, point #30 in the second ring, point #52 in the third ring, and point #74 in the fourth ring. Figure 6 shows the analyzed pattern (gray symbols) for the mannequin head. The first-ring pattern with the circular shape covers the nose and mouth. The triangles, squares, and diamonds denote the second, third, and fourth rings, respectively.
Analyzed pattern for the head mannequin, in draping, and for 62 subjects.
Focusing on the nasal dorsum points #19, #41, and #63, the cone shape of the analyzed patterns was validated by the calculated nasal angle θn of the mannequin: ∟#20#19#40; 2.04 (rad), ∟#42#41#62; 2.04 (rad), and ∟#64#63#84; 1.95 (rad). First, points #19, #20, #40 in second ring, #41, #42, #62 in third ring and #63, #64, #84 in forth ring of the analyzed pattern were rotated around each angles between the Y-axis and the points #19, #41, and #63. Each point of the analyzed pattern in the left and right sides were connected. Second, considering the calculated 2D coordinates, points #20 and #40 in the second ring, points #42 and #62 in the third ring, points #64 and #84 in the fourth ring with 3D coordinates (X′, Y′, 0) were rotated around the Y-axis by θN = (π − θn)/2 using equation (4) in the left side and equation (5) in right side.
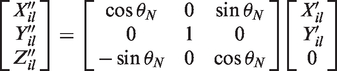
Then, the direct distance between points #20 and #40 in the second ring, points #42 and #62 in the third ring, and points #64 and #84 in the fourth ring were calculated by the 3D coordinates (X′′, Y′′, Z′′) of each points using equation (1). The deviations of the distances in the pattern after the rotation were −0.13% (−0.03 mm) in the second ring, −1.07% (−0.20 mm) in the third ring, and −1.02% (−0.21 mm) in the fourth ring. The results suggest that the analyzed patterns better fit the nasal dorsum.
Moreover, the possibility of forming a complex facial shape was confirmed. Comparing the center angle of each pattern with the center angle of the mannequin in the lateral view, for example, ∟#63#1#74 in the fourth ring, the right and left mean values of the angles (θ = 2.9, 2.8, and 2.8 rad) in analyzed pattern increased relative to each angle in the mannequin by 13.2%, 17.1%, and 17.1%, respectively. This indicates that the increase could completely cover the complex facial surface when the 2D sheet was draped along the facial surface.
Next, the analyzed pattern and the draping pattern were compared, as shown in Figure 6.
Adequateness of pattern among the mannequin, draping, and 62 subjects
Proposed patterns for young adult males
Considering mask patterns for mass use, the head characteristics and 3D coordinates were measured according to the previous methods. Table 3 shows the mean and standard deviation of the head parameters for 62 subjects.
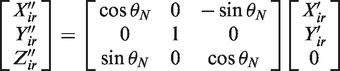
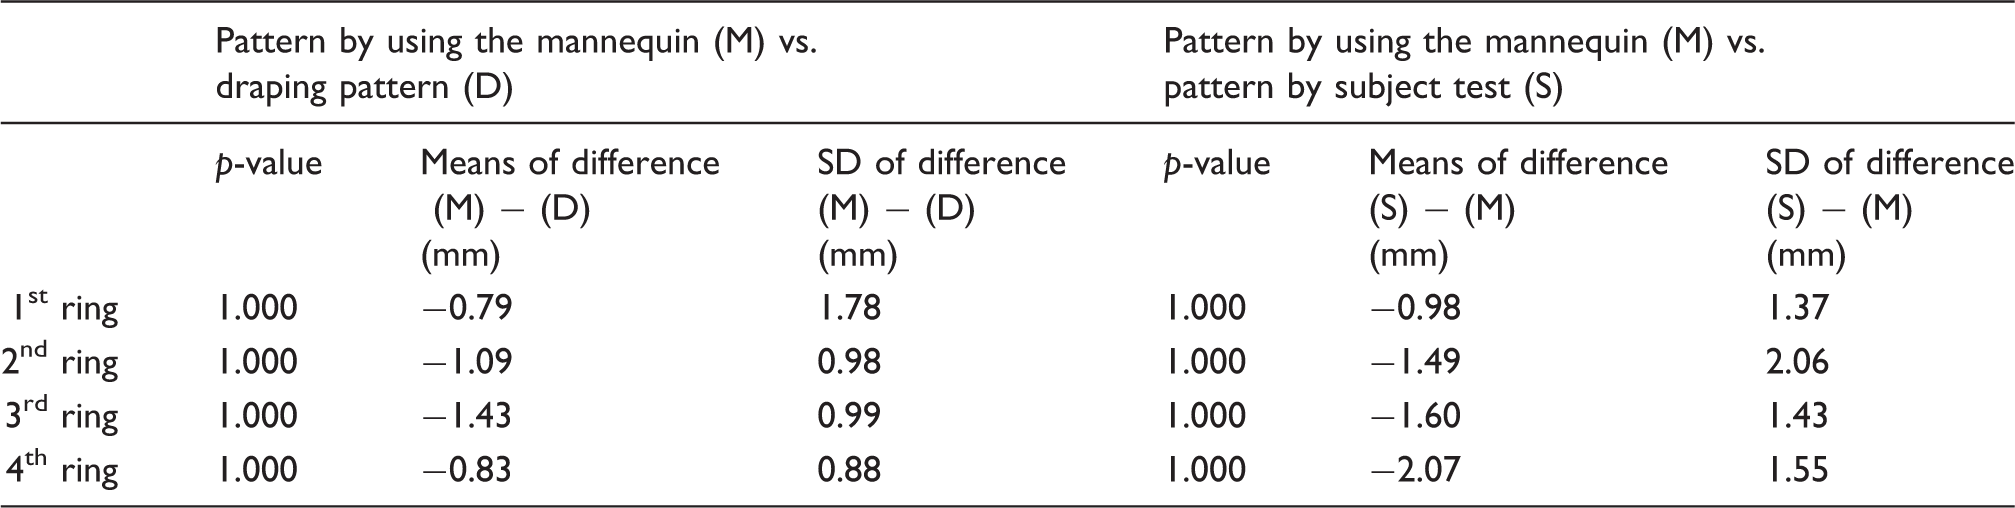
Figure 6 shows standard deviations with error bars and the mean analyzed 2D coordinates for the 62 subjects. Comparing the distances between #1 and each point in the right pattern and left pattern, there were no significant differences (p = 1.000 > 0.05), and the maximum difference of distance was observed to be 1.97 mm between points #23 and #37. Therefore, it was confirmed that the patterns were mirrored. The mean patterns are expected to improve the fit performance to more people. For example, using these patterns, the manufactured nonwoven mask sheet for the fourth ring is shown in Figure 5(c). The data suggest that the nonwoven sheet based on analyzed pattern fits well for the mannequin. The mean analyzed and mannequin patterns were statistically evaluated. Table 4 shows the results of the chi-squared test for the subjects as well as the mannequin. The table also shows the means and standard deviations of the differences for each point. No differences are seen. Furthermore, the mean differences between distance for the subjects and the mannequin are small (− 1.56 mm, S.D. 0.31).
Subsequently, an analysis of variance (ANOVA) was performed on the differences of distance of the subject’s face against the mean pattern at each ring. No significant differences of distance between #1 and each point were detected for each ring (p = 1.000 > 0.05). The mean value was 0.08 mm (S.D. 2.9 mm). Also, no significant differences of distance between adjacent points were detected (p = 0.919 > 0.05). The mean value was 0.08 mm (S.D. 1.5 mm). Moreover, the total distance difference over the circumference, for example, #1 to #30, was calculated at the right and left sides of the individual. From the results of ANOVA, no significant differences among each ring were detected (p = 0.999 > 0.01). The mean distance difference at each side was 0.99 mm (S.D. 5.0 mm). Thus, the analyzed mean patterns can be used to fabricate high-fitting performance mask sheets for a large variety of face shapes. However, the maximum difference was 12.5 mm and the minimum difference was −13.1 mm. These values indicate poor fitting, resulting in an air gap between the mask and face. Acquiring a mask pattern with the best fitting for all users requires an accurate shape analysis of the subject’s face.
Conclusion
To develop hygiene mask sheets that fit most people, 3D coordinates of a manufactured mannequin head and 62 subjects in a stationary state were measured using a 3D motion analyzer. In the 3D analysis, the limits of the measured parameters were examined in detail. Subsequently, four types of flat patterns for masks of different sizes were analyzed employing geometric analysis with triangular combination. A manufactured head mannequin was used to evaluate the fit between the analyzed pattern and the facial surface. Draping patterns for the basic model were acquired by draping the head mannequin with nonwoven sheets. Comparing the two obtained patterns yielded no significant differences; therefore, the experiments and analysis method are appropriate for developing mask sheets for individual use. Next, mean analyzed patterns were established using data from 62 subjects and then compared with the mannequin head pattern. A chi-square test revealed no significant differences. Therefore, the analyzed mean pattern is appropriate for a greater variety of face shapes. Moreover, the mean distance difference of 0.99 mm (S.D. 5.0 mm) between the analyzed mean pattern and the individual face was not significant. Thus, mean sheet patterns that fit a wider variety of face shapes can be acquired with high-fitting performance.
Footnotes
Funding
This work was supported by JSPS Kakenhi (grant number 26350068).