
Abstract
This paper describes a method for determining the differential adsorption of body odor compounds by three types of yarn/fiber (cotton, polyester, wool) using proton-transfer-reaction mass spectrometry (PTR-MS). Each type exhibited different adsorption profiles. Decanal and cyclohexanone adsorbed more to wool than to either cotton or polyester. Ethylbenzene and butanoic acid methyl ester adsorbed more to polyester than to either cotton or wool. Cotton was a weaker adsorbent than polyester and wool for all odor compounds tested. Phenol was adsorbed highly by all three yarns. The study validated the use of PTR-MS to assess the adsorption of volatile compounds by textile fibers/yarns, and demonstrated its potential to be used as a rapid means of assessing the kinetics of odor adsorption and release by existing and modified materials.
Unpleasant body odor can adversely affect personal confidence and interpersonal interactions. The intensity and nature of an individual body odor is linked to many factors, including diet, disease, medication, and lifestyle. Body odor typically results when secretions from the sweat and sebaceous glands are acted on by bacteria. More than 800 volatile compounds have been reported as being related to human body odor, including carboxylic acids, alcohols, aldehydes, esters, ketones, thio/thioesters/sulfonyls, aliphatic/aromatics, halogenated species, heterocyclics, sulfides, amides/amines, urea, and hormones.1–22
The kinetics and adsorption characteristics of volatile compounds by textiles used in the manufacture of clothing and other products are of both commercial and academic interest. The most common analytical method used to study the adsorption of volatile organic compounds (VOCs) is gas chromatography (GC) coupled either to a flame ionization detector (FID), mass spectrometry (MS), or an olfactory port. Samples are generally introduced to GC as a solvent extract, directly as a gas from the sample headspace, or concentrated using a stationary phase, such as headspace solid-phase micro-extraction (SPME), or a purge and trap method.6,9,23,24 Such approaches have been used for the qualitative analysis of a range of compounds in body odor15,25 and to determine textile sorbent profiles of body odor.9,23,24 SPME in combination with GCMS in particular has been used to investigate a range of compounds recovered from textiles exposed to body odor.6,9,23,24 Such studies have revealed that the chemical composition of the textile sorbent materials plays a major role in the trapping and release of human body odor. 24 For example, it has been reported that rayon adsorbed phenol, but polyester did not. 23 Of the yarns tested, cotton was reported to be able to adsorb the most volatile compounds and the highest odor mass amount. 9 SPME-GCMS has also been used to investigate the potential health effects associated with the release of organic compound residues (toluene, vinylcyclohexene, styrene, 4-phenylcyclohexene, vinylchloride, butadiene) from clothing samples comprised of five fiber types (polyester (Terylene™), nylon, cotton, wool, silk). 26 Further, GCMS has been used to study the release of VOCs from a range of fabrics/fibers (cotton, linen, silk, polyester, rayon, polyvinyl chloride (PVC), silk, acetate, wool)26,27 exposed to tobacco smoke for 9 minutes 26 or 8 and 12 minutes. 27 Wool and silk released higher concentrations of high molecular weight compounds, with natural fibers releasing more low molecular weight compounds. 26 Cotton and linen adsorbed more ammonia, polyester absorbed more benzene, and acetate adsorbed more toluene and pyrrole. 27 More recently, proton-transfer-reaction mass spectrometry (PTR-MS) and sensory assessment have been used to assess the contribution of bacteria to body odor adsorption on fabric swatches exposed during human wear. 22 The intensity of axillary odor emanating from three fabrics, which were matched for structure (interlock) while differing in fiber type (wool, cotton, polyester), was reportedly inversely related to the hygroscopicity of the fiber from which the fabrics were made. 22 Advantages of PTR-MS for measuring the absorption/absorbance of VOCs on yarns is that no sample preparation is required and a quantitative measurement of VOCs can be obtained in real time. PTR-MS has been widely used to detect VOCs in food, 28 and in both medical 29 and environmental research. 30
In the current paper, the adsorption of a model body odor by three yarns/fibers (cotton, polyester, wool) was measured using an in vitro system and PTR-MS.
Materials and instrumental set-up
Yarn and fiber preparation
Yarn representing three fiber types common in apparel was disaggregated from standard fabrics of cotton (ISO-105-F02), 31 polyester (ISO 105-F04), 32 and wool (ISO 105-F01) 33 (James Heal, UK) and used as the testing material in order to minimize the effects of fabric structure and fiber/fabric manufacturing processes, and to ensure that experiments could be replicated relatively free of concern about fabric/fiber sourcing differences. The fabrics had been pre-treated by washing and drying according to ISO 6330-2012. 34 To be consistent with routine use of common textile products, no other surface cleaning was undertaken. After drying, the fabrics were cut to 200 mm × 200 mm specimens and yarn was disaggregated from the fabric swatch by hand, and sorted. After conditioning under standard conditions (20 ± 2℃, 60 ± 4% relative humidity 35 ) over 24 hours, 2.00, 1.00, or 0.10 g of yarn was used in the adsorption trials. Yarn diameter (light microscope (Leica, MZ16, Germany, n = 20)) and surface areas (Brunauer–Emmett–Teller (BET) Specific Surface Area (Nitrogen Gas Physisorption) Static Pressure/Volumetric Technique (Micromeritics Tristar II 3020, Particle Technology Labs, USA), n = 3)), respectively, were cotton 0.250–0.275 mm, 0.6062 ± 0.0078 m2/g; polyester 0.411–0.458 mm, 0.3419 ± 0.0211 m2/g; and wool 0.376–0.440 mm, 0.3917 ± 0.0023 m2/g.
Body odor volatile compounds
Target VOCs were selected on the basis of reported frequency in body odor, and their olfactory contribution. Further, to facilitate their identification using PTR-MS, compounds were selected that did not have main ions or fragments that were likely to markedly overlap. The six selected compounds were ethanethiol (Aldrich), ethylbenzene (Sigma), phenol (Aldrich), cyclohexanone (Aldrich), butanoic acid, methyl ester (Nu-Chek), and decanal (Sigma-Aldrich). The profile of each compound as the pure compound was checked by PTR-MS to confirm consistency with the published literature. 36 To ensure sufficient PTR-MS signal response, the signal intensities of the dominant ion of each compound were controlled between 104 and 103 counts per second (cps).
PTR-MS
A proton-transfer-reaction mass spectrometer (Ionicon Analytik) was used to measure the odor compounds with textiles both qualitatively and semi-quantitatively. Ionization conditions in the drift tube were temperature 80℃, voltage 600 (±0.4) V, and pressure 2.23 mbar. The resulting electric field per number density of the drift tube buffer gas molecules (E/N) was 136-138 Td. The PTR-MS inlet flow was set at 50 ml/min and a make-up gas flow of dry air (IG BOC, NZ) was provided to the sample. The air flow inlet functions to maintain a stable drift tube pressure. Measurements were made in Multiple Ion Detection (MID) mode. Dominant mass ions for the target compounds were scanned at 200 ms per mass. A total of 15 cycles was scanned, and signal intensities from the last 12 cycles averaged.
Method development
Body odor matrix
Compounds, their representative chemical groups, dominant ion and proton-transfer-reaction mass spectrometry (PTR-MS) signal intensities
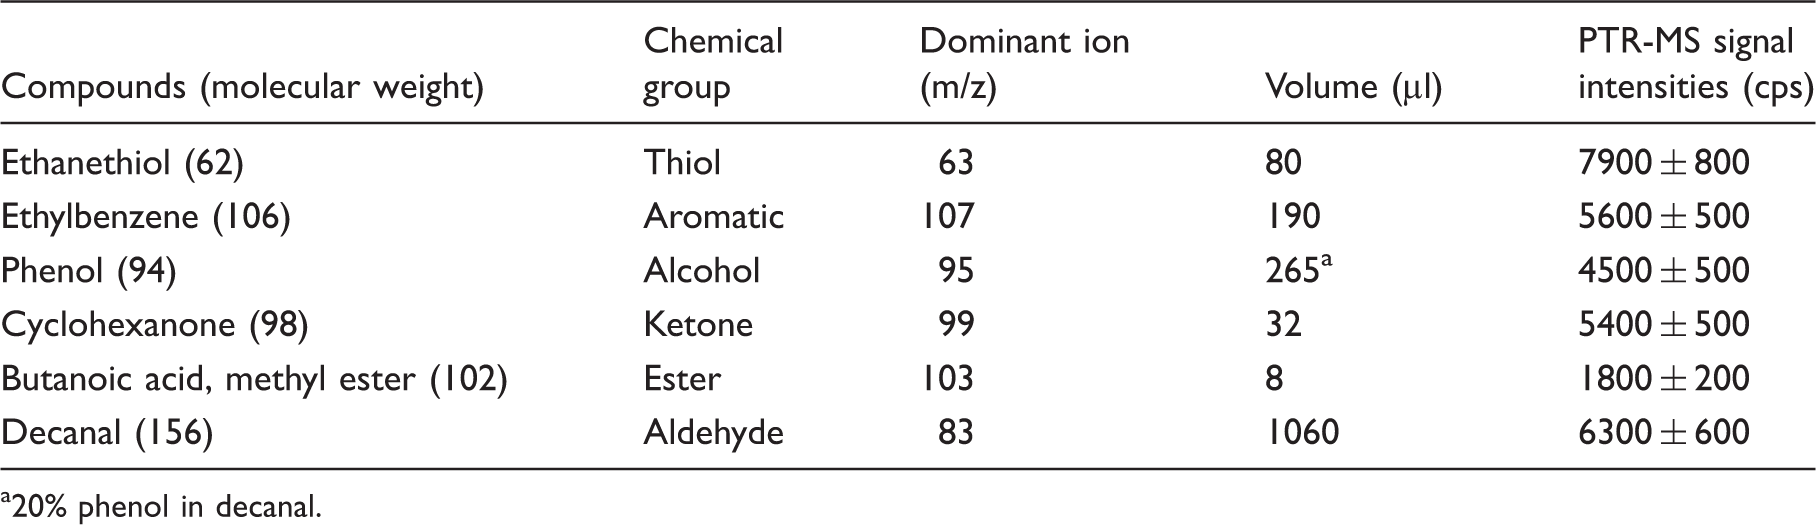
20% phenol in decanal.
Experimental set-up
The experimental set-up is illustrated in Figure 1. The temperature of the experiment was set at 33℃ to simulate the temperature of the human skin when the person is in a thermo-neutral state.
37
To ensure all yarn samples were exposed to an equivalent body odor matrix, a liquid volume containing a set concentration of the body odor compounds was introduced to a 1 L glass bottle containing a side arm that was sealed with polytetrafluoroethylene (PTFE)-faced septa and a solid lid (Bottle A, Schott). Defined volumes of the gaseous matrix in Bottle A could subsequently be removed via the septum using a gas-tight syringe and injected into Bottle B, which also had a side arm that was sealed with PTFE-faced septa. Yarn present in Bottle B was exposed to the volatile compounds for a set period of time before the odor compounds remaining were measured using PTR-MS via a port in the lid of the bottle. The lid also contained a second inlet by which air was drawn into the bottle to replace the air going to the proton-transfer-reaction mass spectrometer, thus allowing a stable drift tube pressure to be maintained, an operational requirement for the proton-transfer-reaction mass spectrometer. The signal intensities measured by the proton-transfer-reaction mass spectrometer from Bottle B reflected the equilibrium of adsorption and desorption of compounds from the yarn. The difference between the odor compounds detected in Bottle B in the absence and presence of yarn was assumed to reflect the odor compounds that had been adsorbed onto the yarn (at equilibrium).
Experimental set-up: a controllable gaseous odor matrix delivery system. Bottle A generates an equilibrium gaseous odor matrix from the liquid odor matrix, while Bottle B is for yarn exposure to the gaseous odor matrix removed from Bottle A.
Equilibrium and response curves
To assess the equilibration time of the odor matrix in Bottles A and B, two equilibrium tests were carried out. In the first test the odor matrix was held in Bottle A for one of 5, 15, 30, 60, 120, 240, 360, or 1020 minutes, then in Bottle B for 30 minutes. In the second test, the odor matrix was held in Bottle A for 120 minutes then in Bottle B for one of 15, 30, 60, 210, 420, 1440, or 2880 minutes.
To assess the effect of the increase of pressure associated with injecting the odor matrix on the PTR-MS response, a gaseous odor matrix volume of 3, 10, 25, or 50 ml was injected into Bottle B and PTR-MS response curves obtained for each compound.
Adsorption test
To assess the adsorption of odor compounds to the yarns, 2.0, 1.0, or 0.1 g of each yarn/fiber was bundled loosely, in thirds, length-wise, and held together using a minimal length of polyester thread. The bundled yarns were placed in Bottle B and held at 33℃ for 2 hours. Liquid matrix (10 μl) was injected into Bottle A and, after 120 minutes, 15 ml of equilibrated vapor was removed from Bottle A and injected into Bottle B using a gas-tight syringe (incubated at 45℃ to prevent condensation). Bottle B was held for 24 hours at 33℃ before the VOC in the headspace was measured using the proton-transfer-reaction mass spectrometer. The samples were odor control, yarn (cotton, polyester, wool) exposed to odor, and yarn control (no odor).
Data analysis
The averaged signal intensities of the dominant mass ions from the 12 cycles were normalized with the signal intensity of m/z 21. Statistical analysis was performed in SPSS 18 software. 38 Descriptive statistics were calculated, and data transformed to meet requirements of normality assumptions. Univariate analysis of variance (ANOVA) with post-hoc Tukey honest significant difference (HSD) 38 was applied to identify differences in the adsorption evident among the three different yarn/fiber types. If equal sample sizes and equal variances were not satisfied, Tamhanes's T2 test was applied. 38 The significance level was set at p ≤ 0.05.
Results
Initial trials determined the time required for the odor matrix to reach equilibrium with the headspace in Bottle A (Figure 2(a)) and subsequently for the odor matrix to come to equilibrium in the headspace of the Bottle B containing the yarn/fiber (Figure 2(b)). For most compounds, the signal intensities in Bottle A had reached equilibrium after 120 minutes (Figure 2(a)) and this time period was used in subsequent trials. It was decided to expose the yarn/fiber to the odor matrix for 1440 minutes (24 h), as the signal intensity appeared to be stable at this point and yarns/fibers could potentially be exposed during wear for this period of time (Figure 2(b)). A gaseous matrix volume of 15 ml was selected to inject to Bottle B for yarn exposure (Figure 2(c)), as this volume did not cause a significant change in pressure in Bottle B and gave an adequate PTR-MS signal for each compound. The PTR-MS response curves of compounds were normalized to the flattest response curve (butanoic acid methyl ester) to eliminate the sensitivity difference of the PTR-MS for different compounds.
Equilibrium and response curves: (a) equilibrium of Bottle A; (b) equilibrium of Bottle B; (c) proton-transfer-reaction mass spectrometry response curves of compounds in Bottle B.
Yarn adsorption of body odor compounds
The normalized signal intensity of the matrix compounds detected in the headspace of the odor control, test samples (yarn/fiber exposed to odor matrix), and yarn/fiber control are presented in Figure 3. For yarn controls (yarn/fiber, no odor) the signal intensities of the monitored ions were very low (Figure 3(a)–(f)). In the presence of all three types of yarn/fiber the concentration of ethanethiol detected in the headspace decreased compared to the value measured in the absence (odor control) of yarn (Figure 3(a)). This reduction in odor detected indicates ethanethiol was being adsorbed by the cotton (p ≤ 0.01), polyester (p ≤ 0.01), and wool (p ≤ 0.000) yarns/fibers. A difference in the adsorption of ethanethiol by the three types of yarn/fibers was not evident.
Differences in adsorption among fibers/yarns.
Decanal was adsorbed by cotton (p ≤ 0.000), polyester (p ≤ 0.000), and wool (p ≤ 0.000; Figure 3(b)), with adsorption by wool the strongest of the three types of yarn/fiber (wool versus cotton, p ≤ 0.01; wool versus polyester, p ≤ 0.000). Phenol was strongly adsorbed by all three types, cotton (p ≤ 0.01), polyester (p ≤ 0.01), and wool (p ≤ 0.01; Figure 3(c)), with no significant differences among the three yarns/fibers detected. Cyclohexanone was adsorbed by cotton (p ≤ 0.05), polyester (p ≤ 0.01), and wool (p ≤ 0.000; Figure 3(d)), with wool adsorbing more than both cotton (p ≤ 0.05) and polyester (p ≤ 0.05). Ethylbenzene was adsorbed only by polyester (p ≤ 0.000; Figure 3(e)). Both polyester (p ≤ 0.000) and wool (p ≤ 0.01) adsorbed butanoic acid methyl ester (Figure 3(f)), the strongest adsorption being evident with polyester. There was no evidence of cotton adsorbing butanoic acid methyl ester. As the amount of yarn/fiber increased from 0.1 to 1.0 and 2.0 g, the amount the odor compounds adsorbed showed a variety of behaviors (Figure 4). The pattern with ethylbenzene and polyester appeared ‘normal’ in that as yarn mass increased, this was reflected in the amount adsorbed.
Adsorption patterns of body odor compounds (2.00, 1.00, 0.10 g). Adsorption calculated as signal intensity of control minus signal intensity with yarn exposure: adsorption then normalized with yarn surface area.
Discussion and conclusion
In this study, adsorption of body odor compounds was assessed by comparing PTR-MS responses of the compounds with and without exposure to yarn/fiber with the reduction of odor compounds assumed to represent adsorption of the odor by the yarn.
The PTR-MS response for Bottle B showed a linear relationship between the volume of the gaseous sample and PTR-MS signal for each compound (Figure 2(c)). The correlation coefficient R2 generally exceeded 0.9990 (other than that for phenol R2 = 0.9943), indicating that sampling a certain amount of gaseous odor matrix from equilibrium Bottle A to yarn adsorption Bottle B and the PTR-MS response to the odor were linearly correlated. This result confirmed the amount of both yarn/fiber and body odor compounds exposed were adequately controlled for, and demonstrated that the experimental set-up was appropriate for examining adsorption of the odor matrix by the yarns/fibers. Further, variability in results was typically less than 10%, with this variability attributable to instrument variations and the operator when handling and dispensing small volumes of highly volatile compounds. Importantly, however, results from the three replicate trials were similar.
Using this approach, the adsorption profiles of six body odor compounds by cotton, wool, and polyester were determined. Ethanethiol, decanal, phenol, and cyclohexanone were adsorbed to cotton. Ethanethiol, decanal, phenol, cyclohexanone, and butanoic acid methyl ester were adsorbed to wool. Ethanethiol, decanal, phenol, cyclohexanone, ethylbenzene, and butanoic acid methyl ester were adsorbed to polyester. No difference in the adsorption of phenol or ethanethiol by the three yarns/fibers was observed in this work. In summary, the adsorption profiles of the three yarn/fiber types differ: wool shows significantly higher adsorption for decanal and cyclohexanone (compared with cotton and polyester); polyester shows significantly higher adsorption to ethylbenzene and butanoic acid methyl ester (compared with cotton and wool). Compared with polyester or wool, cotton was not the strongest adsorbent for any of the odor compounds tested.
The three types of yarn/fiber presented a high adsorption level to phenol. Potential reasons why these effects were observed include a carbohydrate–aromatic residue interaction between the pyranose ring of cellulose and the benzene ring of phenol;39,40; a carbohydrate–aromatic residue and aromatic residual interaction between the side chain of wool (keratin) and phenol;41,42 or the benzene ring of polyester and benzene ring of phenol generating aromatic interactions. 43
At the odor volatile and textile gas–solid interface, volatile compounds will become bound to the textiles by physisorption, a combination of intermolecular van der Waals forces and electrostatic forces, that is, electron clouds, dipole, and dipole/induced dipole potentials that occur due to interactions with a dipole in a neighboring molecule.
44
Except for the carbohydrate–aromatic interactions of phenol, compounds in Figure 5 followed a pattern of adsorption that could be explained in terms of molecular dipoles. High dipole compounds (other than phenol) appear to be more easily adsorbed by cellulose
31
and wool
45
due to their polar side chain (Figure 5). Polyester has a lower polarity26,27 and it adsorbed lower dipole compounds (Figure 5).
Normalized adsorption of yarn with the dipole of body odor compounds. The y-axis is adsorption of yarn normalized with yarn surface area and response curves to butanoic acid methyl ester; the x-axis is the molecular dipole.
The olfactory threshold of many body odor compounds is known to be low (ppb, ppt).46–48 High concentrations of body odor compounds were used in this study to ensure the signal was sufficient to allow the adsorption of these odor compounds by the yarns/fibers selected. However, it is expected that a similar pattern of adsorption would occur with lower concentrations of the odor compounds.
This study has demonstrated that the experimental set-up and use of PTR-MS provides an effective method for studying adsorption of volatile compounds by yarns/fibers without the need for complicated sample preparation and measurement, earlier work being based on fabrics worn by humans. 22 The six compounds for the body odor matrix were among the 700 volatile compounds reported to occur in body odor and represent the chemical groups of thiol, aromatic, alcohol, ketone, ester, and aldehyde. It is possible that interactions among compounds in the matrix occurred, and this was not examined specifically. Potentially, other chemical groups and compounds could be included in future studies and interactions effects could be determined. In addition, the preferential adsorption of compounds by a wide variety of yarns/fibers could be examined and the method could, with slight modification, be also used to monitor the release of odor compounds from yarn/fiber.
Footnotes
Acknowledgment
We would like to acknowledge Dr Eng Wui Tan for his valuable comments.
Funding
This work was supported by the Wool Industry Research Ltd, the New Zealand Wool Industry Charitable Trust Post Doctoral Fellowship (contract 07325), and the University of Otago.