



Abstract
In this paper the current generation of 350 dtex airbag coated and uncoated fabrics are examined experimentally under a multitude of simple and complex deformations. The geometric dimensions of the fabric architecture and the load–elongation behavior of the yarn constituents are studied. Furthermore, deformational shear behavior of airbag fabrics, which have not previously been investigated, are examined here. The stress–strain behavior of the yarn as well as the fabrics with and without coating are found to be highly nonlinear. Under uniaxial loading, nonlinearities of the fabric occur at lower strains due to crimp of the fabric, whereas under biaxial loading, the nonlinearity occurs at low and intermediate strain levels resulting from a combination of the inherent nonlinear material response of the yarn and geometric changes in the fabric structure. The data generated not only provide the basis for structural analysis of the airbag, but can also be used to develop more sophisticated definitions of the constitutive behavior of the fabric.
Keywords
Airbag fabrics exhibit unique characteristics that differ from traditional engineering materials. The published data available on airbag fabrics is quite limited and parts are quickly becoming outdated. Most of the previous work has focused on macroscopic extension of the fabric structure excluding the properties of the fabric constituents.
Considerable efforts of the airbag designers and manufacturers have been focused on producing airbag systems that are reliable and have predictable performance. Of fundamental importance to the airbag performance is the mechanical properties of the airbag fabric. Airbag fabrics, which are typically constructed of a simple plain weave of nylon yarns, exhibit unique characteristics that differ from the traditional engineering materials. More specifically, airbag fabrics are heterogeneous, anisotropic, have the ability to undergo large deformations and exhibit nonlinear mechanical behavior. Heterogeneity and anisotropy lends itself to the geometric assembly of discrete constituents, while nonlinearity is due to both geometric deformations and material nonlinearity of the constituents.
The fabric construction of the airbag has evolved greatly throughout the 20 years since the technology was first introduced in the early 1990s. The first generation of fabric design consisted of 940 dtex yarns, which were coarse, heavy and difficult to pack. The second generation of fabrics used during the mid-1990s was made of high tenacity 470 dtex nylon yarns. At this time, the transition from neoprene to silicone coatings was also seen. The new fabrics were gentler on the passenger’s skin during impact than their predecessors and had better packability. The fabrics were also lighter and had more controlled permeability. Manufacturers are now evaluating fabrics that are constructed of high to super high tenacity yarn with linear densities of 235–350 dtex. These fabrics have improvements in weight reduction, packability and softness. In the future, the trend of low-density, high-strength yarns will continue in order to make lighter, more robust and more compact airbags.1,2
The applied pressure in the airbag is a follower-type loading, meaning the temporal and spatial distribution of the load depends on the structural response of the fabric. Structural response is governed by the material behavior of the fabric as well as the operative boundary conditions. Therefore, fully understanding the mechanical properties can help engineers better predict the response of the airbag.
While there has been great effort in modeling the deployment and impact kinematics of airbags, the literature related to experimental evaluation of the mechanical properties of airbag fabrics is very limited. Keshavaraj et al.3,4 studied the biaxial properties of nylon 6, nylon 6,6 and polyester fabrics using a blister inflation device. The fabrics were of a balanced construction with the same amount of yarns in the warp and fill direction, although no mention was made of the value of crimp in the yarns. The blister inflation technique used in the study is a quasi-steady-state measurement in which a flat sheet of fabric is deformed into a semi-spherical blister via pressure drop across the fabric using compressed air. The biaxial stretching of the fabric and changing permeability are recorded as the fabric structure is inflated. A pressure gauge measures the internal pressure of the blister, while the blister height is recorded manually. The temperature of the inflating gas was collected using a temperature sensor while volumetric flow rate is measured with an anemometer. The fabric thickness is measured before the sample is loaded into the rig. The biaxial stress–strain is then determined by a relationship previously derived for solid plastic films under blister inflation and is dependent on the internal pressure, diameter of pressurized sphere, blister height and fabric thickness. The biaxial stress–strain blister relationship is based on the assumption that a constant volume of fabric sheet deforms (uniformly) from a flat configuration into a spherical segment during the experiment.
The biaxial stress–strain behavior of 630 denier and 420 denier fabrics made of nylon 6,6 and nylon 6 were evaluated under both low and high pressure drops over a variety of temperatures. The specimens were pressurized at set intervals and held so that the blister height could be recorded before increasing the pressure, hence the quasi-steady-state definition. During this test, the fabric was not extended to rupture. A ball-burst rupture test was also performed to test the fabrics to failure under both static and dynamic loading. The authors claimed that the ball-burst experiments provided a more realistic view of the performance of the fabric under biaxial condition.
Hong 5 used a mix of dynamic experiments with finite element simulation-optimization techniques to back-calculate the elastic properties of 315 denier (60 × 60) silicone-coated airbag fabric under deployment conditions. Hong discussed the anisotropy seen in uniaxial tests taken in the warp, fill and bias (yarns oriented at 45 degrees) directions in which Hong argued that this can be problematic in deciding the proper values to use for the mechanical properties in simulations. To find the elastic constants that govern the airbag fabric response under deployment, Hong carried out an optimization simulation. In the optimization procedure, the material properties of the airbag fabric are optimized to minimize the difference in a drop tower test on a deploying airbag and finite element simulation results. The variables that are minimized between the test and simulation are the acceleration, velocity, displacement and force. Hong was able to find values for modulus of elasticity, shear modulus and Poisson’s ratio; however, the results were influenced by the type of element formulation used. The mechanical properties obtained were not compared to other mechanical tests.
Rohr et al. 6 performed a series of experiments to determine the strength and failure behavior of fabric under different loading rates and exposed temperatures. A series of uniaxial tests on nylon 6,6 airbag fabric in the warp and fill directions was performed at loading rates of 0.08 and 500 mm/s using an Instron Type 8033 mechanical tester at temperatures between –35℃ and 85℃. In addition, the fabric was tested at a loading rate of 9000 mm/s using a drop weight tower at temperatures of –35℃ and 20℃. The fabric properties, such as yarn linear density, areal density and yarns per inch in both the warp and fill directions, were not reported in the study. The force was normalized by assuming the fabric behaves as a continuum with constant cross-sectional area. The results of the uniaxial tests at room temperature, quasi-static conditions found no differences in mechanical behavior between the warp and fill directions; however, the sample size is not mentioned nor any indication of the repeatability of the test. The investigation of the strain-rate parameter found that as strain rate increased, the ultimate strain decreased while failure stress increased, but no empirical equations are derived based on their experimental findings. When varying the exposed temperature, as the testing temperature increased, the trend of the data showed that the failure stress decreased and failure strain increased for all three strain rates. However, the authors only tested the fabrics at three temperatures over a relatively small temperature range with respect to the possible range of temperatures that the airbag structure can undergo during deployment. In addition, the authors carried out burst pressure tests on the fabrics. Little detail is given regarding the experimental set up and procedure of the test; regardless, the failure pressure was reported to be between 4 and 5 bar.
In a subsequent study, Rohr et al. 7 carried out biaxial cruciform tests to determine the material behavior under 1:1 biaxial loading. The experimental rig used consisted of four lever arms where one end of a lever is connected to a traditional mechanical tester cross-head while the other ends traveled on a track equipped with piezoelectric sensors to record the pulling load from the fabric specimen. Different lever lengths can introduce different ratios of biaxiality; however, this study only used a 1:1 loading ratio. Like the preceding study, 6 there is no reference to the fabric geometry or the size of the sample population. It is also unclear how stresses and strains were normalized, but it is assumed the same procedures of the preceding paper were used. The results found little difference between the warp and fill directions for the particular fabric system tested. The authors indicated that the sample failed near the grips and at the corners of the specimen.
A group of German automotive researchers noted the importance of the mechanical properties of the fabric for modeling, particularly in folding and deployment simulations. 8 The fabric models used in their studies were orthotropic elasticity definitions that were implemented into the major dynamic finite element codes (LS-DYNA, PAM-CRASH, MADYMO FE). Biaxial extension and picture frame tests were performed to generate the stress–strain response of the fabric under extension and pure shear. For the biaxial test, the fabrics were not loaded to failure, rather loaded to a given point and the recovery of the fabric was monitored. The procedure outlining the picture frame test for evaluation of shear properties of the fabric was discussed, although no results were presented. The authors claimed that by using the generated stress–strain curves rather than mechanical data from the fabric supplier, it was possible to get a better representation of the real life airbag kinematics. While not a main focus in the paper, the need and challenge for accurate geometrical description of the airbag structural components, such as patches, straps and vents, to improve virtual airbag designs was discussed.
Overall, the body of literature regarding evaluation of airbags is limited and portions are becoming dated as new generations of fabrics are introduced into the market. Airbag fabrics have been tested in uniaxial tension under a variety of strain rates and temperatures, and under biaxial tension using the inflation and cruciform techniques. The blister inflation technique assumes the stresses and strains are equal for the warp and fill directions, which could be invalid if the fabric is unbalanced either with regard to fabric geometry or yarn mechanical behavior. The cruciform technique is susceptible to stress concentrations but can be used to mimic different states of stress on balanced and unbalanced fabrics. In the studies discussed, stresses are normalized by the cross-sectional area under the assumption that the fabric is a continuum.
While the procedure of picture frame shear tests has been discussed, shear stress–strain results have not been published for airbag fabrics. In addition, other modes of shear deformations such as rail shear or shear under biaxially pre-stressed fabrics have not been investigated for airbag fabrics to date. Accordingly, the objectives of this study are to evaluate the nonlinear anisotropic mechanical properties and geometric properties of the airbag fabrics and thus establish the basis for future formulation of a constituent-based model capable of predicting the nonlinear in-plane behavior of the fabric under a variety of stress states. The procedures of obtaining geometric and material properties of the airbag fabric are carefully documented due to their importance in constituent-based models. The nonlinear anisotropic behavior of the fabric structure is evaluated in several deformation modes (to be specific, uniaxial, biaxial and shear) that will prove to be the basis of validating the fidelity of future models to capture the true behavior of air bag fabrics.
Materials and methods
Geometric and intrinsic properties of 350 dtex nylon 6,6 airbag fabric as determined from microscopy

Yarn extensions
To evaluate the mechanical properties of the yarns, namely failure strain and force–elongation behavior, extension tests were performed. The magnitude of crimp was also quantified using this method and compared to the values obtained through microscopy by recording the percent elongation at which the yarn becomes completely straight.
Warp and fill yarns were carefully extracted from the uncoated fabric sample by gently pulling away neighboring yarns in the weave structure. Yarns were sampled from different locations of the fabric roll to generate a global population and to avoid any possible localized effects. The sample population was 10 yarns in each of the warp and fill directions. A length of 150 mm (3 in) was marked off using a felt tip marker on the fabric and then the yarns were withdrawn, as shown in Figure 1. This procedure of marking the length on the fabric as opposed to measuring on an extracted yarn ensures that the gauge length references the yarn in its crimped condition, as seen in the fabric structure: a condition that is important to keep true if one wants to back calculate the percent crimp from the extension test.
Yarn specimen preparation procedure.
It should be noted that yarns were not taken from the coated fabric due to the degree of difficulty of peeling away the coating layer to get the yarns without causing significant damage to the yarns. It was also found that extracting lengths greater than 25 mm was near impossible due to the hindrance of the coating. Extension tests were attempted on a few samples that were suitable for testing; however, the reproducibility of the tests was not acceptable so they are not included in the study. The other potential test considered was testing a coated yarn, but since the coating does not penetrate the thickness of the fabric combined with the plain weave structure, the yarn is not continuously coated for lengths required for testing.
The yarns were mounted onto paper frames, as seen in Figure 1(c), using epoxy. The paper frame ensures the proper gauge length distance between grips preventing additional slack or causing a pre-stress in the yarn. Additional slack or smaller gauge length than the yarn extracted can cause erroneous results in the magnitude of crimp if one wanted to subtract the uncrimping stiffening from the load–elongation curve, a procedure that will be discussed later on. A larger gauge length can cause the yarn to stretch, causing a pre-stress in the yarn as well as providing incorrect results of the magnitude of crimp. A Kato Tech KES-G1 microtensile tester with a 5 kg load cell located at the Advanced Fibrous Materials Laboratory at The University of British Columbia was used to obtain force–displacement information of the yarn up to failure. Upon loading the sample into the grips, the paper frame is cut before extension is applied. The elongation rate was 2 mm/min at ambient conditions according to ASTM D 3883–04. 9
As the yarn is extended, the crimp in the yarn begins to straighten before the yarn undergoes stretching, a process commonly referred to as uncrimping. Obviously, this uncrimping of the yarn is a form of geometric stiffening that needs to be removed in order to obtain the “pure” mechanical response of the yarn. Figure 2 illustrates the technique of determining the geometric stiffening region of the force–elongation curve as specified by Option C of ASTM D 3883–04.
9
The straight line portion of force–elongation curve is extrapolated by line AB. Point A represents the magnitude of the crimp in the yarn and the elongation where the crimp is fully removed from the yarn. The Point C is obtained by constructing a line parallel to the Force axis from Point A. Point C corresponds to the tensile force required to remove crimp without stretching the yarn. The curve is graphically shifted so that Point C becomes the origin, therefore obtaining the pure force–elongation behavior of the yarn.
Procedure of obtaining “pure” yarn load–elongation response.
Fabric testing
Uniaxial
The uniaxial extension of fabric is often performed due to its simplicity and can be used to compare the stiffness of the warp and fill directions. The uniaxial tensile properties of the coated and uncoated fabrics were measured according to the modified strip tensile test method, as specified by ASTM D5035-95. Five samples taken in each of the warp and fill directions for both coated and uncoated fabrics were tested. The ends of the fabric were tabbed with layers of masking tape to protect that fabric from crushing at the grips. The specimen width was 25 mm with a gauge length of 100 mm. An Instron 1122 testing machine located in the Department of Zoology at The University of British Columbia was used for testing. The cross-head speed was 100 mm/min.
Biaxial
Biaxial extension experiments of coated and uncoated fabric samples were performed using a custom-made large load capacity biaxial tester (see Figure 3) located at the Hess Research Laboratories at Drexel University. The tester was designed with fibrous materials in mind, more specifically geotextiles, but is suitable for a wide range of textiles and composites that require large applied loads.
10
The tester consists of a servo-hydraulic test frame with two pairs of grip carriages oriented 180 degrees apart that move in equal and opposite directions. The carriages are driven by a 67 kN hydraulic actuator powered by a hydraulic manifold with high-pressure and low-pressure accumulators. Each actuator drives the grip carriages via connection arms. Each grip carriage has a dynamic range of motion of±10.2 cm and peak velocity of 30 cm/s. A 2.0 cm threaded rod extends from each carriage to be used as the grip attachment point. The grip widths are approximately 20.23 cm (8 in) wide and have pyramid-teethed attachment plates to provide sufficient grip. A computer system consisting of a digital controller running ANCO Engineer’s ANIPC-400 software controls the tester through a four-channel data acquisition system. A 32-channel analog-to-digital converter is used to obtain the data.
Biaxial tester at Drexel University.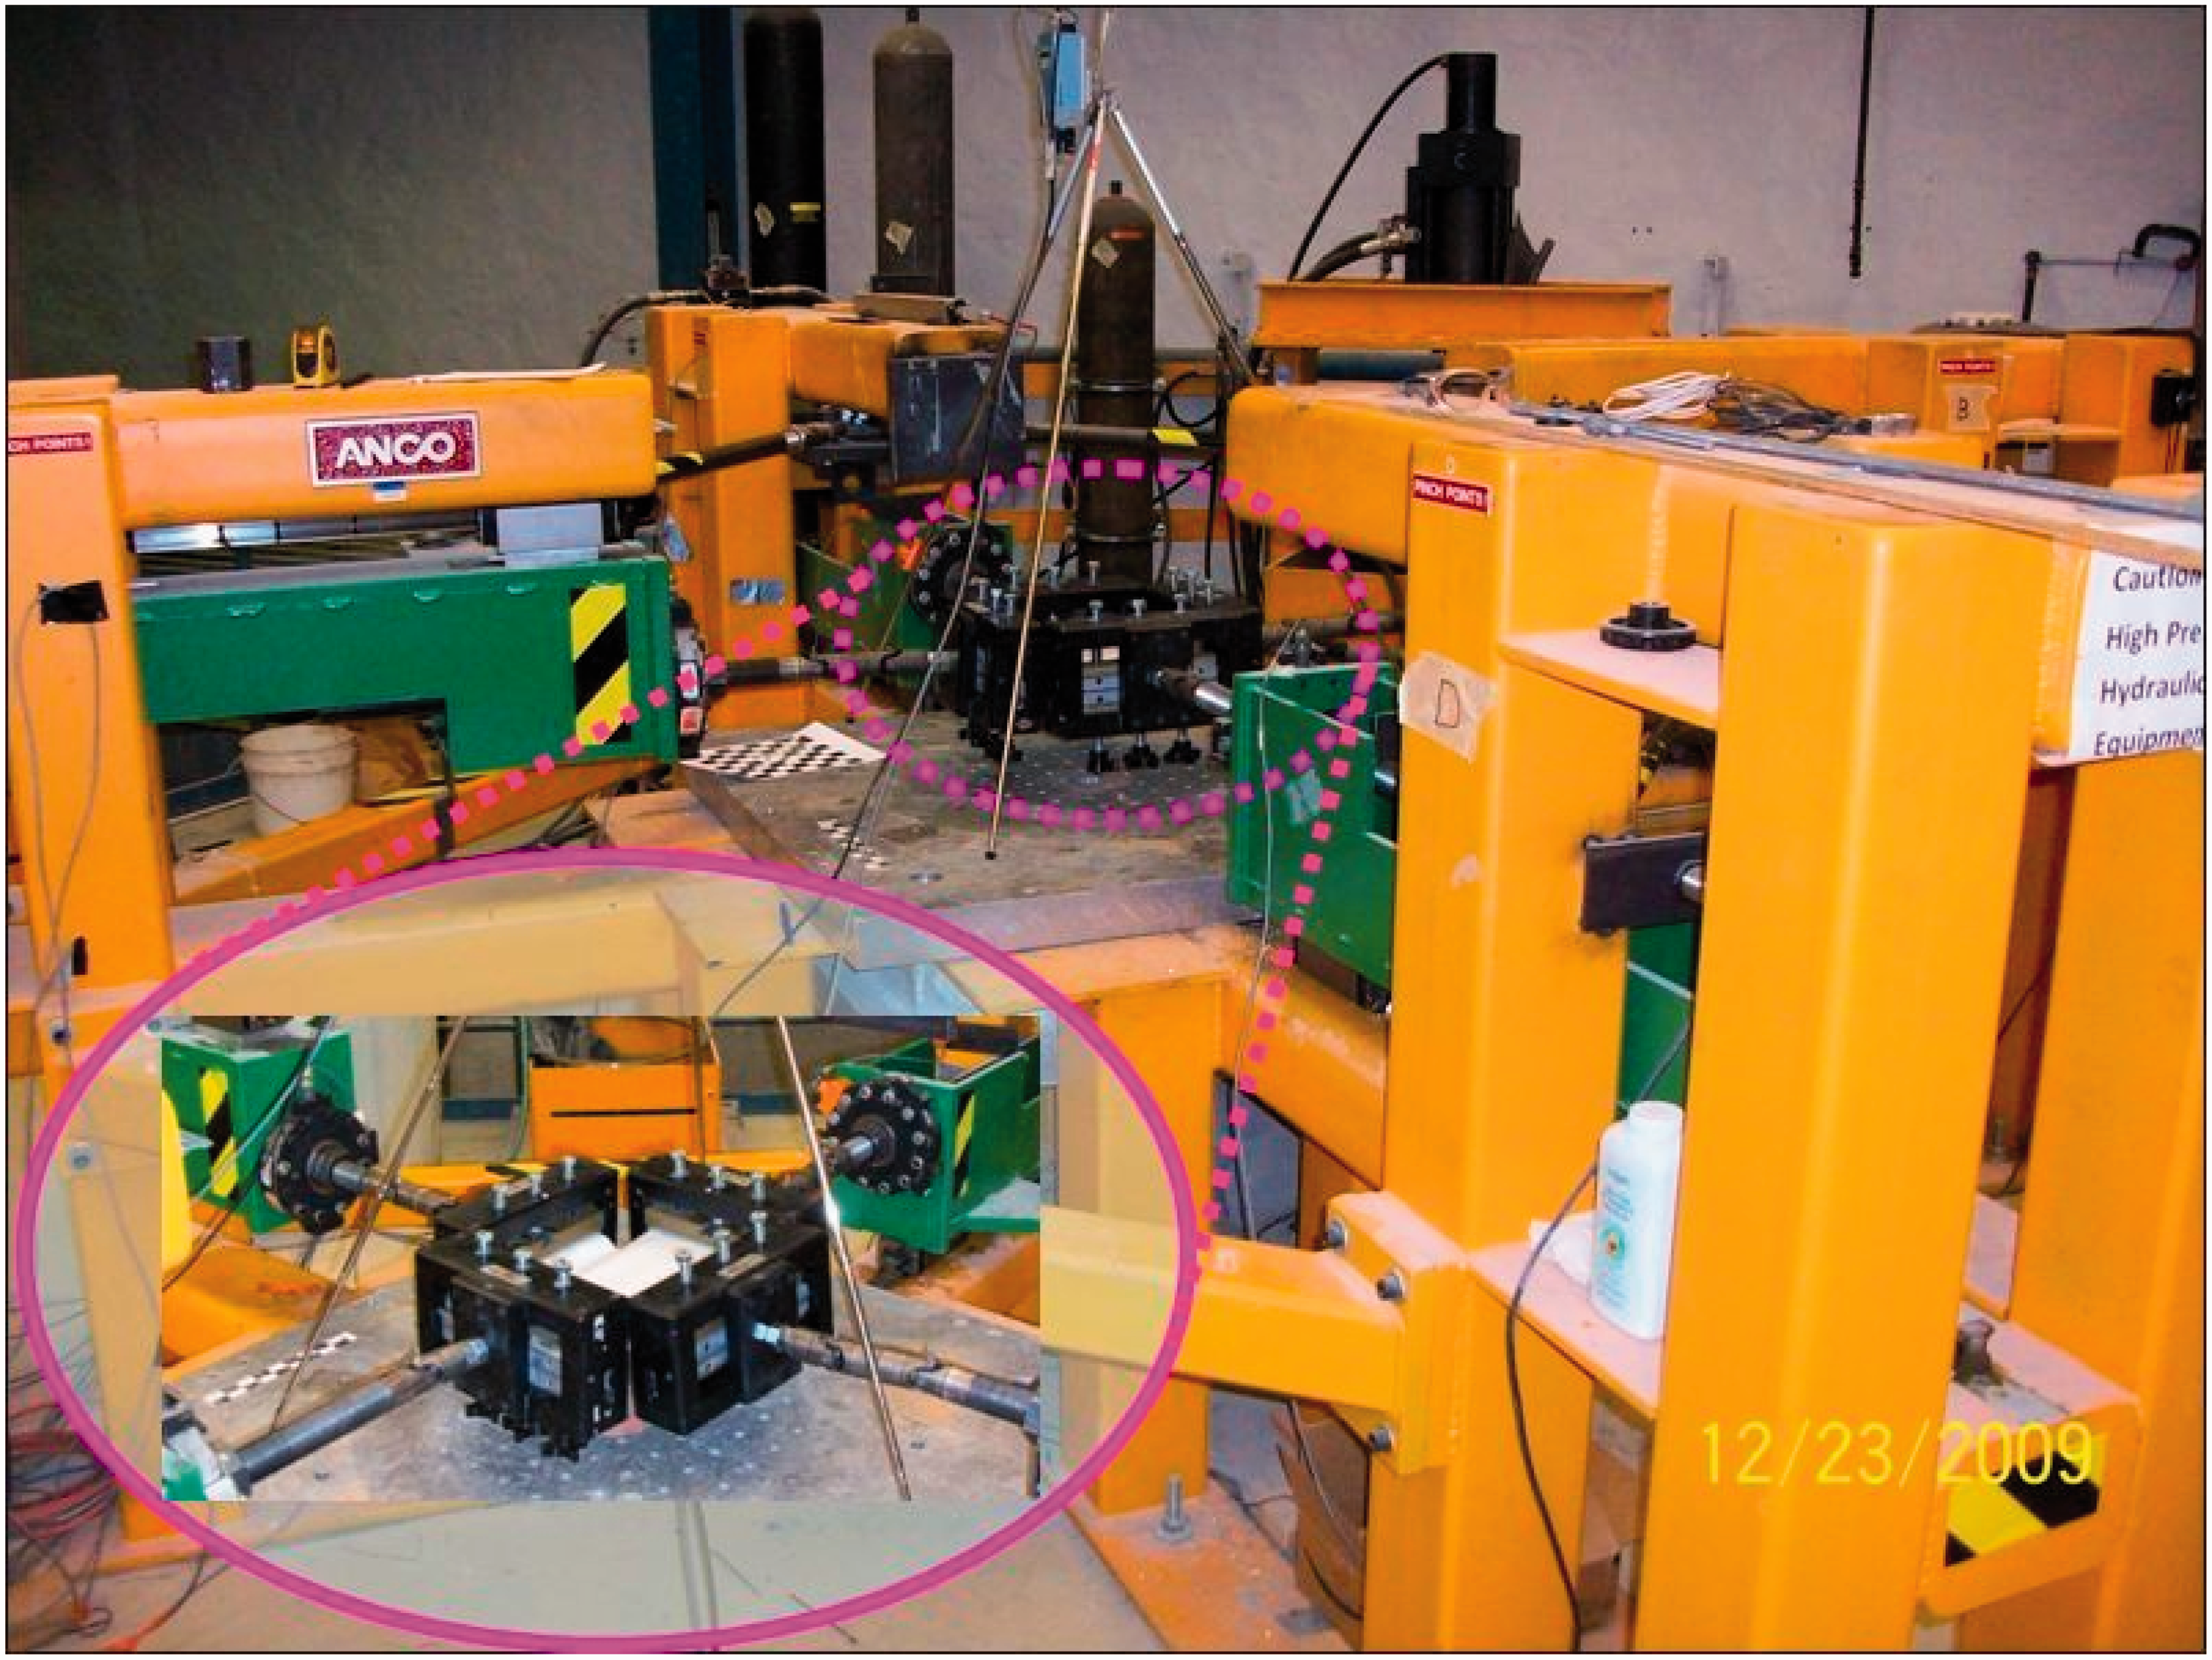
Specimens were cut into a cruciform shape, as shown in Figure 4, leaving a 20.32 cm × 20.32 cm (8” × 8”) test area. Great care was taken while cutting the sample to ensure the fabric remained orthogonal and true to the desired dimensions in order to avoid unwanted bias. Masking tape placed in layers was used as a grip tab to protect the fabric from being damaged by the grips. A sample size of five coated and five uncoated samples were prepared.
Biaxial specimen dimensions.
The alignment and calibration of the loading actuators was first performed. Using a straight edge and a laser level, each extender arm from the actuator was measured and adjusted to ensure each grip carriage and arm was equidistant. Upon confirmation of the actuator extensions calibration, the grip assemblies were attached to each arm and were checked to ensure that the grip slots were leveled. An overhead digital camera was placed over the sample to record (qualitatively measure) fabric displacements within the gauge length in addition to the recorded cross-head displacements.
An extension rate of 5 mm/s (2.5 mm/s per actuator) and a sample rate of 50 Hz were inputted into the digital controller. On a separate digital controller, the sampling rate of the overhead digital camera was defaulted at 2 Hz. Samples were loaded into the grip assemblies with the 5.08 cm grip tab fully inserted into the grip slot and secured. The orientation of the fabric (warp or fill direction) with respect to the load cells (A,B,C,D) was recorded. To ensure there was no bias or unbalance in the load cells, samples were rotated, as demonstrated in Figure 5, into different configurations so that the load cells had the opportunity to measure warp and fill directions during the duration of testing. Results from using this procedure show that there was no noticeable asymmetry between the load cells.
Biaxial testing specimen configuration.
A pretension of 44.5 N (10 lbs) was introduced to each actuator, which is equivalent to 2.2 N/cm (1.25 lbs/in) of stress imposed on the sample. The pretension is an ad-hoc procedure to eliminate excessive experimental noise obtained from the load cells early on in the testing sequence. The samples were loaded until final fracture. Upon completion of the test, the failed sample was removed and the alignments of the actuators were checked after the actuators had returned to their original positions. A new sample was placed into the grip fixtures and the loading procedure was repeated.
Bias shear
The bias extension test refers to the uniaxial extension of a rectangular fabric specimen that has been cut at 45 degrees to the yarn directions. The test is fairly simple to conduct compared to other methods used for shearing a fabric, such as the rail shear or picture frame test, and can provide reasonably reproducible results. One drawback is that the strain is not homogeneous throughout the sample in which three distinctive shearing zones can be identified. Referring to Figure 6, Zone A undergoes pure shear deformation until the yarns reach a jamming point. Zone B involves a mix of yarn extension and shear, while Zone C remains undeformed.
Heterogeneous deformation of fabric bias extension.
The bias tests were performed on the Instron 1122 tester at room temperature with a digital camera mounted onto a tripod to record the shear angle at the center of the specimen, as shown in Figure 7. The camera recorded video at 30 frames per second at a resolution of 640 × 460 pixels. The video started to record before the extension was performed and a clicking noise that acts as an audio marker was made simultaneously when the Instron loading was engaged. Using the audio marker, the video images can be correlated to an exact data point recorded by the Instron. Data acquisition from the Instron was performed at 100 Hz. A 500 kg load cell was installed and an extension rate of 60 mm/min was used. After jamming, the samples started to slip out of the grips and therefore they were not tested to failure. Since the low-level shear behavior is of interest, the range of data obtained when the specimen slips at higher shear strains is ignored. The angle of the lower corner of the center square marked off on the specimen is measured using the software ImageJ.
Bias extension–apparent shear angle recording set-up.
Results and discussion
Figure 8 shows the average force–elongation curves. Overall, the tests were reproducible, which suggests the yarn responses are uniform throughout the fabric and there are no regional effects. All yarns failed within the middle of the specimen, away from the grips. The average failure strains were 21.35% and 20.81% for the warp and fill yarn, respectively. The average failure load was 21.12 and 20.18 N. The average crimp for the warp and fill yarns obtained from the procedure specified by ASTM D3883 was found to be 6.33% and 8.74%, respectively.
Average force–elongation curve for 350 dtex nylon 6,6 airbag yarn.
It can be seen from Figure 8 that the yarn exhibits a hyperelastic-like behavior that includes a high initial modulus, a transition period where the stiffness decreases and then undergoes higher stiffening at higher strains until failure. This behavior arises from the semicrystalline structure of nylon polymer fibers. As a tensile load is applied to the yarns, crystalline block segments separate from the lamellae in the polymer and both block and tie chains become oriented in the direction of the tensile axis, which results in stiffening of the polymer.
One may argue that it may be more beneficial to test non-crimp yarns (i.e. yarns that have not been processed into fabric) to reduce the geometric stiffening effect from decrimping. While this would reduce the amount of work associated with sample preparation and post-processing of data, this approach would not capture any additional drawing that the polymeric yarns may undergo during the warping process. From Figure 8, it can be seen that the warp yarn is stiffer and fails at a higher load. Considering the warp and fill yarns are identical in terms of linear density and filament count, additional drawing of the warp yarn from manufacturing is a plausible explanation for the difference in mechanical behavior of the two yarn directions. In the end, the obtained response can be considered ex situ as we have obtained the response of the yarn from a processed fabric. Of course there may be some behaviors, namely failure stress and strain, which are affected by the in situ environment of the fabric. Pan 11 and Shahpurwala and Schwartz 12 have discussed some of the in situ variables that can impact yarn, such as pressure-independent adhesion, a frictional component dependent on the confinement pressure of the yarn and statistical distribution of fiber strength.
The values of crimp for the warp and fill yarns found using the extension tests are close to the values obtained using the sectioning method. The extension test is advantageous over the section method for obtaining values of crimp for large sample populations of yarn since there is minimal sample preparation, testing and processing. However, the method is sensitive to keeping the proper gauge length. The sectioning method can be time consuming for large sample populations considering the effort of cutting samples, casting them in epoxy, polishing and imaging. However, the images obtained can be used to measure crimp with a high level of assurance, assuming the fabric sample does not undergo dimensional changes from handling or the epoxy environment.
Uniaxial extension
The stress–strain curves in the warp and fill directions for the coated and uncoated fabric samples are shown Figure 9. The stress is normalized based on a membrane assumption, simply corresponding to the force divided by unit length. The vertical error bars show the maximum and minimum stress values at selected data points. The horizontal error bar at the failure point illustrates the minimum and maximum failure strains recorded. Failure occurred within the middle of the gauge length indicating uniform stress distribution. Overall the tests were very reproducible. The sample population for the uncoated sample was reduced to four, since one of the specimens had broken near the grip.
Average uniaxial stress–strain curve of 350 dtex fabric.
From Figure 9, it can be seen that there are no discernible differences between the deformational behavior of coated and uncoated samples. This is consistent with the observation made in the biaxial extension tests (see the following section). The uniaxial response is characterized by a sigmoidal shape that consists of a low initial modulus followed by gradual stiffening into high linear modulus.
Biaxial extension
The load data recorded had some inherent noise that was eliminated using a moving average filter. The average membrane stress–strain curve is shown in Figure 10, where similar assumptions and nomenclature to those employed in the construction of Figure 9 have been adopted. Overall, the biaxial response for the coated and uncoated samples was shown to be reproducible. The failure mode of the fabric was tearing, which initiated at the corners of the samples. A comparison between the uniaxial and biaxial results reveals that fabrics under uniaxial loading have higher failure stresses but lower apparent modulus.
Average biaxial stress–strain curve for coated and uncoated samples.
The fabric under biaxial extension exhibits a hyper-elastic like behavior very similar to the yarn behavior exemplified by a high initial modulus, with some softening before stiffening into a high linear modulus until failure, as seen in Figure 10. There is no drastic change in extensional properties between the coated and uncoated samples. This is to be expected, since the silicone coating has a considerably lower stiffness compared to the yarn system. However, it was also observed during the experiments that the coated fabric fractured at a lower strain than the uncoated fabric. The probable cause of the discrepancy of the failure points between the coated and uncoated sample is due to the difference in the stress concentrations seen in the corners of the samples. The difference lies in the prohibitive nature of the coating to resist in-plane yarn rotation and sliding. Qualitatively, yarn sliding at the edges of the sample apparent by fraying of the edges occurs in the uncoated fabric, which can be seen from the photographs taken and shown in Figure 11(a). This sliding and rotation allows the yarns to conform to the load path putting less stress on the yarns. On the other hand, in Figure 11(b), the coated fabric’s edges have no fraying. In addition, the edges have a slight curvature caused by crimp interchange between the warp and fill yarns due to the no slip condition.
Photographs of biaxial extension at approximately 12% strain for (a) uncoated and (b) coated fabrics.
Bias extension
Figure 12 shows the average load–elongation behavior of the coated and uncoated bias fabric samples. At low levels of extensions, the coated samples exhibit a stiffer behavior than the uncoated fabric. After about 20 mm, the stiffnesses of the coated and uncoated fabric are almost identical.
Load–elongation of bias coated and uncoated airbag fabrics.
Figure 13 shows the average applied specimen stress and shear angle results for the coated and uncoated specimens. To be clearer, the y-axis (applied shear stress) is the load recorded by the Instron normalized by the specimen width and the x-axis (shear angle) is the measured change in angle of the center square. The alphabetic markers (A, B, … , G) signify the correlated video snapshots shown in Figure 14 for the coated fabric and Figure 15 for the uncoated fabric so that the stress–strain curve can be referenced with respect to the observed deformed configuration of the sample. The Point of Reference (P.O.R.) where the center shear angle was measured is indicated in the first frame. Since the camera position moved during the testing, it is not possible to superimpose semi-transparent images to illustrate the average deformed configuration of the sample. Therefore in the construction of Figures 14 and 15, the sample whose applied stress–strain response was closest to the average is referenced.
Bias shear – applied specimen end stress versus center specimen shear angle. Typical bias shear deformation sequence – 50 mm × 100 mm coated sample. Typical bias shear deformation sequence – 50 mm × 100 mm uncoated sample.


The horizontal error bars at each data point represent the deviations that occur mostly due to human error in measuring shear angle and effects that result in yarn slippage. The error in the shear angle for both specimens is acceptable, although the uncoated samples exhibit higher strain error. Overall, Figure 13 attempts to quantify the local shear deformation of the pure shear deformation zone as opposed to the total elongation of the sample, which is mainly a global response.
It can be observed that at lower levels of shear strain there is a significant difference in the deformational behavior of the coated and uncoated samples. Figure 16 better illustrates this low shear strain behavior for both of the fabric sample sizes tested. It can be observed that the coated fabric has a much higher initial shear stiffness compared to the uncoated fabric. While the coating has a low Young’s modulus and is very thin, it still seems to inhibit yarn rotation during low shear strains. At higher shear strains, the coated fabric starts to behave similarly to the uncoated sample, having a region of low shear stiffness before dramatically stiffening when the yarns have rotated into a jammed (locked) condition.
Detailed low shear angle plot of applied stress versus center shear of the bias sample.
Conclusion
In this study the mechanical properties of plain woven airbag fabrics consisting of nylon 6,6 yarns with a linear density of 350 dtex were evaluated both at the yarn level and the fabric level through a series of uniaxial and biaxial tensile tests carried out at quasi-static rates of loading. The yarn stress–strain behavior was found to be highly nonlinear, signified by a low initial modulus at low strains followed by a gradually stiffening behavior at higher strains. The stress–strain behavior of the fabrics with and without coating under uniaxial and biaxial loading was found to be nonlinear and anisotropic at certain strain levels. In uniaxial loading, nonlinearities of the fabric occur at lower strains due to geometric deformation within the fabric. In biaxial loading, the nonlinearity occurs at low and intermediate strains associated with the combination of the nonlinearity of the yarn material and geometric changes in the fabric structure. In the design and modeling of the mechanical response of airbag fabric and restrain systems, these nonlinearities must be taken into consideration.
The intent of this paper is to illustrate the nonlinear anisotropic mechanical properties and geometric properties of the airbag fabric that have not been shown in the literature to date. Having information about the constituent properties can be very useful in developing material models for simulating the behavior of the fabric. In a future publication by the authors, a constituent-based model to predict the nonlinear in-plane behavior of the fabric under a variety of stress states will be presented. The macro-scale experiments performed on the fabric will be the basis for validating such a model.
Footnotes
Acknowledgements
We especially appreciate the assistance provided by Dr Chuan Lee of TRW. The authors would also like to thank Dr Joseph Wartman and David Harmanos of the Department of Civil Engineering at Drexel University and Dr John Gosline and Dr Ken Savage from the Department of Zoology at UBC for sharing their facilities and aid during the experiments.
Declaration of conflicting interests
The authors declared no potential conflicts of interest with respect to the research, authorship, and/or publication of this article.
Funding
The authors disclosed receipt of the following financial support for the research, authorship, and/or publication of this article: This work was supported by TRW Automotive through an unrestricted research grant and the Natural Sciences and Engineering Research Council of Canada (NSERC) through Discovery Grants awarded to the second and third authors.