



Abstract
The preforming step, which is the first stage of the RESIN Transfer Molding process, has been analyzed by many experimental or numerical approaches in the literature for reinforcements made of synthetic fibers. The complex mechanical behavior of a flax-based plain weave fabric was studied with the view to investigate its formability. Non-linearities in the fabric tensile behavior were observed. A preforming numerical finite element tool was used and validated by performing comparisons between experimental and numerical results. Different tensile behavior models (linear and strongly non-linear) were implemented to investigate their effect on the final shape characteristics. The tool was also used to investigate the effect of the process parameters on the computed preform shape (shear angles and draw-in) for both implemented tensile behaviors. Results show that better correlations take place when using the non-linear tensile behavior. This therefore demonstrates the importance of taking into account non-linearities in the tensile reinforcement behavior while simulating the forming of woven textile reinforcements.
The mechanical properties of Natural Fiber Composites (NFCs) have been the subject of many review works1–8 with analyses at different scales. Some authors have focused their works at the scale of individual fibers (microscopic scale), and identified parameters that influence the mechanical behavior in tension.9–14 In these studies, some of them are focused on non-linear behavior. Placet et al. 11 developed some explanations for hemp fibers, valid at this scale, on the origin of this non-linear tensile behavior. Shah et al. 15 and Baets et al. 16 studied the non-linearity of plant fiber composites. However, if the mechanical behaviors at the scale of the individual fiber and also at the scale of composites are well described, the mechanical behavior of thread, yarns, roving, or dry fabric is less addressed in the literature. Non-linearity in the tensile behavior of quasi-aligned fibers yarns has been underlined in the first part of the load–strain curves. 15 Beyond this, the degree of twisting in yarns15–18 as well as fiber entanglement in untwisted yarns are the main origins, for low values of load, of the non-linear zone. At the scale of the fabric, a non-linear zone in the tensile behavior of dry woven fabrics is classically described in the literature, for glass or carbon woven fabrics.19,20 This phenomenon is due to the woven nature of the preform and especially to the interlacement. 21 Indeed, weaving involves yarn crimp and biaxial behavior. 22 For natural fiber reinforcements loaded in tension, Ouagne et al. 23 showed that the non-linearity zone is consequent.
The subject of this study deals with the importance of taking into account the non-linearity of the fabric tensile behavior for the modeling of the preforming step of dry or comingled fabrics prior to impregnation by the RTM (RESIN Transfer Molding) or thermo-compression processes. The RTM process consists of injecting a low-viscosity resin in a fibrous reinforcement, initially preformed,24,25 whereas thermoforming consists of applying simultaneously a temperature and a compaction pressure to the fabric. Previous numerical 26 and experimental 27 studies have shown that forming defects28–32 may appear and have a strong influence on the resin flow impregnation within the fabric.33–37 Consequently, performances of the composite part may be seriously impacted.38,39 To simulate the appearance of these defects during the forming process, the development of appropriate constitutive models that can accurately represent the behavior of textile fabrics resulting from complex reorientation and redistribution of yarn fibers 40 is a main challenge. Due to the multiscale nature of textiles and despite a lot of research in this field, 41 there is no widely accepted model that describes accurately all the main aspects of fabric mechanical behavior. If some constitutive laws, based on hypoelastic or hyperelastic approaches, take into account non-linearity of the behavior,40,42–45 the influence of the non-linearity part of the fabric tensile behavior has not been analyzed during the simulation of the preforming step to the author’s knowledge.
In this study, a description of the used flax woven fabric and the device to identify the mechanical behavior is first carried out. In the second part, a simple constitutive model of behavior developed in Abaqus software to simulate the preforming stage is described. Comparisons between computed and experimental preforming results are performed to validate the numerical approach and the developed numerical tool has then been used to analyze the importance of taking into account the non-linearity in the fabric tensile behavior for the simulation of the preforming of woven textiles.
Materials and mechanical characterization
The flax fabric used in this study is a plain weave fabric with an areal weight of 458 ± 9 g/m2, manufactured by Groupe Depestele (France). The fabric is made of rectangular flat untwisted tows (Figure 1). Before the weaving phase, the fibers were extracted from the stem by following traditional scutching and hackling procedures. As a flat tow approach is used by the manufacturer, the fibers are globally aligned (even if some entanglement can be observed) and a natural binder is used to keep the cohesion of the yarn with the view to support the effort they are submitted to during the weaving phase. No space is visible between the weft tows, whereas the space between the warp tows is 0.43 ± 0.09 mm. The widths of the warp and the weft tows are, respectively, 2.0 ± 0.2 mm and 2.7 ± 0.3 mm. As a consequence, there are 403 warp tows and 370 weft tows per meter of fabric. The linear mass of the warp and the weft tows are, respectively, 551 ± 8 g/km and 624 ± 10 g/km. This fabric has been tested during the preforming step on complex shapes, such as a tetrahedron.
30
In-plane shear is the main deformation mode taking place during draping on a double-curved surface. The in-plane shear mechanical behavior has been intensively studied, mainly using picture frame and bias extension tests.46,47 To identify the fabric mechanical behavior, uniaxial tensile tests and bias extension tests can be performed. Uniaxial tensile tests are realized at a speed of 2 mm/min on samples of 150 × 70 mm2 according to the experimental procedure exposed by Hivet et al.
47
To get rid of slack a pre-tension of 2 N is applied to the fabric.
The plain weave flax fabric used.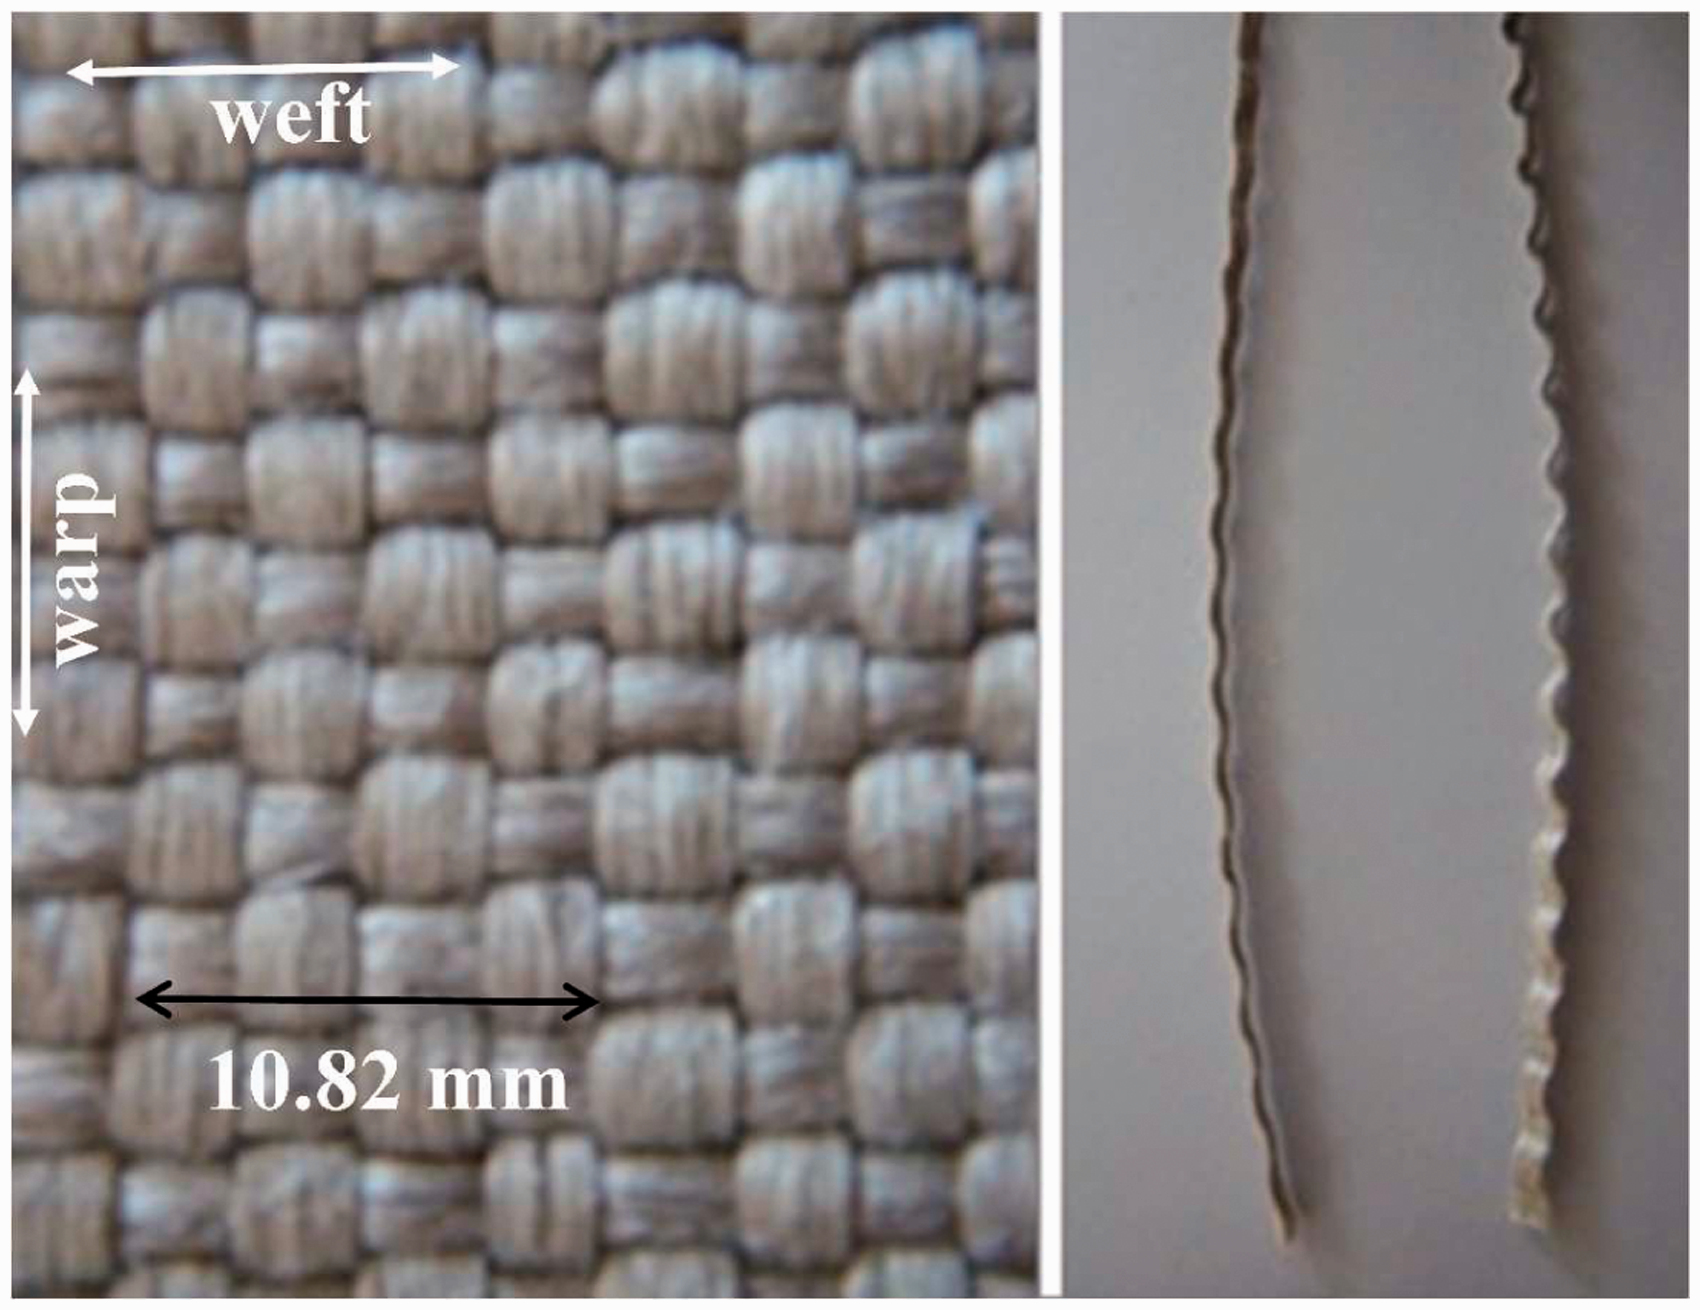
Figure 2 shows the tensile behavior of the fabric in each direction (warp and weft). Each point represented in the curve is the mean values of five tests performed in each direction. The standard deviations are presented in Figure 2. The tensile behaviors of woven fabrics are non-linear mainly because of the woven nature of the fabric that implies crimp. In our case, the non-linear zone is particularly important because a plain weave fabric exhibiting high levels of crimp is used. In the case of this work, the level of crimp is particularly high because almost no space between two adjacent warp or weft yarns is observed.
Load–displacement curves in warp and weft directions. Picture of the uniaxial tensile test.
The constitution and the mechanical behavior of the flax yarns used in this work were studied in detail by Moothoo et al., 17 who showed that the technical fibers are slightly entangled and therefore not as well aligned as in calibrated synthetic materials. Moreover, the fibers are held together by a natural binder to achieve the cohesion of the flat yarn. As a consequence, the bending stiffness of the flat yarn is higher than that of an equivalent glass or carbon product and this results in a supplementary increase of the crimp and of the non-linearity levels. The use of natural fiber-based fabric, such as the one presented in this work, therefore implies large crimps that are the main phenomena at the origin of the tensile non-linearity.
Figure 2 also shows the unbalanced behavior of the fabric in both directions. In the weft direction the non-linear behavior is more pronounced than in the warp direction, because these yarns are submitted to more interlacements, which is due to the higher number of warp yarns per unit length. This is the direct consequence of the fact that the warp yarns are of a lower width than the weft yarns. A higher crimp and therefore a higher non-linearity of the weft yarns tensile behavior take place. Moreover, the slopes of the final linear part of the curves are not identical in each direction.
The in-plane shear behavior was characterized by using the bias extension test on five samples. Figure 3 shows the shear load–displacement curve, with the associated standard deviations. The experimental procedure followed recommendations given in previous studies.47,48
In-plane shear curve load–displacement with a picture of the bias extension test.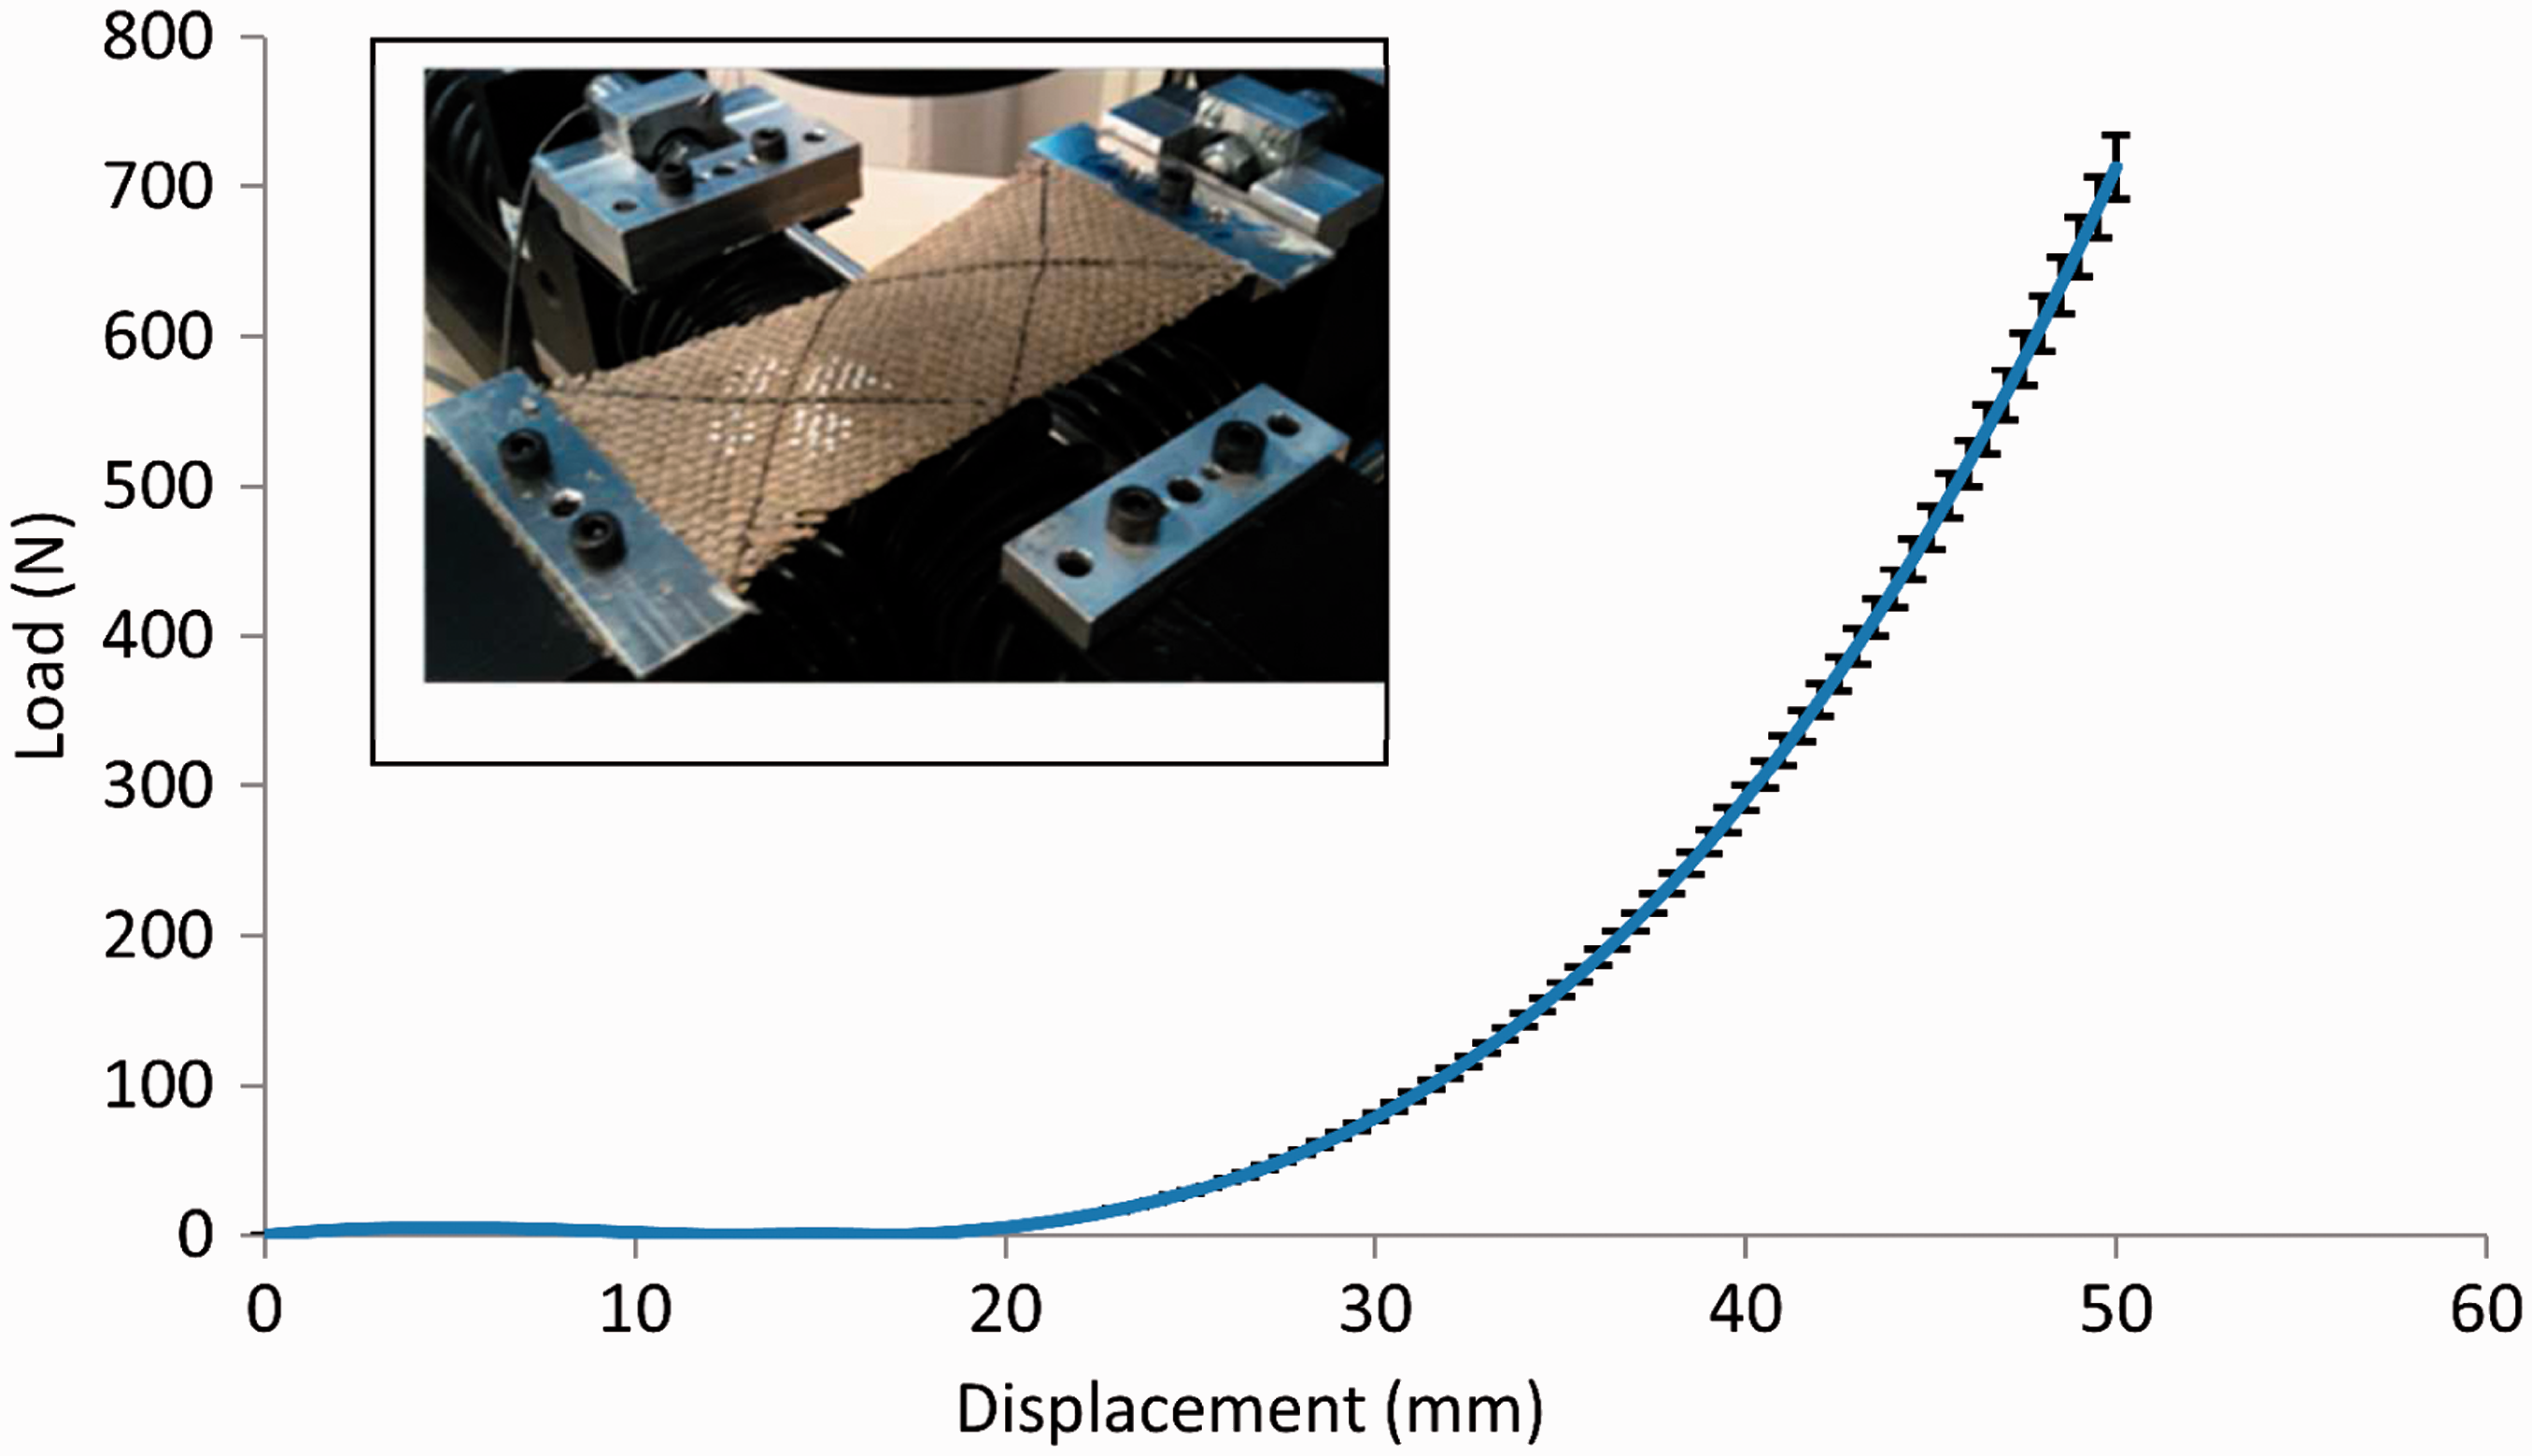
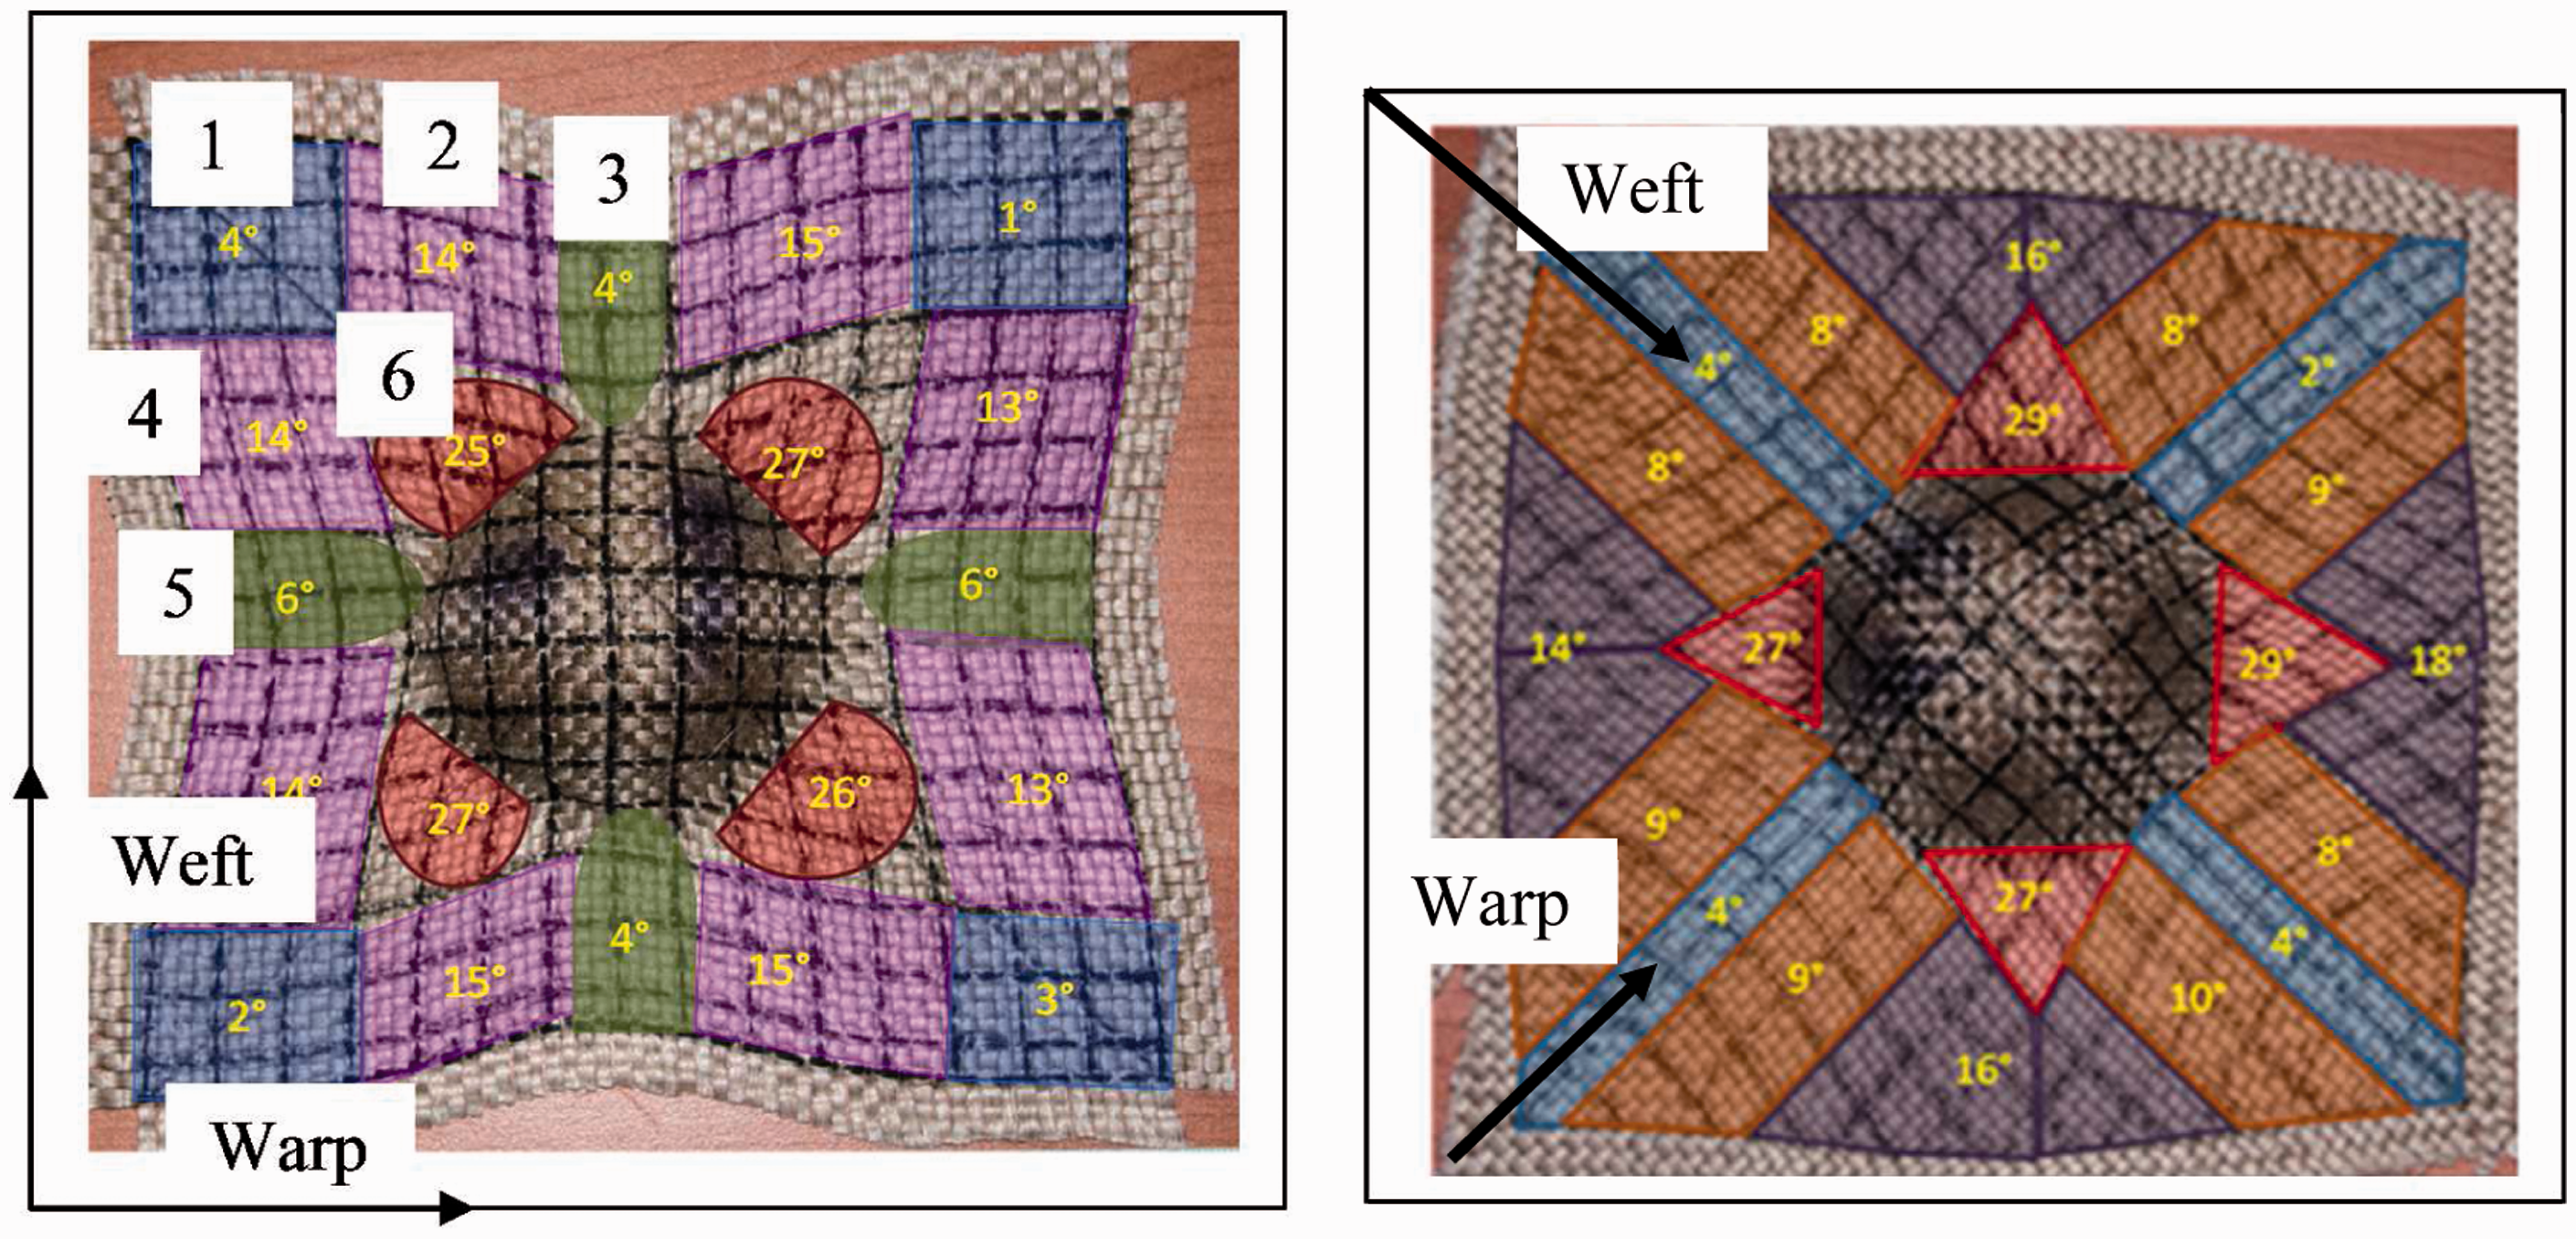
In addition to the in-plane characterization phase, sheet forming tests using a hemispherical punch were performed on a specific device described in Figure 4(a).49–51 A simple shape was used in this work to validate the numerical model described in the second section of this paper. For the test, a ply of the plain weave flax fabric was placed between the circular blank-holder controlled by four pneumatic jacks that adjust the pressure. In order to monitor the important forming parameters, such as the fabric draw-in, the in-plane shear, etc., by optical measurements, an “open-die” forming system has been used. Another electric jack imposes the punch displacement. Dimensions of the tools are described in Figure 4(b). For this test, a 0.05 MPa blank-holder pressure was applied (i.e. a load of 625 N) for a displacement of the punch equal to 17.42 mm. Two initial orientations of the fabric denoted by 0/90° and ±45°, specified in Figure 5, have been considered. Material draw-in along the contour and shear angles at selected regions along a path on the deformed fabric have been selected for quantitative comparison between the experimental and the simulated forming tests. A global shape of the preform is presented in Figure 5 with a map of the shear angles measured (with a precision of ±1°) for each orientation. For the 0/90° orientation (Figure 5(a)), the shear angle zones are numbered and constitute a comparison basis with the simulation results.
Experimental preforming device. (b) Dimensions of the tools. Experimental preforming. Global shapes and map of in-plane shear angles measured. (a) Orientation 0/90. (b) Orientation ±45°.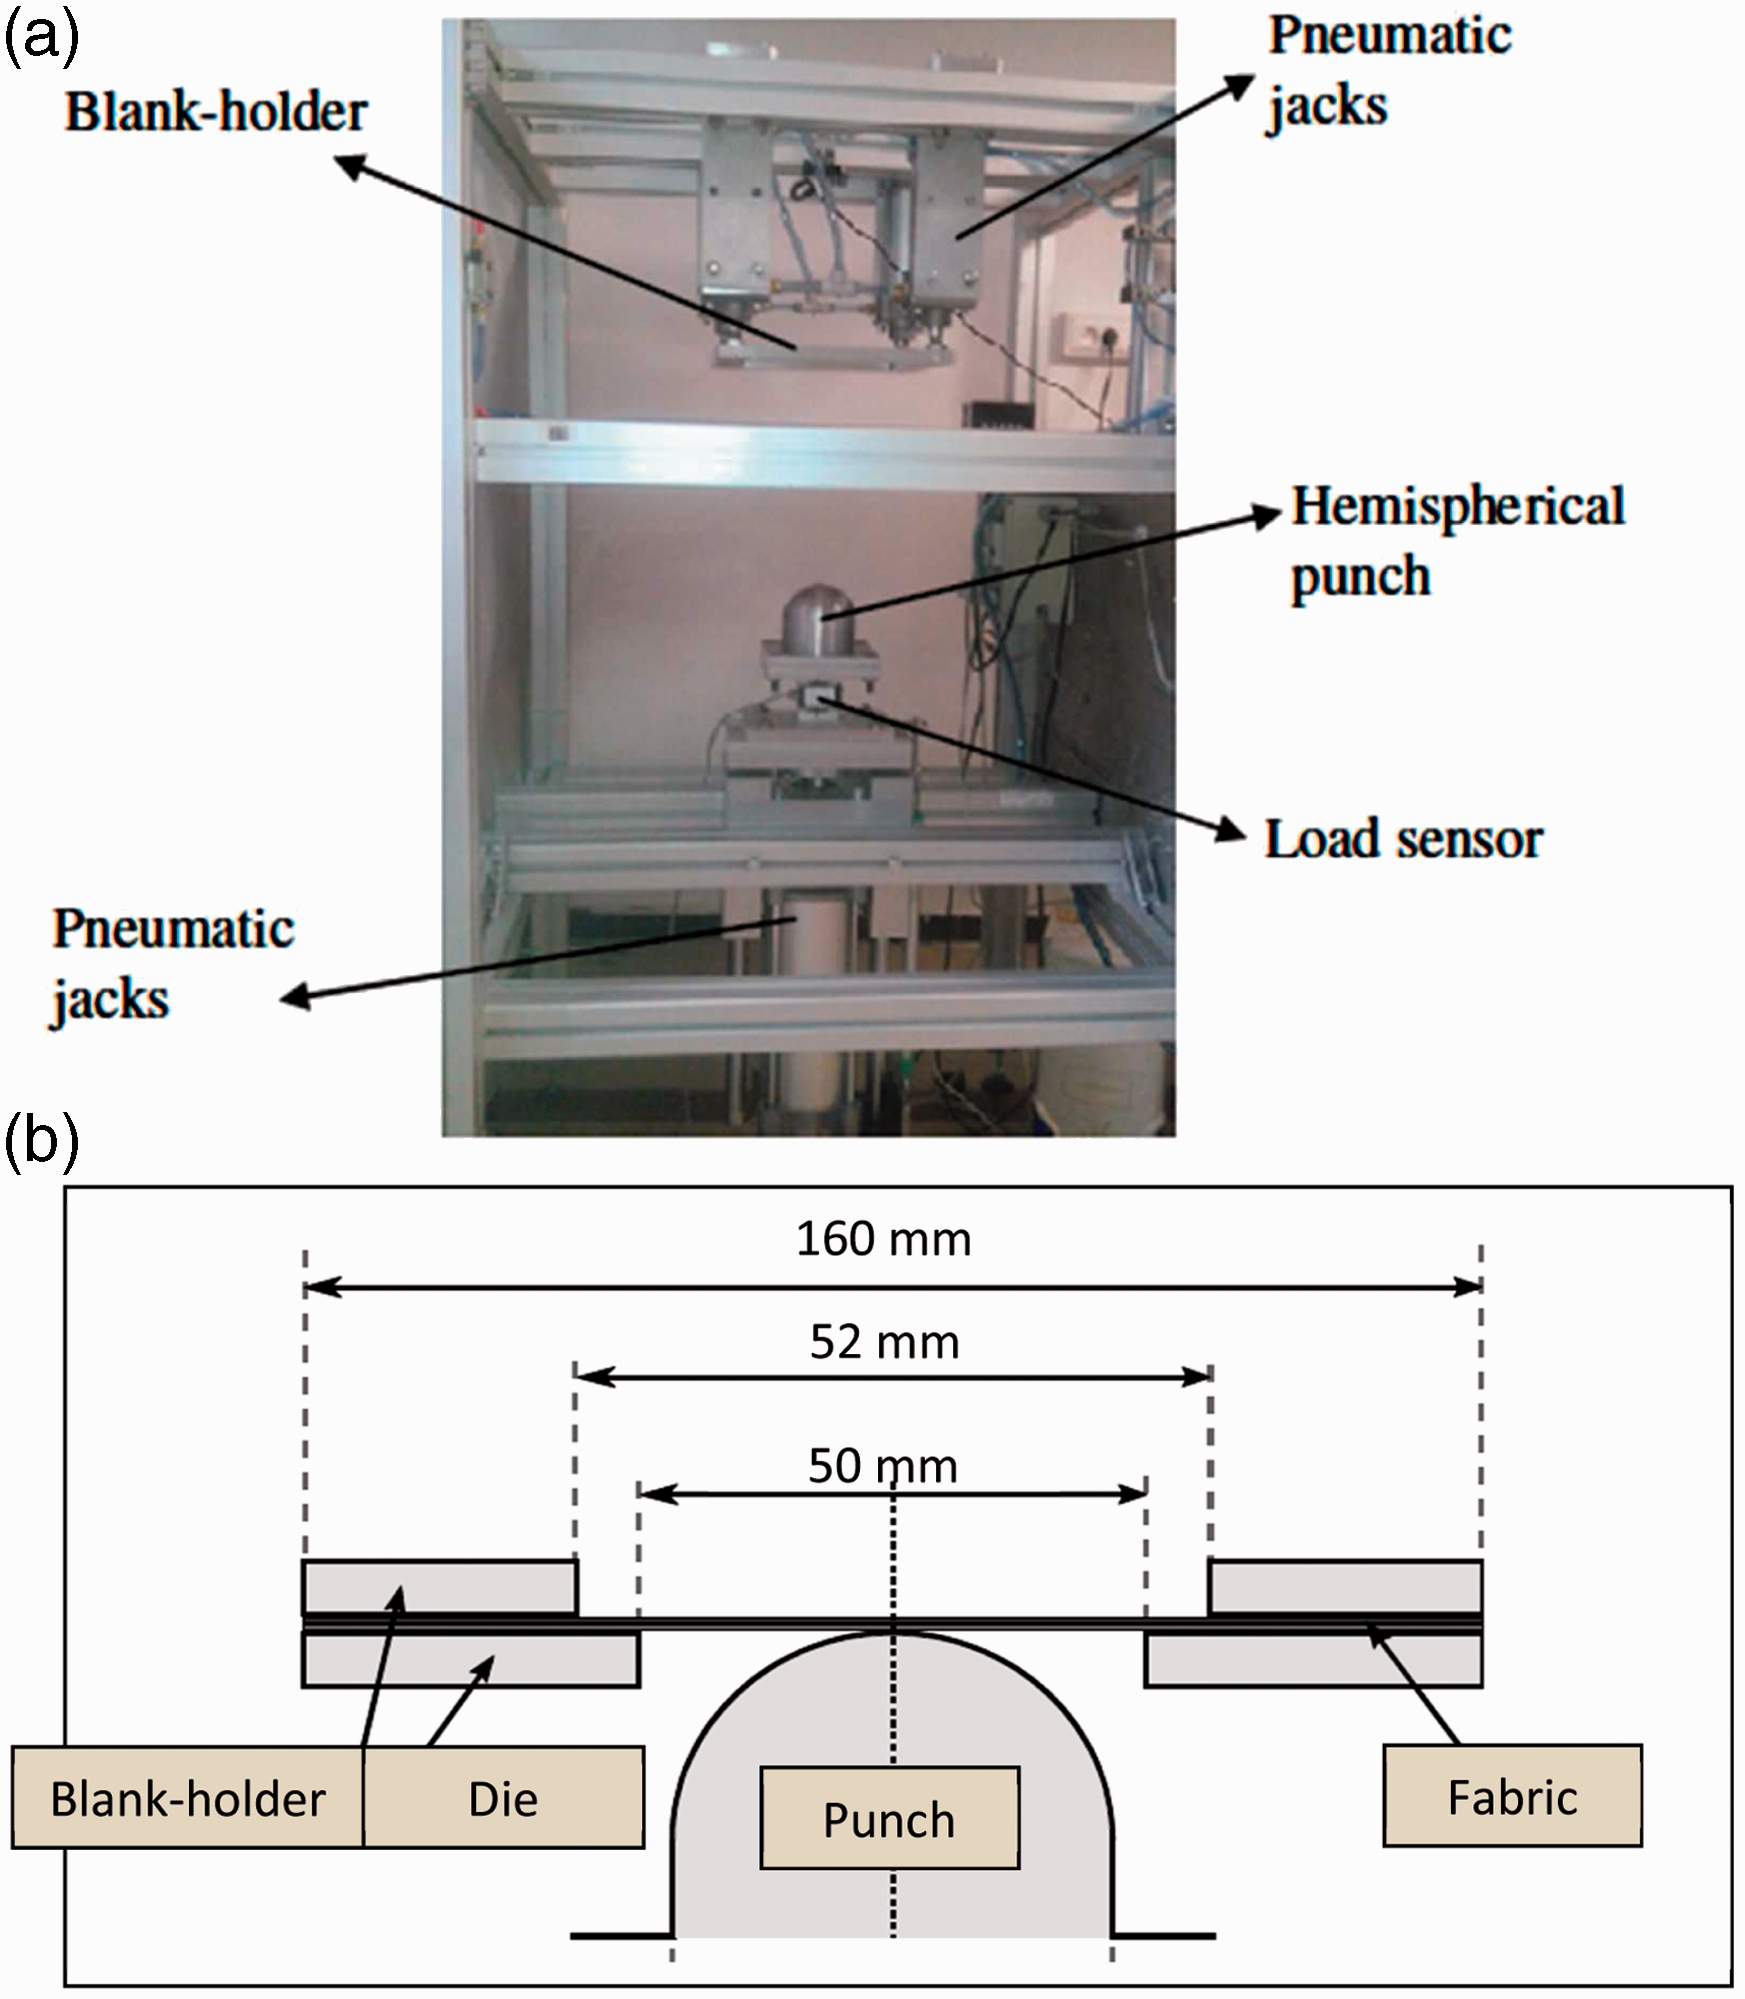
Development of a simulation model taking into account the non-linear behavior
To model fabric draping, different methods based on mapping approaches, such as the kinematical models, were developed. In this model, the yarns are considered inextensible and pin-jointed at crossover points with no relative slippage. The fabric is draped like a “fishnet” on the tool.52,53 These approaches are fairly efficient, especially in the case of hand-operated draping of classic fabrics or prepregs. However, they do not take into account the mechanical behavior of the fabric and the loads on the boundary that can be very important to achieve a correct draping. To analyze the influence of the non-linearity and the unbalanced property of the fabric on the preforming stage, an approach based on the finite element method26,41 was used.
In the present paper, a simplified method to simulate the preforming process is used with the aims to predict global preform deformation and shear angle distribution with reasonably short calculation times. This method has been developed by Najjar et al.49,50 It is based on the superposition of a discrete approach to model the tensile behavior and a continuum approach to take into account the in-plane shear behavior and contact with the tools. A “unit cell” (Figure 6) is built using elastic isotropic shell elements and axial connectors between nodes along the edges of the shell element, as opposed to bar and beam elements used by Jauffrés and Sherwood.
54
Unit cell for the finite element model constituted of a shell element and connectors.
In a first approximation, the shell element is considered as isotropic linear elastic and characterized by three parameters: shell thickness (t), Young’s modulus (E), and Poisson’s coefficient (ν). The identification of these parameters for the in-plane shear behavior consists of simulating the bias extension test by the finite element model and determining, by the optimization method, the values that minimize the quadratic error with the experimental curves. Figure 7 shows the result of this procedure in terms of shear simulation load–displacement curves obtained with different values of the Young’s modulus for the shell element. The simulation results are compared to the experimental curves determined from the bias-test. One can demonstrate that the choice of the shell thickness and Poisson coefficient do not have much influence on this in-plane shear behavior.49,50
Simulation of the bias extension test. Identification of the Young’s modulus for the shell element.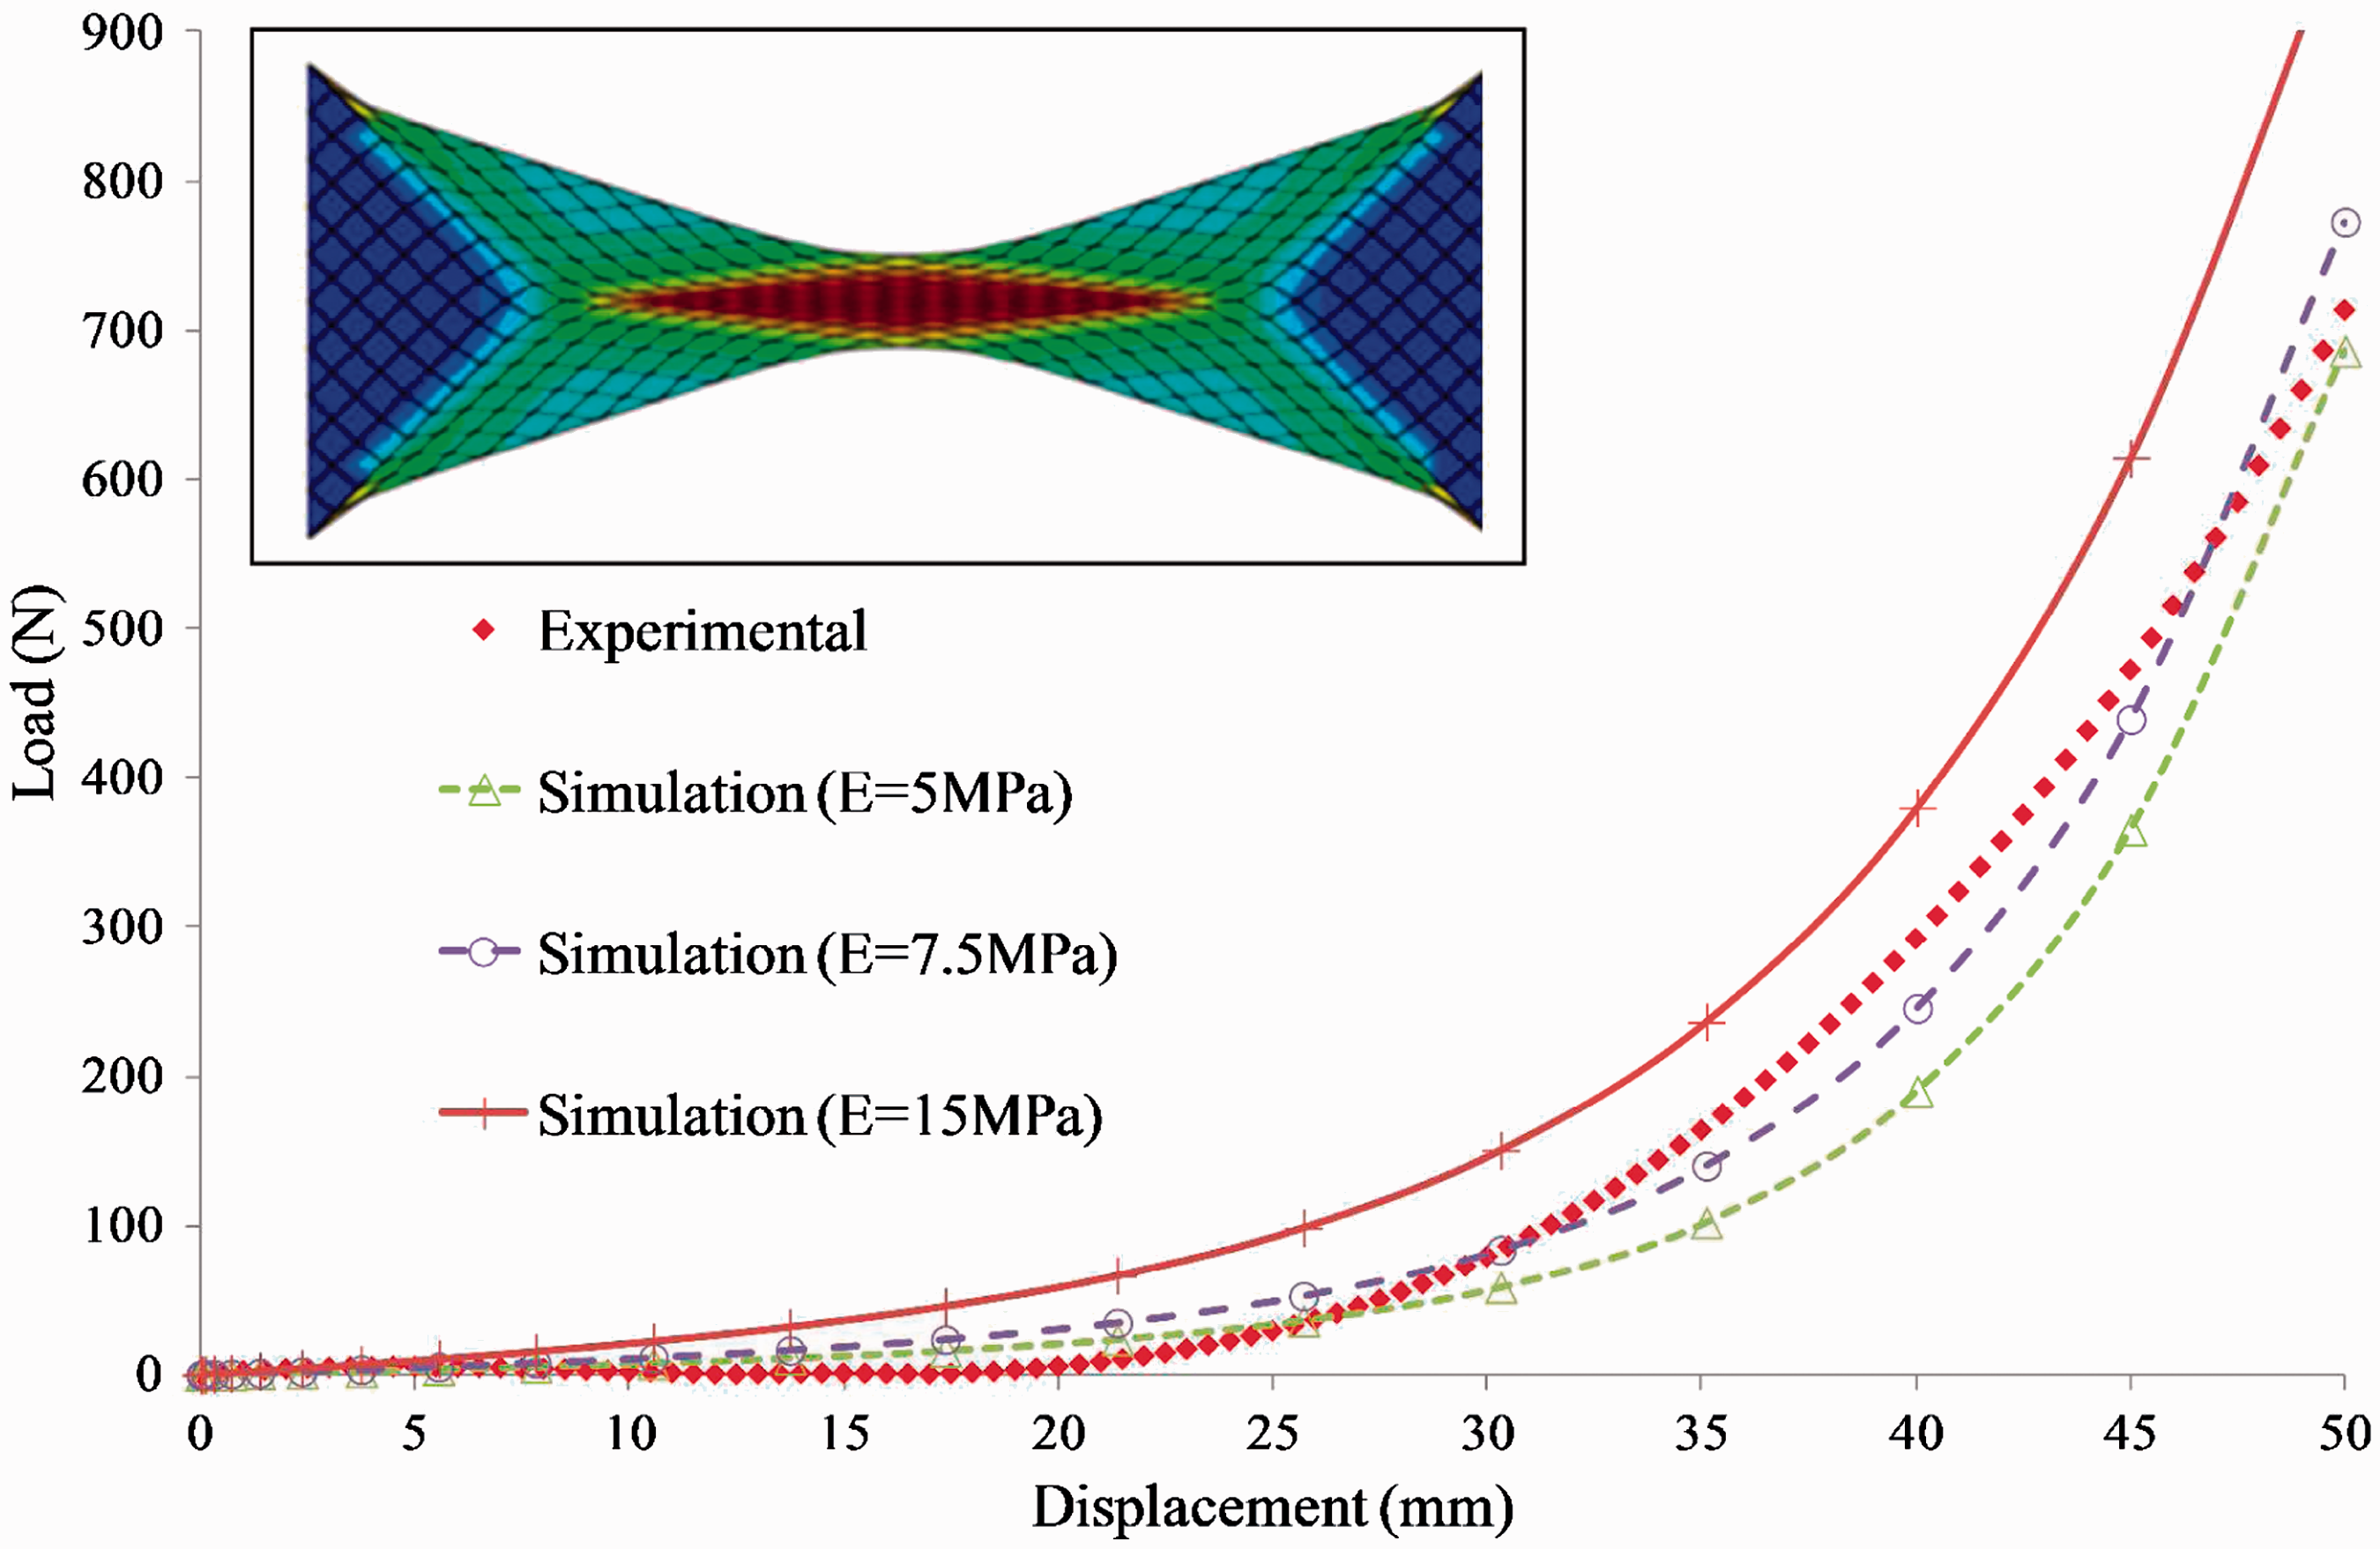
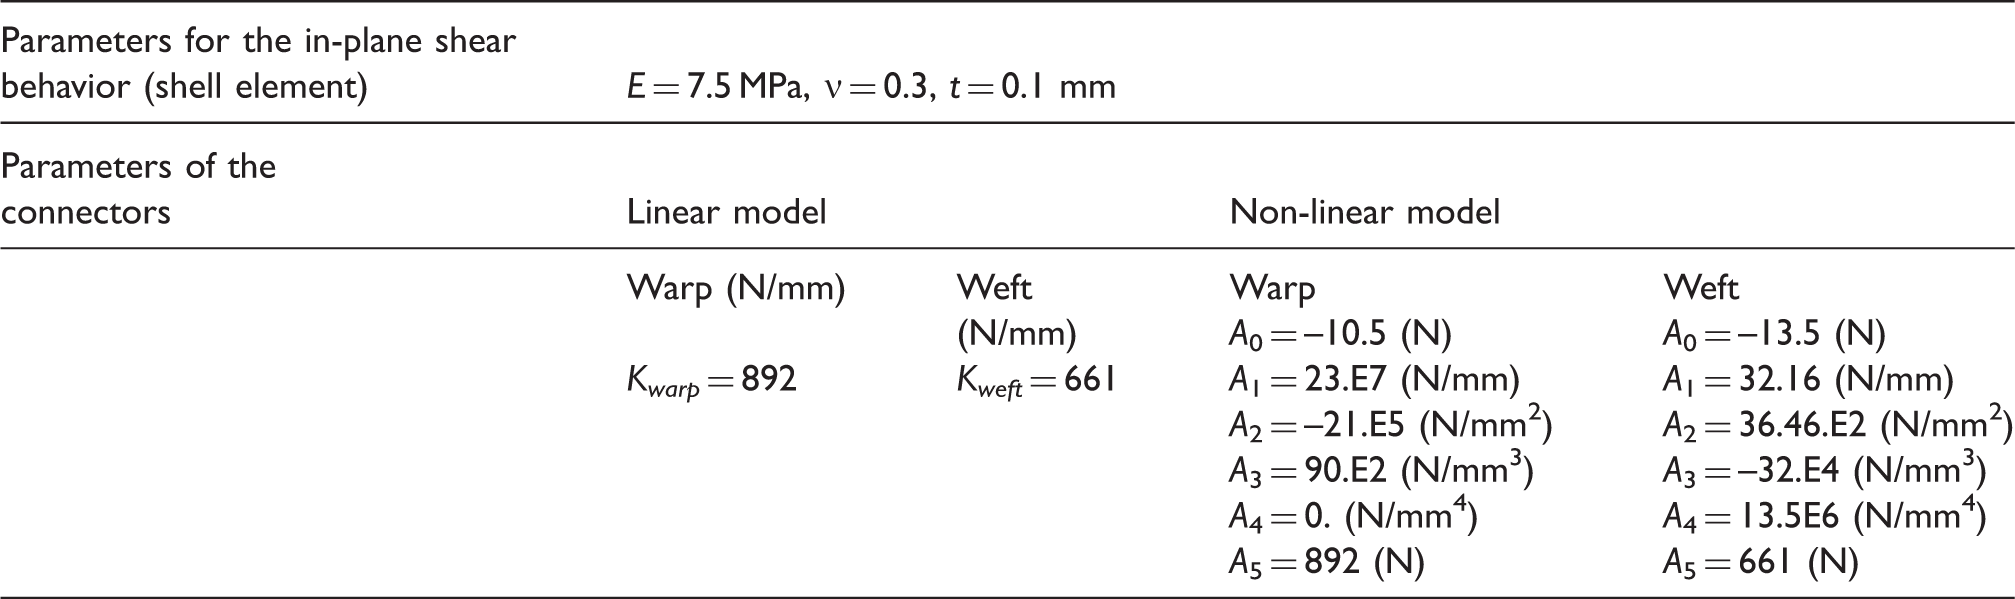
A similar approach was used to identify the rigidity of the connectors associated with the tensile behavior of the fabric. It consists of defining first a model for axial connectors (linking load to displacement). Then simulations of the uniaxial tensile test by the finite element method including these models are carried out before using an optimization procedure to identify the parameters of the model. To study the influence of the non-linearity in the tensile behavior of the fabric, two models are considered.
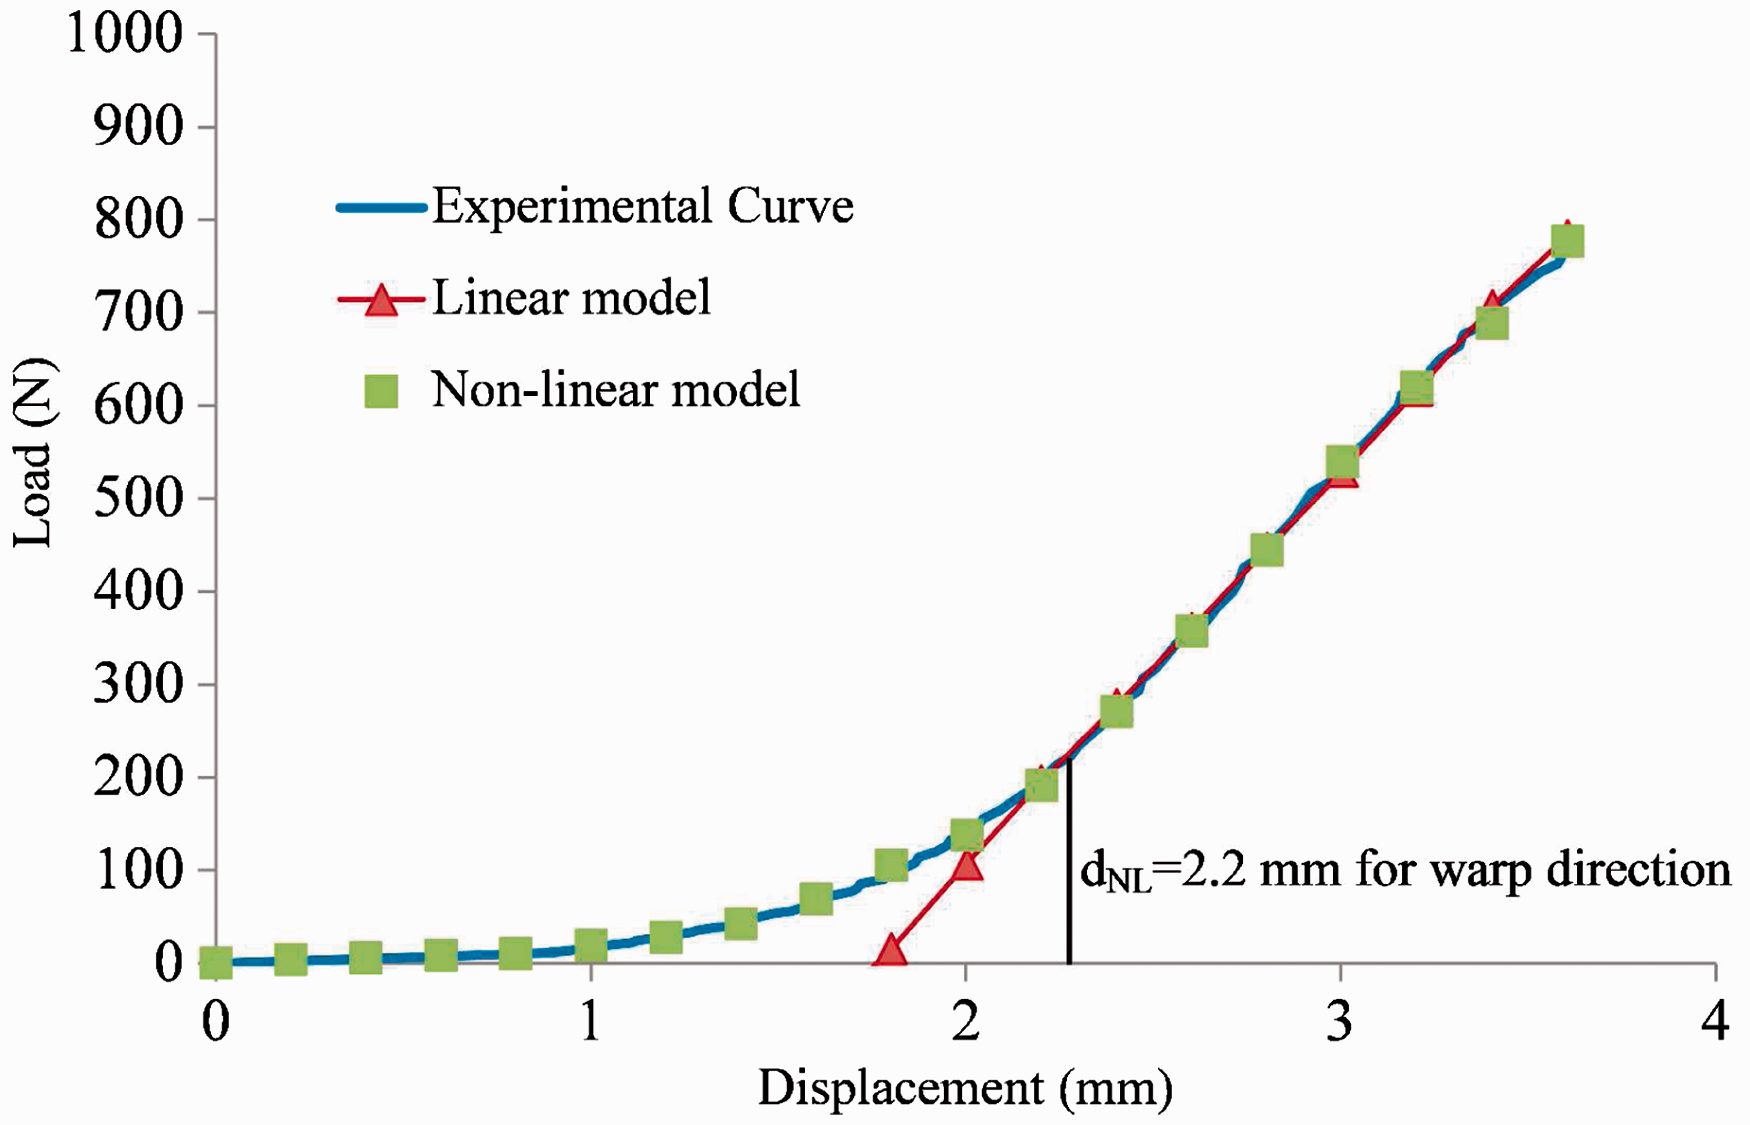
– A first linear model that associates the connector rigidities to the slopes of linear portions of the experimental load–displacement curves in each direction is defined. This model is thus characterized by two constants denoted by Kwarp and Kweft. – The second model is non-linear and is divided into two parts, depending on the displacement value; the first polynomial part is a polynomial function of order four, followed by a linear portion (Equation (1)):
where F, d, and dNL denote respectively the load, the displacement, and the displacement value from which the behavior becomes linear (respectively 3.7 mm for the weft direction, and 2.2 mm for the warp direction, Figure 2).

Figures 8 and 9 show the load–displacement curves obtained by numerical simulation of the uniaxial tensile test, with both models (linear and non-linear), as well as experimental curves, in each direction.
Load–displacement curves in the weft direction. Experimental curve and simulation with both models for connectors. Load–displacement curves in the warp direction. Experimental curve and simulation with both models for connectors.
Parameters identified for the behavior law in the numerical simulation
To check that the tensile behavior is exclusively taken into account by the connectors, elementary tests have been conducted on the simulation of the tensile tests. Figure 10 represents the tensile load–displacement simulation for the weft direction, with the non-linear model associated with the connectors for different values of the Young’s modulus of the shell elements. This test shows that the Young’s modulus, previously determined during the shear parameter identification procedure and chosen for the shell element (7.5 MPa in Figure 7) to model the in-plane shear behavior of the fabric, should be identified carefully. In this case, Figure 10 shows that the simulation data are in good agreement with the experimental values. Choosing other modulus values, such as the high values ones shown in Figure 10 for the shell elements, may lead to a coupling between the shell and connector elements for the tensile behavior and therefore to inaccurate simulated tensile behaviors, and probably to inaccurate simulations of the forming process.
Influence of the Young’s modulus of the shell element on the tensile response (non-linear model, weft direction).
Simulation of the forming step
Simulations of the preforming tests have been performed with an explicit solver, in Abaqus software, integrating the behavior laws detailed before for the flax fabric. Tools, whose dimensions are specified in Figure 4(b), are considered to be rigid and the process parameters are the same as the ones used for the experimental tests. Just one layer of the flax fabric is considered. Between the ply and tools, the friction coefficient for the contact is taken to be equal to 0.3, as is commonly used in different preforming studies.26,29
Tests at constant blank-holder load
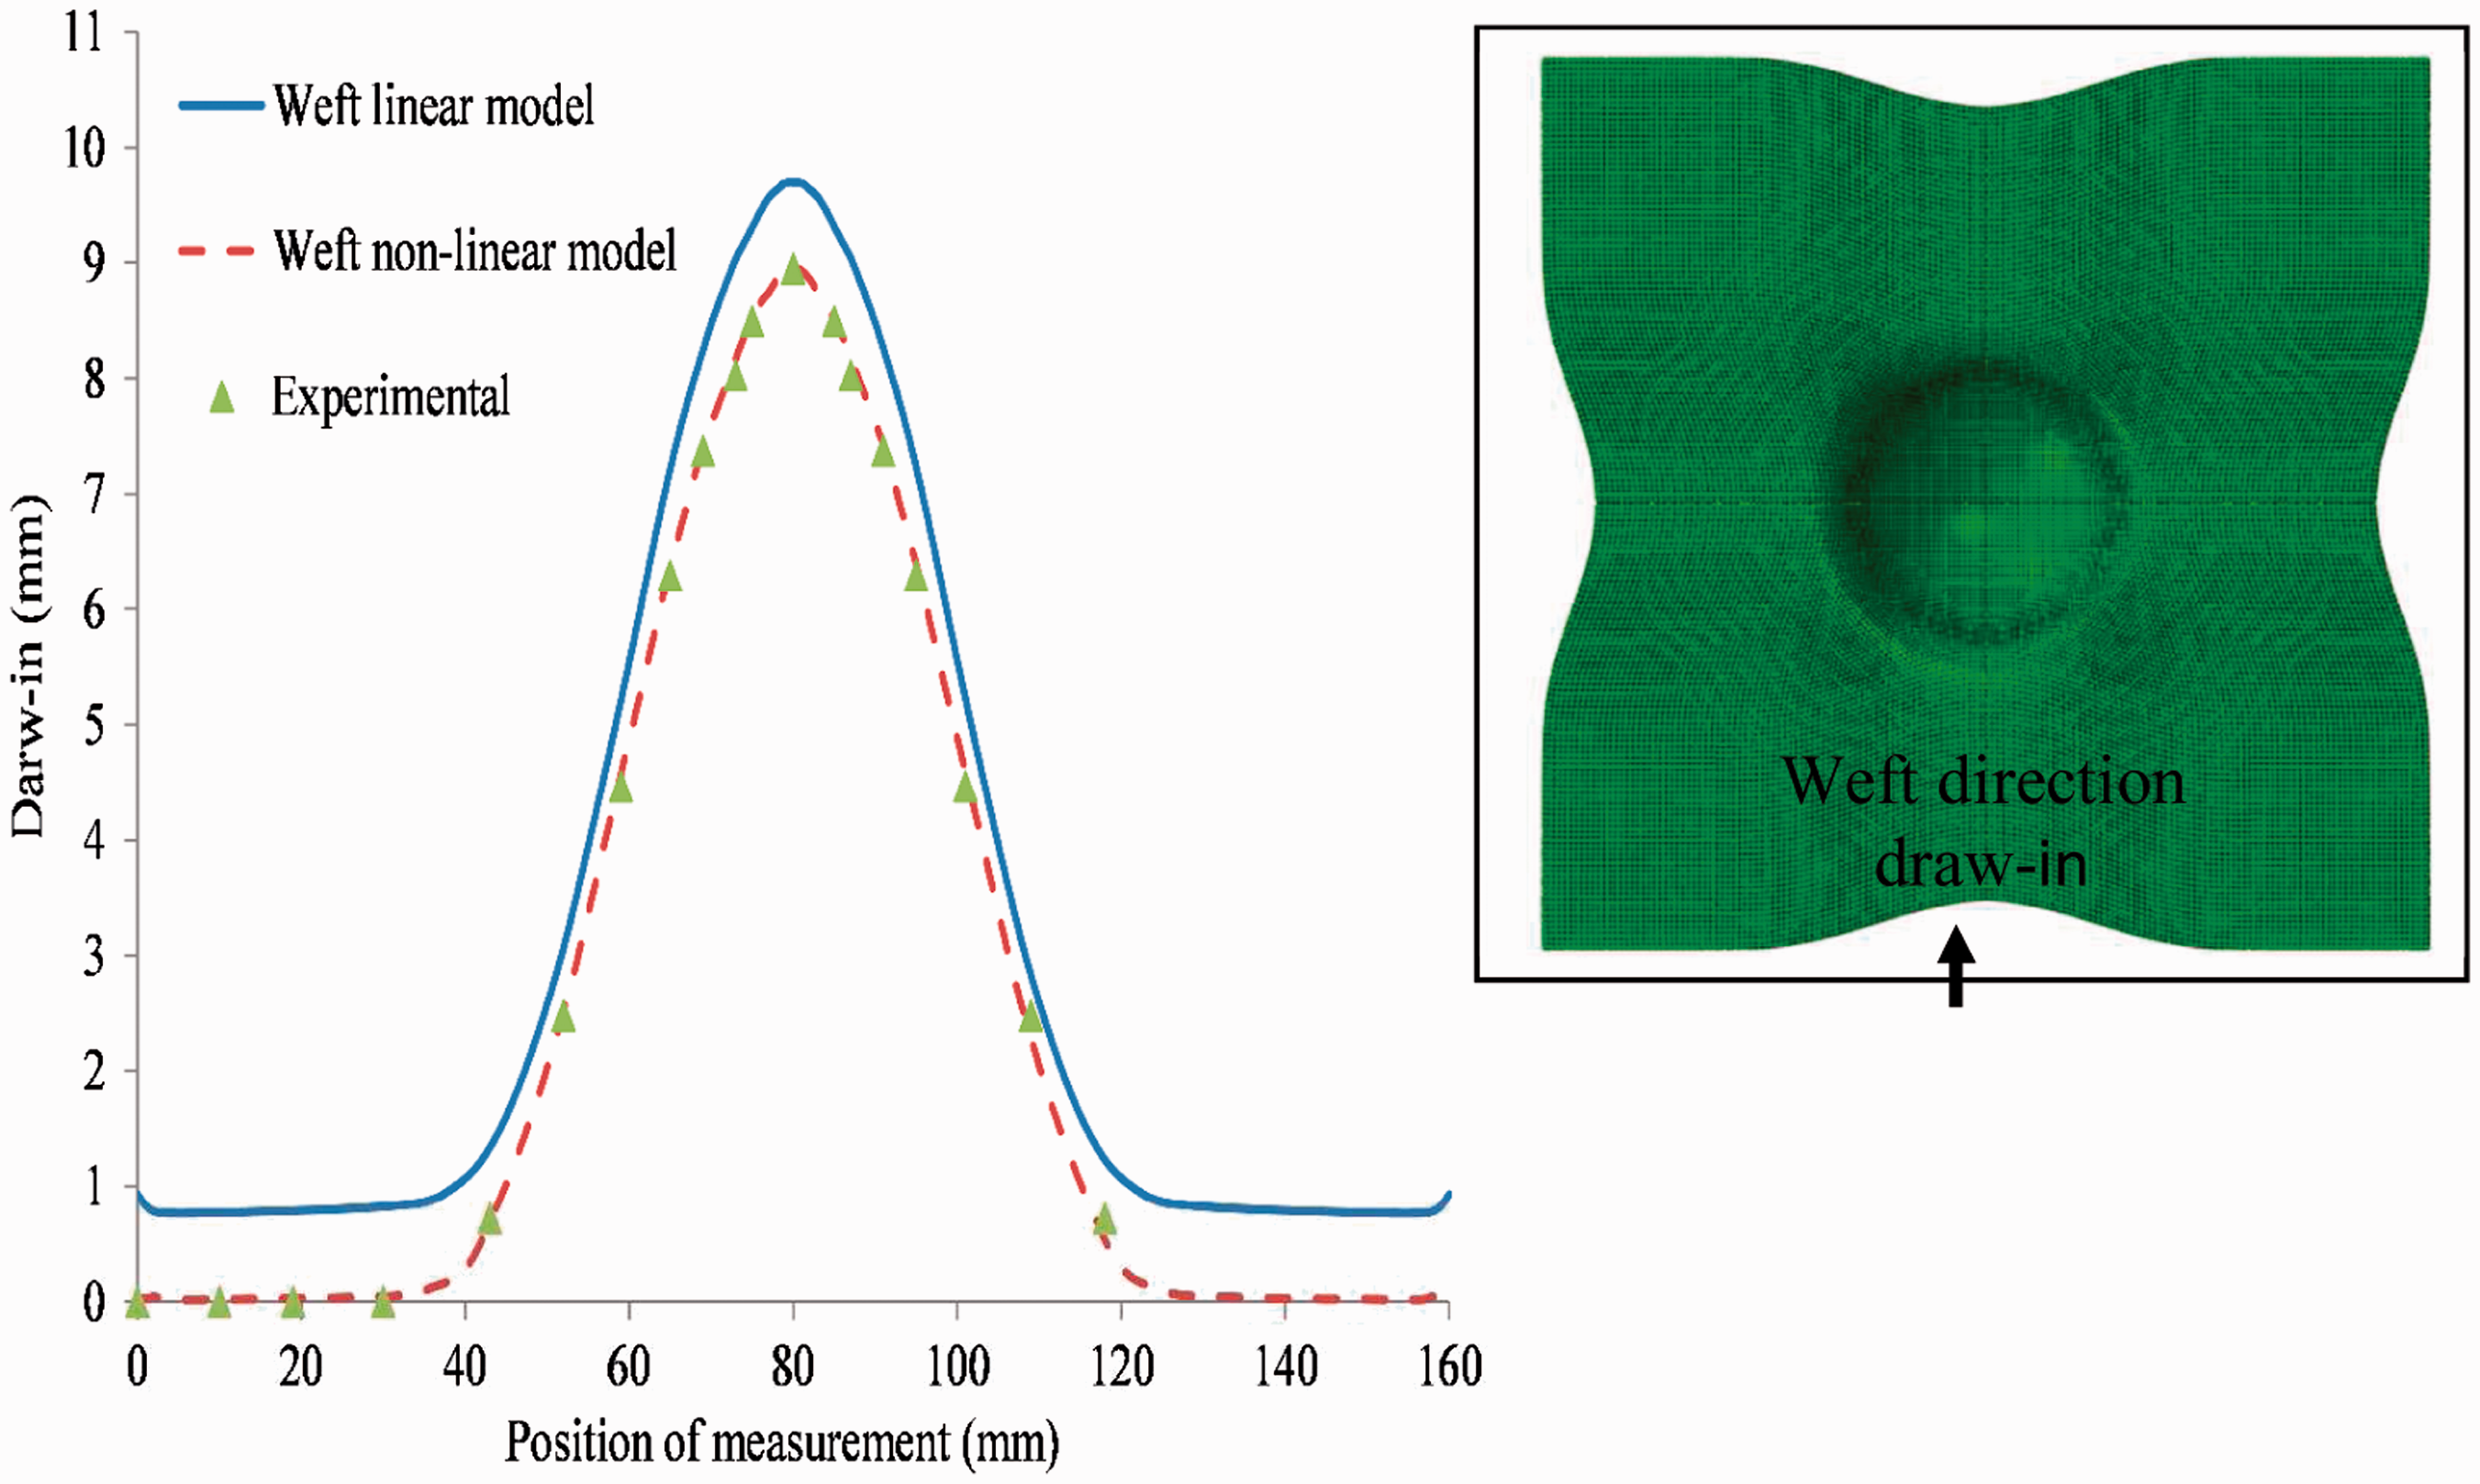
For these tests, a constant load equal to 625 N is applied on blank-holders, like in the experimental case. The comparison with experimental tests, described in the first section of this paper, is conducted on the draw-in in each direction (warp and weft) and on the shear angle between yarns. For the 0/90° orientation, Figures 11 and 12 show comparisons between the draw-in computed by both models and experimental measurement points taken respectively in the warp and weft directions. The standard deviation for the experimental measurements of the draw-in is about 0.5 mm.
Warp direction: comparison between the draw-in computed by both models and the experimental data points. Weft direction, comparison between the draw-in computed by both models and the experimental data points.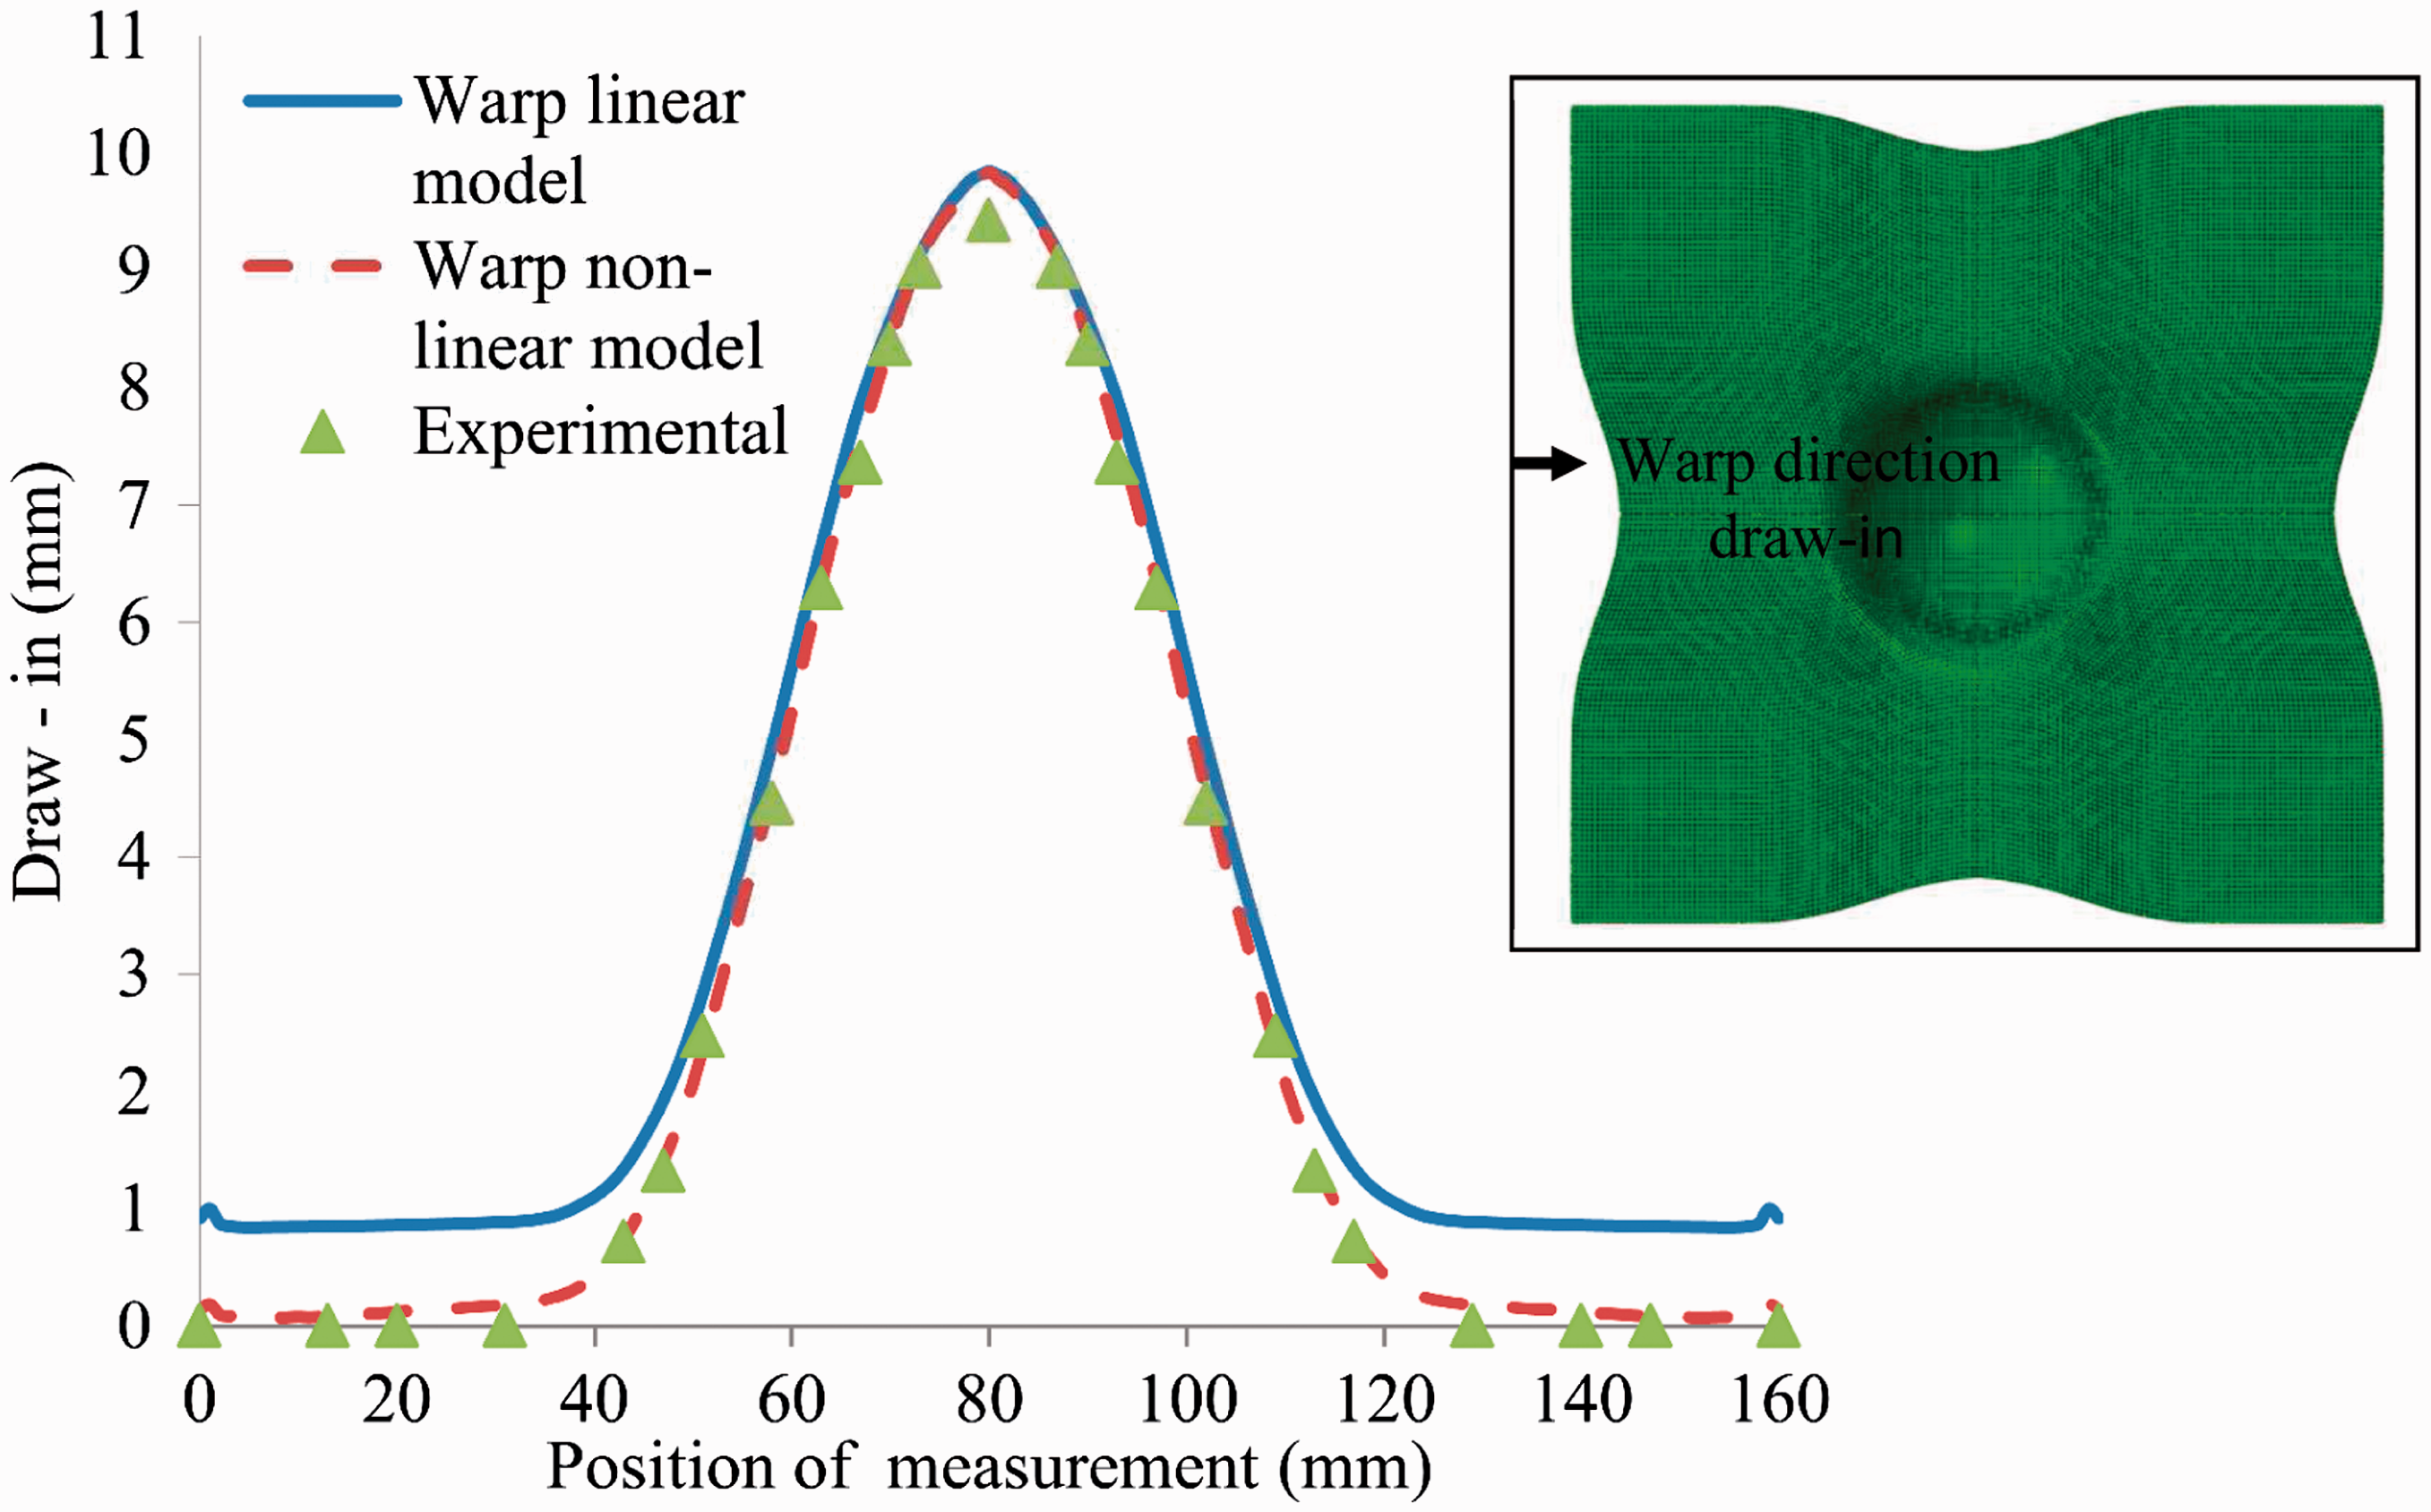
Comparisons of the maximum draw-in for experimental and computed values
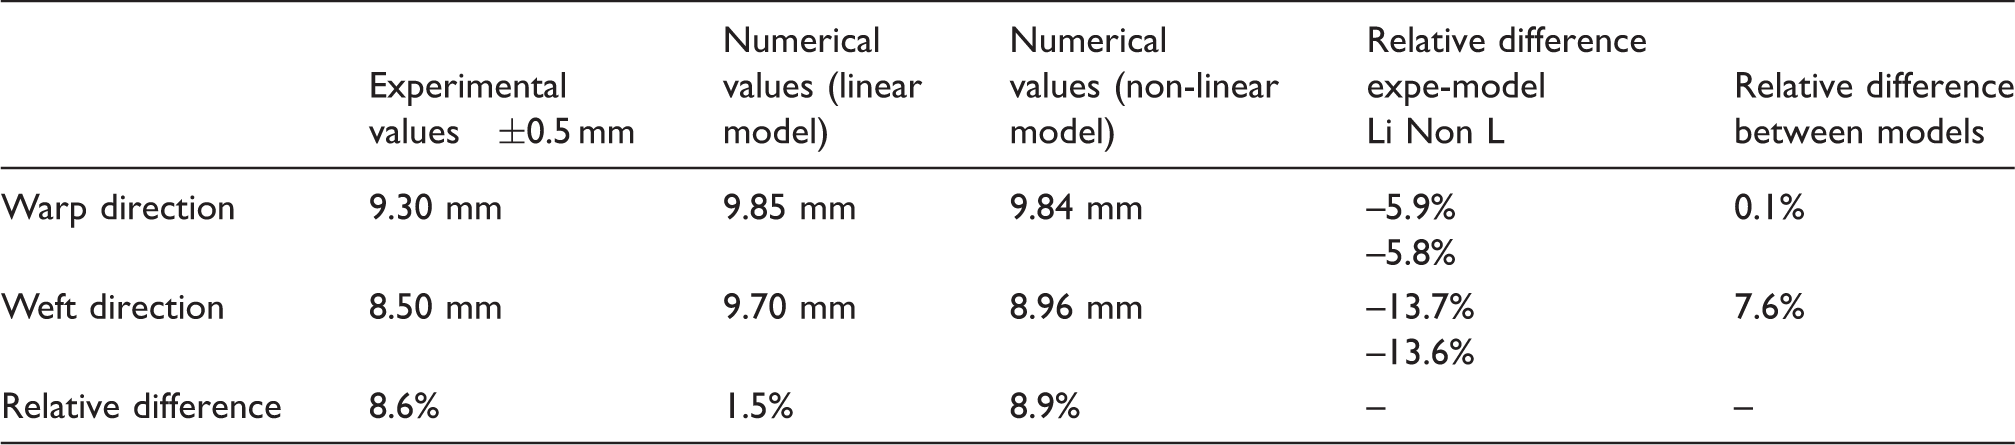
The comparison between both models is illustrated in Figures 13 and 14. Figure 13 shows similar results (quasi-superimposed curves) for both directions when the linear models are used. When the non-linear model is used, Figure 14, different results are observed between the warp and the weft directions (∼9%). This is in accordance to the unbalanced behavior of the fabric observed experimentally when draw-in is different in the warp and weft directions (∼8.5%). This is due to the fact that the waviness of the weft yarns is higher than for the warp ones. As a consequence, the draw-in movement of the weft direction takes place with a delay in comparison to the warp direction and therefore the draw-in, in the weft direction, is lower than in the warp direction. The previous results (Figure 13) confirm that the linear model does not reproduce the unbalanced behavior of the fabric, contrary to the non-linear model, where the draw-in in the warp direction is higher and is well in accordance to the experimental values.
Draw-in in warp and weft directions computed by the linear model. Draw-in in warp and weft directions computed by the non-linear model.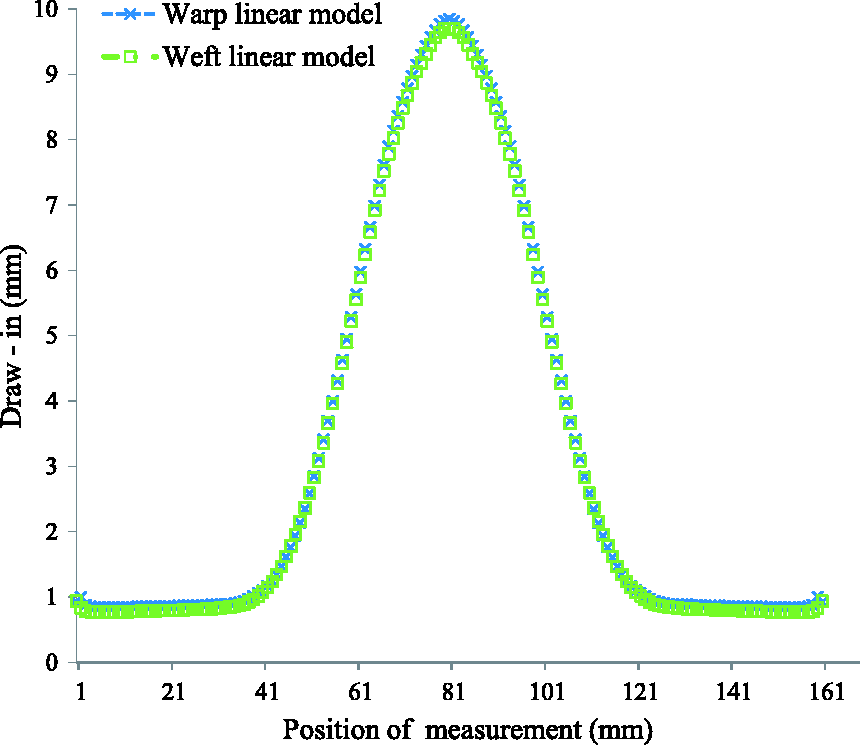

Comparisons of in-plane shear angle between experimental and numerical simulation

Table 3 shows that no difference can be observed between the simulation values obtained by the two models. For localized shear angle values one can conclude that both models give almost similar values. They are themselves not significantly different to the experimental values, as they are all situated within the error ranges of experimental and simulation values. All the results, presented in Figures 11–14 and Tables 2 and 3, allow us to validate the non-linear numerical model.
For the ±45° orientation, for the same constant load applied on the blank-holder, Figure 15 compares the draw-in computed by both models to the experimental values measured on the preform. The outline calculated by the non-linear model best fits the shape of the experimental preform. The difference between both models can reach 9% of the maximum values.
Draw-in for (±45°) orientation: comparison between experimental and computed result by both model values.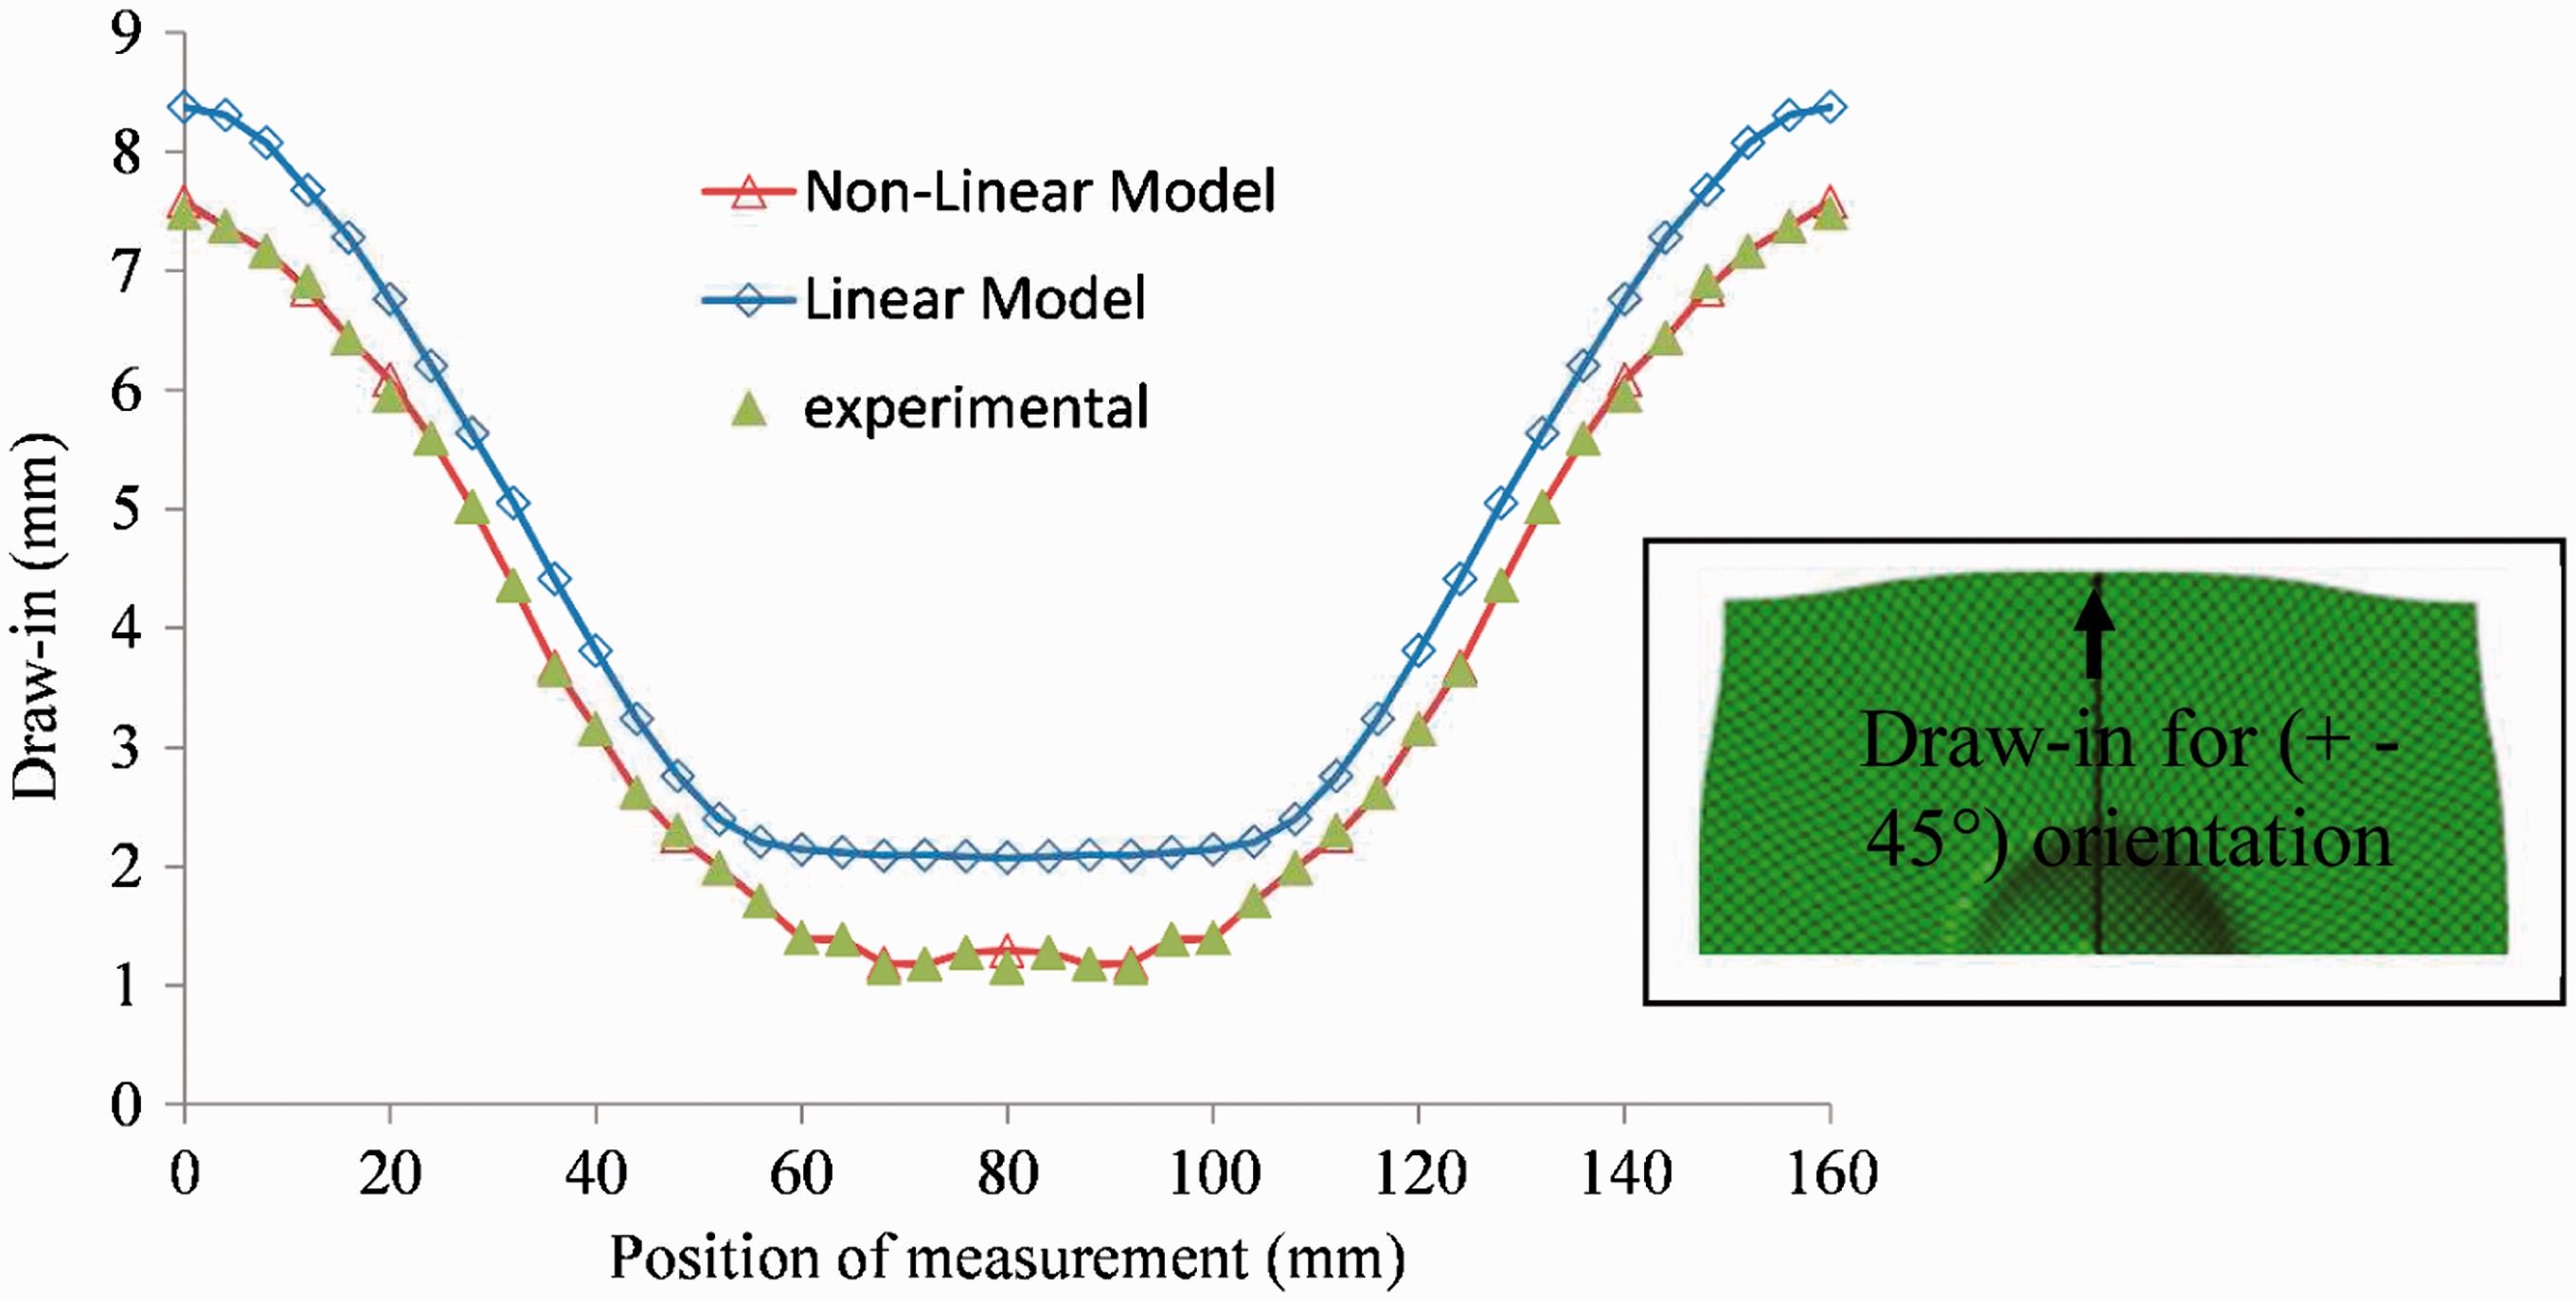
The evolution of the shear angles at ±45° orientation is reported in Figure 16 for both models along a specified edge starting from the top of the hemisphere. Under the punch, the shear angle is null at the top of the hemisphere and reaches maximal values at the location between the die and the blank-holder. Both simulation models give, in this zone, relatively similar results. For this test, the difference between the values calculated by the two models is significant at locations between the blank-holder and the die (Figures 16 and 4(b)). At these locations, the load applied by the blank-holder has an influence on the tensile behavior of the fabric, as shown by Capelle et al.
32
and consequently on the level of in-plane shear, especially for this orientation. Values given by the non-linear model are closer to the experimental results given in Figure 5(b).
Evolution, along the edge, of the shear angle computed with both models.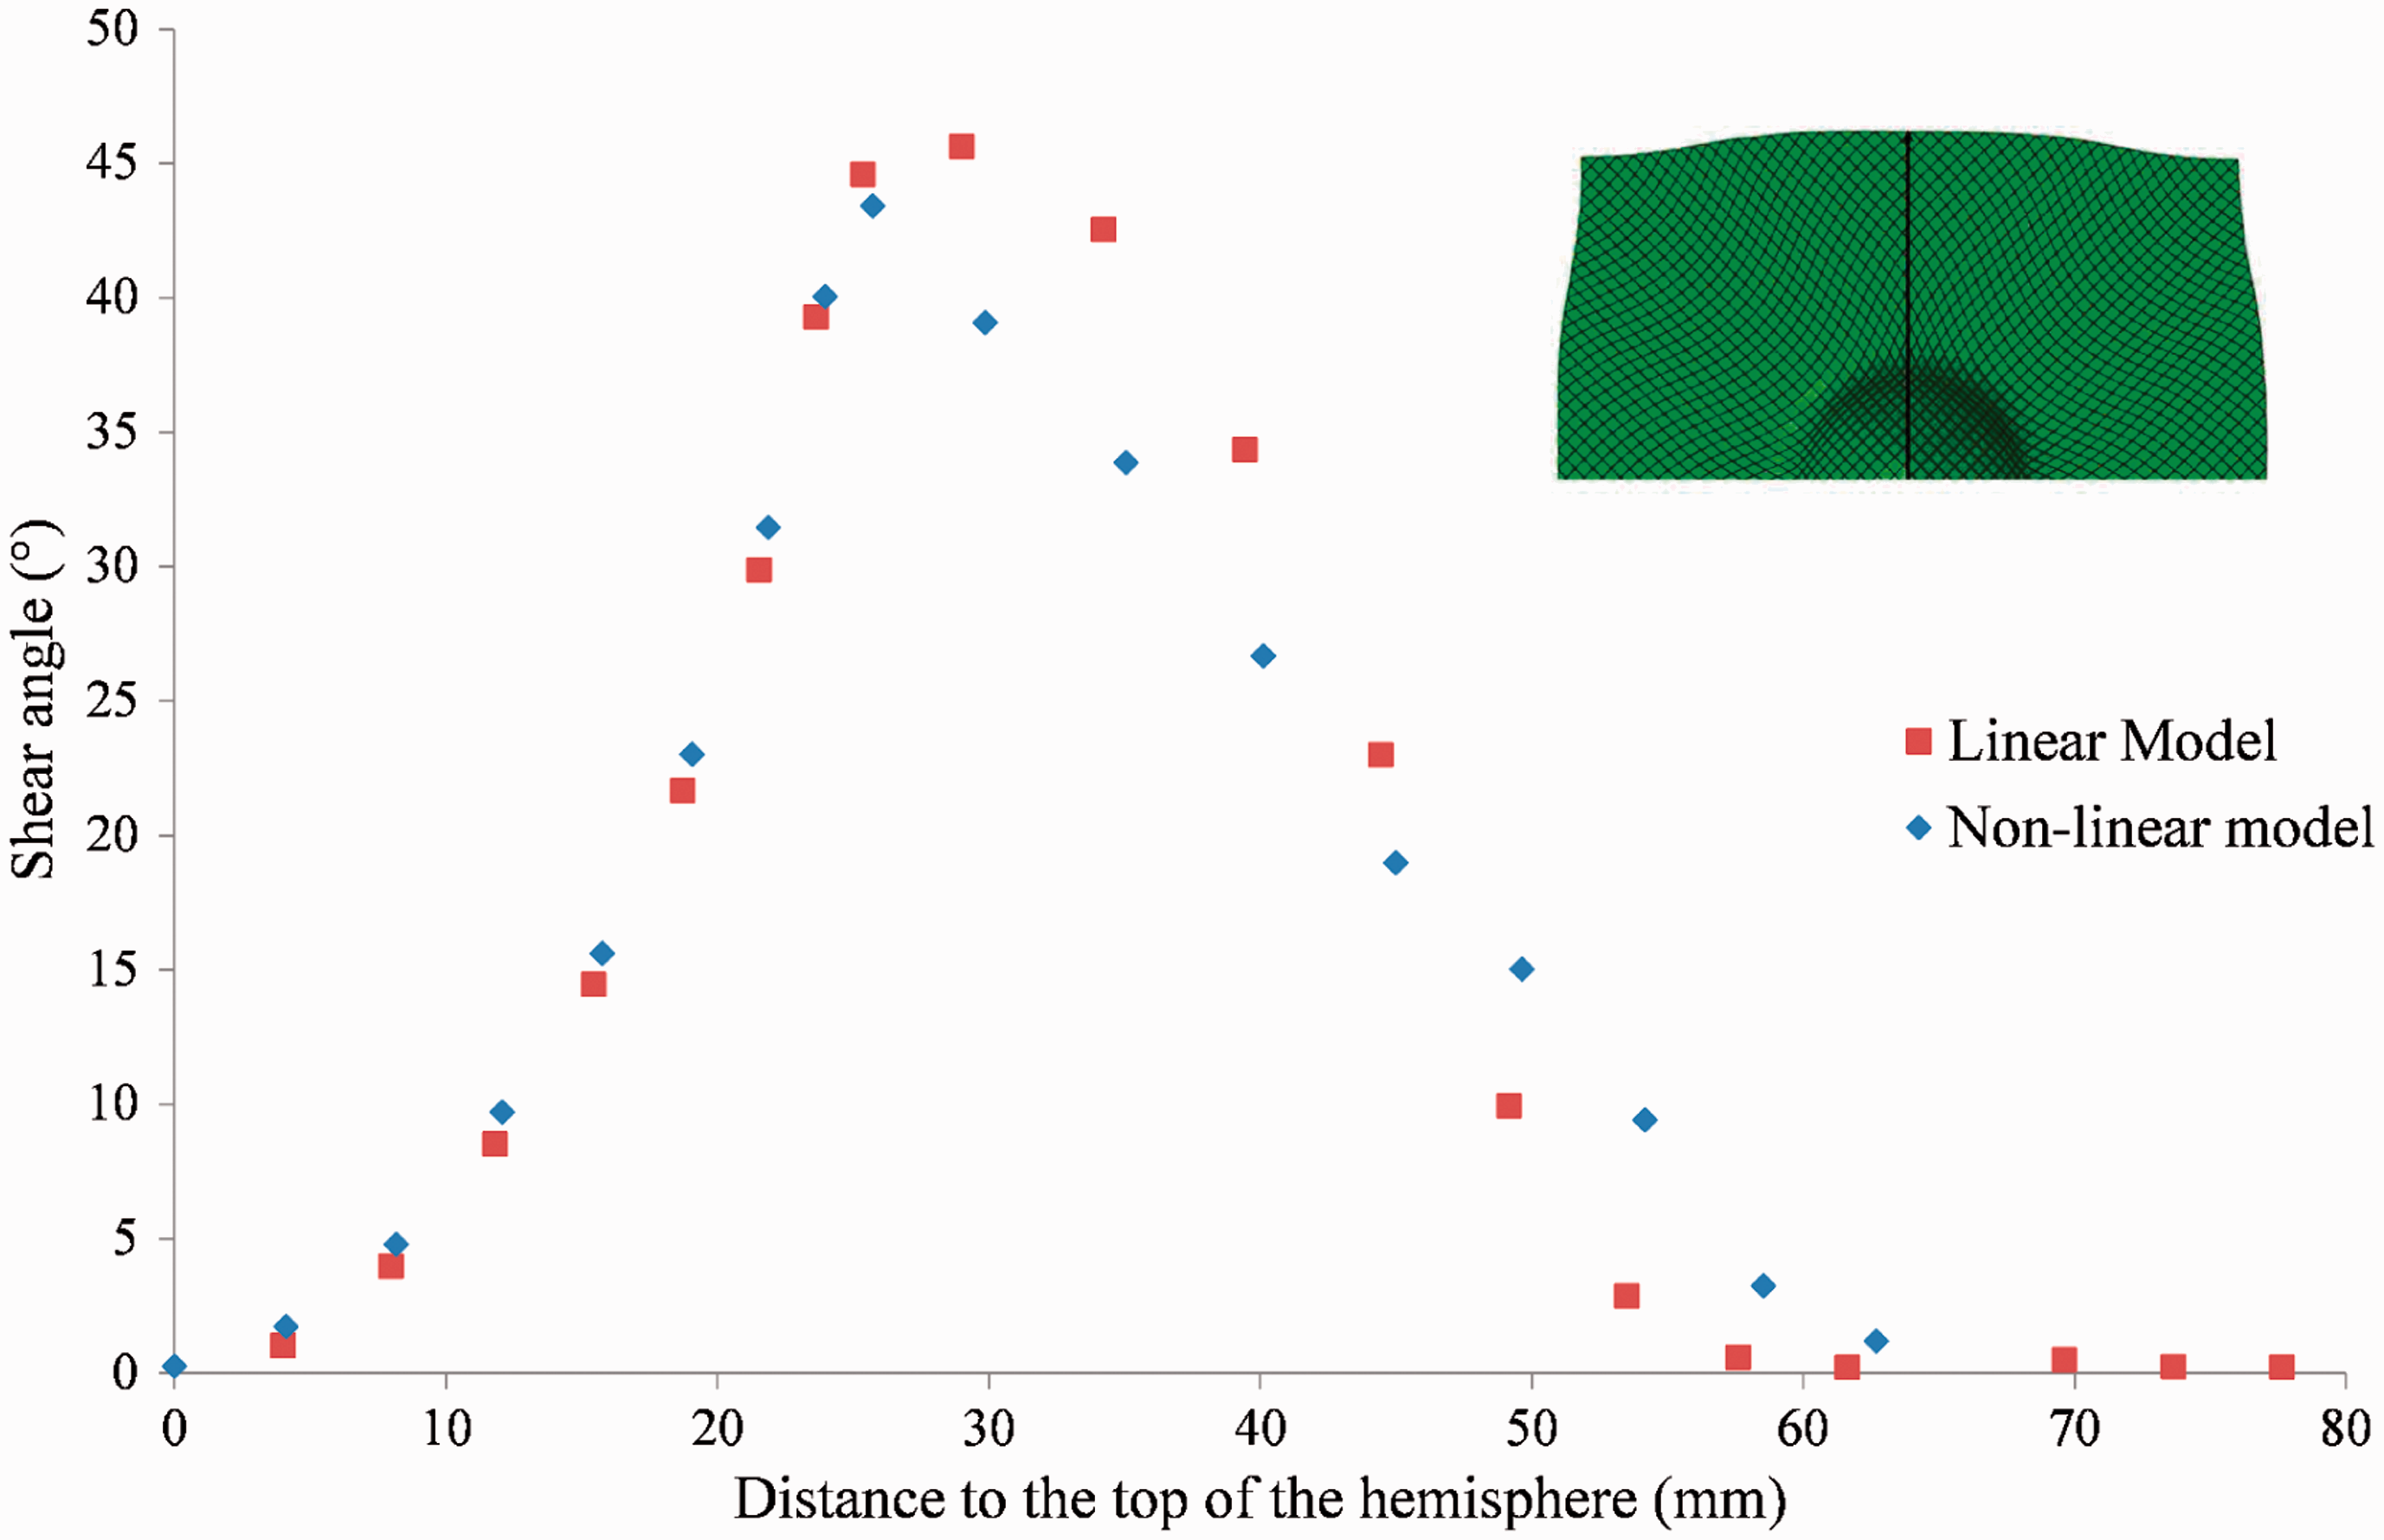
Analysis with variable blank-holder loads
Both numerical models are used to analyze the influence of the load level applied by the blank-holders to the fabric draw-in. For the 0/90 orientation, Figure 17 reports that the maximum value of draw-in decreases as a function of the increasing blank-holder load, for both directions and both models. The linear model, with close values of the draw-in in both directions, does not reproduce the unbalance characteristic of the fabric at any load. On the contrary, the non-linear model reproduces the unbalanced nature of the draw-in. Between both numerical models the difference in draw-in values is higher in the weft direction, where the non-linearity of the behavior is larger than in the warp direction.
Evolution of the simulated maximum values of the draw-in as a function of the load (0/90°). Linear and non-linear models.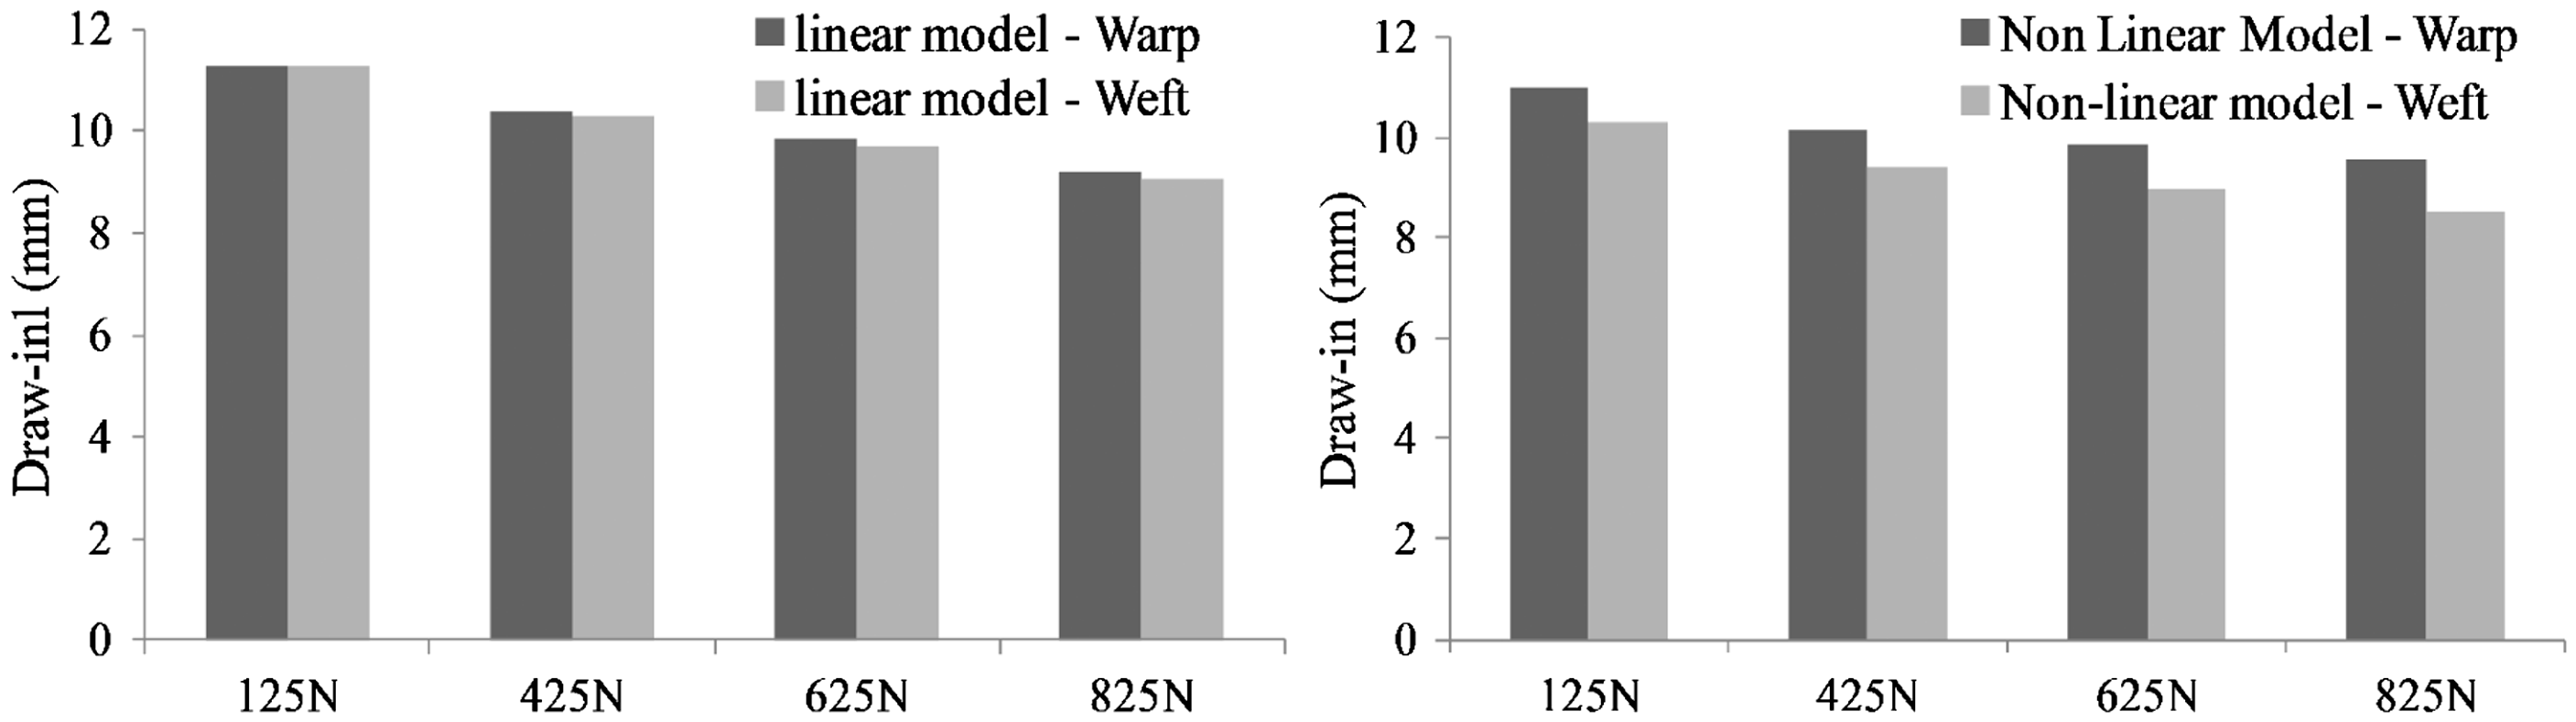
For the ±45° orientation, differences between the draw-in, computed by the linear and the non-linear models, are reported on Figure 18.
Evolution of the draw-in computed with both models for (±45°) orientation.
For the three values of load considered, the draw-in computed by the linear model is always higher than the one obtained using the non-linear model. This is due to the fact that the rigidity rises previously in the linear model and, therefore, the draw-in starts earlier than for the non-linear model. This example shows again that it is particularly important to take into account the non-linearity of the tensile behavior of the fabrics.
The influence of the non-linearity in the tensile behavior on the shear angle is described in Figure 19, where the evolution of the shear angle computed by both models along the edge specified in Figure 16 is reported. For the three values of load considered, the linear model exhibits different values of the shear angles in comparison to the non-linear model, and especially for locations between the die and the blank-holder. As described in the previous section, for the constant load of 625 N, it can be deducted that the tensile behavior has an influence on the magnitude and precision of the shear values. This point has been underlined by Najjar et al.49,50 for carbon reinforcement. The result presented in Figures 16 and 19 demonstrate that a strong coupling takes place between the in-plane shear and the tensile behavior. Colman et al.
56
and Nosrat-Nezami et al.
57
recently indicated that the coupling between both phenomena should be taken with care in order to obtain accurate preforming simulations. This work therefore shows that the tensile non-linear behavior should be taken into account in order to improve the coupling between the in-plane shear and the tensile behaviors.
Evolution of the shear angle computed with both models in function of the load (± 45°) orientation.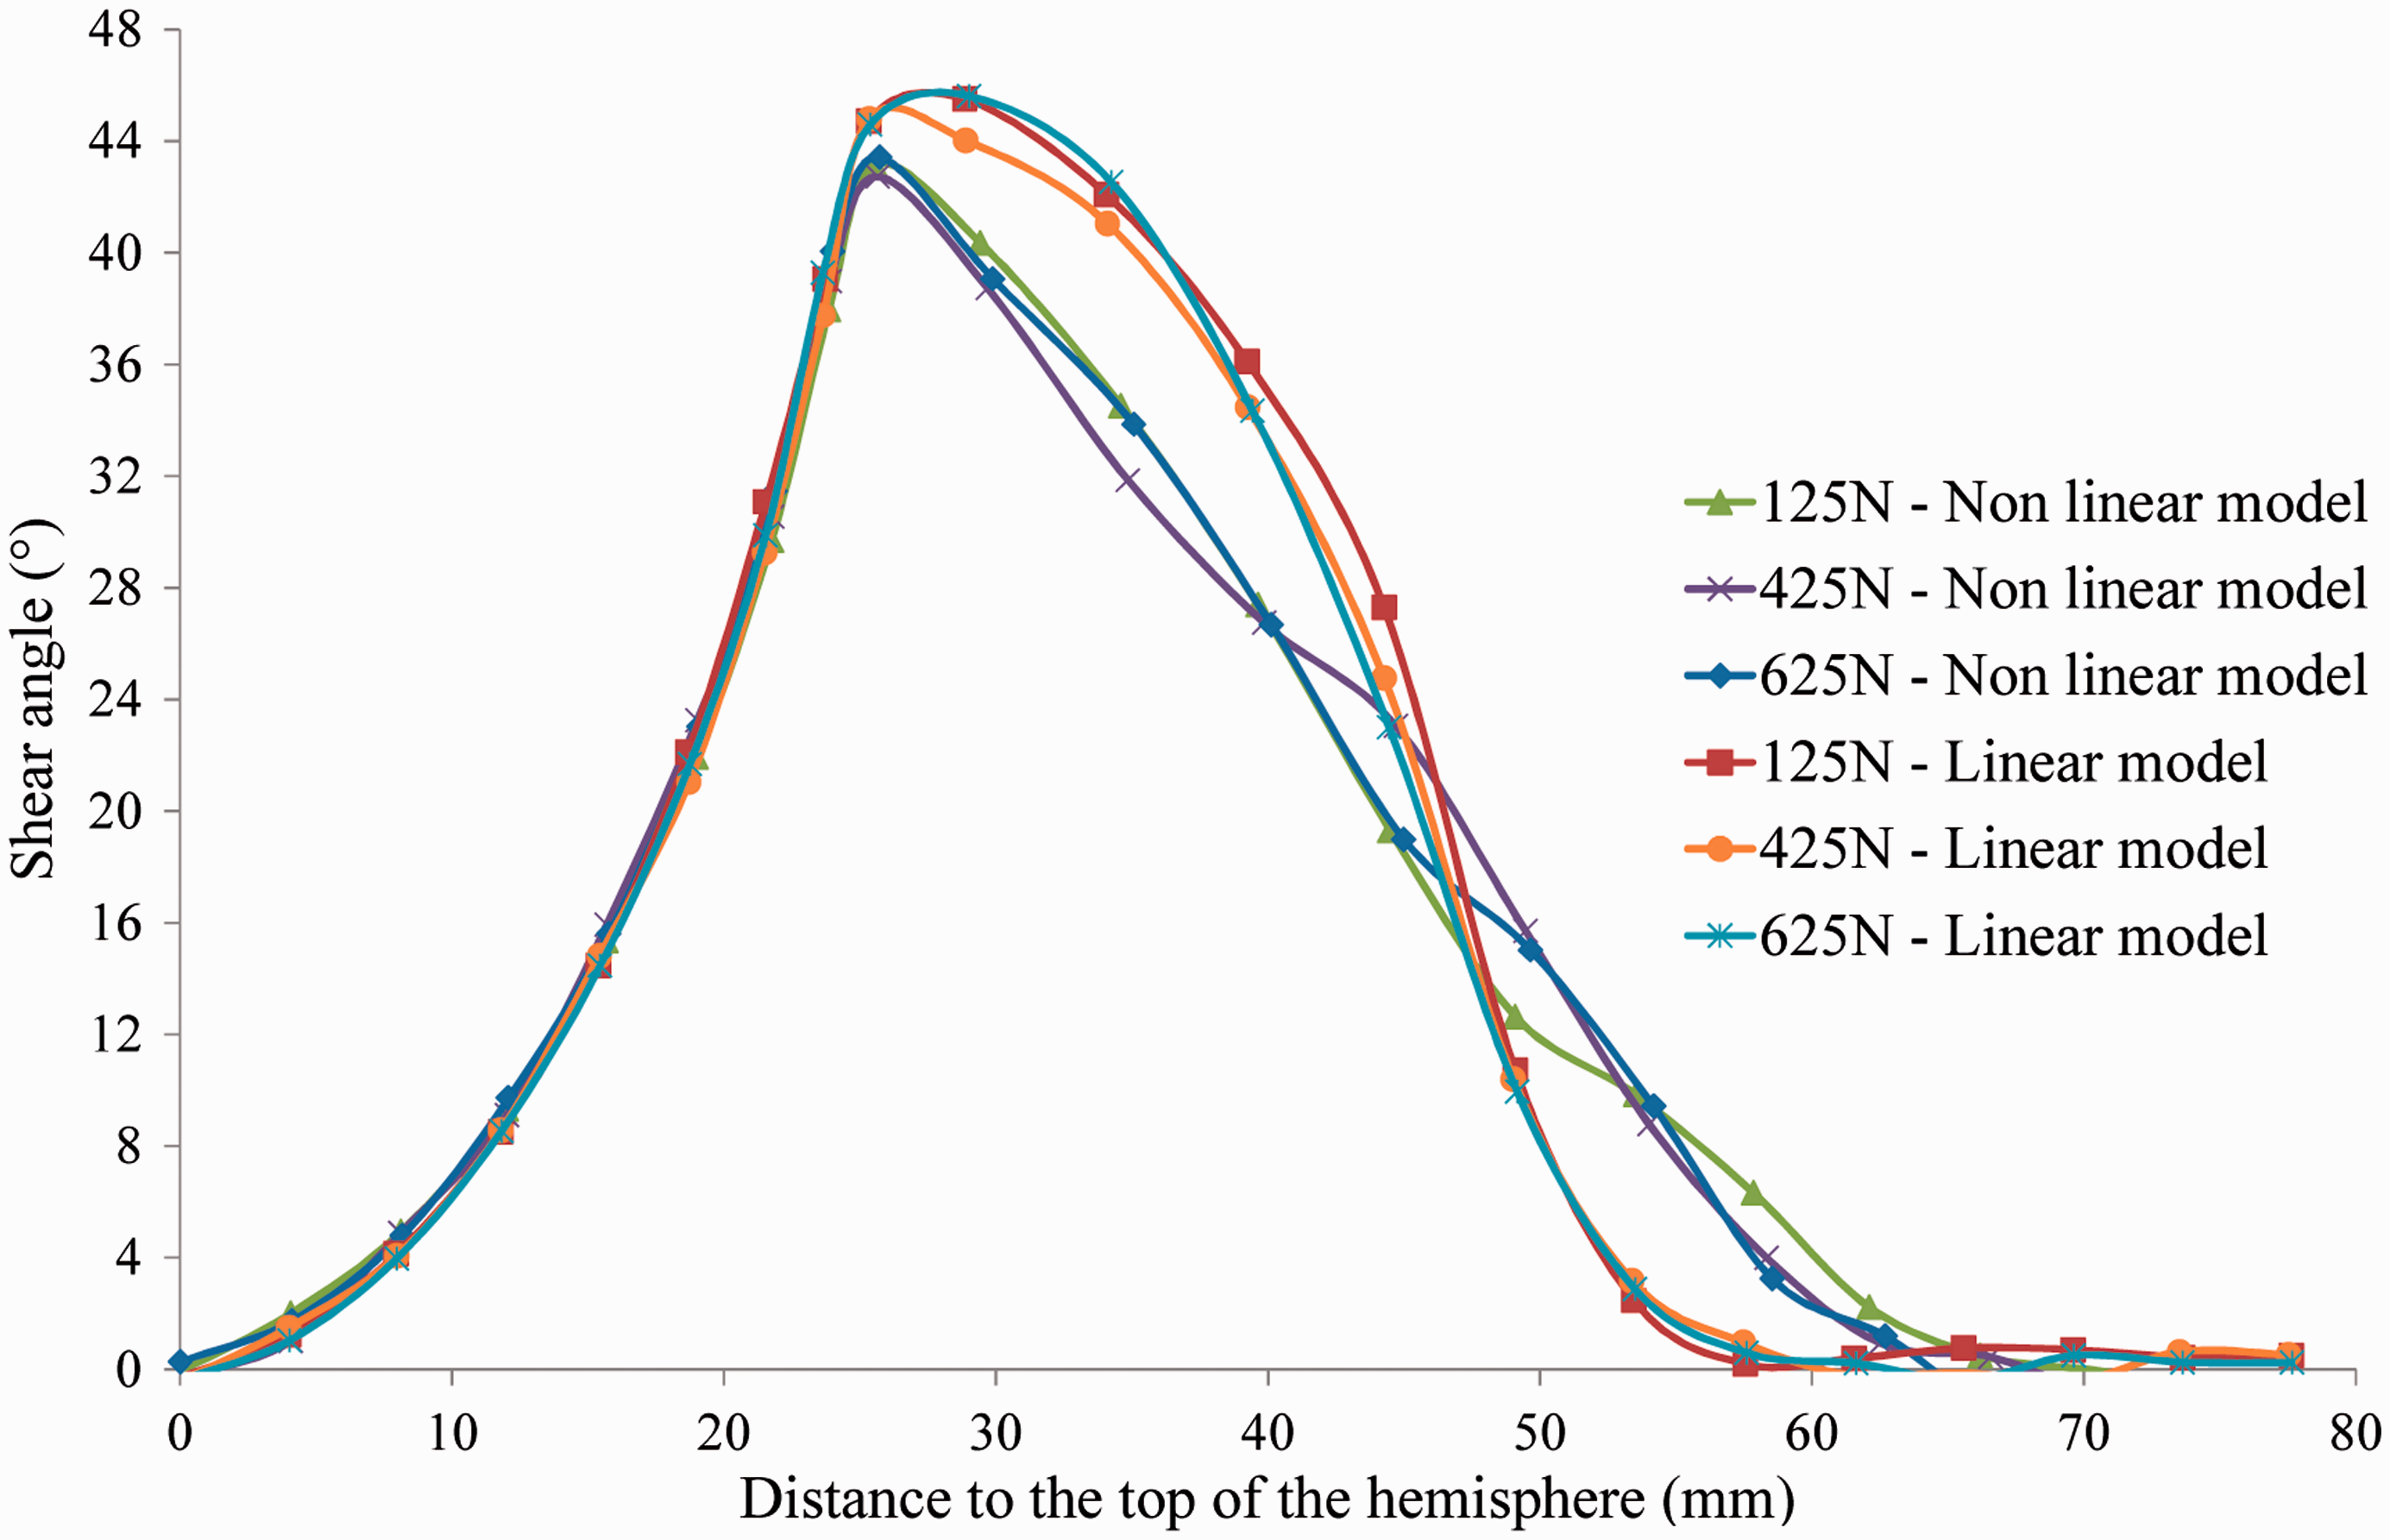
Conclusions
Many papers dealing with natural fibers have dedicated their work to the mechanical behavior at the scale of fibers or yarns. The complexity of the architecture at these scales leads to tensile non-linear behaviors at the scale of the preform. These specific behaviors have an influence during the sheet forming of woven reinforcements. In particular, this work demonstrates that the draw-in and to a lesser extent the shear angle of the reinforcement submitted to hemispherical sheet forming, are particularly sensitive to the tensile behavior non-linearity. For the orientation at ±45°, results shows that the tensile behavior has an influence on the in-plane shear behavior, especially in places close to the load application, while numerical approaches generally dissociate these phenomena. This work therefore demonstrates that the coupling between the in-plane shear and an accurate non-linear tensile behavior should be considered in order to well model the forming of woven preforms showing tensile non-linearity. This phenomenon, in relation to characteristics of reinforcement (fabric architecture, etc.), should be investigated in future works on more complex shapes where stronger tensions are observed.
Footnotes
Funding
This work was supported by the French environmental agency (ADEME) and the Region Centre.