



Abstract
With the fast development of wearable electronics textiles, various types of conductive yarns are emerging onto the market. For industrialists, therefore, selecting high quality conductive yarns, and selecting for their properties, is vitally important. In this paper, a method for selecting high quality conductive yarns is given, based on a clear understanding of their basic chemical, mechanical, and functional properties. A systematic method and a series of tests, including SEM analysis, mechanical property analysis, abrasion testing, laundry testing, and corrosion testing, are put forward to simulate some of the main challenges that industrialists might face in the actual application of conductive yarns, from the yarn stage to the end user stage. This paper aims to give guidance to industrialists when selecting high quality and suitable conductive yarns.
Keywords
Wearable electronics textiles have recently been emerging onto the market, which have been rapidly developed following the needs for clothing for leisure, fashion wear, and personal protection, 1 as well as a requirement for the clothing to be capable of electronic age functionalities, such as serving as interactive interfaces, sensual being, tangible touch and social fabric.2–21 With the requirements for wearable electronic textiles to be more comfortable, well designed, and easy to care for, conductive yarn becomes one of the most important fundamental elements within wearable electronic textiles for the interconnections between different functional units or for the creation of a functional unit.22–29 Nowadays, with the rapid development of materials science, the technology of conductive yarn is relatively mature from laboratory to market, resulting in better availability for the consumer market.30–37
Ag/nylon conductive yarns are made of nylon that is coated with or mixed with silver so that the resulting yarns are capable of conducting electric current while exhibiting the properties of textiles.30–31 Scientist and industrialists used to embed conductive yarns into textiles through various garment technologies including knitting, weaving, embroidery, and sewing methods, etc.32–34 There are various coating methods, either chemical or physical, that have been adopted by industrialists, resulting in a variation of functionality and quality of the type of yarn that are available. After reviewing different conductive yarns available off-the-shelf, Ag/nylon conductive yarns are found to be the most often selected material for wearable electronic product applications due to its advantages of light weight, flexibility, spinnability, and high mechanical stability over metal yarns and carbon yarns.30–31 In addition, as silver has its own inherent qualities, it is an ideal element to be used in applications as varied as medical wound dressings, scent-free textiles, conductive tapes, and anti-microbial fabric wipes, etc.11,12 Thus, Ag/nylon conductive yarns have been widely used in wearable electronic textile product design.
However, according to our review of the literature, most of the studies on conductive yarns focus on their application and the evaluation of the electro-mechanical properties of these devices, while little research focuses on the methods of assessing conductive yarns for the scientific selection of materials in a systematic way under different conditions. As there exists a great number of kinds of conductive yarns with different qualities and properties, there is a need for guidance through the vitally important criteria for selecting conductive yarns. These criteria may directly affect the optimization, applicability, and performance of the final garment, since different types of conductive yarns come with vast variations in functionality and quality. Some of the common undesired qualities may include: (a) being poor in mechanical and physical properties, such as open circuits resulting from the bending of yarn into small angles and a large variation in conductivity between two points spaced 1 m apart; (b) being poor in chemical corrosion resistance, where conductivity of yarns diminishes with time, such as through laundering, etc.17,18 These directly affect the market acceptance and applicability of the final products. The properties of conductive yarns from different companies can vary to a large extent. Therefore, this paper aims to investigate the conductivity, stability, and reliability of 16 types of conductive yarns, to provide an experimental and scientific reference for factories, enterprises, and further studies of wearable electronic textiles.
It is irrefutable that most manufacturers in the textiles and garment industry are comparatively lacking in knowledge in electronics, chemistry, and physics, causing a mismatch between the materials purchased and the end use of products, as well as difficulties in selecting conductive yarns. These hinder the further growth of the smart textiles industry. This research serves as a pilot study to assist industrialists to understand the qualities and properties of conductive yarns and to suggest a few important parameters that they should be reminded of for a higher level of suitability, precision, and controllability. The optimal conductive yarns are assumed to be stable in their properties and resistant to the various forms of corrosion at every processing stage within the textiles industry or during use. Therefore, systematic assessment methods were designed to test the stability and reliability of conductive yarns that would be affected by the problems that industrialists would experience with conductive yarns during each manufacturing process. Four textiles industry stages were highlighted in this paper: the yarn stage, the fabric stage, the apparel stage, and the end user stage. Tests on the conductive yarns are classified by the different stages at which they would be applied.
Yarn stage: several fundamental and direct qualities assessment tests of Ag-coated nylon yarn were carried out including surface micrograph analysis, chemical analysis, differential scanning calorimetry analysis, resistance analysis, open circuits in conductive yarns, and mechanical properties analysis. Fabric stage: the second set of tests included an assessment of resistance change after abrasion since conductive yarns would be subjected to weaving, knitting, embroidery, or sewing, where frictional contact with machinery would become inevitable. Apparel stage: after manufacture into a soft circuit or embedded into a textile, the product would be laundered or heat set. This set of tests included a laundry test and an assessment of resistance change according to temperature. End user stage: finally, after products are forwarded to the consumer, problems of corrosion of conductive metals due to end usage were considered. As a result, a corrosion resistance test had to be carried out as well.
Assessment methods for Ag/nylon yarns

In addition, this assessment model also adopted an elimination approach in evaluating Ag/nylon conductive yarns. The conductive yarns that met the required specifications were selected and compared for further studies while those that failed to meet the requirements were eliminated from the following tests.
Experimental design
Materials
Ag/nylon conductive yarns, labeled S1–S15, were purchased from different companies in China, Germany, and Korea. S1–S3, S6, S8, and S9 were from different companies in China while S7 was from Korea. S4 and S5 and S10–S15 were purchased from the same company in Germany but had different yarn properties.
Experimental procedures
Yarn stage
The aims of the tests conducted in this stage were to construct a basic understanding of conductive yarns properties. The detailed arrangements for the conductive testing procedures at the yarn stage are given below.
Surface micrograph analysis
The surface micrograph analysis were characterized by two models of scanning electron microscope (SEM), (JSM-6490, Jeol, Japan; TM3000, Hitachi, Japan) with energy-dispersive X-ray spectroscopy (EDS).
Chemical nature analysis
The chemical nature of conductive Ag-coated nylon yarns (CANY) was ascertained using Fourier transform infrared spectroscopy (FTIR) measurements (Spectrum 100, PerkinElmer, USA). Typically a sample of 3 mg CANY for FTIR measurement was examined in KBr pellets after thorough mixing. The yarns were cleaned with absolute ethanol, and then dried at 70℃ for 60 min. Thermal gravity analysis (TGA) of all samples was carried out on a thermal gravity analyzer (TGA/DSC 1, Mettler Toledo, Switzerland). Each sample (3–7 mg) was heated in an alumina crucible at a scanning rate of 10℃/min between 25℃ and 700℃ under a nitrogen flow of 50 ml/min. Differential scanning calorimetry (DSC) analysis was carried out with a differential scanning calorimeter (Diamond DSC, PerkinElmer, USA). Each sample (1–2 mg) was heated in a crimped aluminum pan at a scanning rate of 10℃/min between −50℃ and 400℃ under a nitrogen flow of 50 ml/min. An empty pan sealed in the same way was used as a reference.
Resistance analysis
The electrical resistance and open circuits of all samples were measured with a multimeter (34401A Digital Multimeter, Agilent, USA). Resistances of all samples in 10 cm, 20 cm, 50 cm, and 100 cm lengths were measured and the value of resistance for each type was calculated by averaging 50 specimens. DC resistance or conductance of insulating materials was tested according to ASTM D257-07. 41
Mechanical properties analysis
The mechanical properties of all samples were obtained by a universal testing machine (5944, Instron, USA) according to the standard of ASTM D3822-07. 42 Nine specimens of each sample were stretched until the specimens were broken. The predetermined elongation rate was 300 mm/min. The sample resistance during tensile testing was monitored with a multimeter (34401A Digital Multimeter, Agilent, USA).
Fabric stage
The manufacture of conductive yarns is based on chemical coating process technology. The metallic coating layer may be weak and easy to peel off if there has been poor quality control. However, during the textiles industrial process, with the need to go through processes including yarn re-winding, knitting, and weaving, the mechanical properties of the yarns are important for their functionality at the usage stage. Therefore, the purpose of the set of tests at this stage was to simulate the challenges that conductive yarns may encounter during textiles processes (Figure 1). The detailed arrangement of conductive testing procedure at the fabric stage are given below.
Fabric stage processes. (a) Yarn rewinding; (b) Knitting.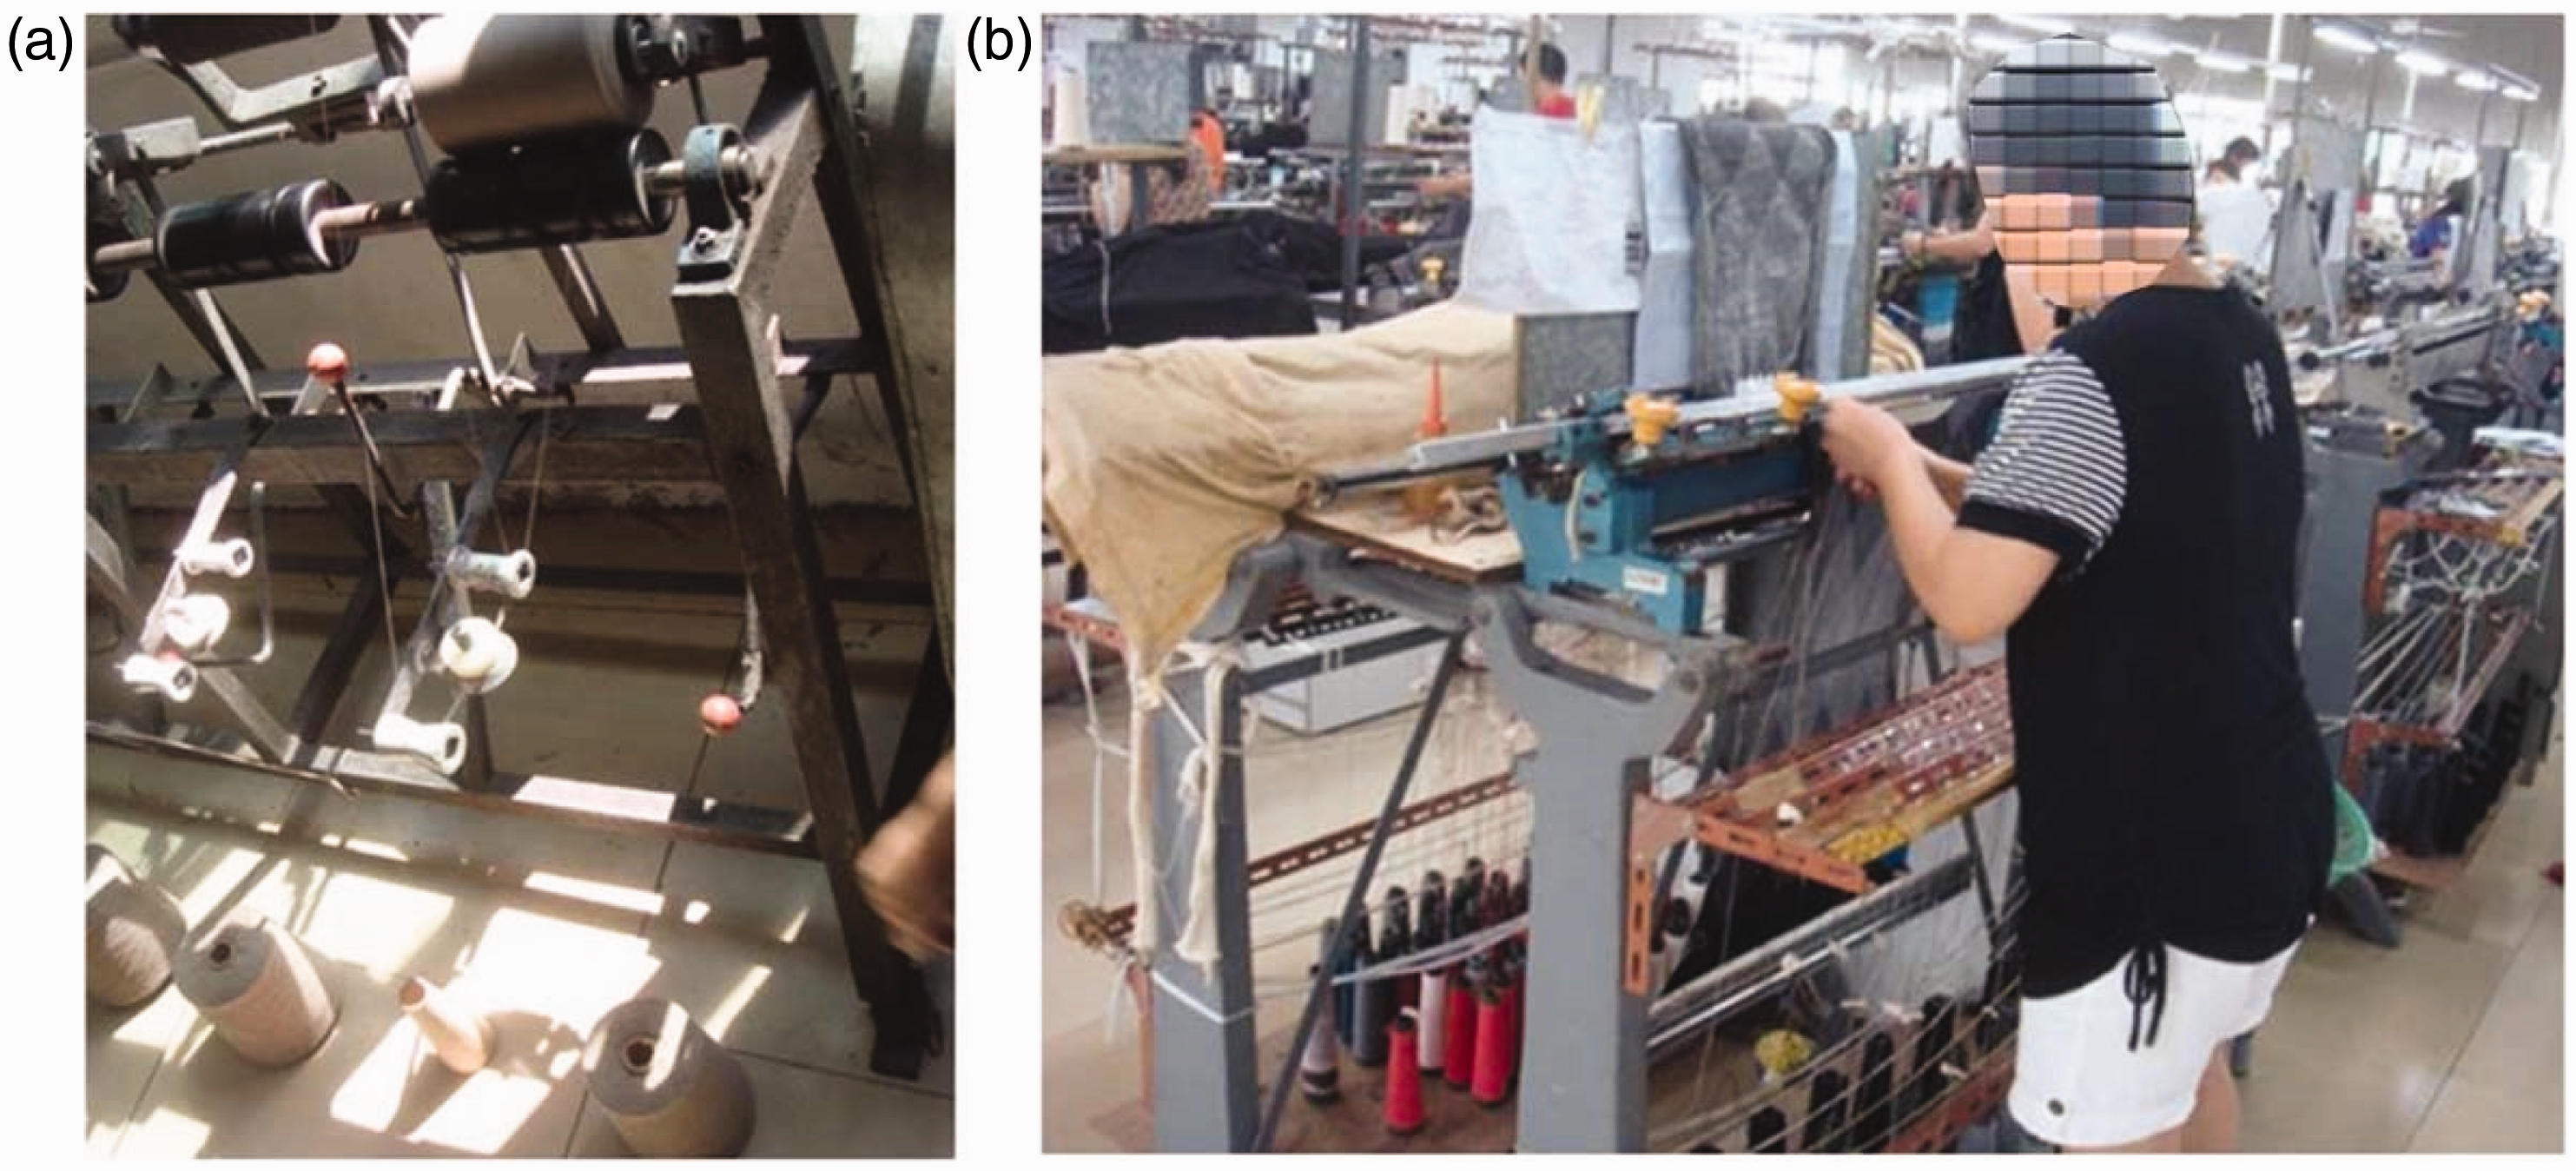
Assessment on resistance change after abrasion
Abrasion testing of all samples was carried out with a yarn abrasion tester (Shirley Development Limited, UK), with reference to the standard AATCC Test Method 61-2010. Lengths of yarn samples were mounted on yarn abrasion tester rollers that were covered with Nikken silicon carbide waterproof CC 1000-Cw and rotated at a high speed until the yarn broke. Five specimens of each sample were tested for an evolution number; that is, the number of rotations of the yarn abrasion tester until breakage. Then, ten specimens of each sample were again abraded by ¼, ½, and ¾ of the evolution number. The electrical resistance of each specimen of 10 cm length, including the abraded portion, was tested. SEM micrographs were taken to analyze the degree of peeling of Ag coatings after varying degrees of abrasion.
Apparel stage
Weaving and knitting are followed by the finishing processes, in which washing and ironing are the basic steps (Figure 2). The detailed arrangement of the conductive testing procedure at the apparel stage are given below.
Apparel stage processes. (a) Washing; (b) After ironing.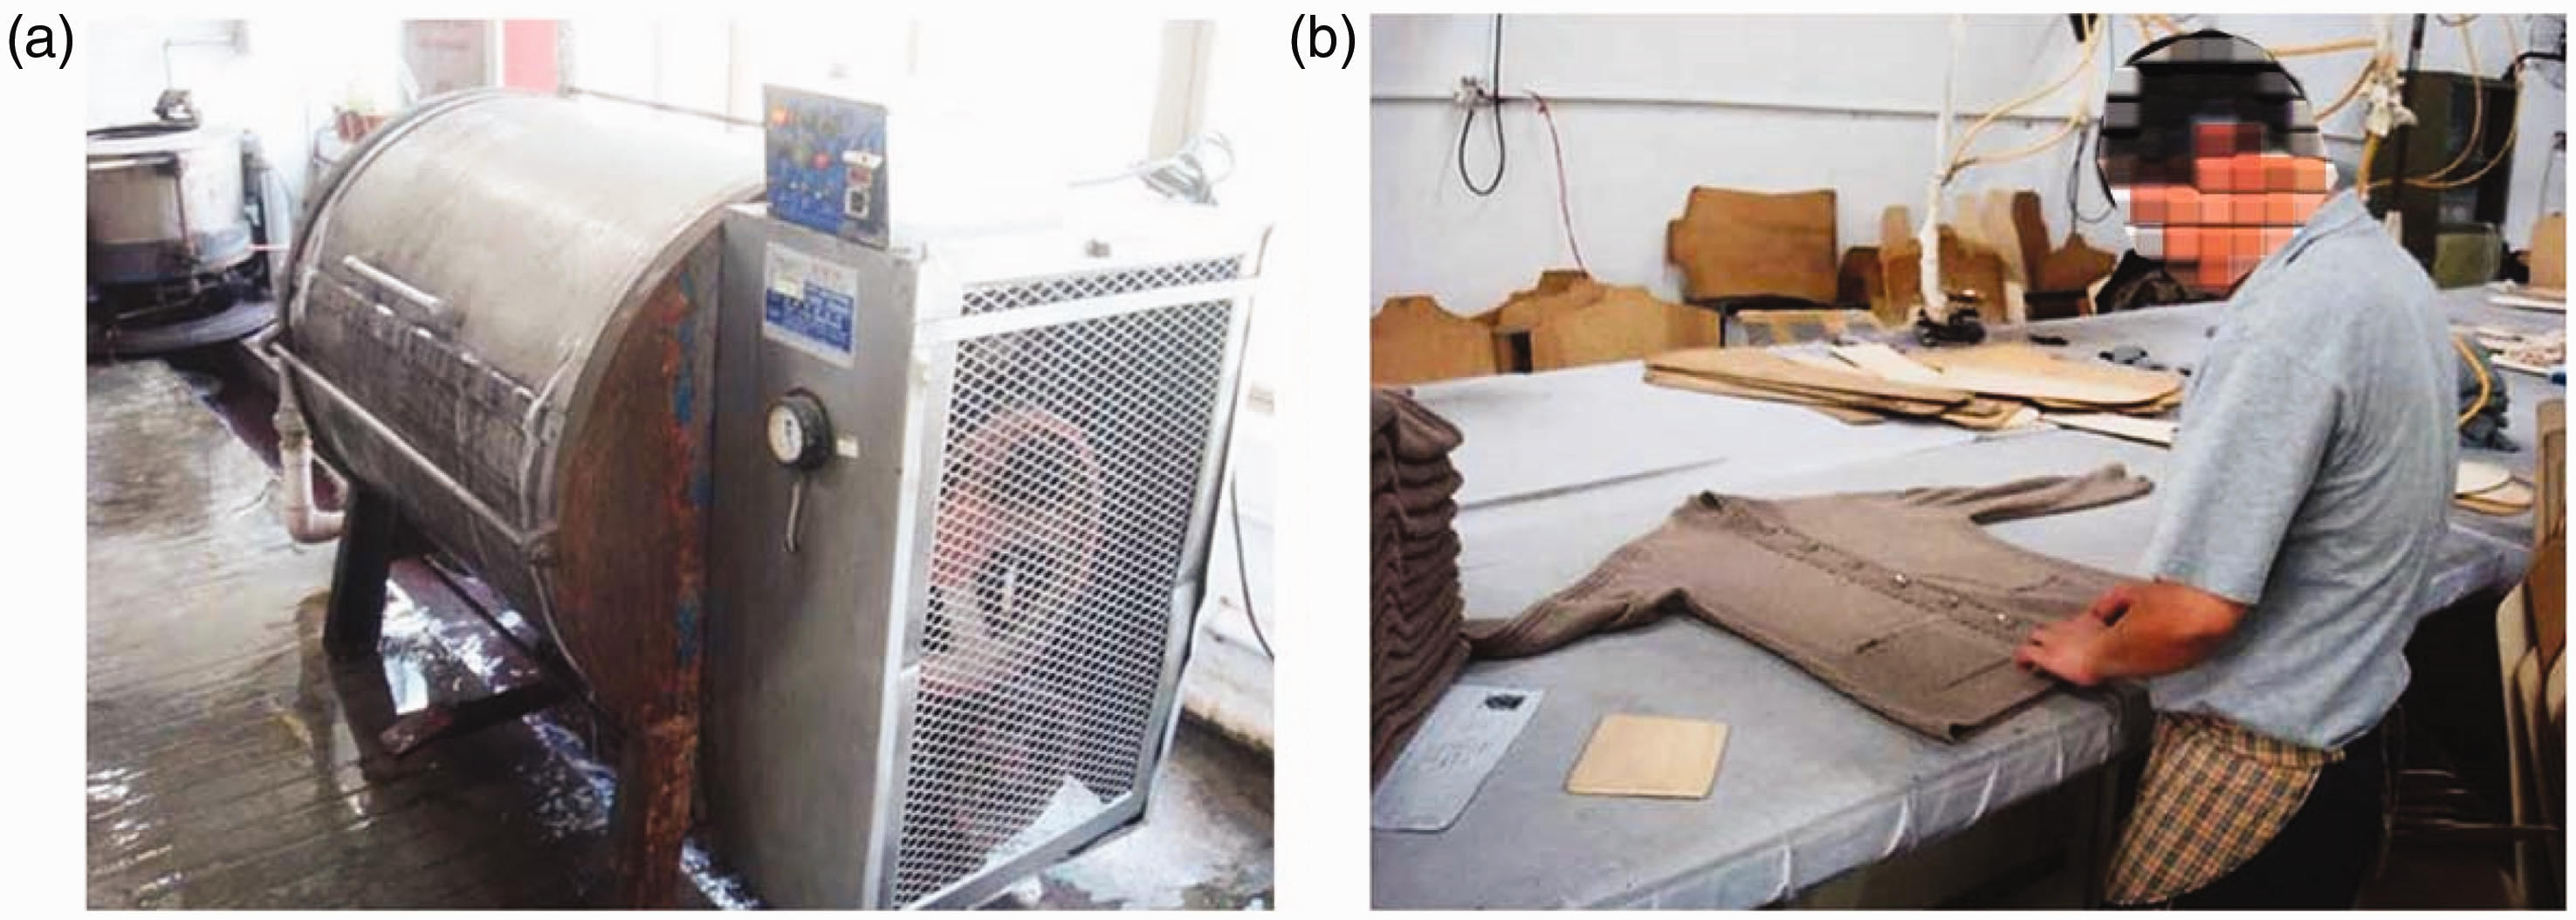
Laundry test
A laundry test of all conductive yarn samples was carried out with a Launder-Ometer (SDL Atlas, USA) in which samples underwent 10, 20, and 30 washing cycles at 40℃ for 45 min per cycle based upon the standard AATCC Test Method 61-2010. Ten specimens of each sample were tested in each condition. The electrical resistance of each 10 cm length specimen was then tested. SEM micrographs were taken to analyze the condition of the yarn after laundering.
Assessment of resistance change according to temperature
The electrical resistance of all samples was again measured with a digital multimeter (34401A Digital Multimeter, Agilent, USA). Resistance of conductive yarn samples was measured at temperatures of −60℃, −20℃, 20℃, 60℃, and 100℃. Resistance of conductive yarn samples at −60℃ was measured in liquid nitrogen. Resistance of conductive yarn samples at −60℃ and −20℃ was measured in a low-temperature testing box.
End user stage
Sweating is a normal physiological behavior. Therefore, it is also important to determine the impact of sweat upon the functionality of garments equipped with conductive yarns. The detailed arrangements for the Resistance testing procedure at the end user stage are given below.
Corrosion resistance test
The corrosion resistance test of all samples was performed at different concentration (0.5% and 5% (w/v)) of NaCl aqueous solution for different time (50 h and 100 h), respectively.
Since S4–S5 and S10–S15 were composed of the same conductive filaments, they showed almost the same results in tests. Only S4 and S5 would be selected for comprehensive testing. All conductive yarn samples were conditioned for 24 h under standard conditions (22℃, 65% RH) before each test.
Result and discussion
Yarn stage
Referring to Figure 3, among existing commercial products, CANY have three types of structures, including:
A blend of conductive/non-conductive fibers (S9); A single filament (S4); A blend of numerous conductive fibers (S1, S2, S3, S5, S6, S7, and S8). Types of conductive yarns with SEM micrographs. (a) Blend of conductive Ag fiber and other fibres; (b) A single Ag fiber; (c) A blend of conductive Ag fibers.
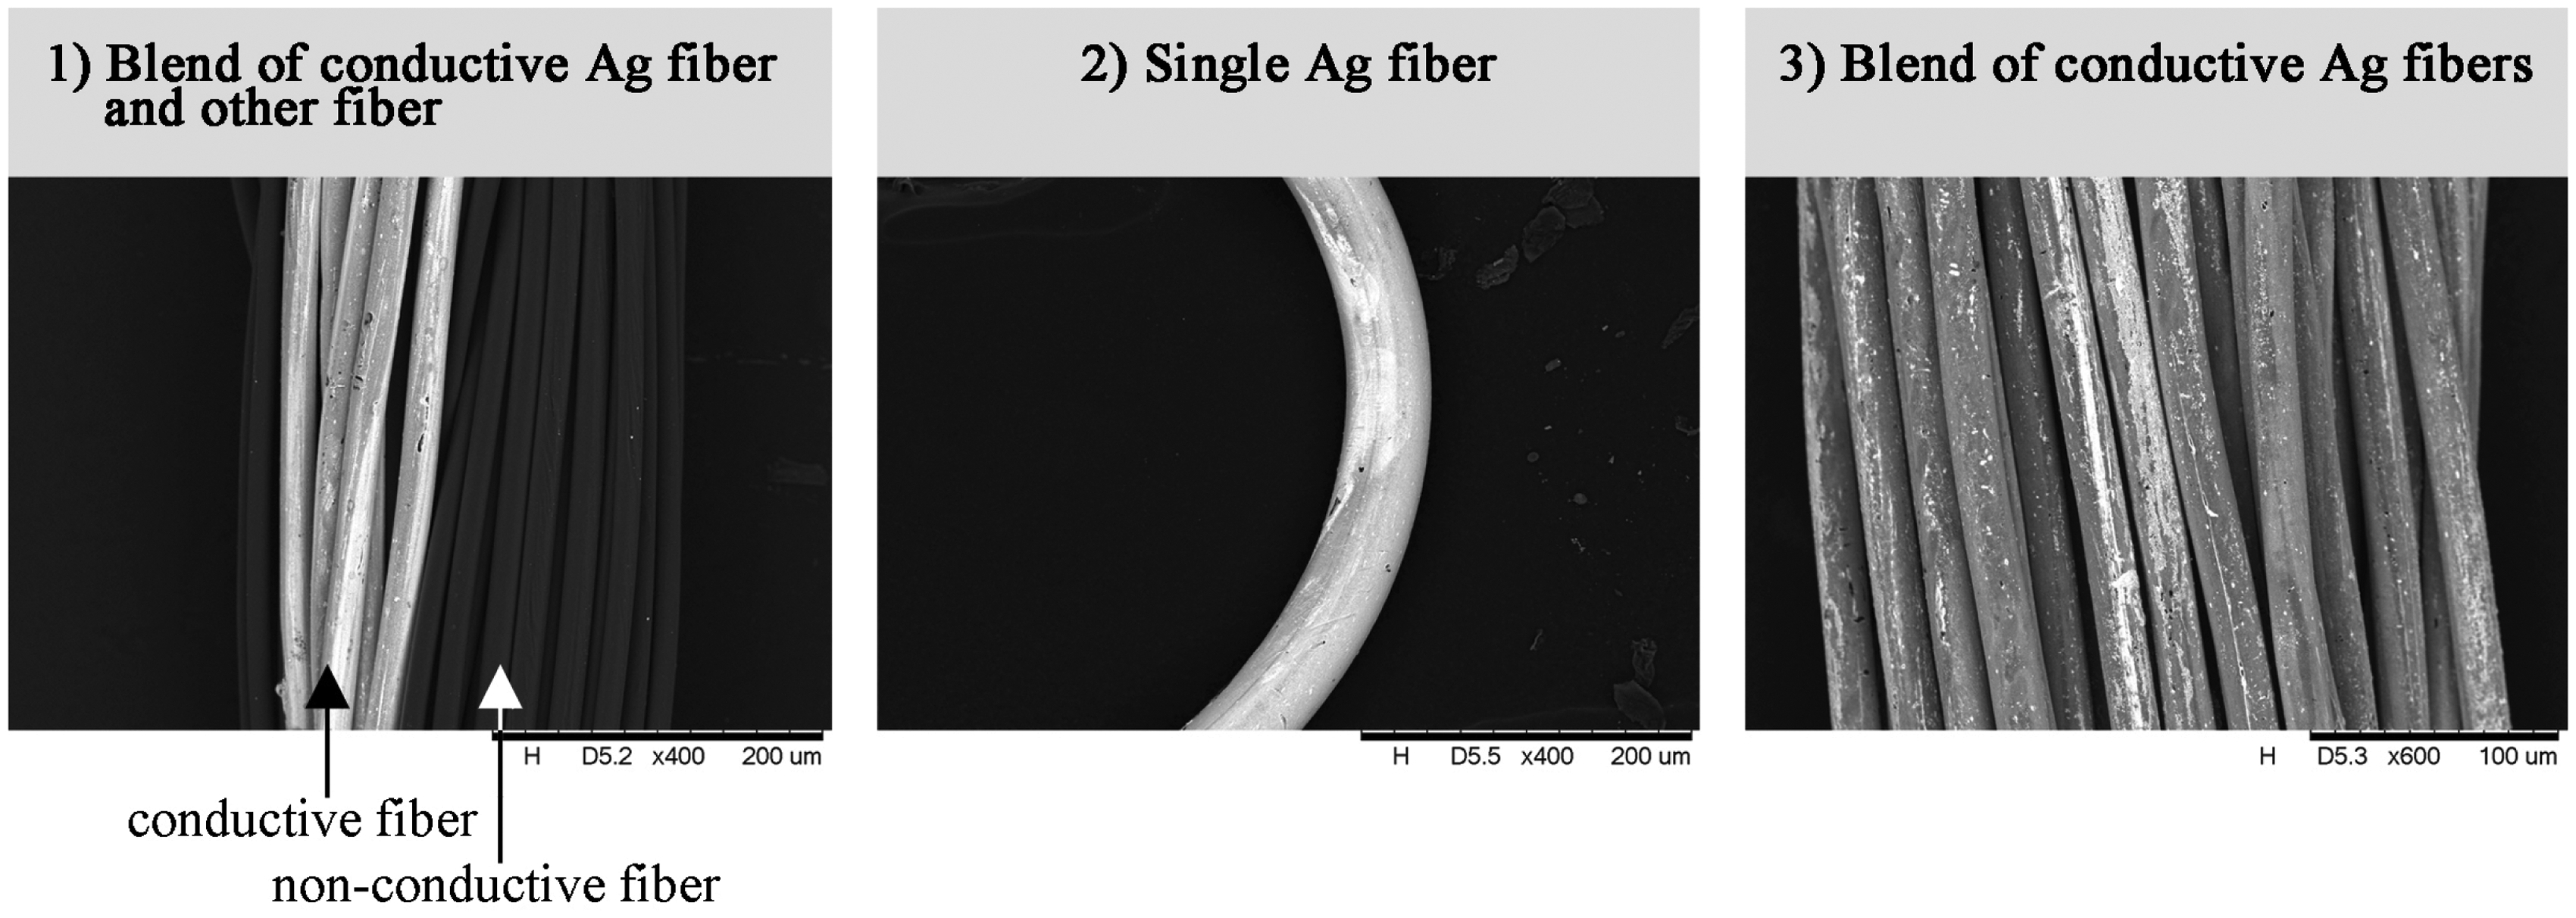
In general, conductive yarns with the first type of structure are cheaper than the third, due to its lower Ag content. Moreover, compared with the third type of conductive yarn, the first type should be more resistant to external corrosion with protection from non-conductive yarns, and should consequently be more stable in electrical properties under various conditions. However, conductive yarns with the third type of structure have the best conducting properties. The second type of conductive yarn has the smallest size and may be outstanding in some specific situations. Thus, these three types of conductive yarns have their advantages and disadvantages and the industrialist should select the right yarns during the first stage of manufacturing.
The stability of conductive yarns not only depends on the structure of the yarns, as mentioned above, but also the coating techniques. A good coating technique ensures uniform and steady coating of silver on the yarn surface. Figure 4 shows the surface morphology of conductive yarns. The EDS images in Figure 4 indicate that the conductive phase on the surface of all samples is silver. It seems that the surface of S7 is loose and non-uniform. The partial fiber substrate of S7 was exposed, which resulted in the high resistance and short lifetime in later tests. The silver coatings of S2, S5, S6, S8, and S9 exhibit a compact structure compared to that of the other samples. The compact structure of the silver coating may be related to the optimized preparation process of the fibres. The compact silver coating would contribute to better stability of CANY under various conditions. Furthermore, the silver coating of S1, S4, and S5 exhibits a uniform structure compared to that of the other samples, i.e. the size of silver particles shows an insignificant difference. Small pores are also shown on the surface of the S4 silver coating.
(a) Structure of conductive yarns; (b) Surface of conductive yarns with SEM/EDS micrographs.
The results of FT-IR spectra (Figure 5(a)) shows that all CANY samples had a similar chemical composition. They showed characteristic peaks at 3109 cm−1, 2922 cm−1, 2858 cm−1, 1630 cm−1, 1530 cm−1, 1396 cm−1, 1265 cm−1, and 1115 cm−1, which should be attributed to N–H stretching vibration, –CH2– asymmetric stretching vibration, –CH2– symmetric stretching vibration, amide I stretching vibration, amide II stretching vibration, –CH2– bending vibration, amide III stretching vibration, and C–C stretching vibration. These characteristic peaks indicated that the fibers should be nylon 6 or nylon 66.38–40 However, the FT-IR spectra of S5 included a peak at 935 cm−1, which was the C–CO stretching vibration of nylon 6. It is concluded that the fiber in S5 was nylon 66 and the fiber in other samples was nylon 6. Although nylon 66 and nylon 6 have the same ratios of carbon, hydrogen, oxygen, and nitrogen atoms, they begin with different polymer building blocks or monomers. Nylon 66 has a tighter, denser polymer structure than type 6 nylon. Therefore, nylon 66 melts at a temperature that is more than 40℃ higher than nylon 6. This indicates that nylon 66 products have a broader application temperature than nylon 6 products.
(a) FTIR spectra of conductive yarns; (b) DSC curves of conductive yarns; (c) TGA curves of conductive yarns; (d) Test results of a number of conductive samples in lengths of 10 cm, 20 cm, 50 cm, and 100 cm.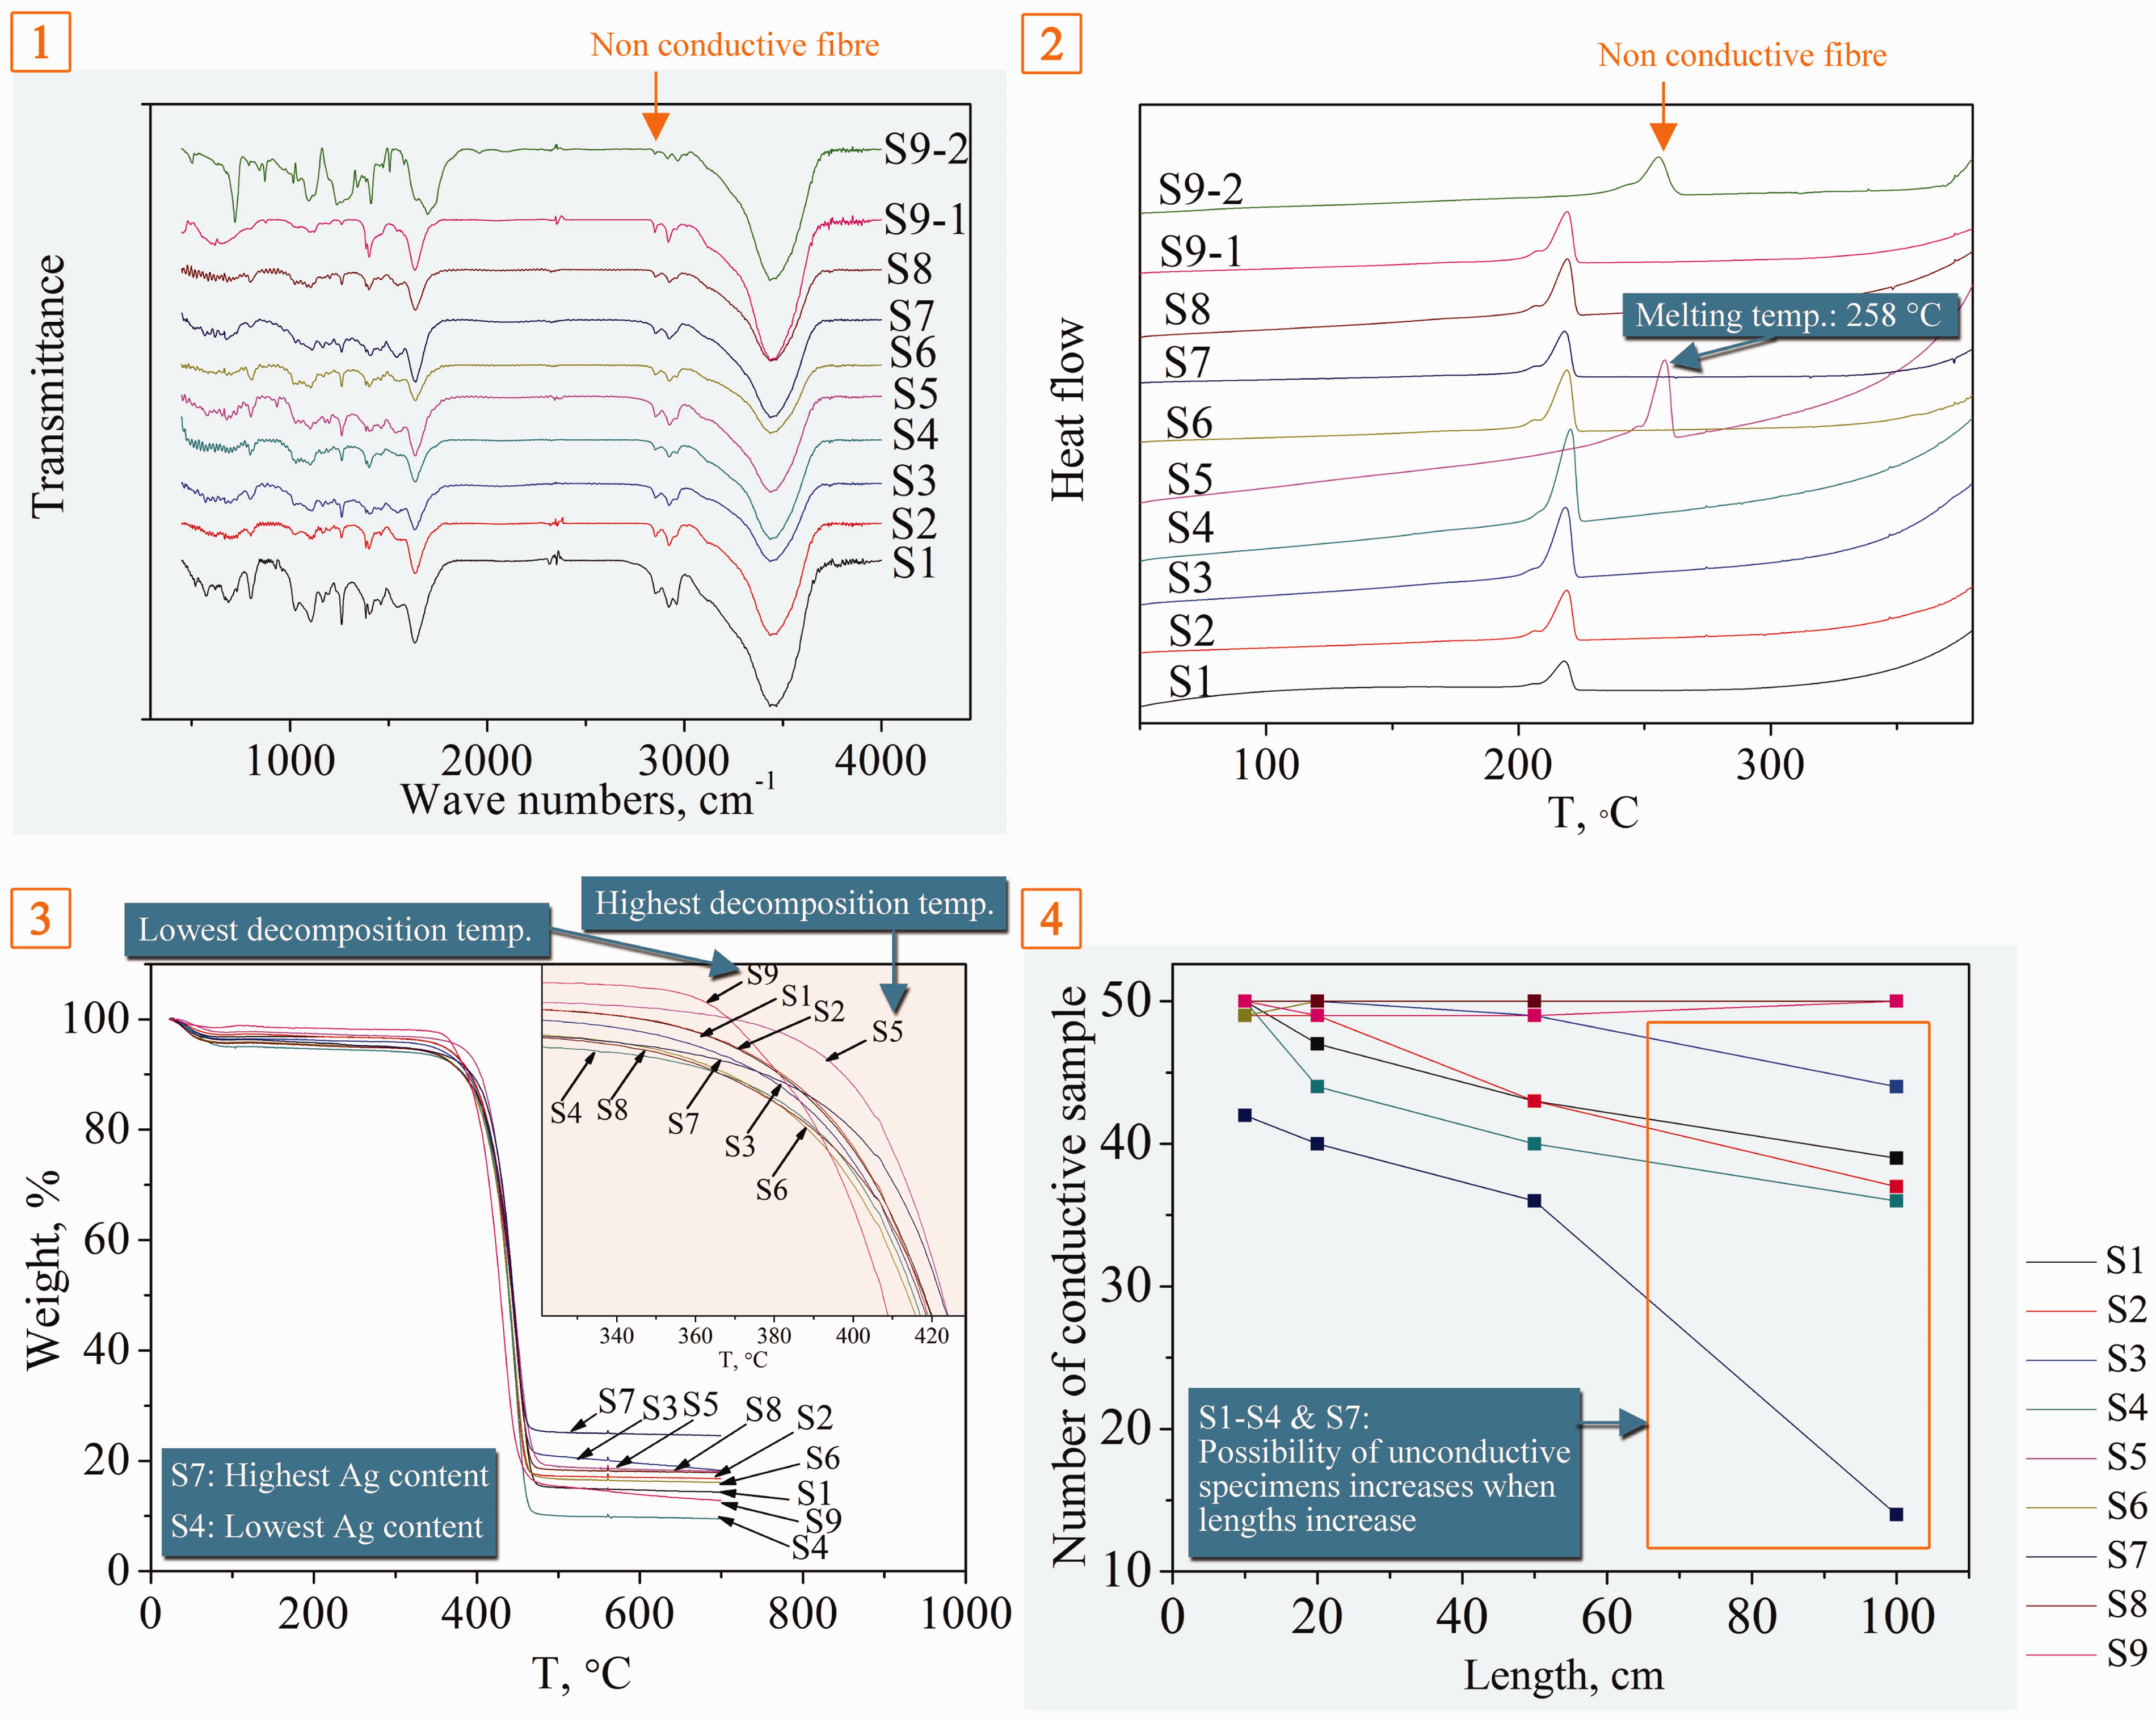
Figure 5(b) shows DSC curves for all of the CANY samples. The melting temperature of S1–S4 and S6–S9–1 was 220℃ ± 1℃ except for that of S5, which reached 258℃. In several studies, the melting temperature of nylon 66 and nylon 6 has been considered to be 260℃ ± 5℃ and 220℃ ± 5℃, respectively. This further affirmed that the inner fiber of S5 was nylon 66 and the inner fibers of other samples were nylon 6.
Figure 5(c) shows TGA curves for all of the CANY. The fiber of S5, which is composed of nylon 66, shows the highest decomposition temperature. The fiber of S9 shows the lowest decomposition temperature in all samples. It can be observed that the Ag content of S4 is the lowest among all samples, while the Ag content of S7 is the highest. In general, the CANY with the higher Ag content have a higher conductivity if the Ag coating is uniform. However, the higher Ag content of S7 did not show any superior performance in later tests. Accordingly, the structure of silver coating may be the key factor for resistance stability of CANY.
The electrical resistance stability of CANY in different lengths is essential to its application; for example, thermal generation behavior is closely related to the value of electrical resistance. By analyzing the test results for a number of conductive samples with different lengths, as shown in Figure 5(d), it could also be shown that the possibility of nonconducting specimens increases when lengths increase for S1–S4 and S7.
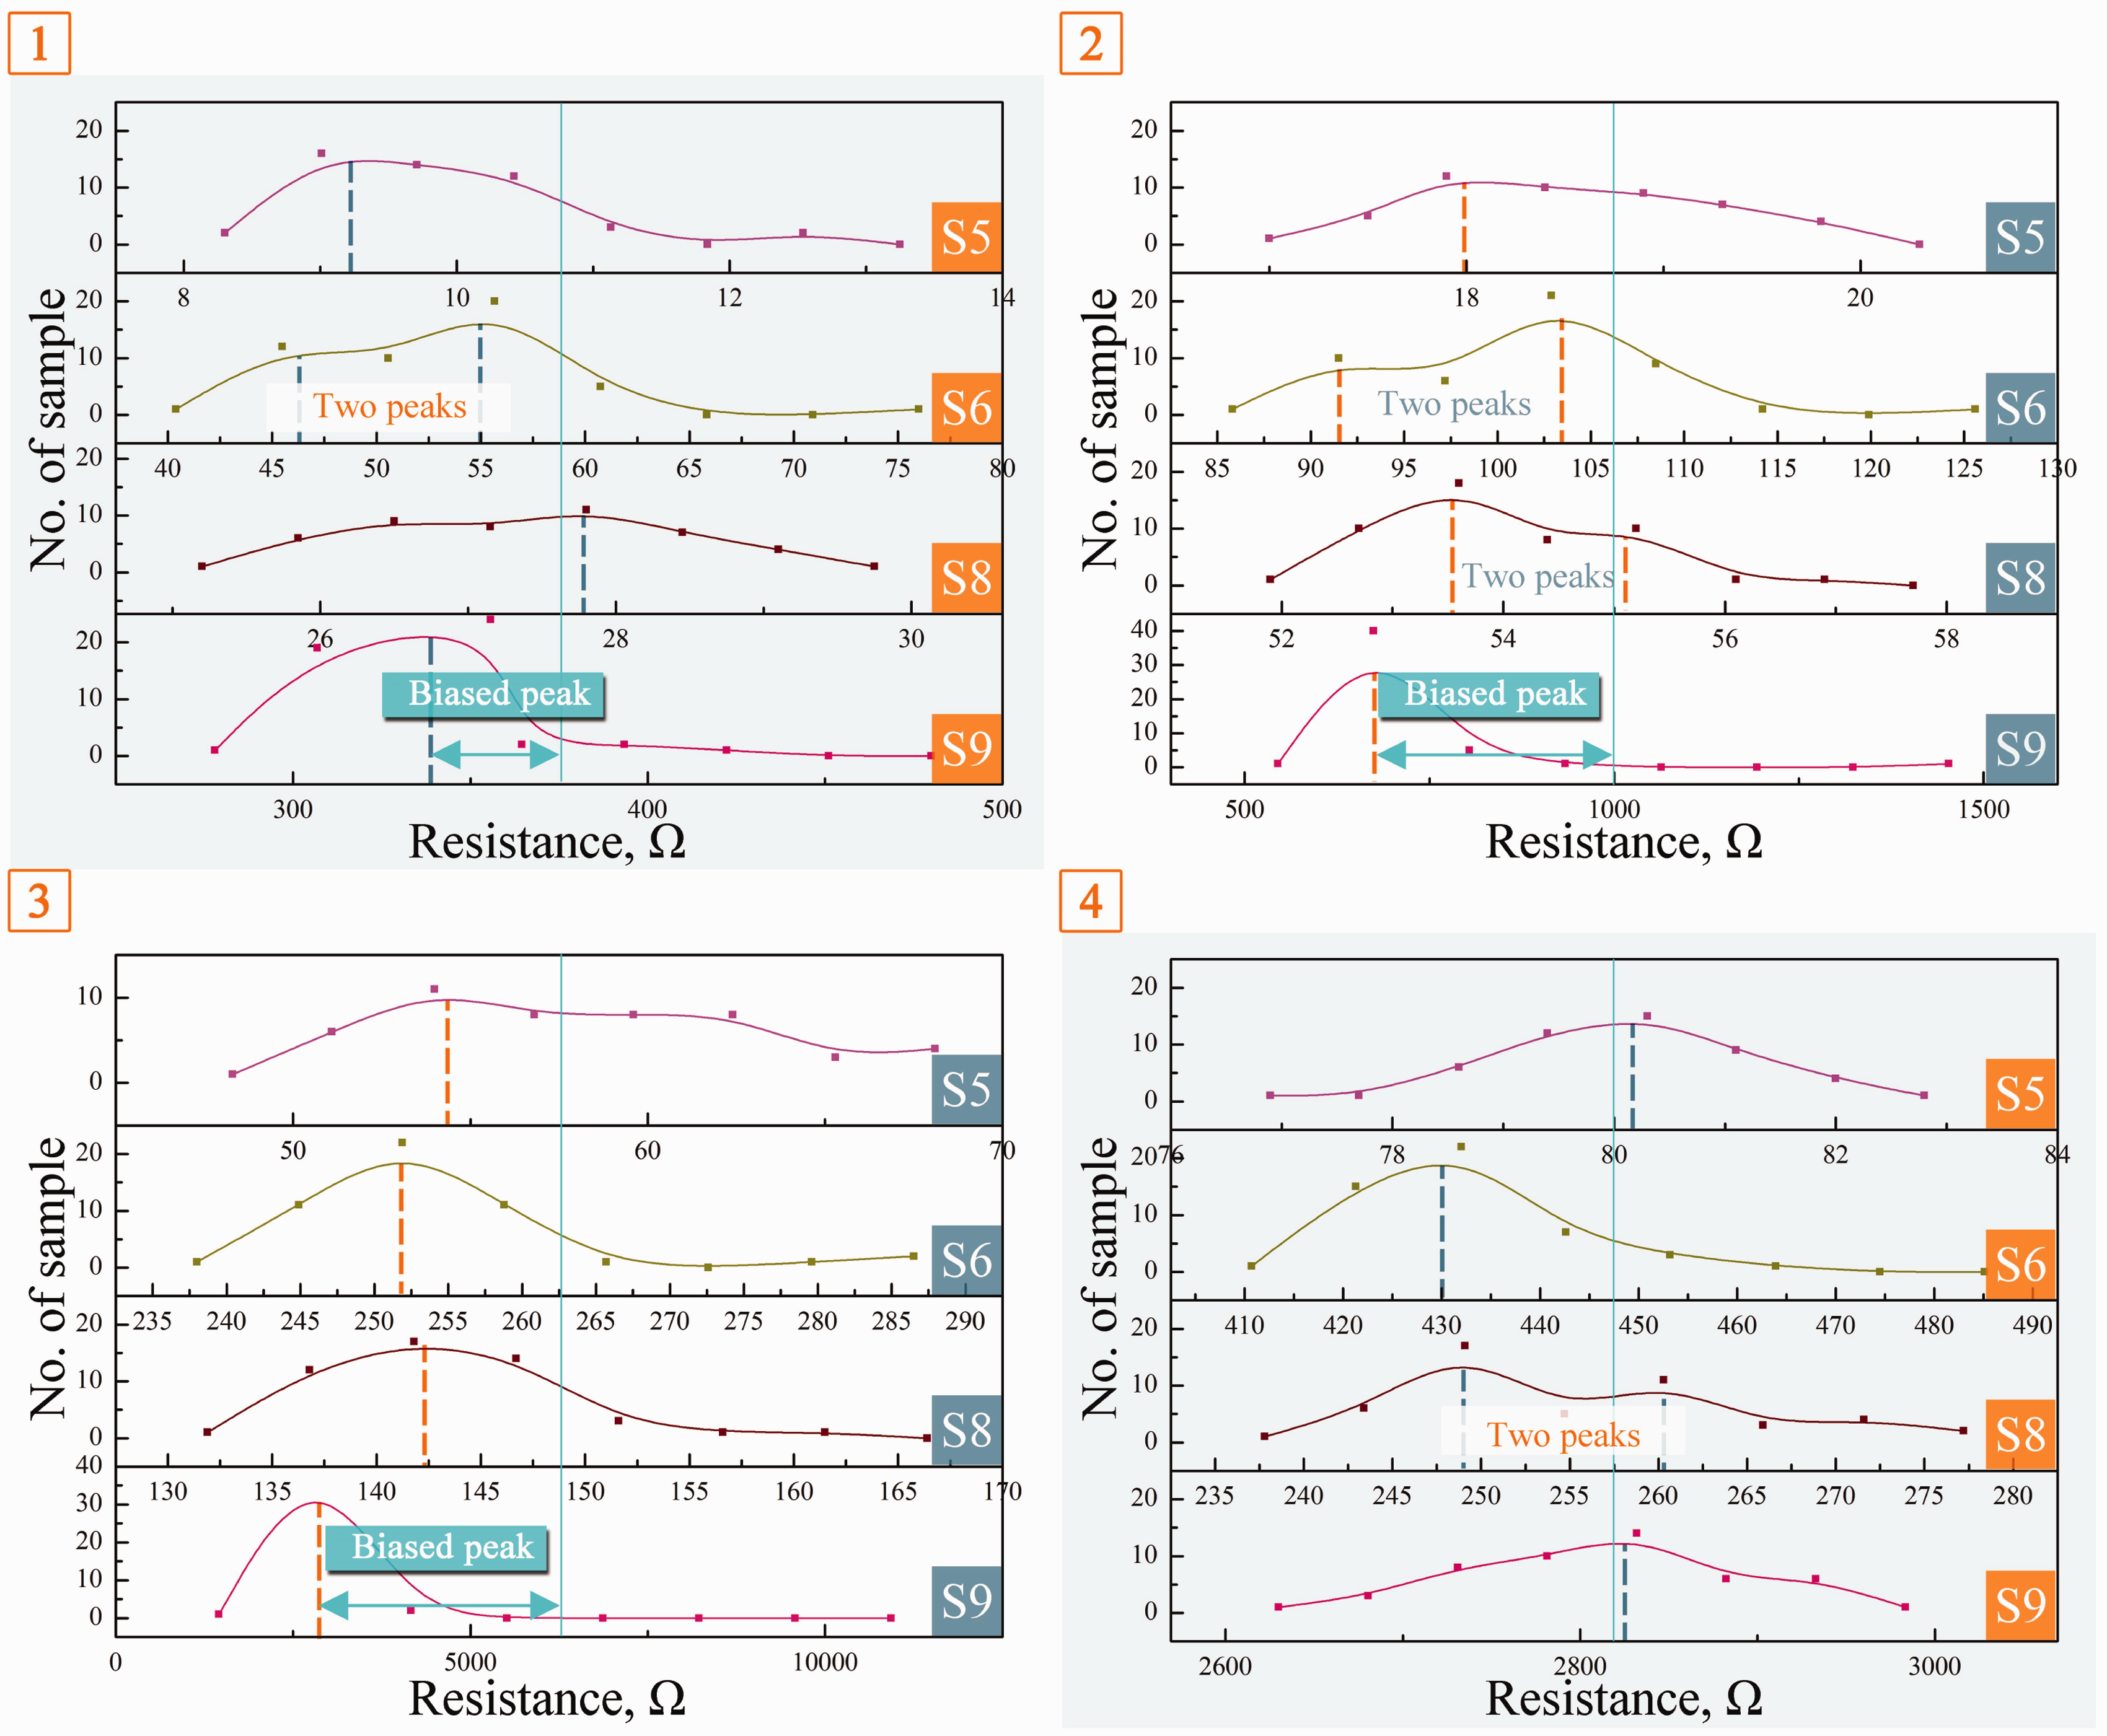
The selected silver yarns should also be reliable in resistance distribution along the yarn. Significant resistance difference should not exist in conductive yarns in the same length. Figure 6 shows the test results for electrical resistance of S1–S9 specimens in lengths of 10 cm, 20 cm, 50 cm, and 100 cm. With the increase in length of the test specimens, the electrical resistance tended to fluctuate in greater amplitude because coating flaws are more likely to exist in a longer yarn. This was again more obvious for S4 and S7. An explanation could be that, since S4 is only composed of a single conductive fiber, once there is a defect in the Ag coating layer, conductivity drops. The low stability result for S7 can be attributed to its loose and non-uniform Ag coating, as referred to in Figure 2. Unusually, S5, S6, S8 and S9 maintained conductivity in different lengths, as shown in Figure 5(d). To further investigate the conductivity of these four samples, resistance stability was further analyzed, as shown in Figure 7. The resistance of S5 and S8 was more stable. This could be concluded from the symmetrical shapes of the normal curves of the sample test results. However, the normal curves of some test result for S8 appeared to have two peaks. The two-peak condition can also be observed from that of the 10 cm and 20 cm tests of S6, in which yarn conductivity is less stable. During the 50 cm and 100 cm tests, normal curves for the sample tended to be more symmetrical. This explained why the sample became more stable when the length of the test specimens increased. During the 10 cm, 20 cm, and 50 cm tests of S9, the peaks appeared to be biased. This showed that it was slightly less stable than S5 and S8. There was a certain possibility that resistance instability would occur. The situation improved when the testing length increased.
(a) Resistance of conductive yarns of specimens in 10 cm lengths; (b) Resistance of conductive yarn specimens in 20 cm lengths; (c) Resistance of conductive yarn specimens in 50 cm lengths; (d) Resistance of conductive yarn specimens in 100 cm lengths. (a) Normal curves of a number of 10 cm samples for resistance; (b) Normal curves of a number of 20 cm samples for resistance; (c) Normal curves of a number of 50 cm samples for resistance; (d) Normal curves of a number of 100 cm samples for resistance.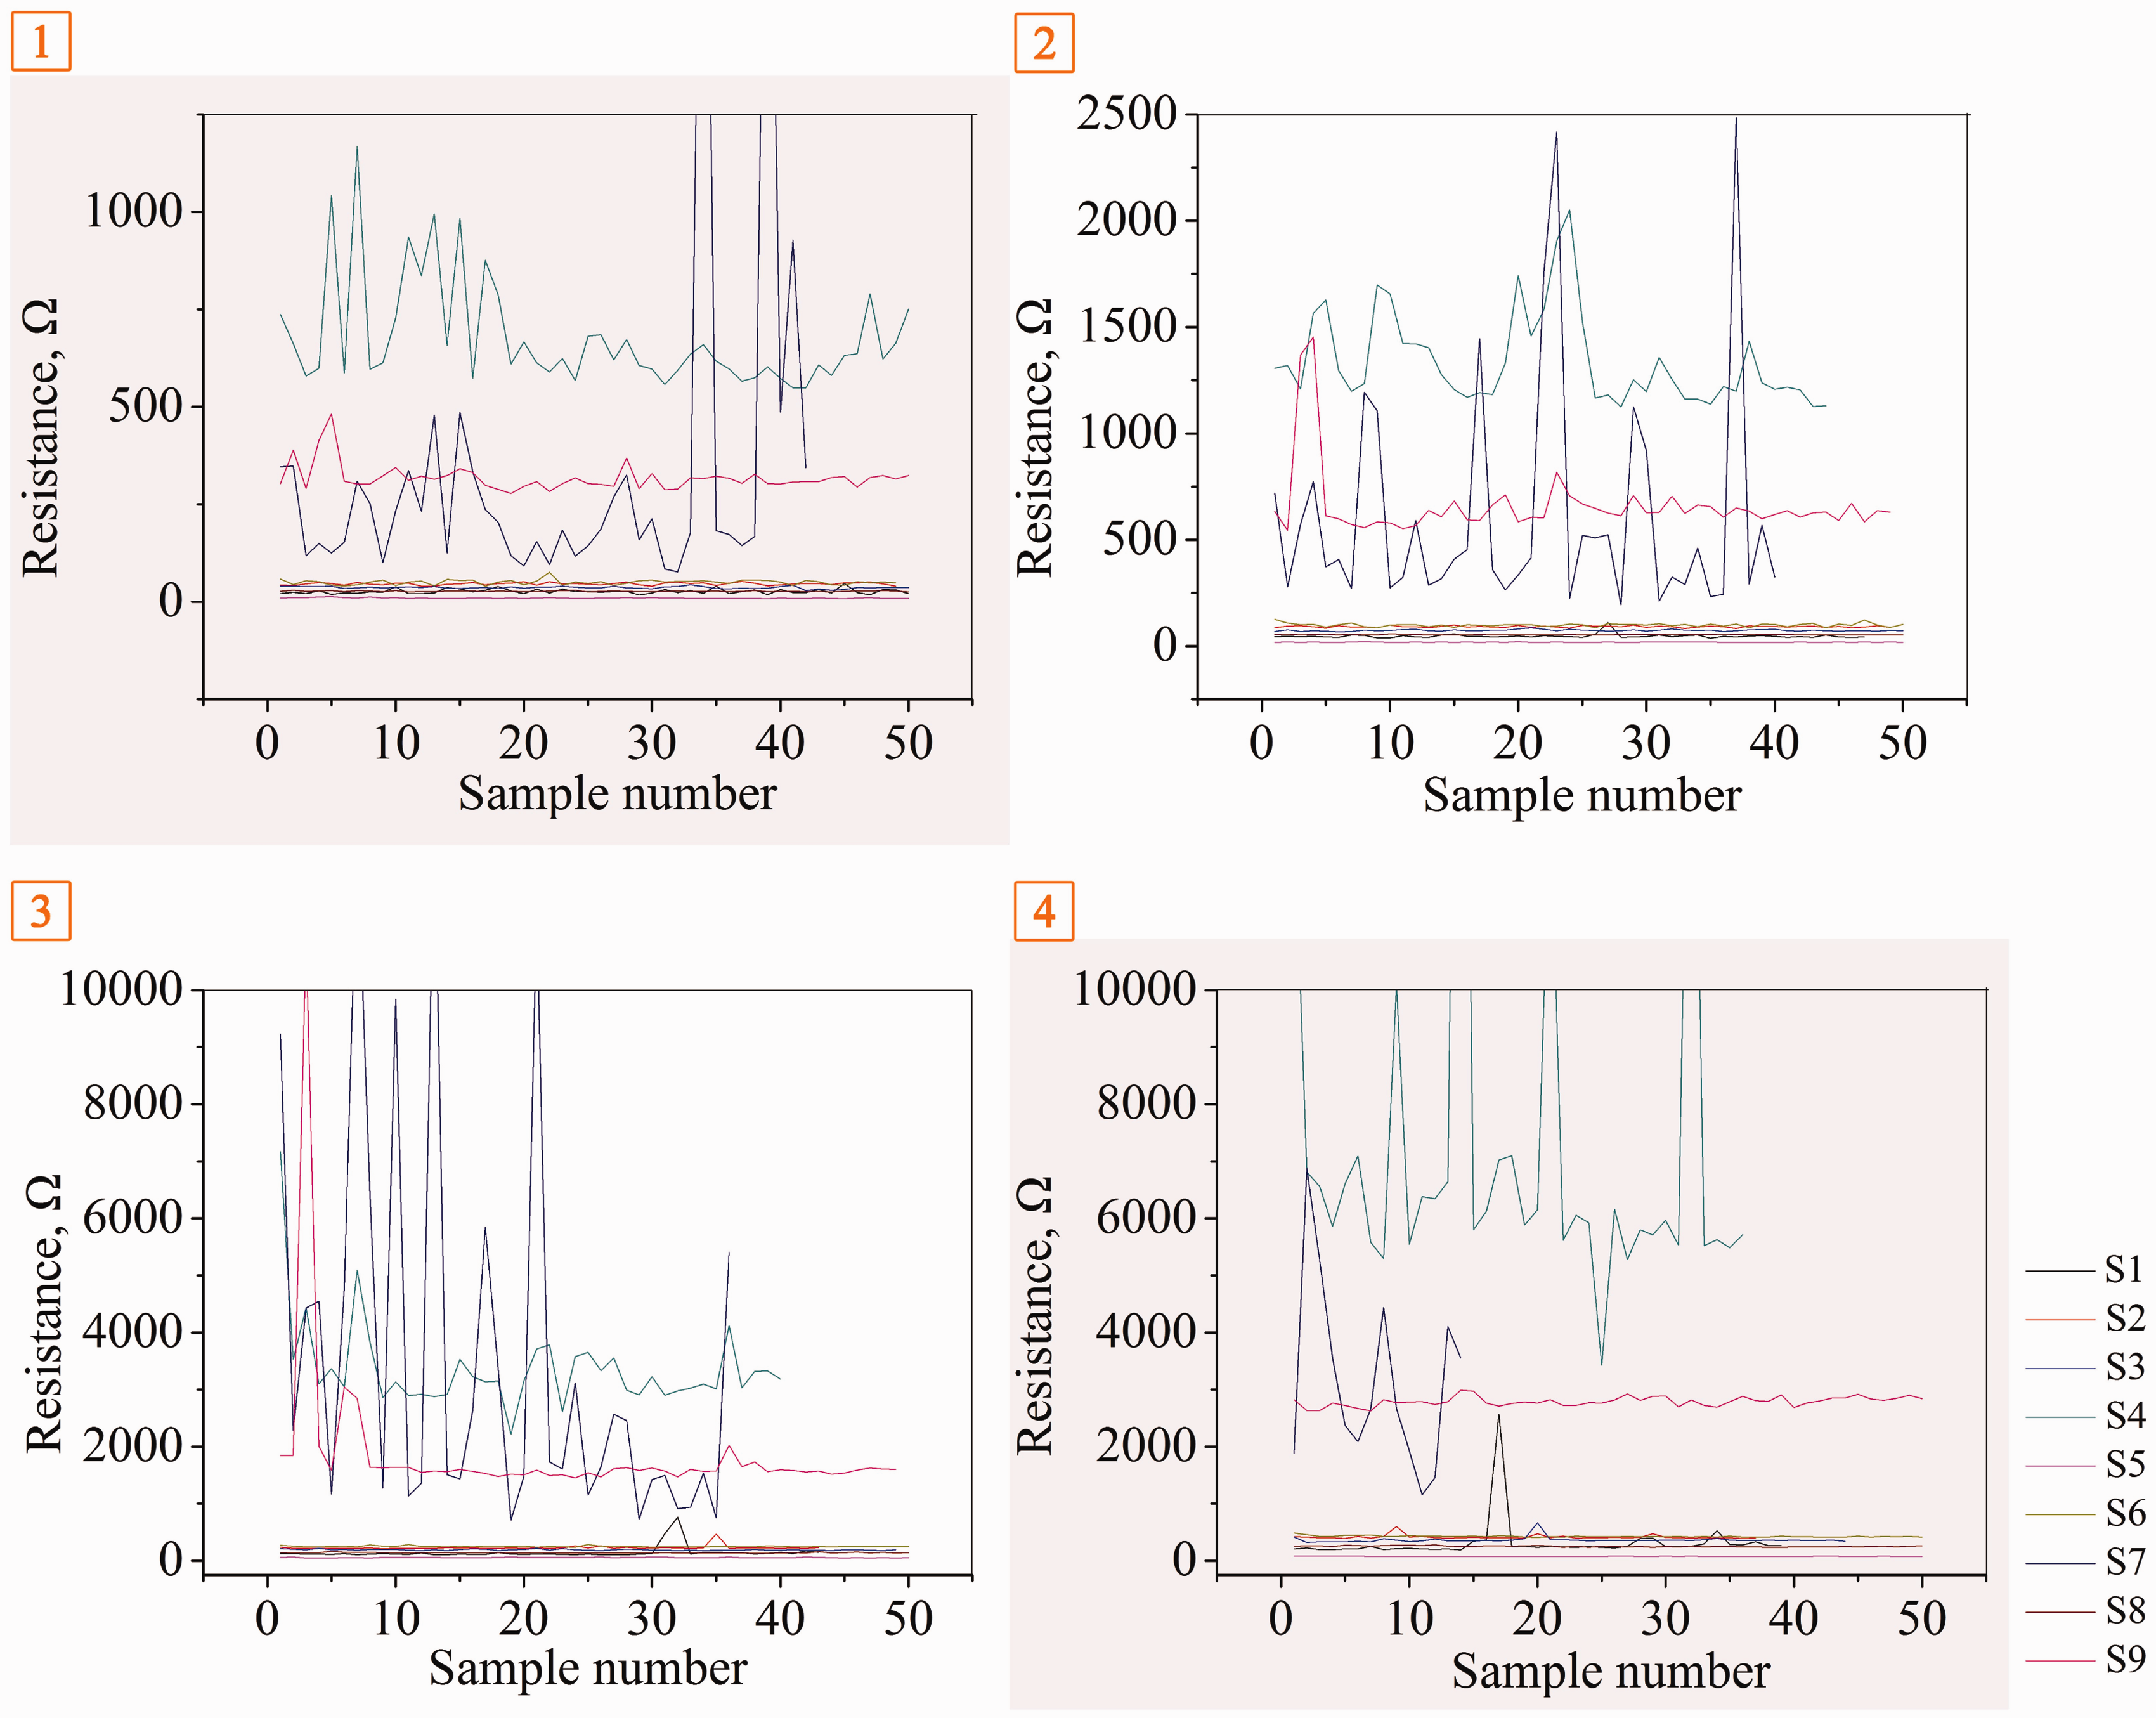
As the yarns would be stretched during the manufacturing process and in use after production, the selected silver yarns should not be easily broken or have large changes of resistance in the stretching process. Figure 8 shows the relationship between resistance and elongation of CANY during the stretching process. This result was closely related to its potential to be applied with other textile materials after being constructed into a fabric, such as its stretching ability and resistance stability. The resistance of all samples was much increased during the stretching process, since the different ductilities of the silver and the inner fiber can result in a separation between the silver coating and the inner fiber or cracks in the silver coating. The resistance of S7 exhibits the fastest growth during the stretching process and increased 12 times, while its elongation reached 30%. The poor bond between the silver coating and the inner fiber should be the main reasons for fast growth of S7 resistance. The trend of increase of resistance for S1 and S4–S6 is relatively smoother during the stretching process. S2 and S8 exhibit a similar trend when the elongation was less than 20%. However, this trend changed obviously when the elongation exceeded 20%. Referring to Figure 4, the compact silver coating of S2, S4–S6, and S8 can improve resistance stability during the stretching process. We also found that S4 had the best performance during elongation, which should due to its single filament structure.
Resistance of conductive yarns during elongation.
Fabric stage
Resistance of conductive yarns after abrasion


(a) Resistance of conductive yarns after abrasion; (b) SEM micrographs of the resistance of conductive yarns after ½ abrasion.
The result showed that the electrical resistance of all conductive yarns tends to increase with an increase of rotation number. The resistance of S2 and S3 increased dramatically after ¾ abrasion while S4, S7 and S9 were open circuit after ½ of the evolution number abrasion. Among the nine samples, S5 and S8 exhibited good stability even after ½ abrasion since the increase of resistance was only 26.9% and 5.2%, respectively. Moreover, SEM images of S7 indicate that open circuits in S7 were attributed to the exfoliation of silver coating. It is evident that the poor bond between the inner fiber and the silver coating caused the open circuit after ½ abrasion. This will be a simple and effective way to estimate CANY stability during the abrasion process using the variation in CANY resistance after different degrees of abrasion.
Apparel stage
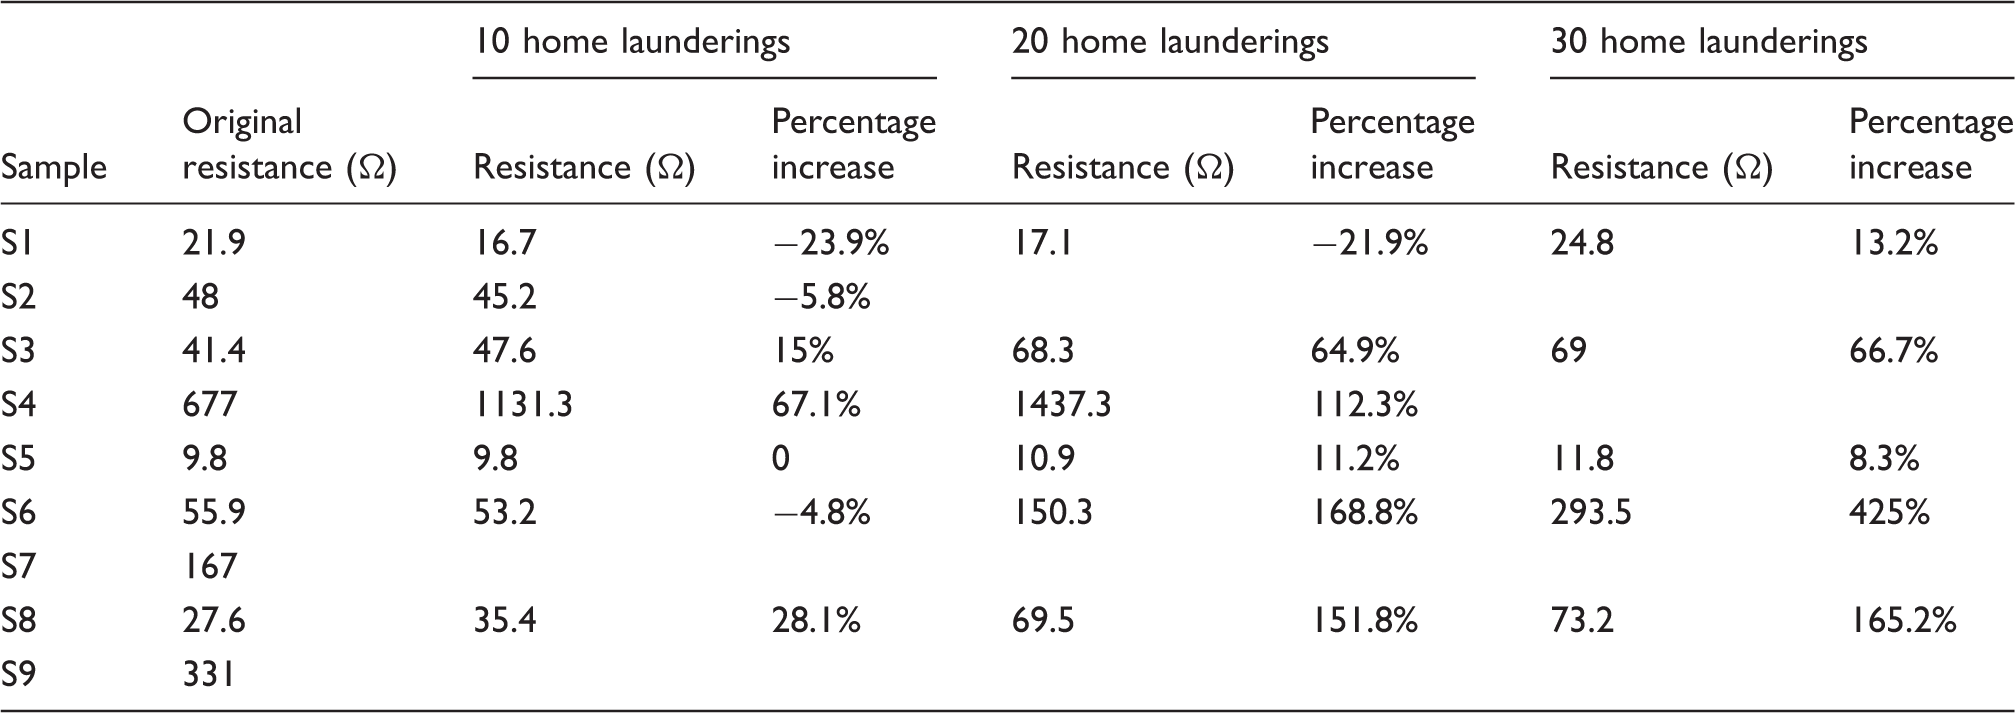
Resistance of conductive yarns after 10, 20, and 30 home laundering cycles

SEM images of conductive yarns after 10, 20, and 30 home laundering cycles.
The electrical resistance of S5 was the most stable during home laundering, showing only 8.3% resistance increase after 30 home laundering cycles. S7 and S9 lost their conductive properties permanently after 10 home laundering cycles. The silver coating of S7 was peeled off in abundance after 10 laundering cycles. A similar phenomenon was observed on the surfaces of S2, S4, and S9 after 30 laundering cycles. The massive exfoliation of silver coating must result in the open circuits in S2, S4, and S7. As shown in Figure 10, S9 shows a relatively well-preserved silver coating after 10 and 20 laundering cycles, but the embedding of conductive fibers into non-conductive fibers was often found, which caused the probe to fail to make contact with the silver coating, and further caused an open circuit in S9. The result implied that the CANY silver coating applied in conductive garments could be better preserved by reducing the possibility of abrasion during laundering.
Apart from laundering, garments made with CANY may be dried by processing and used for heat generation. CANY may also be applied to garments that are exposed to different extreme environments during wear and use. Therefore, another important quality to be assessed for CANY applications would be resistance change when related to temperature. As shown in Figure 11, all samples show asimilar trend of electrical resistance variation with temperature. The resistance of all samples increased with an increase of temperature. The thermal expansion of nylon 6 and nylon 66 is much larger than that of silver from −60℃ to 100℃, thus the silver coating may crack with the increase in temperature, which results in the resistance increase in all samples. The glass state temperature of nylon 6 and nylon 66 is in the range 60–70℃. In general, the thermal expansion of polymers shows a relatively sudden increase at the glass transition temperature, and therefore the resistance of all samples increased more from 60℃ to 100℃. When the temperature increased from 60℃ to 100℃, the resistance of S5 increased by 29.3%, which is the largest in all samples. In contrast, the resistance of S5 decreased by 1.4% from 60℃ to −60℃, which is the smallest in all samples. The resistance of S9 showed the biggest decrease of 13.5% from 60℃ to −60℃. In the future, the CANY can be applied as temperature sensors due to their resistance varying with temperature.
Resistance variations of the conductive Ag/nylon yarns with temperature.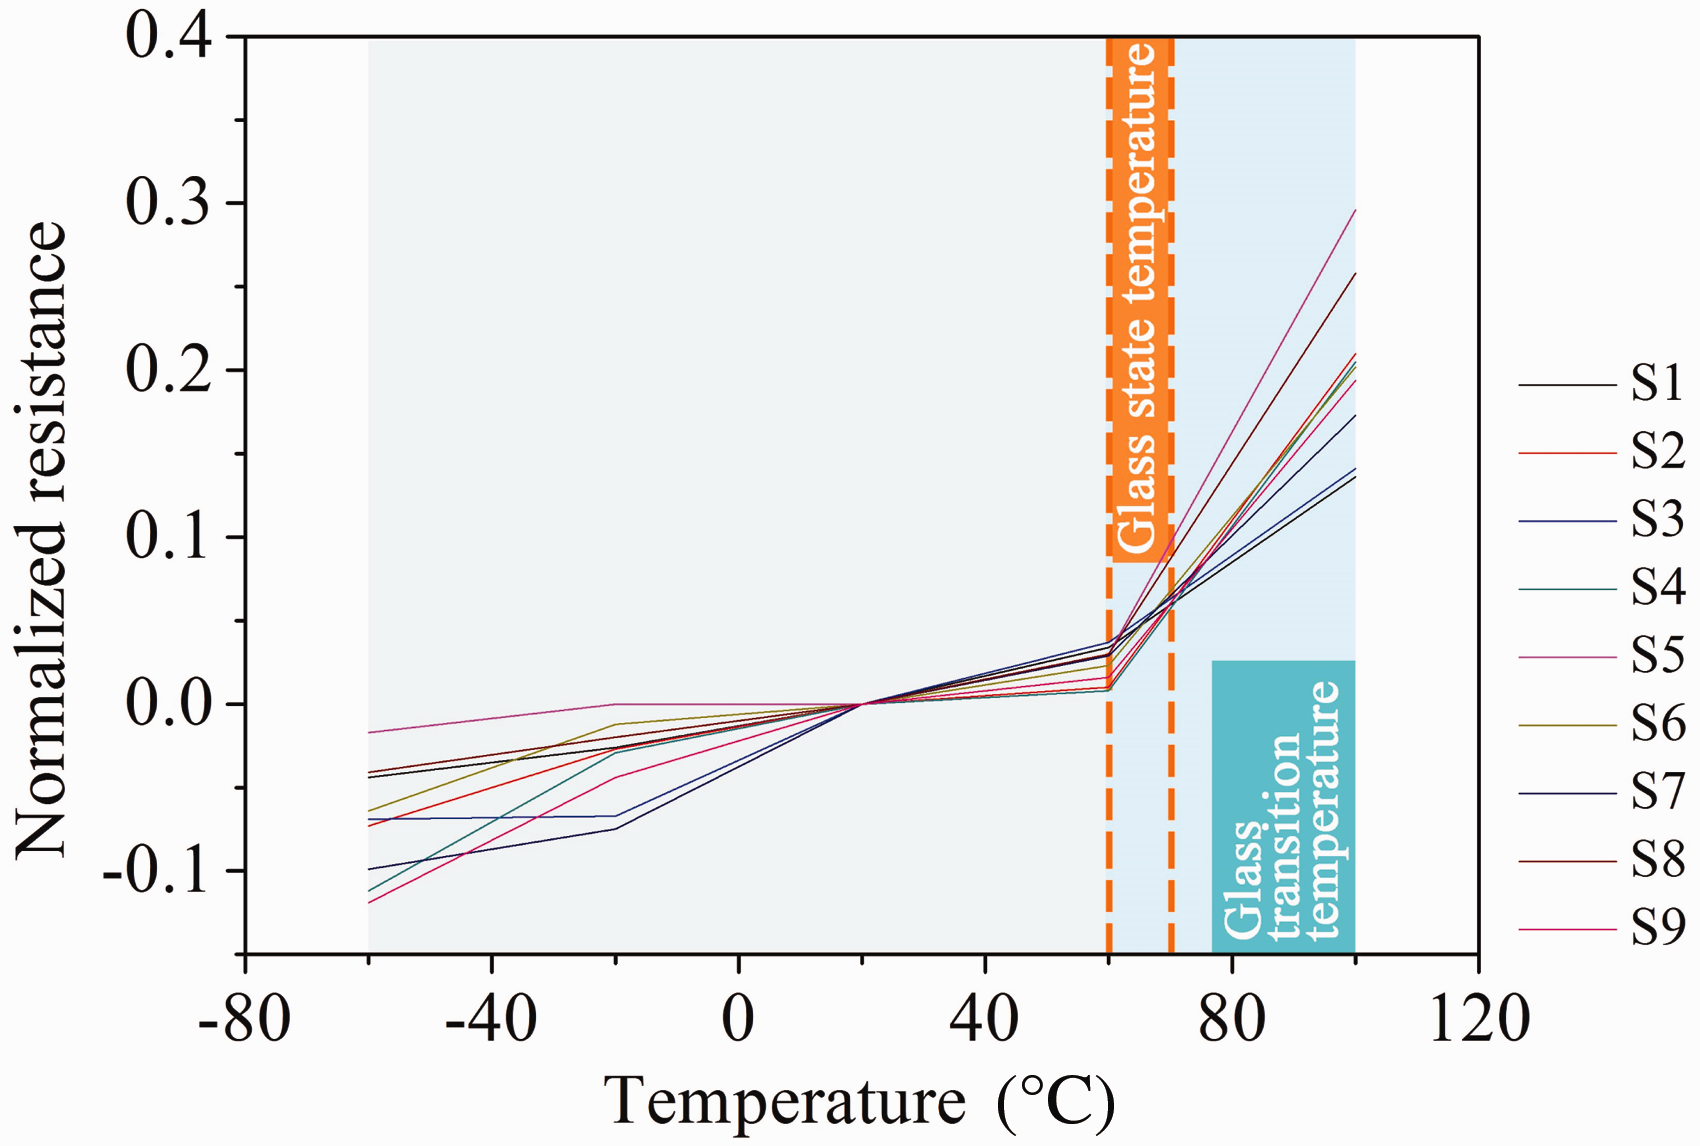
End user stage
Resistance of the conductive yarns after immersion in 0.5 % NaCl aqueous solution

Resistance of the conductive yarns after immersion in 5% NaCl aqueous solution
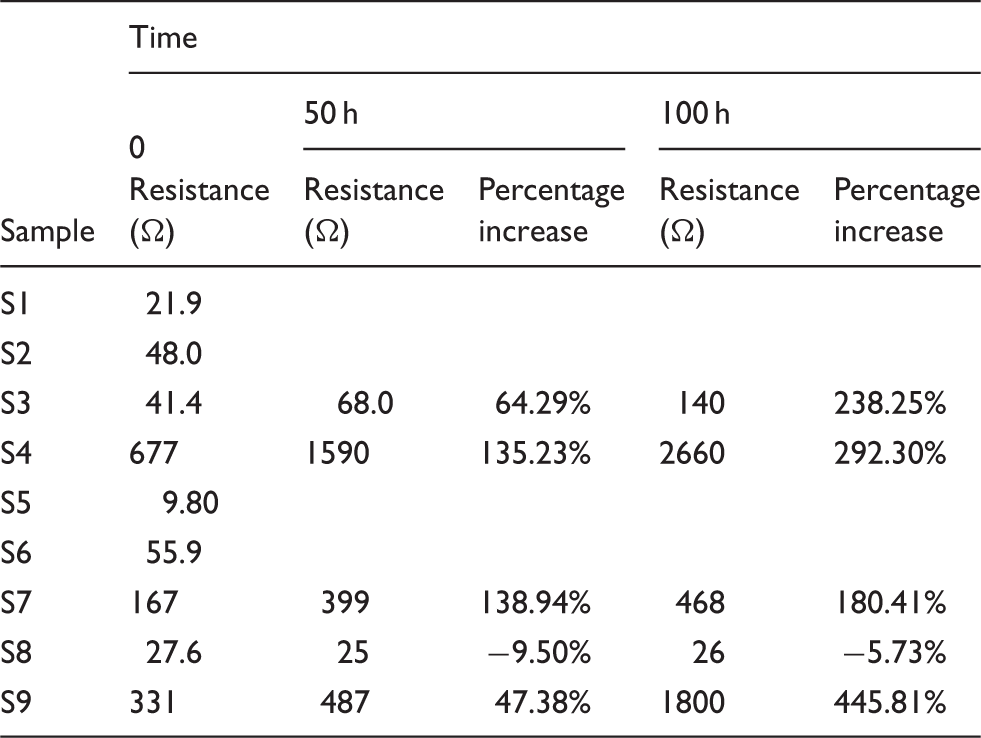
The resistance of S2, S3, S5, S6, S8, and S9 decreased while soaking in 0.5% NaCl aqueous solution for 50 h and 100 h, as shown in Table 4. Silver can be corroded by NaCl solution because a few Ag+ cations on the surface of the silver coating and Cl− in NaCl aqueous solution formed AgCl, and AgCl continued to react with Cl− anions in NaCl aqueous solution and formed [AgCl2]− complexes, which led to dissolution of the silver. As the silver coating of the fiber was compact, silver coating can became more clear after a small amount of silver has dissolved, which should be the main reason for the resistance decrease of the samples. If the silver coating is loose and have a large surface area, a great deal of AgCl can form and the dissolution of the silver coating will accelerate.
As shown in Figure 12(a), there are a lot of white grains on the surface of S7, which may result from the formation of AgCl on the silver coating. Since AgCl is an insulator to electricity, the resistance increase for S7 after 100 h increased by 70.04%. Moreover, Figure 4 shows that there are a lot of pores on the surface of S4, which promoted the corrosion of silver and led to a resistance increase after soaking for 50 h and 100 h in NaCl aqueous solution. Similar to the situation observed for S7 after 100 h immersion in the 0.5% NaCl solution, most samples were covered with the white insulative AgCl grains after soaking in 5% NaCl aqueous solution for 100 h, as shown in Figure 12(b). The Ag layer of S1, S2, S5, and S6 dissolved quickly, resulting in an open circuit after 50 h immersion. S8 maintained its conductivity even after 100 h of 5% NaCl aqueous solution immersion. The good resistance stability of S8 towards corrsion can be explained by the compact structure of the silver coating shown in Figure 4.
(a) SEM image after immersion in 0.5% NaCl aqueous solution for 100 h; (b) SEM image after immersion in 5% NaCl aqueous solution for 100 h.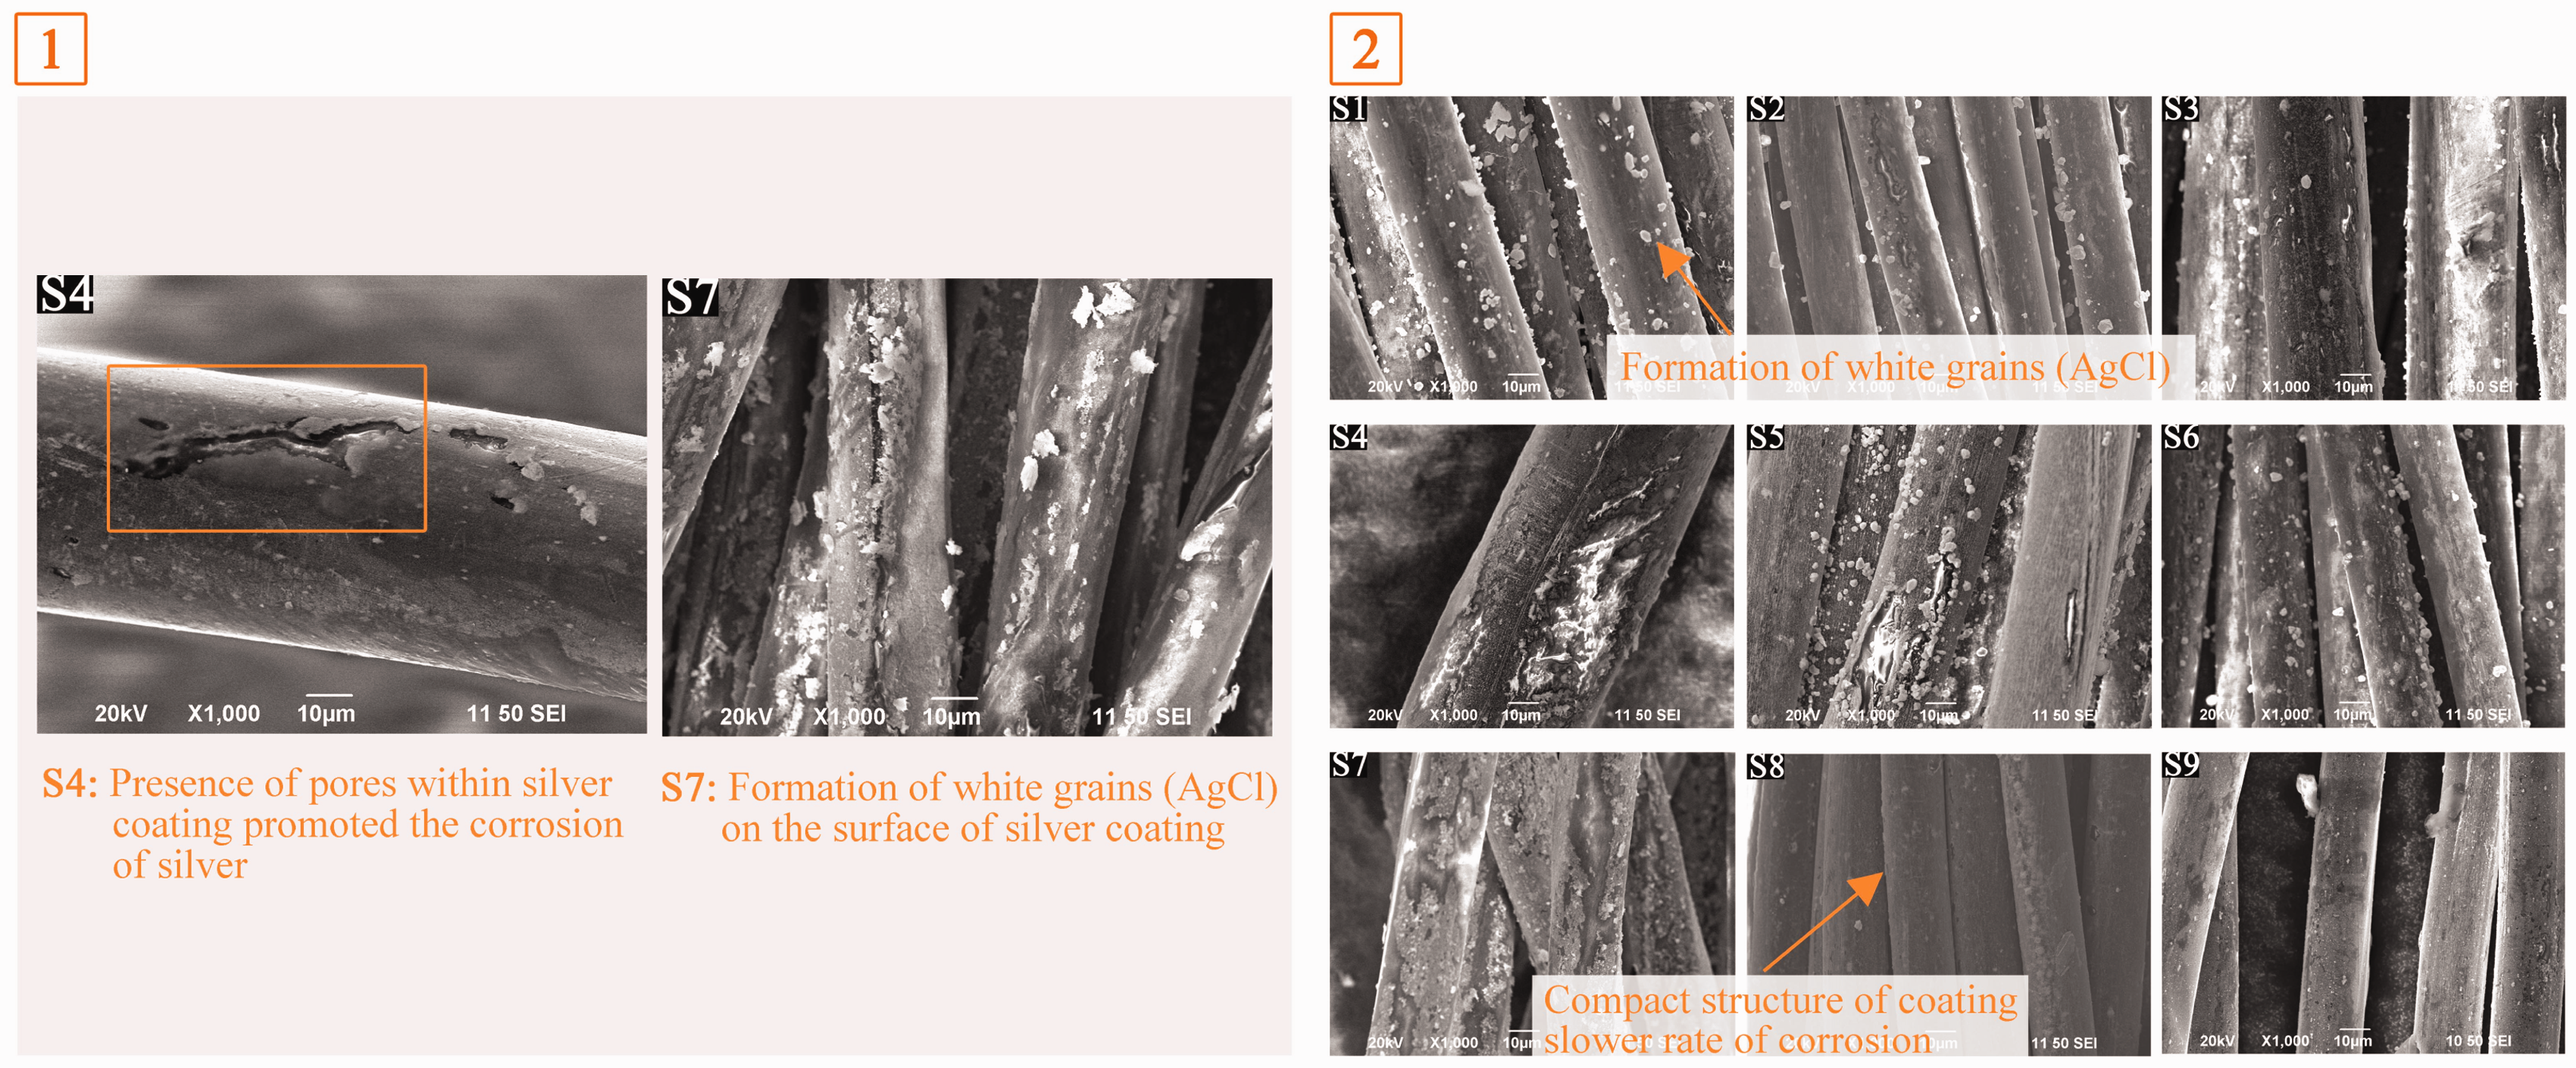
Conclusions
After the multiple tests conducted on silver coated conductive yarns, this paper developed a clear understanding of their basic chemical, mechanical, and functional properties. The systematic test method simulated some of the main challenges that industrialists might face in actual application of the conductive yarns, from the yarn production stage to the end user stage.
Overall performance of conductive yarns in the stabilty assessment.

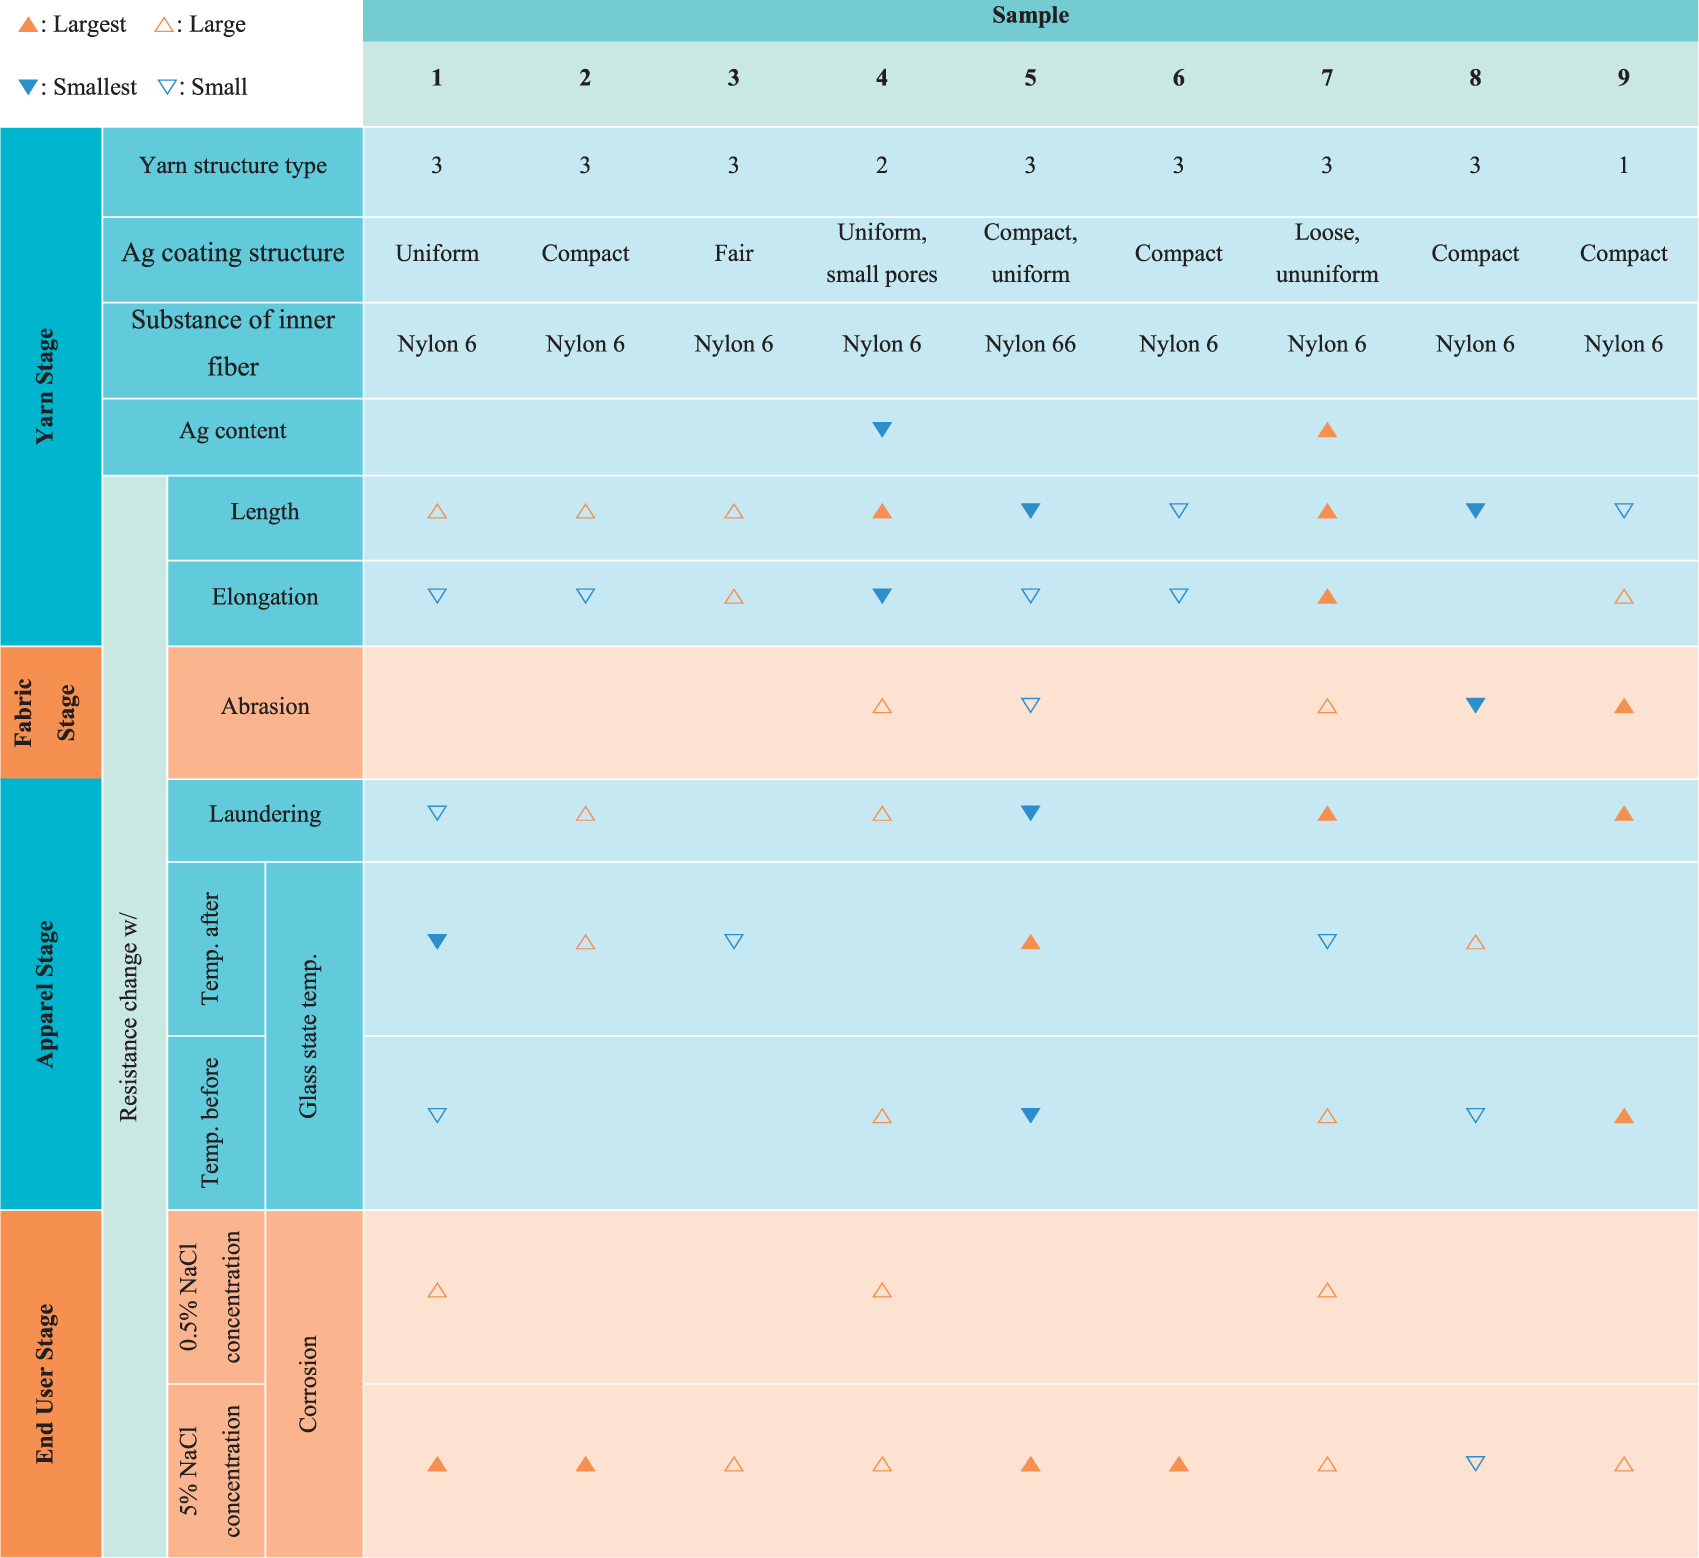
The chemical analysis paved an important route to further quality tests and gave hints to explanations of the results. The materials used for the CANY inner fiber mainly affected their performance at high temperature due to the different melting temperatures of nylon 6 and nylon 66. The silver coating layer was the most important factor for the difference in quality. The amount of silver amount in S4 was the lowest, leading to conductivity instability and poor performance in several tests. However, as its coating layer is comparatively more uniform, its resistance change relative to elongation is the smallest. At the same time, referring to S7 in Table 6, the poor structure of the silver coating proved to be the most relevant reason for the unsatisfactory test results. The silver coating of S7 is loose and non-uniform, leading to the poor performance in most of the tests, and is highly unstable. In contrast, S1 and S5, which possessed a uniform coating layer, had good overall performance.
Although the properties and the testing requirements of CANY samples S1–S9 were explained in detail in this paper, in reality not every industrialist possesses the relevant equipment required. The general performance of CANY products available on the market can be used for comparison during yarn selection. In addition, no well-established standard and systematic testing method could be defined in the research area to assess the applicability of conductive yarns for factories and users. Therefore, when choosing conductive yarns in the market, the industrialist’s first step should be to consider the proper structure of the yarns. Then they could make a preliminary judgment of the quality of silver yarns by SEM analysis of the surface condition. Our results indicate that the coating quality affects conductive yarns’ stability and reliability greatly. However, our results also indicate that different yarns may perform differently in different tests and it is almost impossible to judge simply by SEM. Thus, we strongly recommend that the conducting yarns manufacturer can give some test results including friction testing, NaCl solution corrosion testing, and so on, so that the industrialists can obtain further information about the properties and quality of the yarns, which can help them to choose according to their needs.
The level of quality requirement and the importance of each property test to different sectors of the garment industry
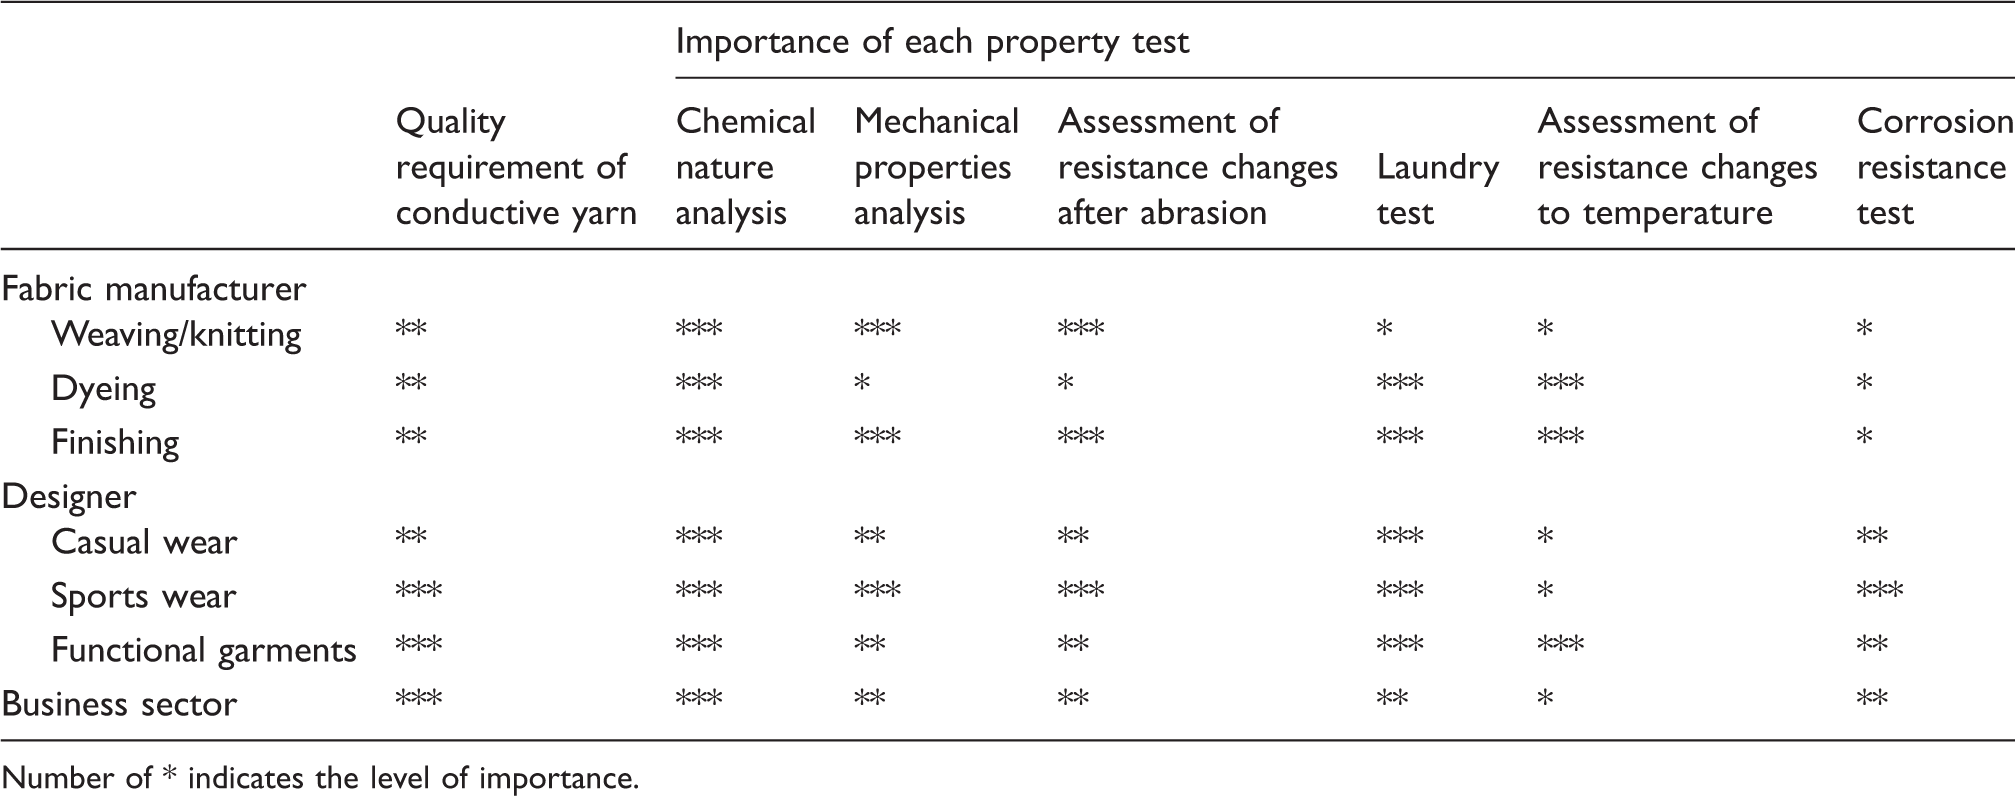
Number of * indicates the level of importance.
Designers should address the end user’s need when choosing CANY. If the product is used for casual wear, the position for the application of the conductive fabric should be taken in great account in design, to avoid frequent abrasion. Direct skin contact should be avoided in sportswear applications. Most CANY lost its functionality during long-term heavy sweating. It might not be applicable in garments designed for vigorous sports activities, while some products like S2 and S5 could be used in normal sweat conditions. Some CANY products such as S5 were very sensitive to high temperatures. This particular quality can be used in a soft fabric sensor for functional garments. Laundering resistance contributed the most difficulties when CANY garments are to be integrated into the market. High quality CANY (S1, S5) could guarantee conductivity for 10 home launderings, but it started to diminish after 20 launderings. Functionality diminished around 10% after 30 launderings. As a result, a detachable design the the part of the garment with the CANY application is recommended. Accordingly, a care label for laundering should be introduced as well.
Last but not least, the profit maker should understand that there was a limited life cycle for any CANY product. Functionality diminishes with time. When choosing high quality yarn from a yarn manufacturer with a good coating technology and quality control, it could maintain its properties during the production process. It is suitable for applications in products with complicated processing. A longer product life cycle could be assured to the customer as well. If CANY with a fair performance in quality was selected, a lower purchasing cost could be guaranteed. However, extra care and a special handling process may be required as the yarn quality drops during processing, which raises the production cost in the end.
Footnotes
Acknowledgement
This work is financially supported by the Research Grants Council (RGC) of Hong Kong, China (project number: PolyU5324/12E) and the Hong Kong Polytechnic University (project number: A-PL79 , A-PM29). The authors would like to thank the support from Dr. Yan Feng from Department of Applied Physics, the Hong Kong Polytechnic University.
Declaration of Conflicting Interests
The authors declared no potential conflicts of interest with respect to the research, authorship, and/or publication of this article.
Funding
The authors disclosed receipt of the following financial support for the research, authorship, and/or publication of this article: This work was supported by the Research Grants Council (RGC) of Hong Kong, China (grant number PolyU5324/12E) and the Hong Kong Polytechnic University (grant numbers A-PL79, A-PM29, G-UC52).