
Abstract
Permeability and porosity of woolen fabrics are investigated experimentally in this paper. Permeability experiments are conducted in a wind tunnel to the TS 391-EN ISO 9237 standard. Woolen fabric is placed in the test section of the wind tunnel to measure permeability to airproofing . Velocity measurements are made used a hot wire anemometer in the front and rear of the wool. Air permeability is closely related to pore size and distribution. So, it is important to study porosity, in order to classify and determine the right use of woolen fabrics. Many methods are used to estimate porosity. In this study, the theoretical model is used for determination of porosity values, and the influence on porosity of various fabric parameters was investigated. Depending on the permeability, weft and warp density, weight, fabric thickness and porosity relationship are investigated. The results are presented as graphs.
Air permeability is a very important property in the performance of textile materials (filters, parachutes and sails) and clothing applications. The air permeability is mainly dependent on thickness and porosity. 1 Density of fabric, warp and weft linear densities and the weave are textural parameters of fabric air permeability.2,3
Generally, permeability is described as a property of a material that lets fluids (such as air, water or water vapor) diffuse through it to another medium without being chemically or physically affected. Permeability of fabric is described as the rate of air flowing through a material under a differential pressure between the two fabric surfaces.4,5
Porosity of fabrics mainly affects air flow through textiles. It can be stated clearly that stoma dimension and distribution is a function of fabric geometry. Diameter of the yarn, surface formation techniques and the number of loop counts per unit area are the main factors affecting the porosity of textiles. Some important features, such as air permeability, water permeability and dyeing properties, are related to the porosity of the fabric.6,7
There are studies in the literature about the porosity and air permeability of fabric. For example, Fatahi and Yazdi 8 studied the relationship between the air permeability and mechanical properties of woven fabrics. For this purpose they used fabrics with different weave parameters. Kumpikaitė et al. 9 analyzed the influence of fancy yarn structure and fabric weave on the abrasion resistance and air permeability of woven fabrics with these yarns. Daiva et al. 10 presented the investigations of the influence of the knit structure, that is, linear density of yarns, loop length and tightness factor of the knit, on garment flammability and permeability to air. Ogulata and Mavruz, 11 in their study, attempted to establish a theoretical model for the porosity and predicted air permeability of plain knitted fabrics. A theoretical model was created to predict the porosity and air permeability of a knitted structure depending on the geometrical parameters, such as the courses per cm, wales per cm, stitch length, fabric thickness, yarn count, diameter of yarn and fiber density. Wang et al., 12 in their paper, used an approach based on the shock tube experiment that was proposed to determine the permeability of airbag fabrics.
This is because the phenomenon that occurs in a shock tube experiment using airbag fabric is, in comparison with previous studies, more analogous to that which occurs in airbag inflation by some fuel or propellant.
Marmarali 13 investigated the air permeability of cotton/spandex single jersey fabrics within their dimensional and physical properties and compared results with fabrics knitted from cotton alone. It proved that the air permeability of fabrics containing spandex was lower. Karaguzel 14 calculated values of pore size and pore volume for plain knitted fabrics. Those of the pore size were measured with image analysis and fluid extrusion procedures. It was found that there was a noticeable difference between the estimated and measured values. Benltoufa et al. 15 investigated methods of determining jersey porosity, which proved that geometry modeling is the most suitable and easiest method of determining porosity. Mavruz and Oğulata 16 studied the air permeability of cotton knitted fabrics having different yarn numbers, knitting types and course densities.
In this study, air permeability of various woolen fabrics is investigated. Effect on the air permeability of the weft–warp, thickness, weight and porosity are investigated. In particular, three factors are mainly considered connected to the pores in the woolen fabrics. These factors are the cross-sectional area of each pore, the depth of each pore or the thickness of the woolen fabrics and the number of pores per unit area or the number of warp and weft threads per unit area.
Determination of air permeability for woolen fabric
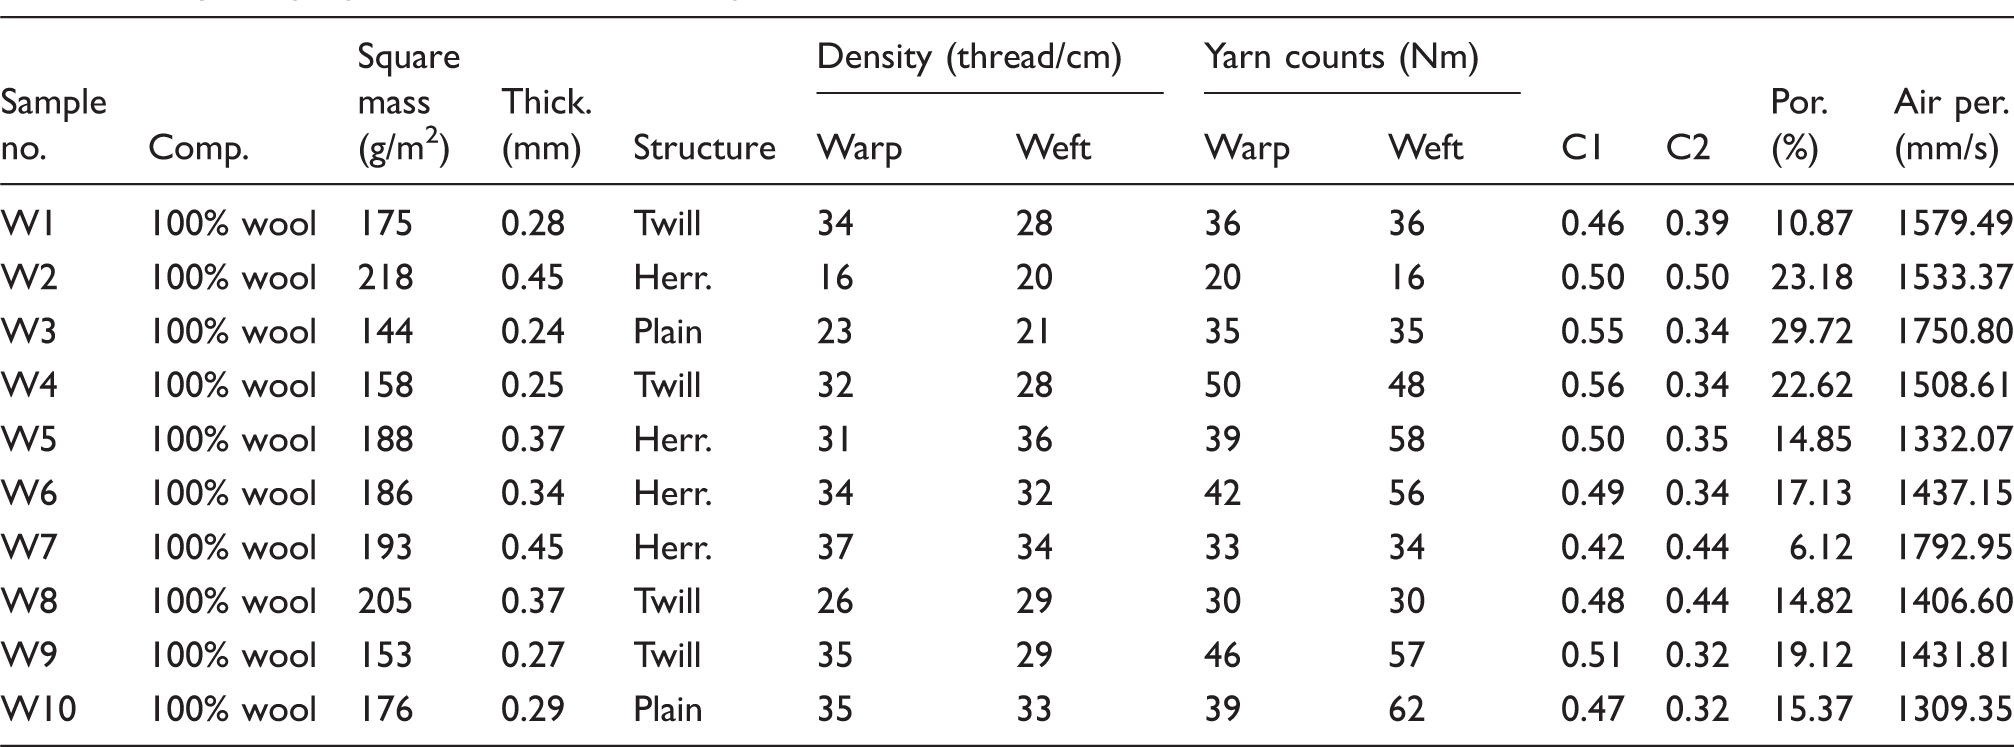
Physical properties of the tested samples
The air permeability is defined as the air velocity in millimeters per second, which is passing through the fabric at a given pressure difference. It can be normalized to the pressure drop of 10 Pa. 17
Difference pressure measurement was performed in experimental apparatus. By comparison with an inclined manometer and a hot-wire probe, air permeability values are obtained. While maintaining the control required for the measurement of ambient pressure with the inclined manometer, velocity level control is made with the hot-wire probe.
In addition, pressure–velocity ranges are shown at the same scale as comparative in the inclined manometer. This is clearly explained in the calculation and expression of the results.
The scale of the inclined pressure difference manometer is calibrated to read in inches of water (in-H2O). Although the tube is filled with Meriam Oil, the gauge has been calibrated to read in inches of water. The settings used are as follows.
Inclined tube manometer: angle 30°
Measuring ranges
– Bourdon tube pressure gauge: 0…60 mbar/–60…0 mbar – U-tube manometer: 0…500 mmWC – inclined tube manometer: 0…500 mmWC
An inclined tube manometer consists of a vertical cylinder of 35 mm diameter. At the bottom of this is connected a tube of 5 mm in diameter inclined upward at an angle of 15° to the horizontal; the top of this tube is connected to an air duct. The vertical cylinder is open to the air and the manometric fluid has a relative density of 0.785
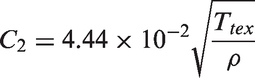
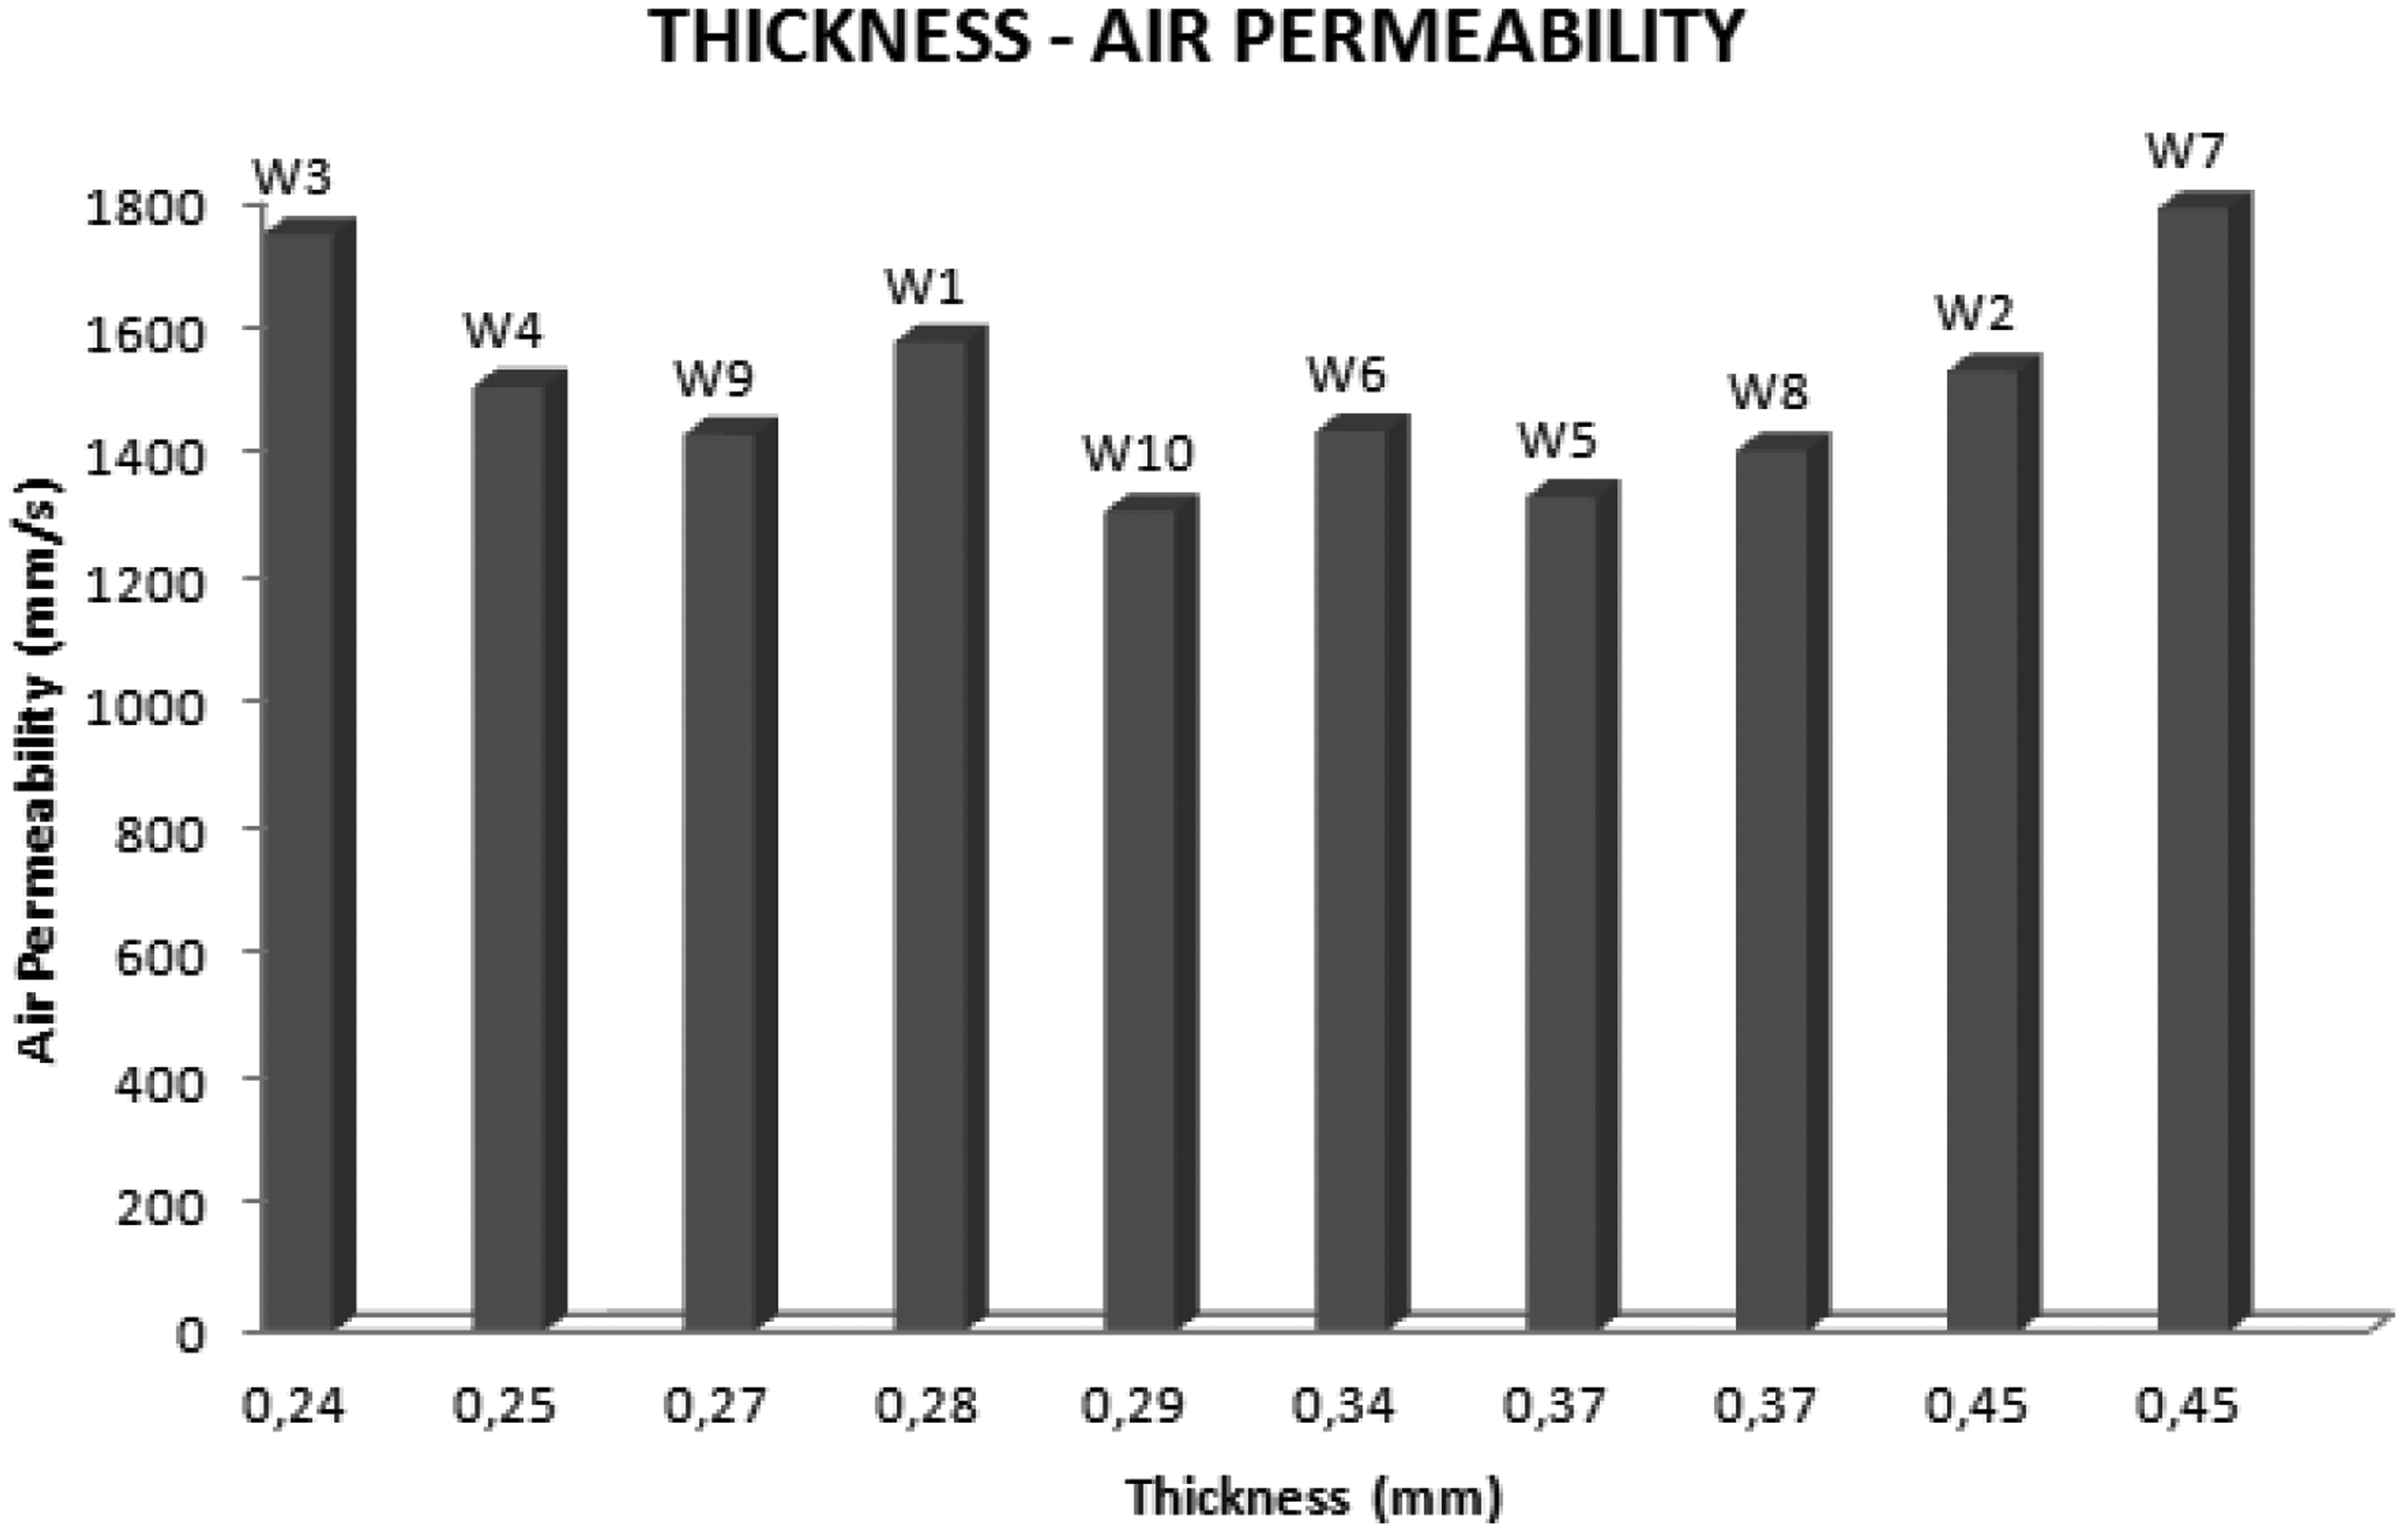
When air permeability values are analyzed, it seems W7 has the highest value at 1792.95 mm/s. There was no significant difference between W7 and W3 (1750.80 mm/s). The air permeability of the sample values is obtained at close to both W7 and W3. Looking at these two examples compared to other sample values, there is less than 10% difference between them, respectively, 1579.49, 1533.37 and 1508.61 mm/s for W1, W2 and W4 samples. Other samples were examined were W6, W9 and W8, which had air permeability values are close to each other, respectively, 1437.15, 1431.81 and 1406.60 mm/s. W5 and W10 samples have the lowest air permeability values, respectively, 1332.07 and 1309.35 mm/s.
Microscopic views of woolen fabrics are shown in Figure 1. During the transport of the air through the porous woolen fabric, part of the energy of the air is used to overcome the friction of the fluid on the woolen fabric and the rest is used to surmount the inertia forces. When the size of the pores decrease, the fluid friction of the fabric increases.
18
Microscopic views of woolen fabrics.
Calculation and expression of results
The air permeability is measured using a hot-wire anemometer in a wind tunnel. The wind tunnel is a subsonic, open wind tunnel with a square measurement-section profile. Its test section is 292 × 292 mm2, and the test length is 450 mm. Experiments are carried out at 10 m/s velocity. 10 The pressure drop vas adjusted to 100 Pa according to the TS 391 EN ISO 9237 standard. The tested fabrics are scaled in the wind tunnel.
Using the barometer and thermometer in the laboratory, we determined the density of the air flowing in the wind tunnel. We calibrated the wind tunnel test section by generating a plot of velocity (m/s) versus motor frequency (0–60 Hz), using the upstream pitot-static tube and Bernoulli's equation.
The difference between total and static pressure, according to Bernoulli's equation, is called dynamic pressure, which is directly related with the surrounding fluid velocity:

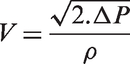
Solving Equation (1), the velocity of the air is determined, which further can be incorporated into Equation (2) to calculate the volumetric flow (in m3/s) of air through the wind tunnel.
The probe is correctly placed when the flow direction is parallel with the axis of the probe.
As shown Figure 2, the fabrics are installed from wall to wall on the bottom of the test section and perpendicular to the wind direction.
Schematic drawing of the measurement section.
The characteristics of the hot wire anemometer are shown below:
Speed range : 0……40 m/s Temperature range : −30…….+110℃ Resolution : velocity 0.01 m/s (0……40 m/s) Temperature 0.1℃ (−30…… +110℃) Accuracy : velocity ± 0.5 m/s (0……0.9 m/s) ±0.2 m/s (1……9.9 m/s) ±0.6 m/s (10……40 m/s) Temperature ± 0.4℃ (−30…… +110℃) Minimum speed : 0 m/s
The arithmetic mean of individual readings and the coefficient of variation to the nearest 0.1% is calculated, with a 95 % confidence interval.
The air permeability (mm/s) is determined as follows:
19

Through cross-section measurements were taken with the hot-wire probe from 10 points in accordance with the standard and the mean velocity is found. The flow rate is calculated by multiplying the flow cross-sectional area and mean velocity.
Special care was taken to minimize the error by making sure that the pipe was clamped down firmly and the pitot tube was positioned so that its tip saw a normal flow of air at every measurement. The measurement was taken by teams of two, so as to reduce the precision error. A schematic drawing of the measurement section is shown in Figure 2.
The free stream velocity in the central point of the test section is assumed to be the best measure of the free stream velocity, as the region in the test section would have the least amount of turbulence. This central velocity was taken as the best measured value. This is used to analyze the values of free stream velocity across the cross-section of the test section.
Measurement of the mean velocity distribution was made along a vertical line on the center. Reference velocity at the center of the channel for empty tunnel was 10 m/s.
The power law for velocity distribution is given by
Vertical mean velocity profile – experimental values and power law fit.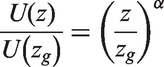

The fabrics are conditioned at a temperature and relative humidity of 20 ± 2℃ and 65 ± 2%, respectively, as specified in the standard.
19
Then the fabrics are cut and placed to fit into the section of wind tunnel as Figure 4. The dimensions of the test section are 29.2 cm × 29.2 cm.
Images of the wind tunnel.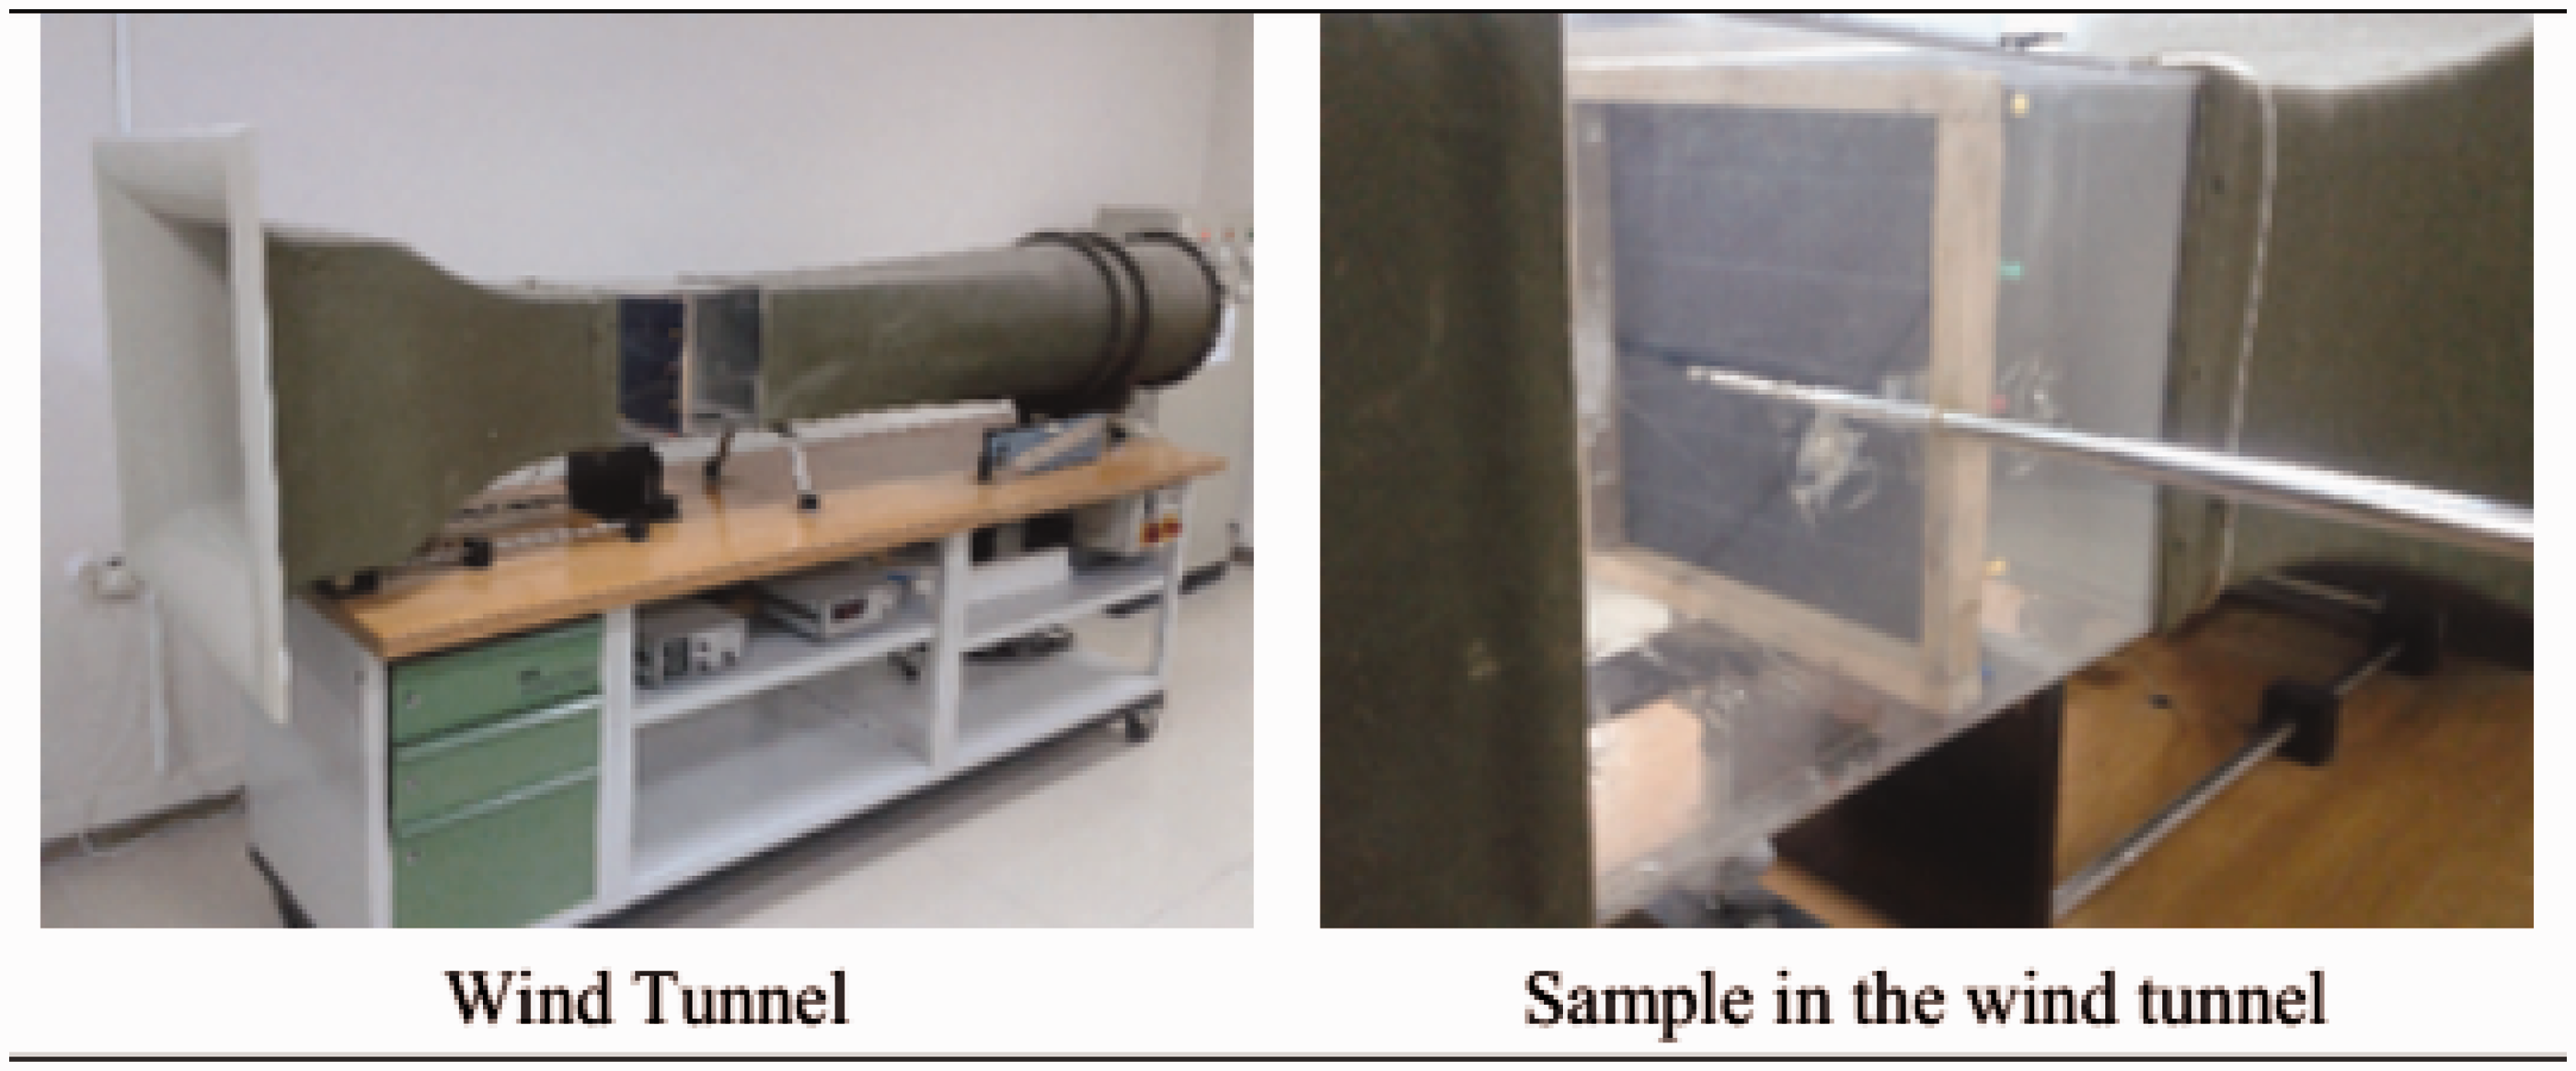
Fabric porosity values are calculated from the theoretical model. The calculation steps are as follows.
The cover factors of the warp and weft yarns are calculated separately. The following formula is used:21,22
a. Cover factor for warp yarns (%):
Cover factor for weft yarns (%):
In order to calculate the porosity of the fabric, the following formula is used:21,22

Results and discussion
In this study, the air permeability values against weft and warp density, weight, fabric thickness and porosity are measured by the hot wire anemometer in the wind tunnel. The results are presented in Figures 5–9.
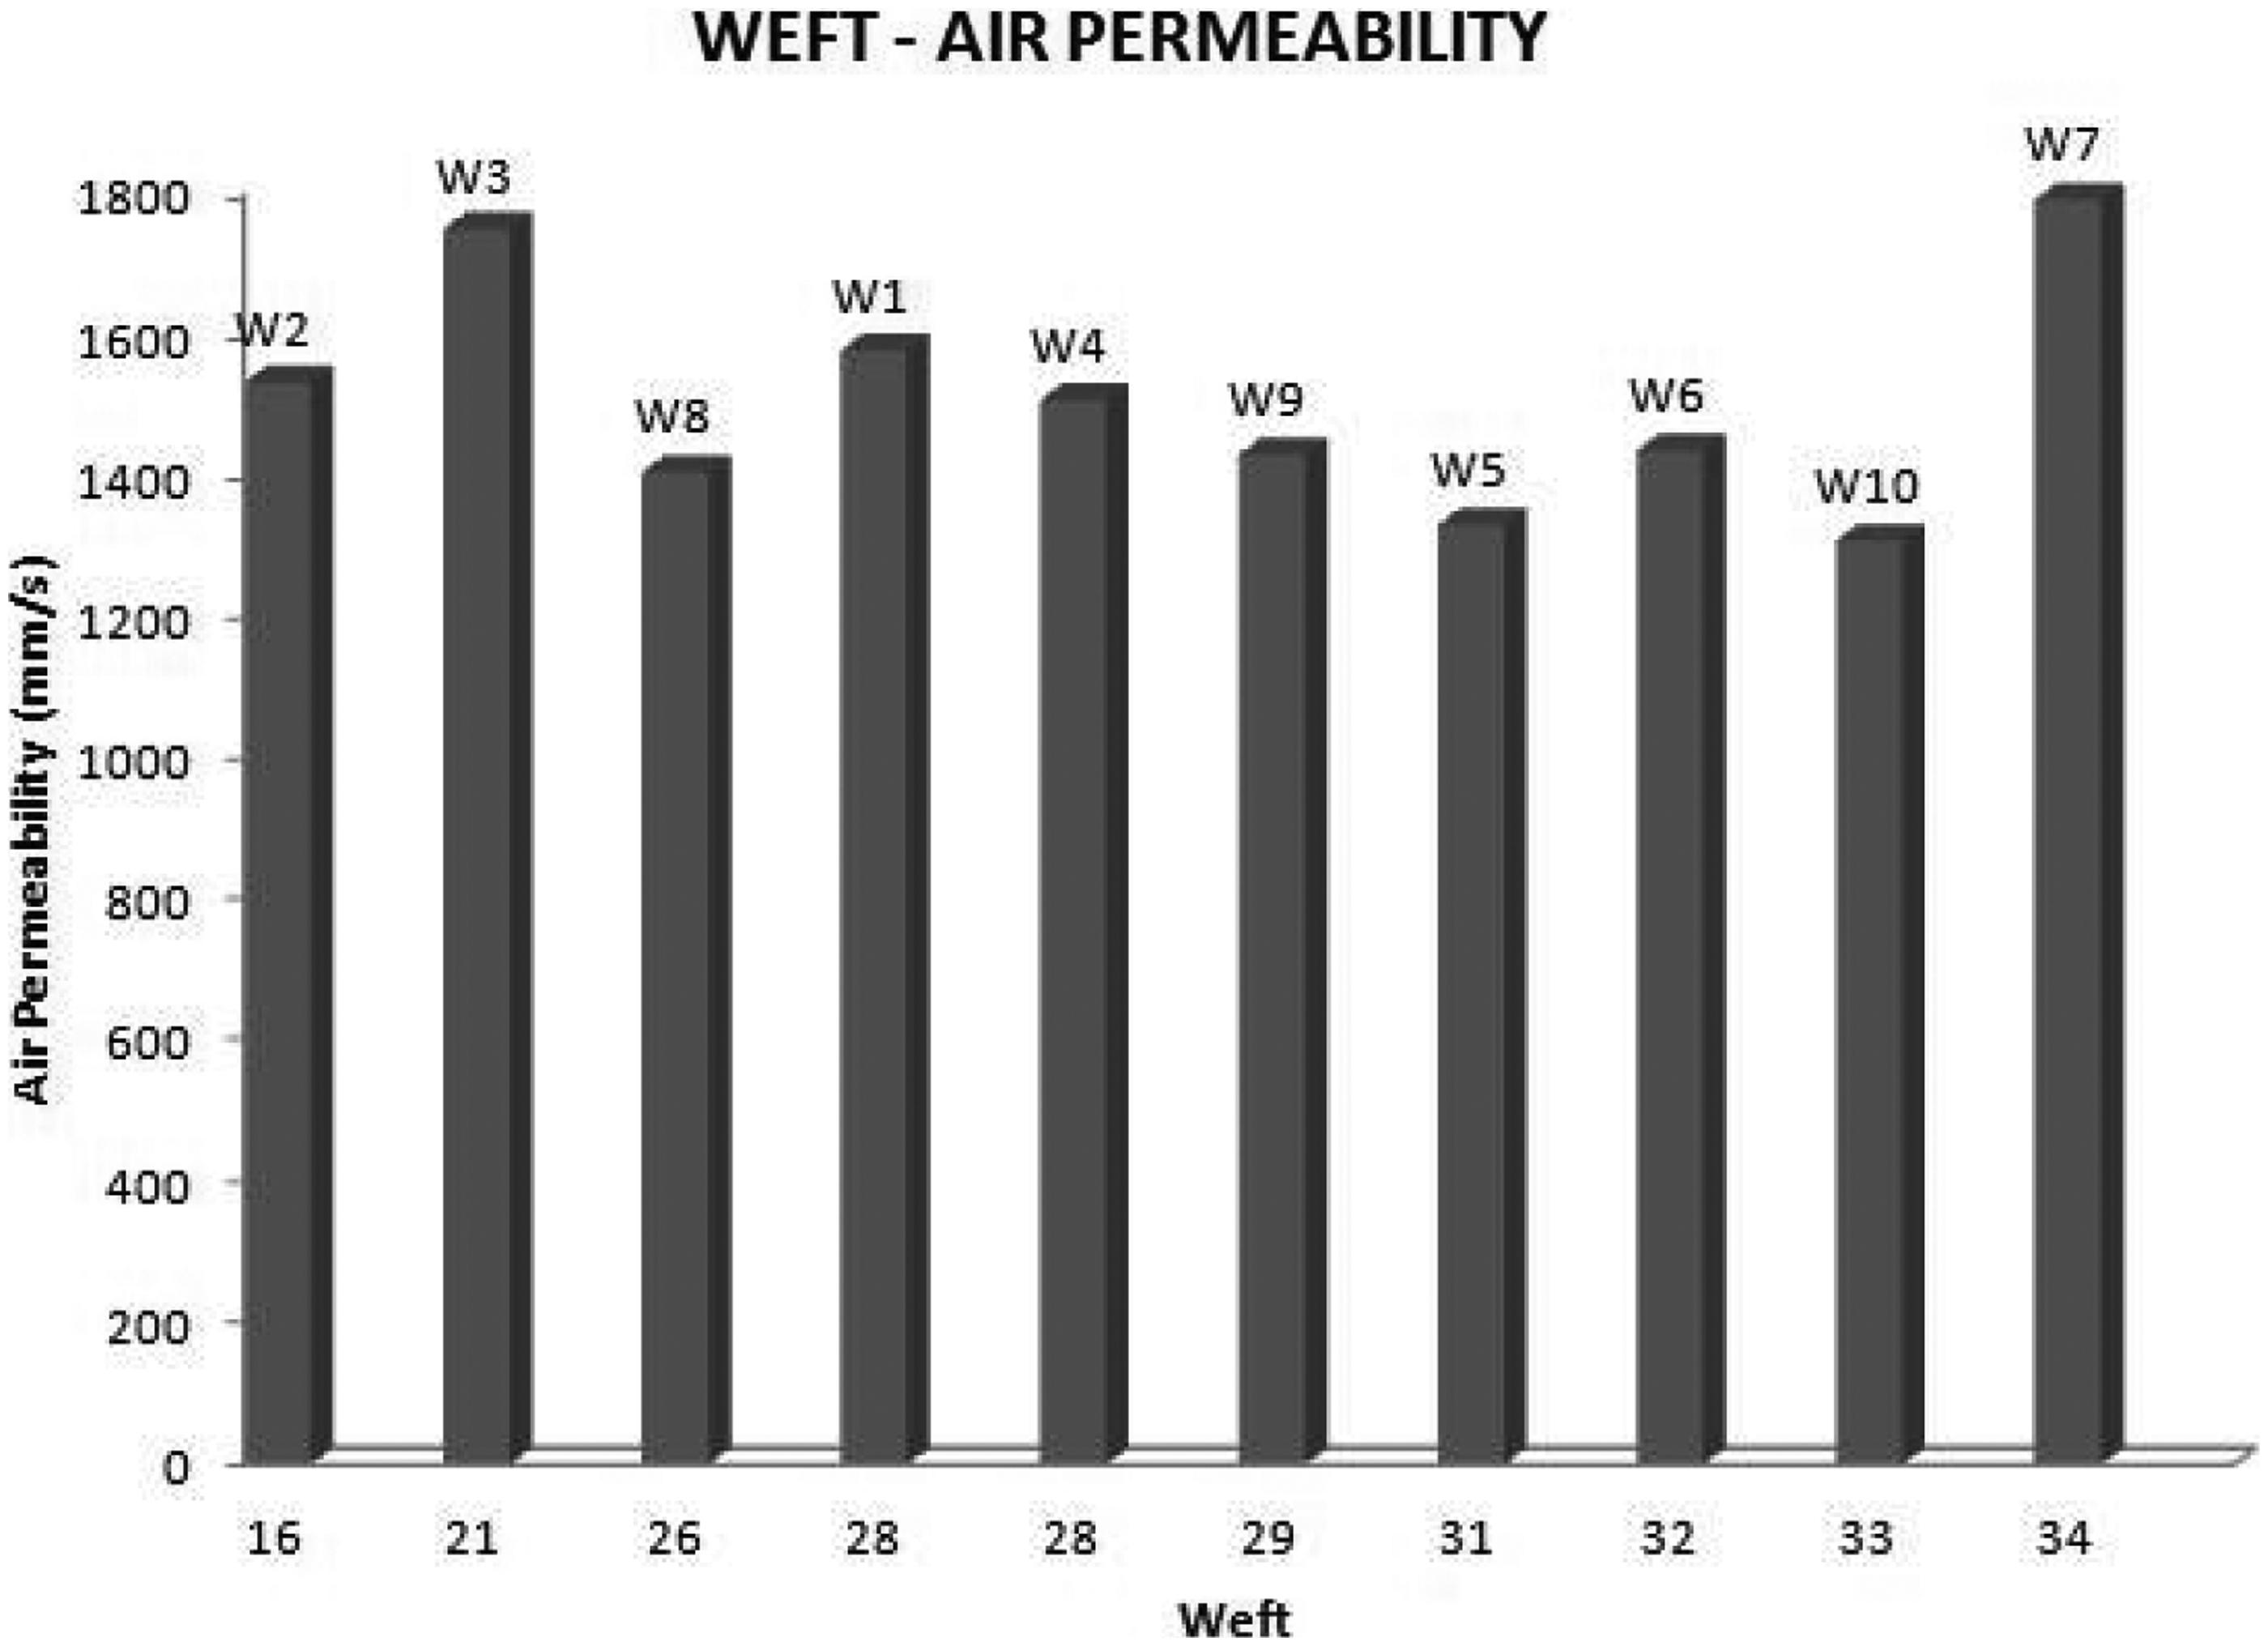
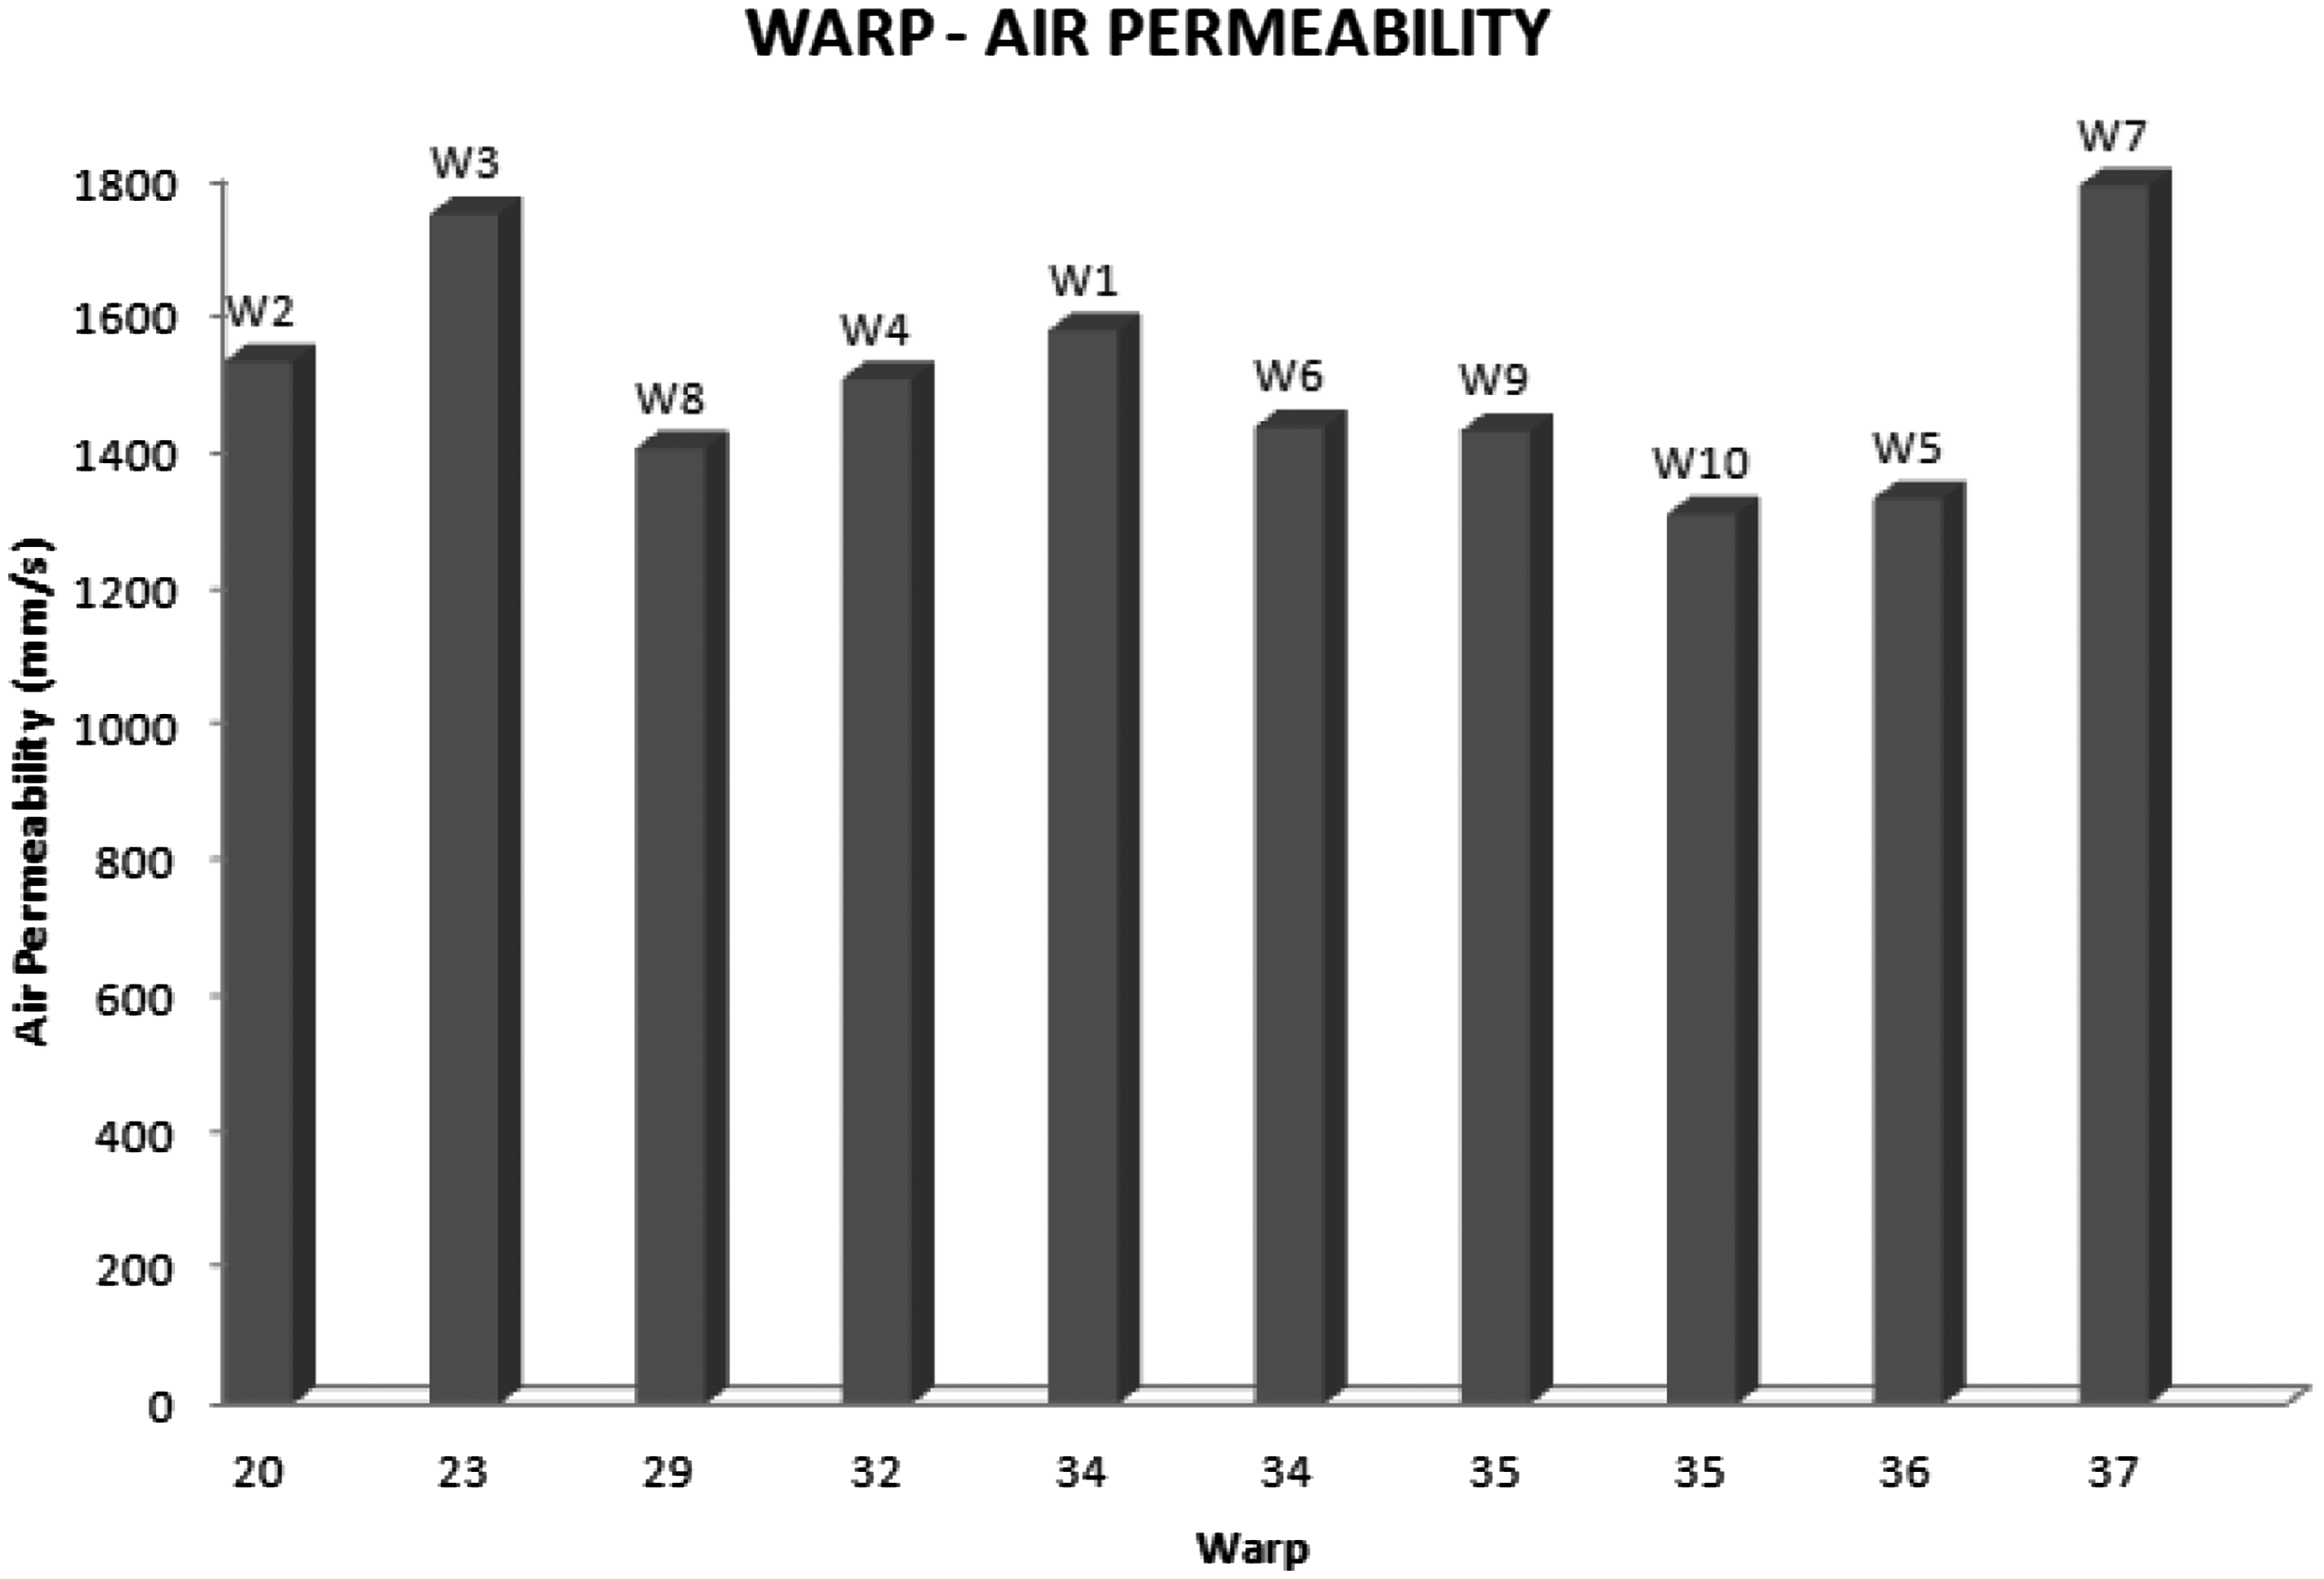
Relationship between weight (square mass) and air permeability in woolen fabrics. Relationship between weft density and air permeability of woolen fabrics. Relationship between warp density and air permeability of woolen fabrics. Relationship between fabric thickness and air permeability of woolen fabrics. Relationship between porosity and air permeability of woolen fabrics.

From the results we found that the highest air permeability occurred in woolen fabric sample no. 7, and the second best one occurred in woolen fabric sample no.3. In Figure 5, it can be seen that woolen fabric (sample no. 7) weight had the highest air permeability of 193 g/m2.
The lowest air permeability occurred in woolen fabric sample no.10. In this sample, weight is 176 g/m2.
As regards the air permeability of the tested samples (Figure 6), the highest air permeability occurred in the 34 cm weft. On the other hand, the lowest air permeability occurred in the 33 cm weft.
As shown in Figure 7 , the highest air permeability occurred in the 37 cm warp. On the other hand, the lowest air permeability occurred in the 35 cm warp.
In Figure 8, it can be seen that thickness of the woolen fabrics that has the highest permeability is 0.24 mm.
Woolen fabrics of this type are plain and the yarn count is 35/35 Nm. It can be said generally that as fabric thickness increases, air permeability is decreased.
In Figure 9, it can be seen that the highest porosity is in woolen fabric sample no. 3 (29.72%), and the second best one is in woolen fabric sample no.2 (23.18%).
The lowest porosity is in woolen fabric sample no. 7 (6.12%). In addition, while warp and weft increase, porosity decreases.
According to the results, we can clearly say that the warp and weft changed with porosity as they are inversely proportional.
When the warp and weft are considered, the porosity is changed in proportion to the air permeability. Increased porosity and permeability consequently also affect the fabric's thermal resistance and water vapor permeability. The increase of air permeability may cause reduction in heat resistance and water vapor permeability values.
So, it can be concluded that the best feature of the fabric is clothing comfort.
Regression analysis
Results of regression analysis
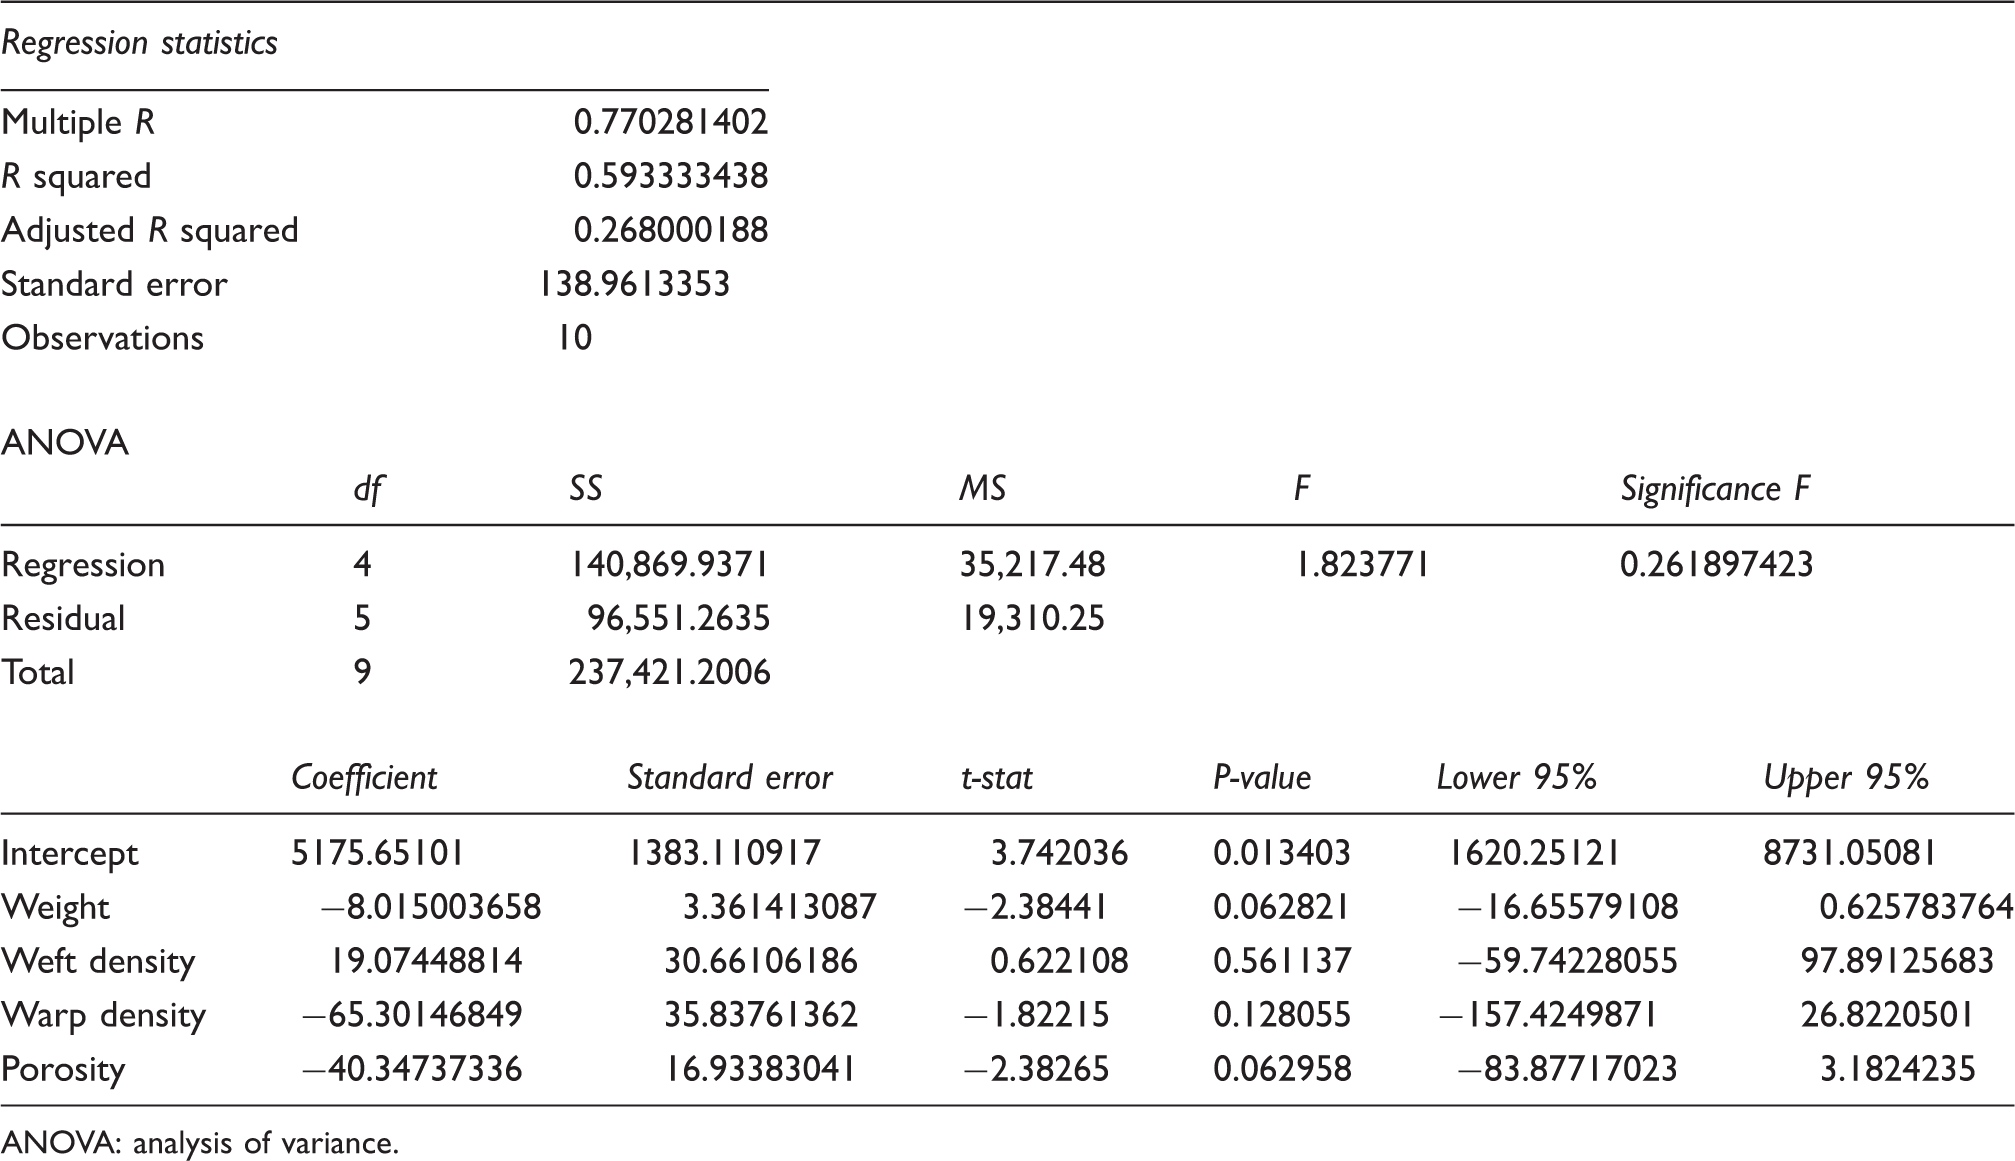
ANOVA: analysis of variance.
The results of the regression analysis are as follows:
air permeability is a dependent variable, while weight (square mass), weft and warp density and porosity of fabrics are independent variables; weight (square mass), weft and warp density and porosity of fabrics values explained 59% of the change in air permeability of fabrics (R2 = 0.593); according to the analysis results, it can be shown that there is a relationship between independent variables and the dependent variable.
Conclusions
The air permeability of woolen fabric can be determined by measuring using a hot wire anemometer in a wind tunnel. Air permeability depends on the properties of woolen fabric. Against air permeability, variation of weft and warp density, thickness and porosity are investigated. From the results we found that according to other types of woolen fabrics, the air permeability of types W3 (plain, weft and warp density; 23/21) and W7 (herringbone, weft and warp density; 37/34) woolen fabric were higher than for other types of fabric.
In addition, taking into account all the variables, it has been shown that increasing the weft–warp frequency has a positive effect on air permeability; on the other hand, as porosity weft density increases, the porosity decreases. Increased porosity and permeability consequently also affect the fabric's thermal resistance and water vapor permeability. The increase of air permeability may cause a reduction in heat resistance and water vapor permeability values.
So, it can be concluded that the best feature of the fabric is clothing comfort. However, it should be noted that the porosity of the fabric has a significant effect on the air permeability. However, investigating the relationship between permeability and porosity and weft and warp density should certainly be taken into consideration.
Footnotes
Acknowledgement
This work was supported by the Scientific Research Commission of Marmara University (BAPKO no. FEN-B-101013-0401).
Funding
The authors received no financial support for the research, authorship, and/or publication of this article.
Declaration of conflicting interests
The authors declared no potential conflicts of interest with respect to the research, authorship and/or publication of this article.