
Abstract
The development of lightweight flexible materials for electromagnetic interference shielding has received increased attention in recent years, particularly for clothing or technical applications and especially in areas of aircraft, aerospace, automobiles and flexible electronics, such as portable electronics and wearable devices. There are many references in the literature concerning the development and investigation of electromagnetic shielding lightweight flexible materials, especially those that are textile based with different electrically conductive additives. However, little attention has been paid to the problems related to the performance of developed electromagnetic shielding materials for clothing in use, above all wet processing (washing and drying). The main aim of this paper is a description of the influence of washing/drying cycles on the fundamental properties of metal fiber-containing fabrics. Changes in electromagnetic shielding ability and electric conductivity after washing/drying cycles were studied and also other characteristics, such as pilling, changes in mass per unit area and thickness of conductive fabrics, were evaluated. For the purpose of this study, fabrics with different structures (knitted, woven) containing extremely thin stainless steel staple fibers incorporated to the yarn structure as the conductive filler were chosen. For quantification of the influence of the washing/drying cycles on the above-mentioned characteristics, regression methods and simple t-tests were used. Both knitted and woven fabrics withstood satisfactory repeated application of wet processing with respect to the main requirement – electromagnetic shielding ability; in addition, woven fabrics exceeded in higher electrical conductivity, higher shielding effectiveness and lower inclination to pilling and therefore can be used for the production of protective cloth.
Keywords
All living organisms, including humans, are more or less adapted to the action of natural electromagnetic (EM) fields and natural EM radiation of different wavelengths, and therefore exposure to EM fields is not a new phenomenon. 1 The so-called “electrosmog” represents a non-ionizing EM radiation that is predominantly of unnatural origin, generated by man. People are increasingly exposed to different types of unnatural EM radiation, whether intentional (diagnostic or security purposes), or unintentional, that is, as an accompanying phenomenon when using electrical appliances. While EM fields in certain frequency bands have wholly beneficial effects, which are applied in medicine, other non-ionizing frequencies, sourced from extremely low frequencies, power lines or certain high-frequency waves used in the fields of radar, telecommunications and mobile telephony, appear to have more or less potentially harmful, non-thermal, biological effects on plants, insects and animals, as well as the human body. To prevent technical errors, electronic devices must be shielded so that both incoming and outgoing interferences are filtered. To prevent health hazards the human body must be shielded using special clothes serving as a barrier. In addition to EM interference shielding performance, being lightweight and flexible are two other important requirements for effective and practical EM shielding applications, whether for clothing or technical applications, especially in the areas of aircraft, aerospace, automobiles and flexible electronics, such as portable electronics and wearable devices.
The best material for shielding or absorption of EM waves must have both high electric conductivity (imparts higher reflection of EM waves, especially at lower frequencies) and high magnetic permeability (provides higher absorption of EM waves, especially at higher frequencies), and therefore shields based on the use of metals and magnetic alloys are the best ones. Conductive fabrics have received increased attention for EM shielding and anti-electrostatic purposes, mainly because of their desirable flexibility and low weight. One way to create conductive fabrics is using minute electrically conductive fibers (metal, carbon, conductive polymer fibers). They can be produced in filament or staple lengths and can be incorporated with traditional non-conductive fibers to create yarns that possess varying degrees of conductivity.2–7 Another method represents conductive coatings on fibers or yarns by metals8–11 or conductive polymers.12–14 Therein, fibers containing carbon black or other conductive particles can be also used. 15
Some general difficulties arise when creating electrically conductive fabrics for clothing. Conductive components have to be embedded in textile structures in such a way that the flexibility, thermo physical comfort properties, appearance and process ability of the fabrics are retained. During the wearing cycle the fabrics are subjected to the combined action of abrasion, washing and ironing. 16 For this reason, protective fabrics also have to maintain wet processing without loss of functionality.
The influence of washing on fabrics (woven, knitted) with staple stainless steel (SS) yarns and silver-plated polyester filament yarns was studied by Varnaite and Katunskis. 17 It was found that the surface and volume resistivity increased dramatically even after applying five washing cycles. Accordingly with that, the half decay time increased and the shielding factor decreased. This phenomenon was interpreted by a migration of SS fibers from the fabric structure and cracking of the silver-plated polyester filaments during washing. Five washing cycles were applied on knitted fabrics with different structures (single jersey, interlock) made of 20% SS/80% cotton yarns and the EM shielding effectiveness (SE) of knitted fabrics was studied before and after washing by Kayacan. 18 It was found that both knitted structures embody low EM SE in vertical polarization (<5 dB). When analyzing horizontal polarization, interlock fabric had higher EM SE compared to single jersey knit, both before and after washing (maximum value about 25 dB at frequency about 1400 MHz). The influence of the dyeing process, washing cycles and pilling test on knitted fabrics where SS yarns were used to form conductive paths was examined by Kayacan et al. 19 The resistance values increased significantly (more than two times) after the dyeing process and also after pilling. The authors establish that negative effects decrease as the distance between the conductive pathways increase. The effect of dry-cleaning and ironing on the EM shielding ability of woven interlining fabrics made of copper plated polyamide filaments is described by Saravanja et al. 20 Ten dry-cleaning and ironing cycles caused a complete loss of material protective properties due to the synergism of the solvent action and mechanical agitation, as well as heat treatment during drying and ironing resulting in cracking of the copper layer. Also in paper Bonaldi et al., 21 the durability of EM shielding of several conductive fabrics after washing was evaluated. Samples coated with Ag were analyzed and found to be the most durable ones. However, none of the research papers takes the variability of the measurement process into account.
In this paper, two fabrics with different structures (knitted, woven) containing extremely thin SS staple fibers incorporated to the yarn structure were subjected to repeated wet processing (washing and drying) to simulate the practical wearing cycle. Samples were chosen from the sample set already introduced by Safarova and Militky. 3 These particular samples contain sufficiently high content of metal fiber to overcome the percolation threshold of the conductive component and to achieve satisfactory values of shielding of the EM field. It is expected that SS should not readily corrode, rust or stain with water, but the fiber migration outside of the structure could have a significant effect. The effect of washing/drying cycles on EM shielding ability and electric conductivity was studied and also other characteristics, such as pilling, changes in mass per unit area and thickness of fabrics, were evaluated. For quantification of the influence of the washing/drying cycles on the above-mentioned characteristics, regression methods and simple t-tests were used.
Experimental details
Materials
Hybrid yarns
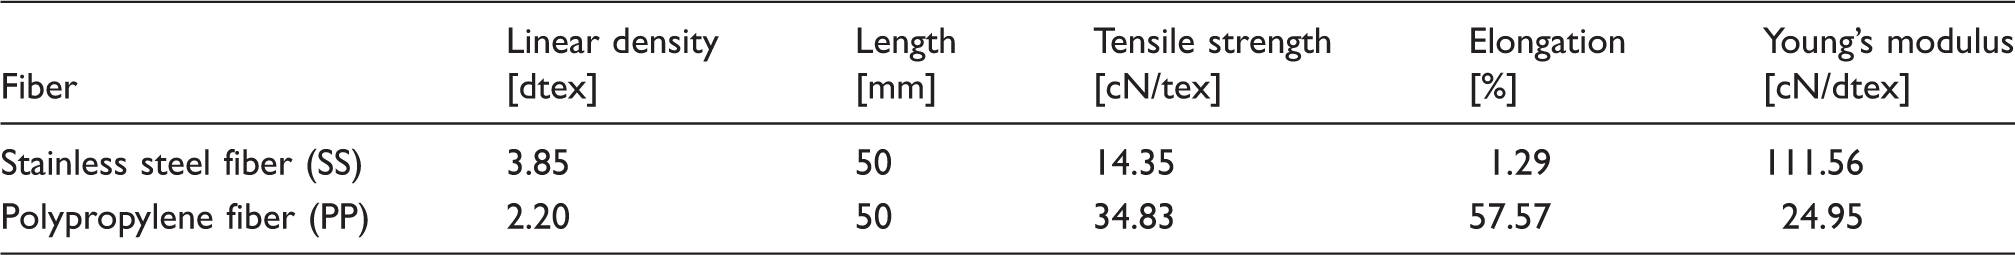
Hybrid yarns were composed of conventional polypropylene (PP) fiber (85 wt%) and staple BEKINOX SS metal fibers (15 wt%). This particular percentage of conductive fiber was chosen with respect to previous studies.3,4 Usage of 15% metal fiber guarantees electrical conductivity above the percolation threshold of the conductive component and achieves satisfactory EM shielding performance of fabrics made of this metal fiber-containing yarn. On the other hand, this particular content of conductive fiber does not change significantly the process ability of the yarns and fabrics made from them. Also physiological properties, roughness and appearance of fabrics made of these yarns are comparable with traditional fabrics used in the textile area. The aspect ratio (length/diameter ratio, l/d) of the SS used in this study is 6250, since the diameter of the SS is 8 µm and the fiber length of the SS is 50 mm. In this study, TREVON PP fiber with a fineness of 2.2 dtex and 50-mm length was used as the non-conductive component. Properties of these fibers are given in Table 1. The two components were mixed at the drawing frame and a ring spinning system was used to produce blended yarns. Hybrid yarns were prepared in two different linear densities: (a) single yarn 25 tex Z450 (spun yarn that has a count of 25 tex with a twist level of 450 turns per meter, twist applied in the Z direction); (b) two-ply yarn of 25 tex Z450 × 2 S 300, R51 tex (single yarn of 25 tex with a twist level of 450 turns per meter in the Z direction was twisted together with another yarn of the same description, folding twist S 200 turns per meter in the S direction, and the resultant yarn count is 51 tex). Different linear densities of yarns (51 and 25 tex) for the production of woven and knitted protective fabrics were chosen regarding the final application of fabrics for a base clothing layer (knitted fabric for T-shirts, woven fabric for shirts). Particular linear densities of yarns were chosen according to the authors’ experience. Figure 1 presents microscopic images of the hybrid yarns used in this study.
Microscopic images of (a) single yarn and (b) two-ply yarn. Properties of fibers used for this study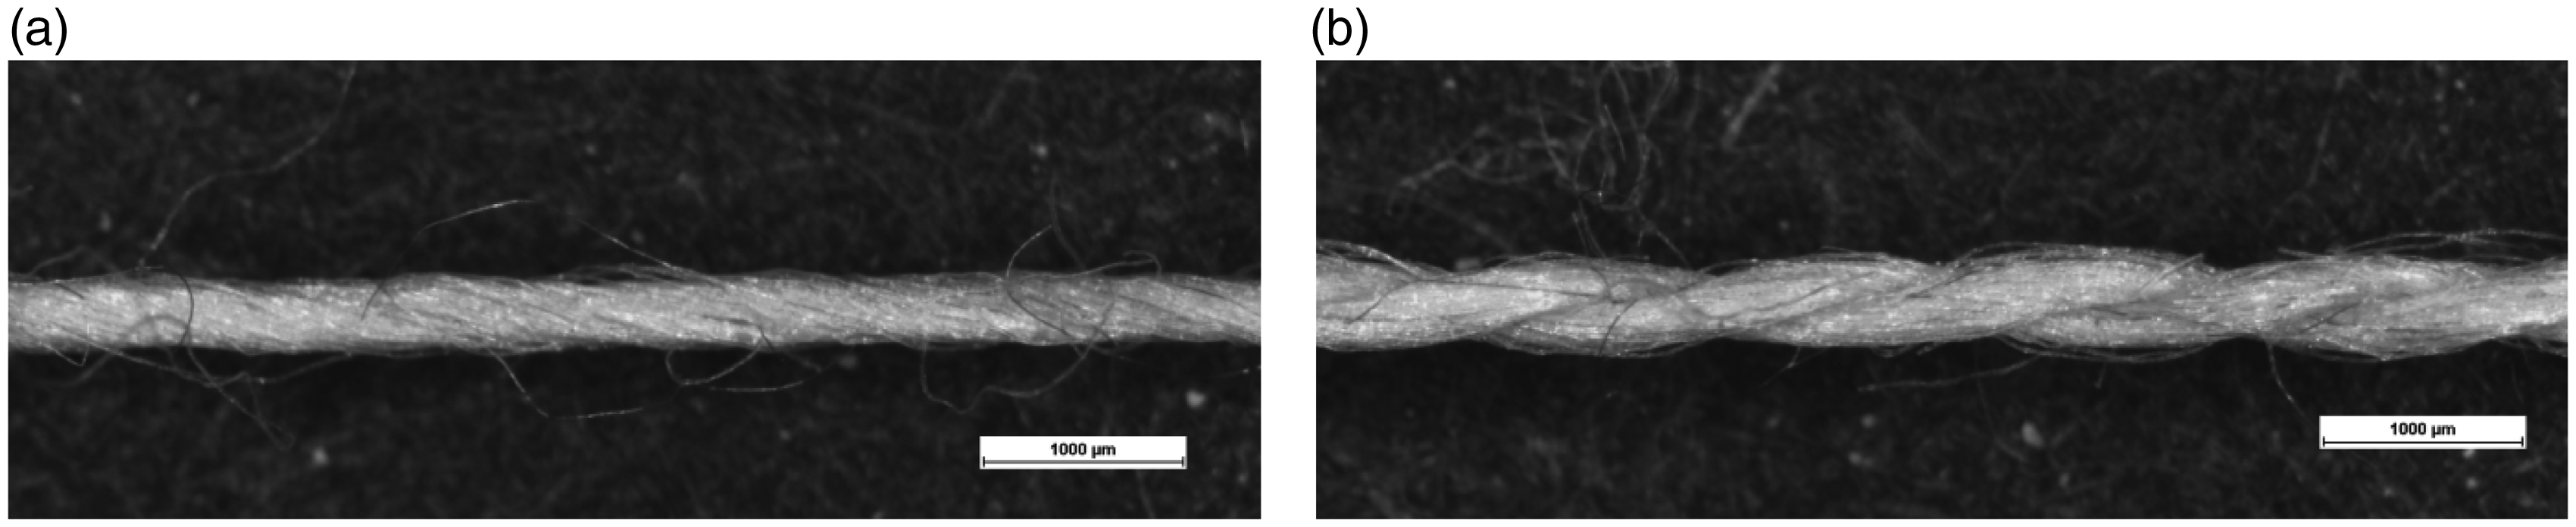
Hybrid fabrics
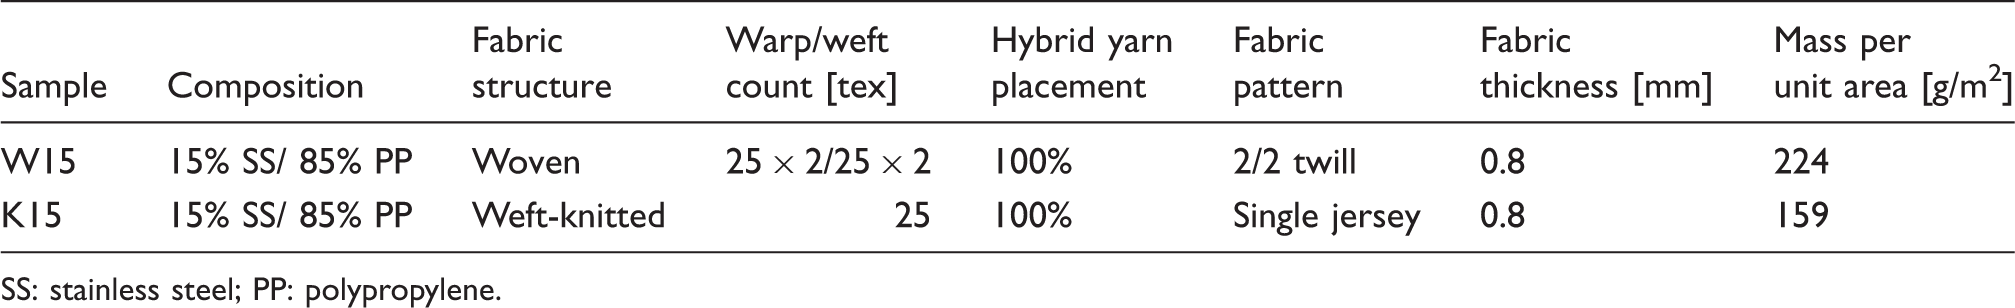
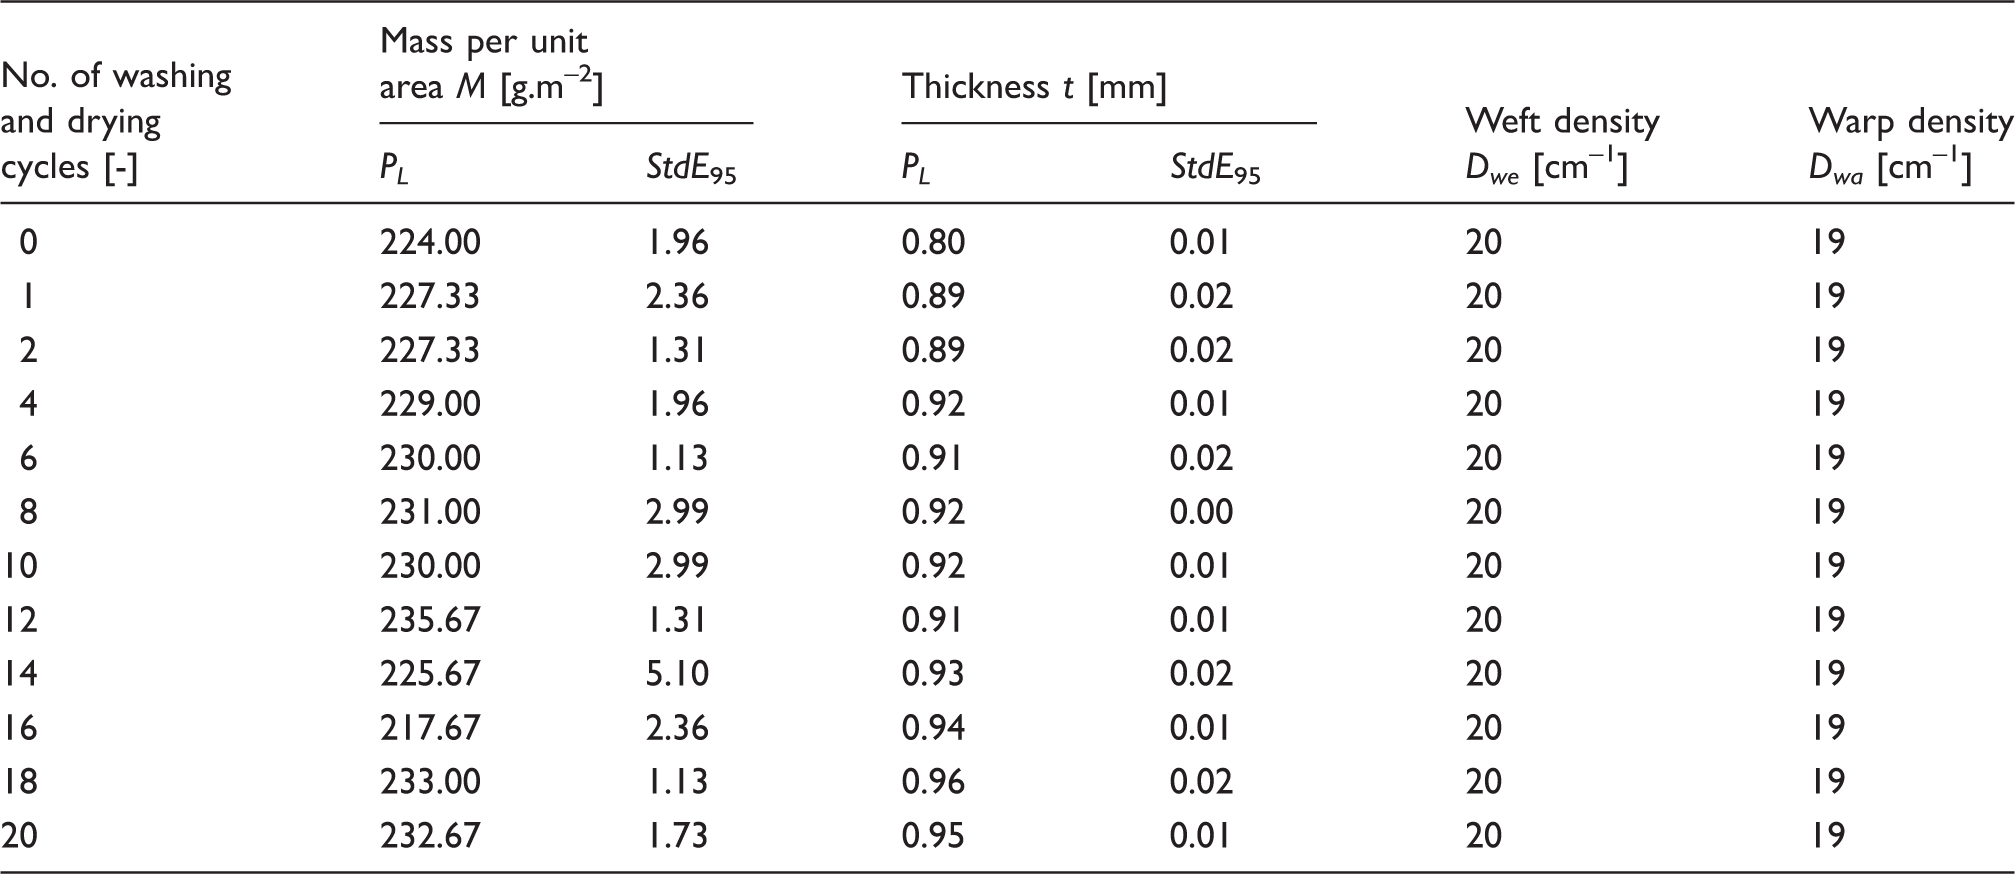
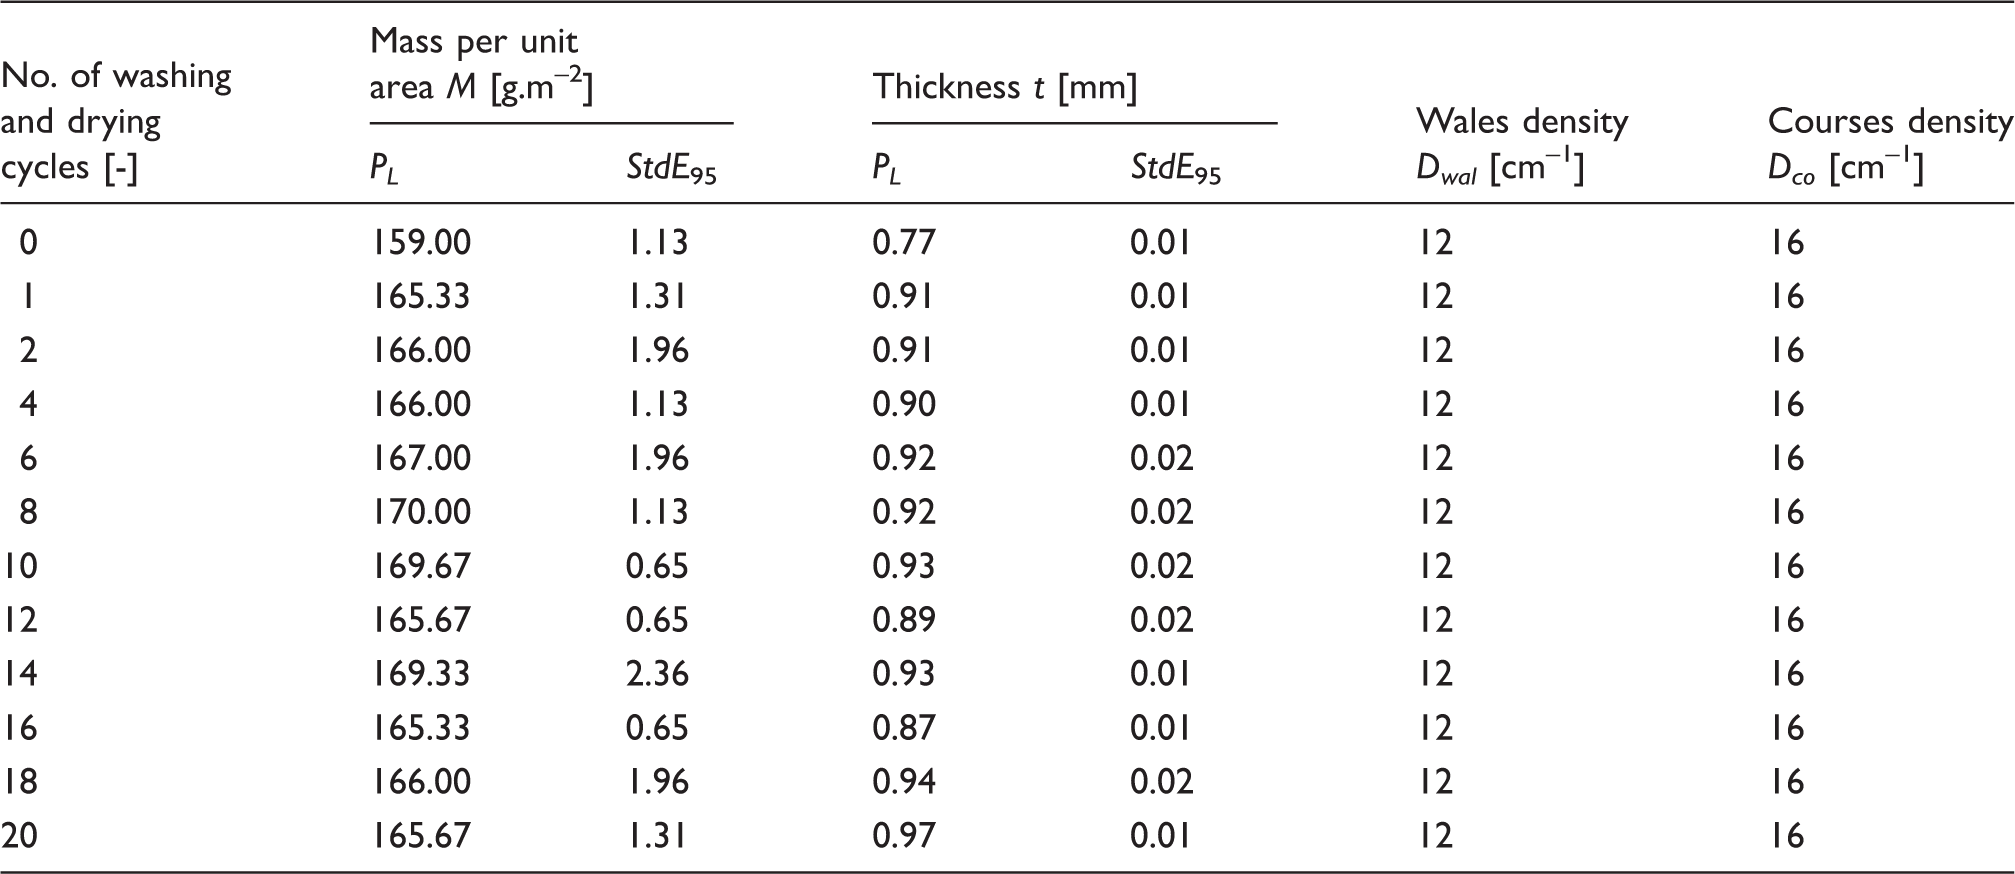
Two types of metal fiber-containing fabrics, woven and knitted, were created using the hybrid yarns described above for investigation. The woven structure represents a sample with twill 2/2 weave made of 100% of conductive yarn (weft and warp fineness 51 tex, warp sett 20 1/cm, weft sett 19 1/cm). The knitted structure represents plain jersey knit made of 100% of conductive (yarn fineness 25 tex, 12 wales/cm in the wale direction, 16 courses/cm in the course direction). The characteristics of the hybrid fabrics are shown in Table 2. Microscopic images of hybrid fabrics are shown in Figure 2.
Microscopic images of (a) sample W15 and (b) sample K15. Characteristics of hybrid fabrics SS: stainless steel; PP: polypropylene.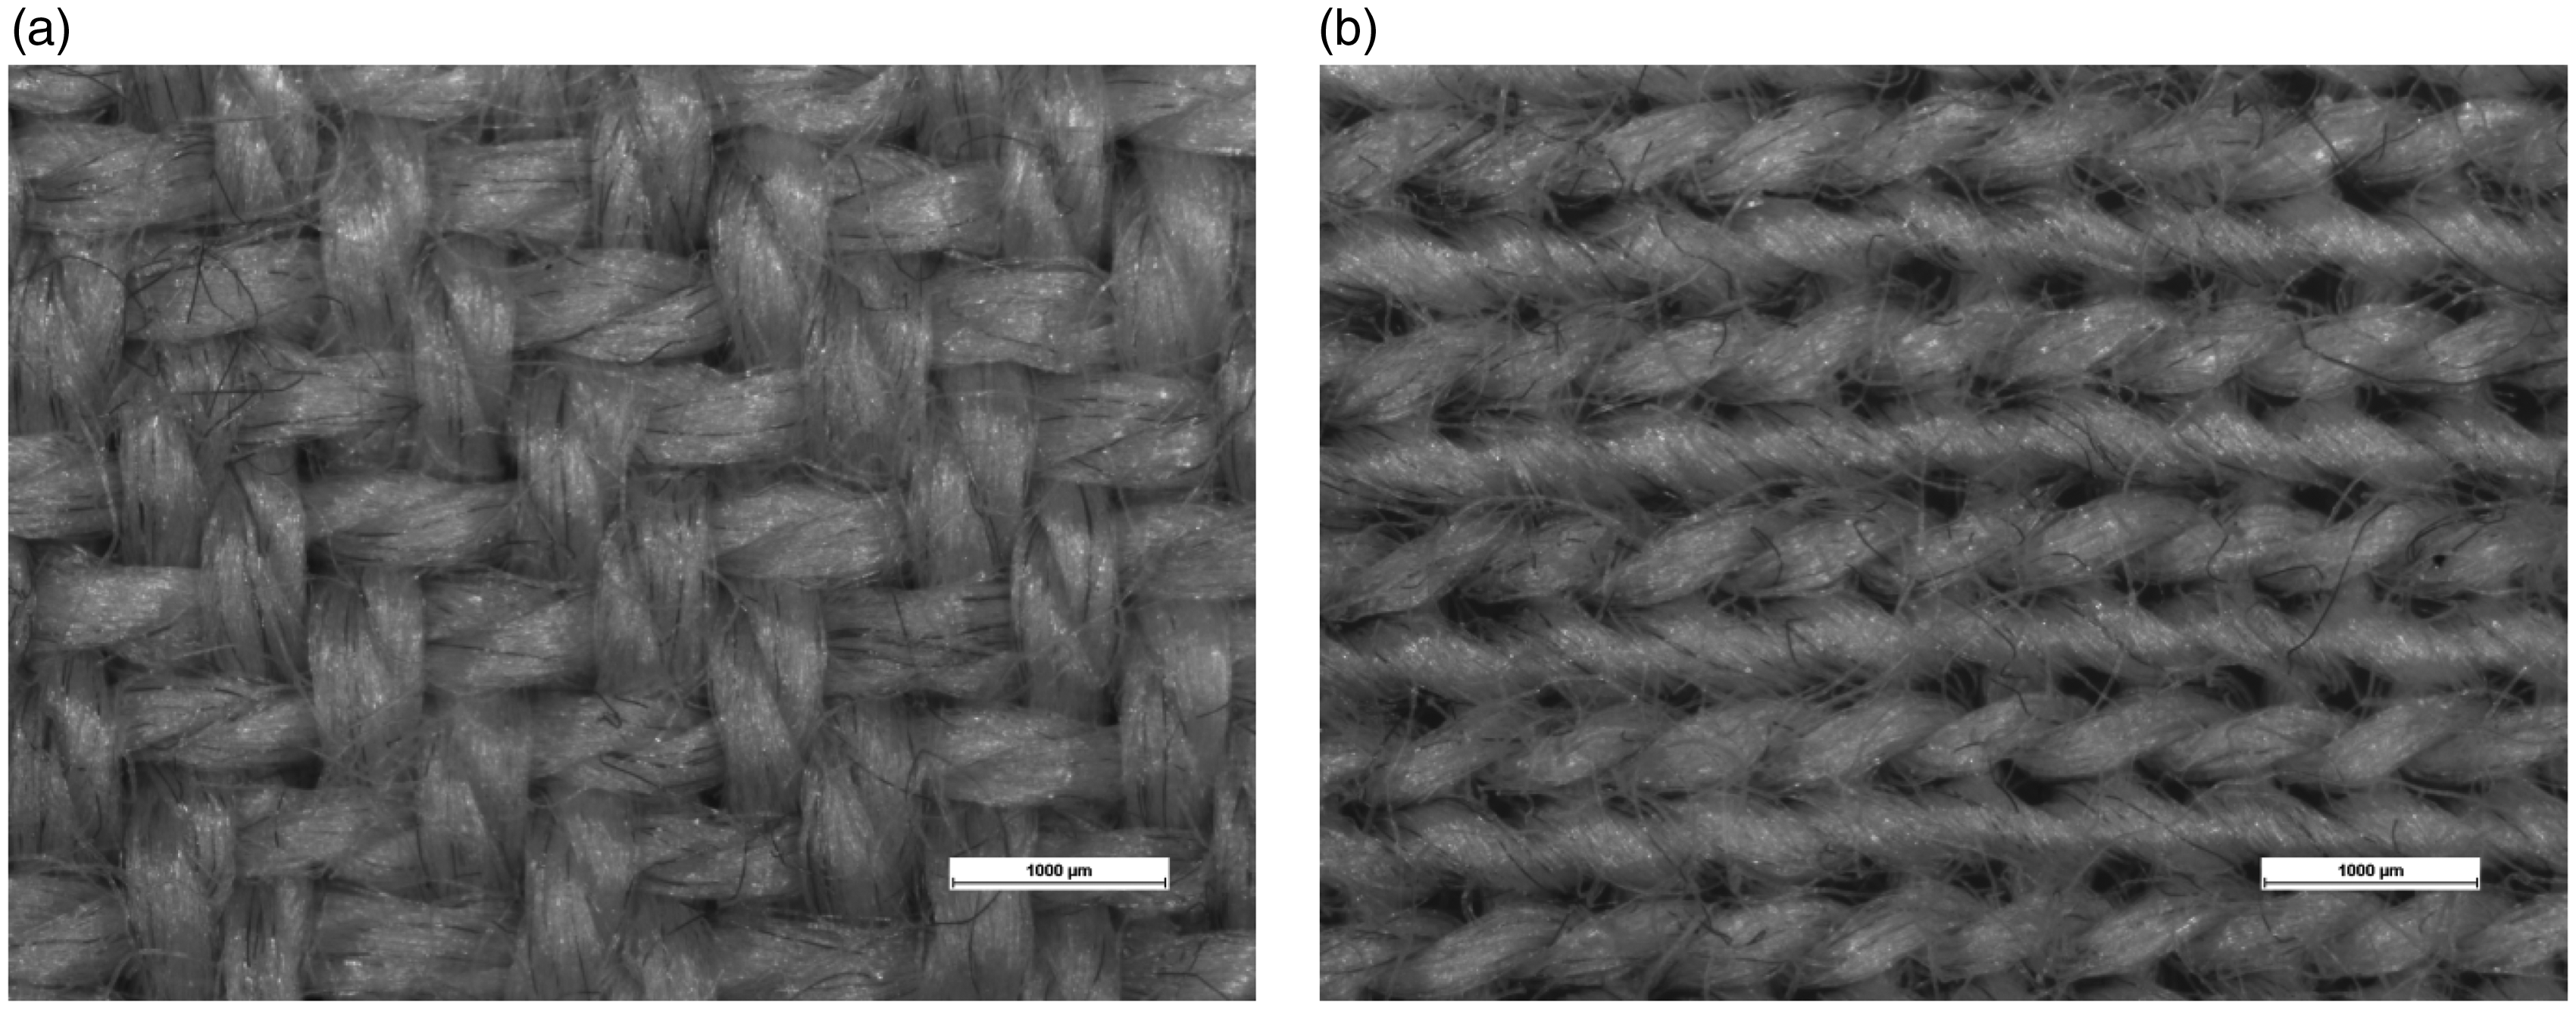
Methods
Washing and drying process
Samples were subjected to repeat wet processing (washing and drying). The conventional washing was performed according to the EN ISO 6330 22 standard using a Miele Professional W6071 washing machine. A residual moisture dryer, Miele Professional PT 5137, was used for drying. Samples were washed at 40℃ washing temperature, using three rinsing steps; 900 rpm spin speed and phosphate-free ECE 98 standard detergent without optical brighteners. As supplemental fabrics for washing, 100% cotton woven fabrics were used. For drying samples in the laundry dryer, a mild 45-minute-long program with the temperature of air (60 ± 10)℃ called Outdoor was used. The fabric sample sizes were 20 cm × 50 cm; the edges were finished by an overlock machine. Wet processing of samples (1 × washing + 1 × drying) was performed repeatedly 1×, 2×, 4×, 6×, 8×, 10×, 12×, 14×, 16×, 18× and 20× to simulate the real cleaning process during the wearing cycle. The wet processing procedure was repeated and samples were taken off subsequently.
Statistical analysis of small samples
For the small sample sizes available for the EM shielding evaluation process and fabric dimensional properties evaluation, a procedure based on order statistics introduced by Horn
23
was used. This methodology is used for sample sizes where 4 ≤ n ≤ 20 and it is based on the depths that correspond to the sample quartiles. The pivot depth is expressed by


The random variable

The 95% confidence interval of the mean is expressed by pivot statistics as

Electromagnetic shielding effectiveness evaluation
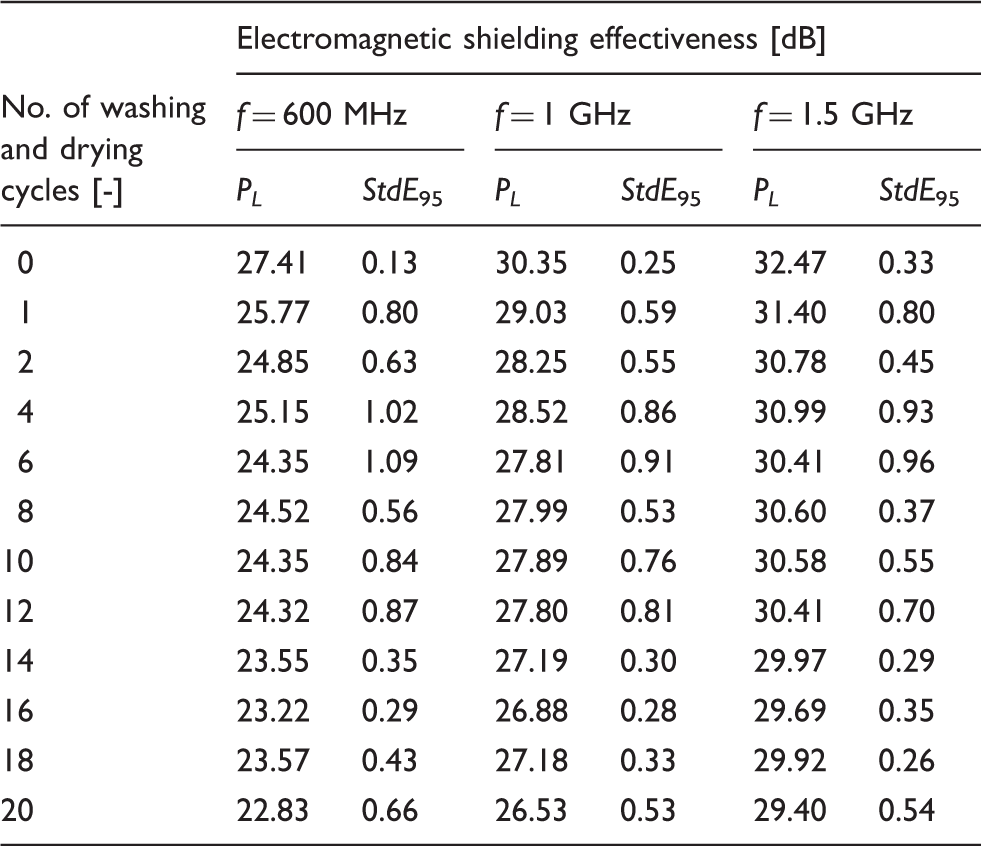
Mean values and StdE for 95% confidence intervals of means of shielding effectiveness for woven sample W15
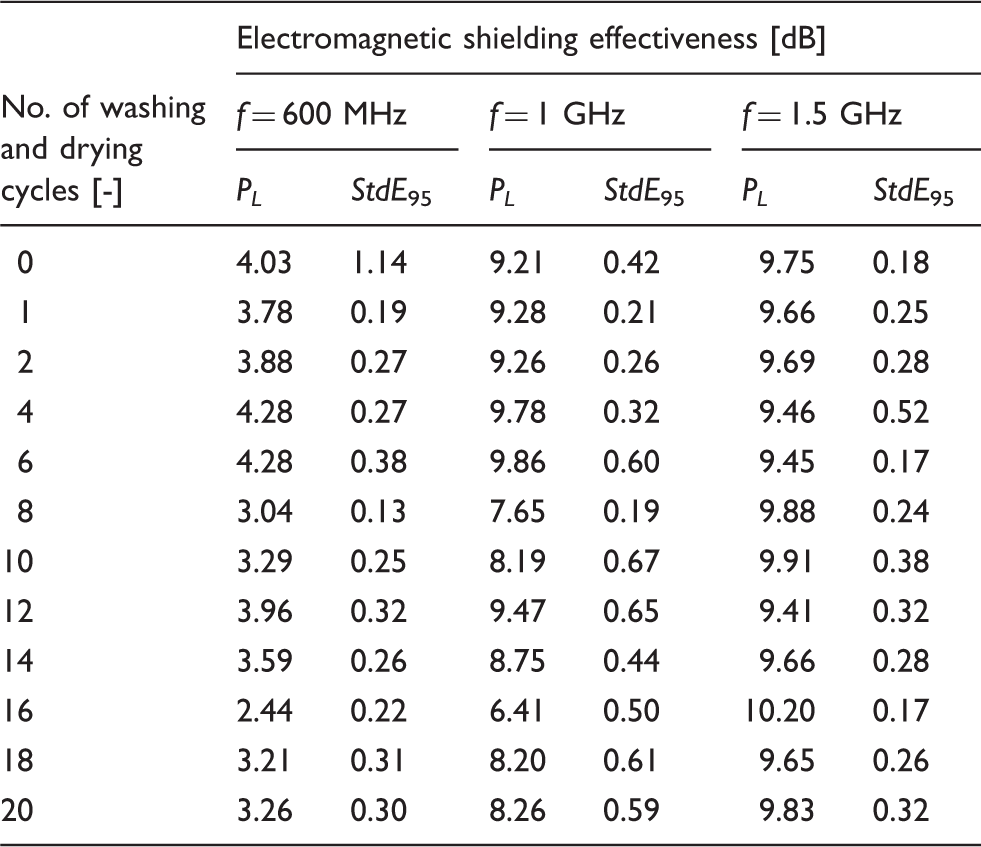
Mean values and StdE for 95% confidence intervals of means of shielding effectiveness for knitted sample K15
Electric resistivity evaluation
Volume and surface resistivity were evaluated according to ČSN 80 005925 (this Czech standard follows European standards EN 1149-126 and EN 1149-2;
27
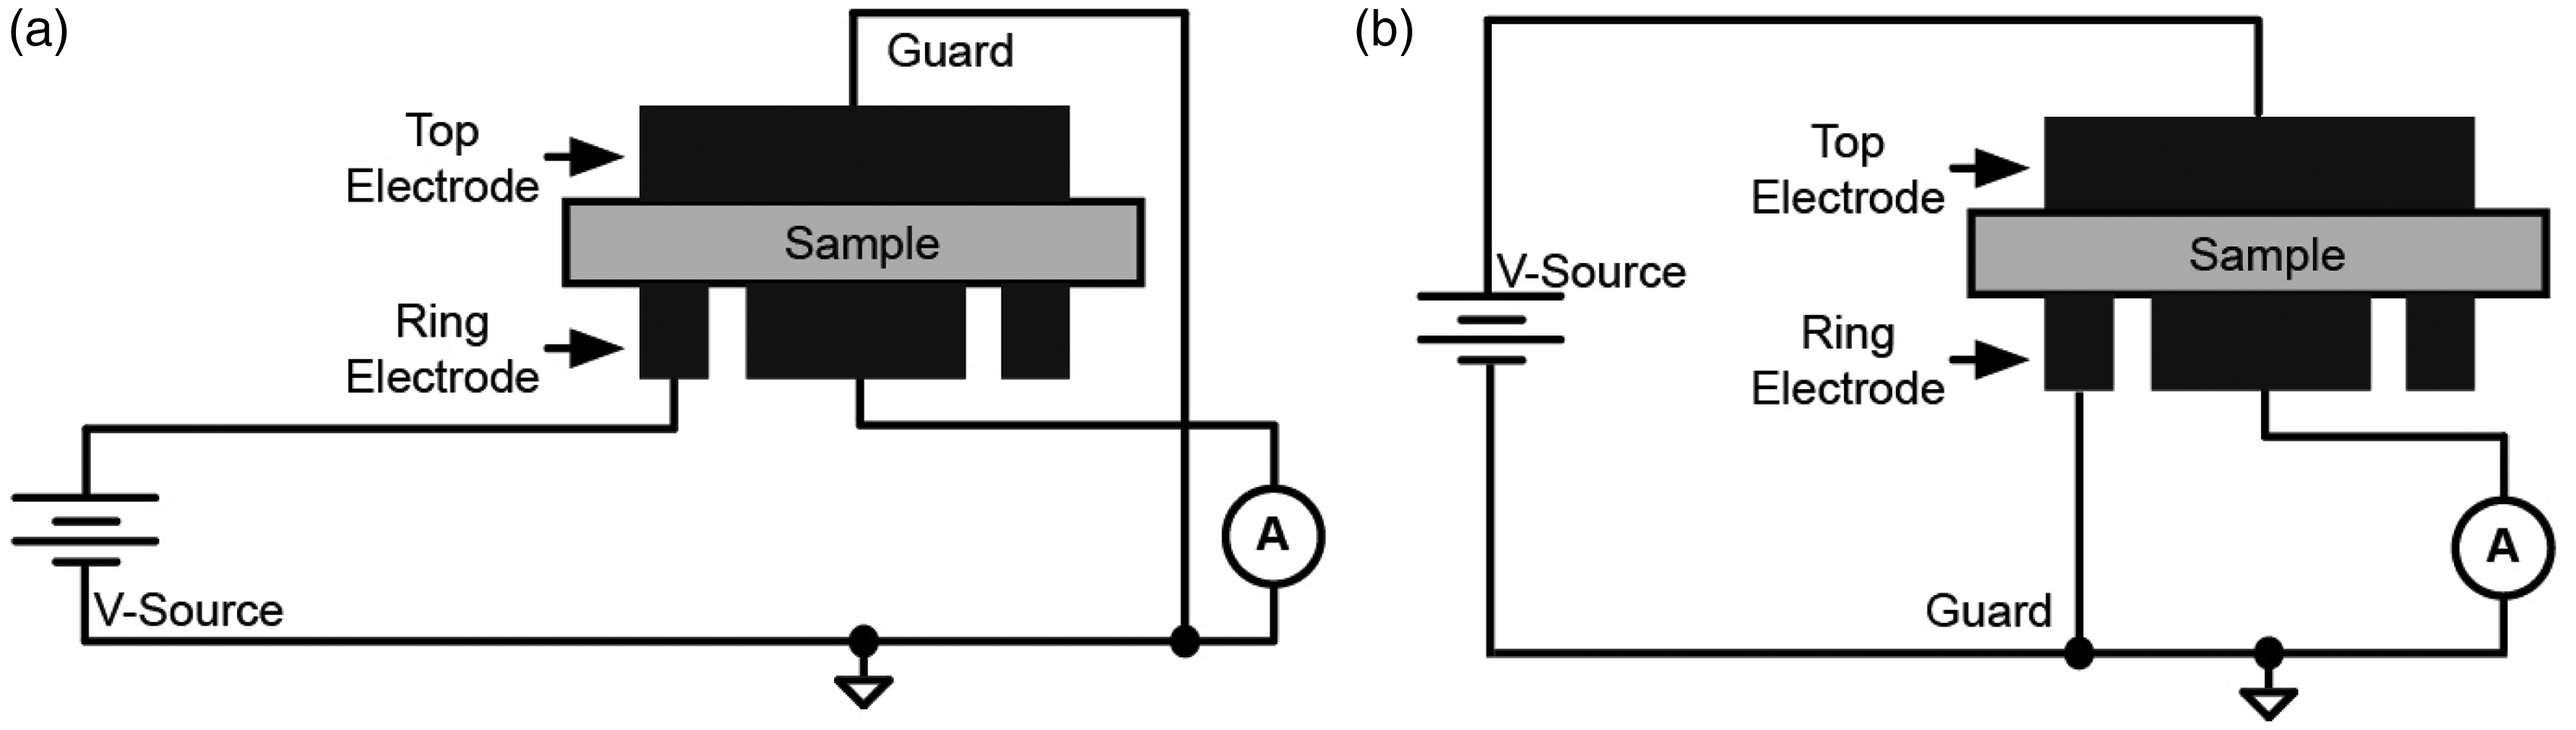
only the relative humidity of air during measurement is different compared to the European standards – usage of relative humidity (40 ± 2)% and (65 ± 2)% is recommended in the Czech standard) at the temperature T = 22.3℃ and relative humidity RH = 40.7%. Volume resistance is measured by applying a voltage potential across opposite sides of the sample and measuring the resultant current through the sample (see Figure 3). Volume resistivity ρV [Ω.cm] was calculated from relation
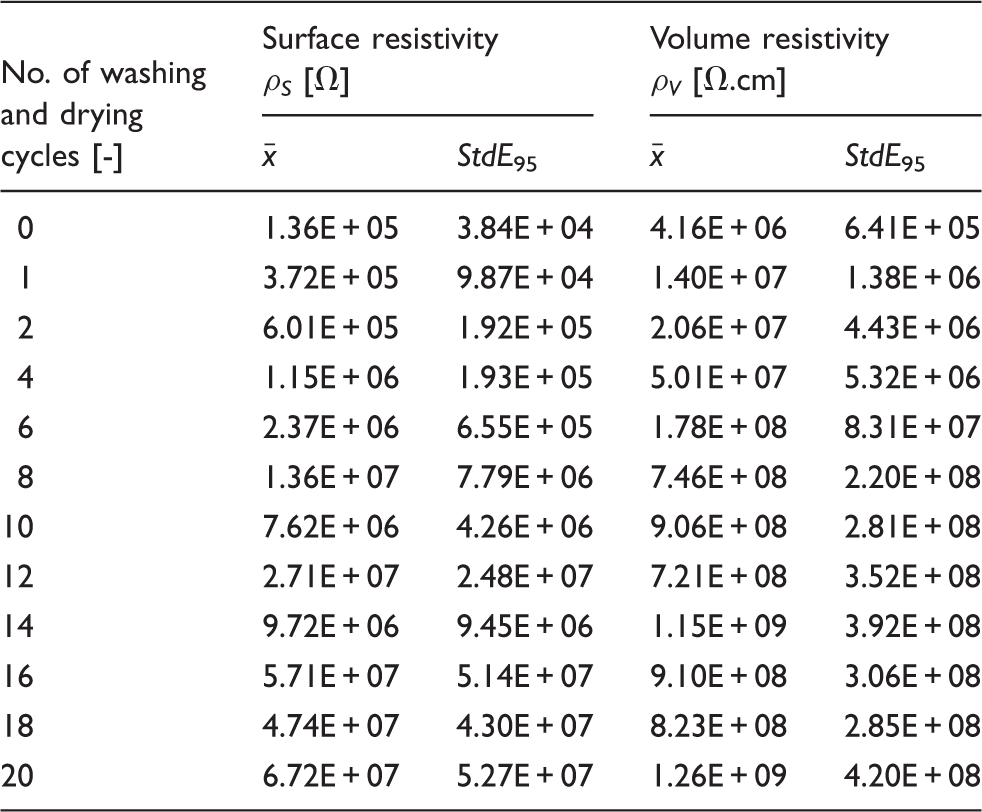
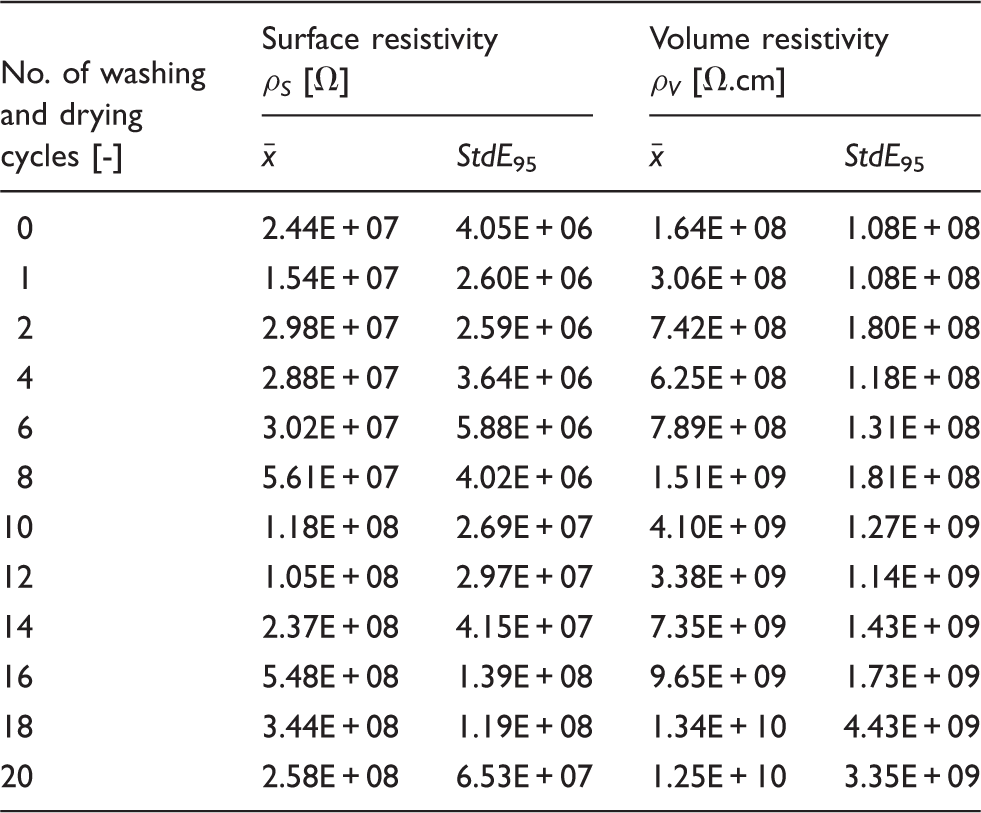
Schematic diagram of an experimental set-up to measure (a) surface and (b) volume electrical resistance. Mean values and StdE for 95% confidence intervals of means of ρS and ρV for woven sample W15 Mean values and StdE for 95% confidence intervals of means of ρS and ρV for knitted sample K15

Fabric dimensional properties
Mean values and StdE for 95% confidence intervals of means of M and t, mean values of Dwe and Dwa for woven sample W15
Mean values and StdE for 95% confidence intervals of means of M and t, mean values of Dwe and Dwa for knitted sample K15
Pilling evaluation
A pilling evaluation belongs to the most used tests for an assessment of the quality of garment fabrics. Pilling of fabrics is a negative and complex property that is caused by a friction or rubbing on the fabric surface during common wearing and maintenance. Pills occurred on the top of the tested fabrics during various washing and drying cycles. Therefore, the next step was the assessment of changes in appearance of the sample surfaces, especially the pilling evaluation. Generally, the pilling evaluation is based on a subjective classification of the sample according to a rating scale with five grades of pilling: grade 5 – no pilling; grade 4 – slight pilling; grade 3 – moderate pilling; grade 2 – severe pilling; grade 1 – very severe pilling.
In this study, pilling of the woven and the knitted samples after the washing and drying cycle was objectively evaluated using a method described by Technikova et al. 32 to overcome the disadvantages of subjective evaluation, such as human factors, lack of accuracy, slow process, inconsistency, etc. The objective method is based on a three-dimensional (3D) fabric surface reconstruction using the gradient field method in software MATLAB. First of all, a set of four images for each sample is needs to be captured. The samples (placed on a smooth solid mat) were laterally illuminated by a planar light source step-by-step from the four different sides: from above, below, the right-hand side and the left-hand side. During individual illumination of the sample, the set of sample images was captured by a camera placed over the sample. An estimation of two gradient images is performed in the next step. The gradient images in the horizontal and vertical directions are estimated from the set of four images of a sample subsequently: the gradient image in the horizontal direction gx was acquired by the subtraction of the sample image illuminated from the left-hand side from the sample image illuminated from the right-and side; the gradient image in the vertical direction gy was obtained by the subtraction of the sample image illuminated from above from the sample image illuminated from below.
The fabric surface is reconstructed to three dimensions from these two gradient images using a special algorithm based on the gradient field method.
33
Thereafter, pills were segmented by a local thresholding algorithm according to Niblack method described in.
34
The procedure of the objective method for the pilling evaluation of the knitted sample after 20 washing and drying cycles is presented in Figures 4(a)–(g).
An illustration of the procedure for objective pilling evaluation on the knitted sample after 20 washing cycles. The set of four images of the sample illuminated from (a) right, (b) below, (c) left and (d) above. (e) Three-dimensional fabric surface, (f) binary image and (g) original image of the sample with detected pills marked in red. (Color online only.)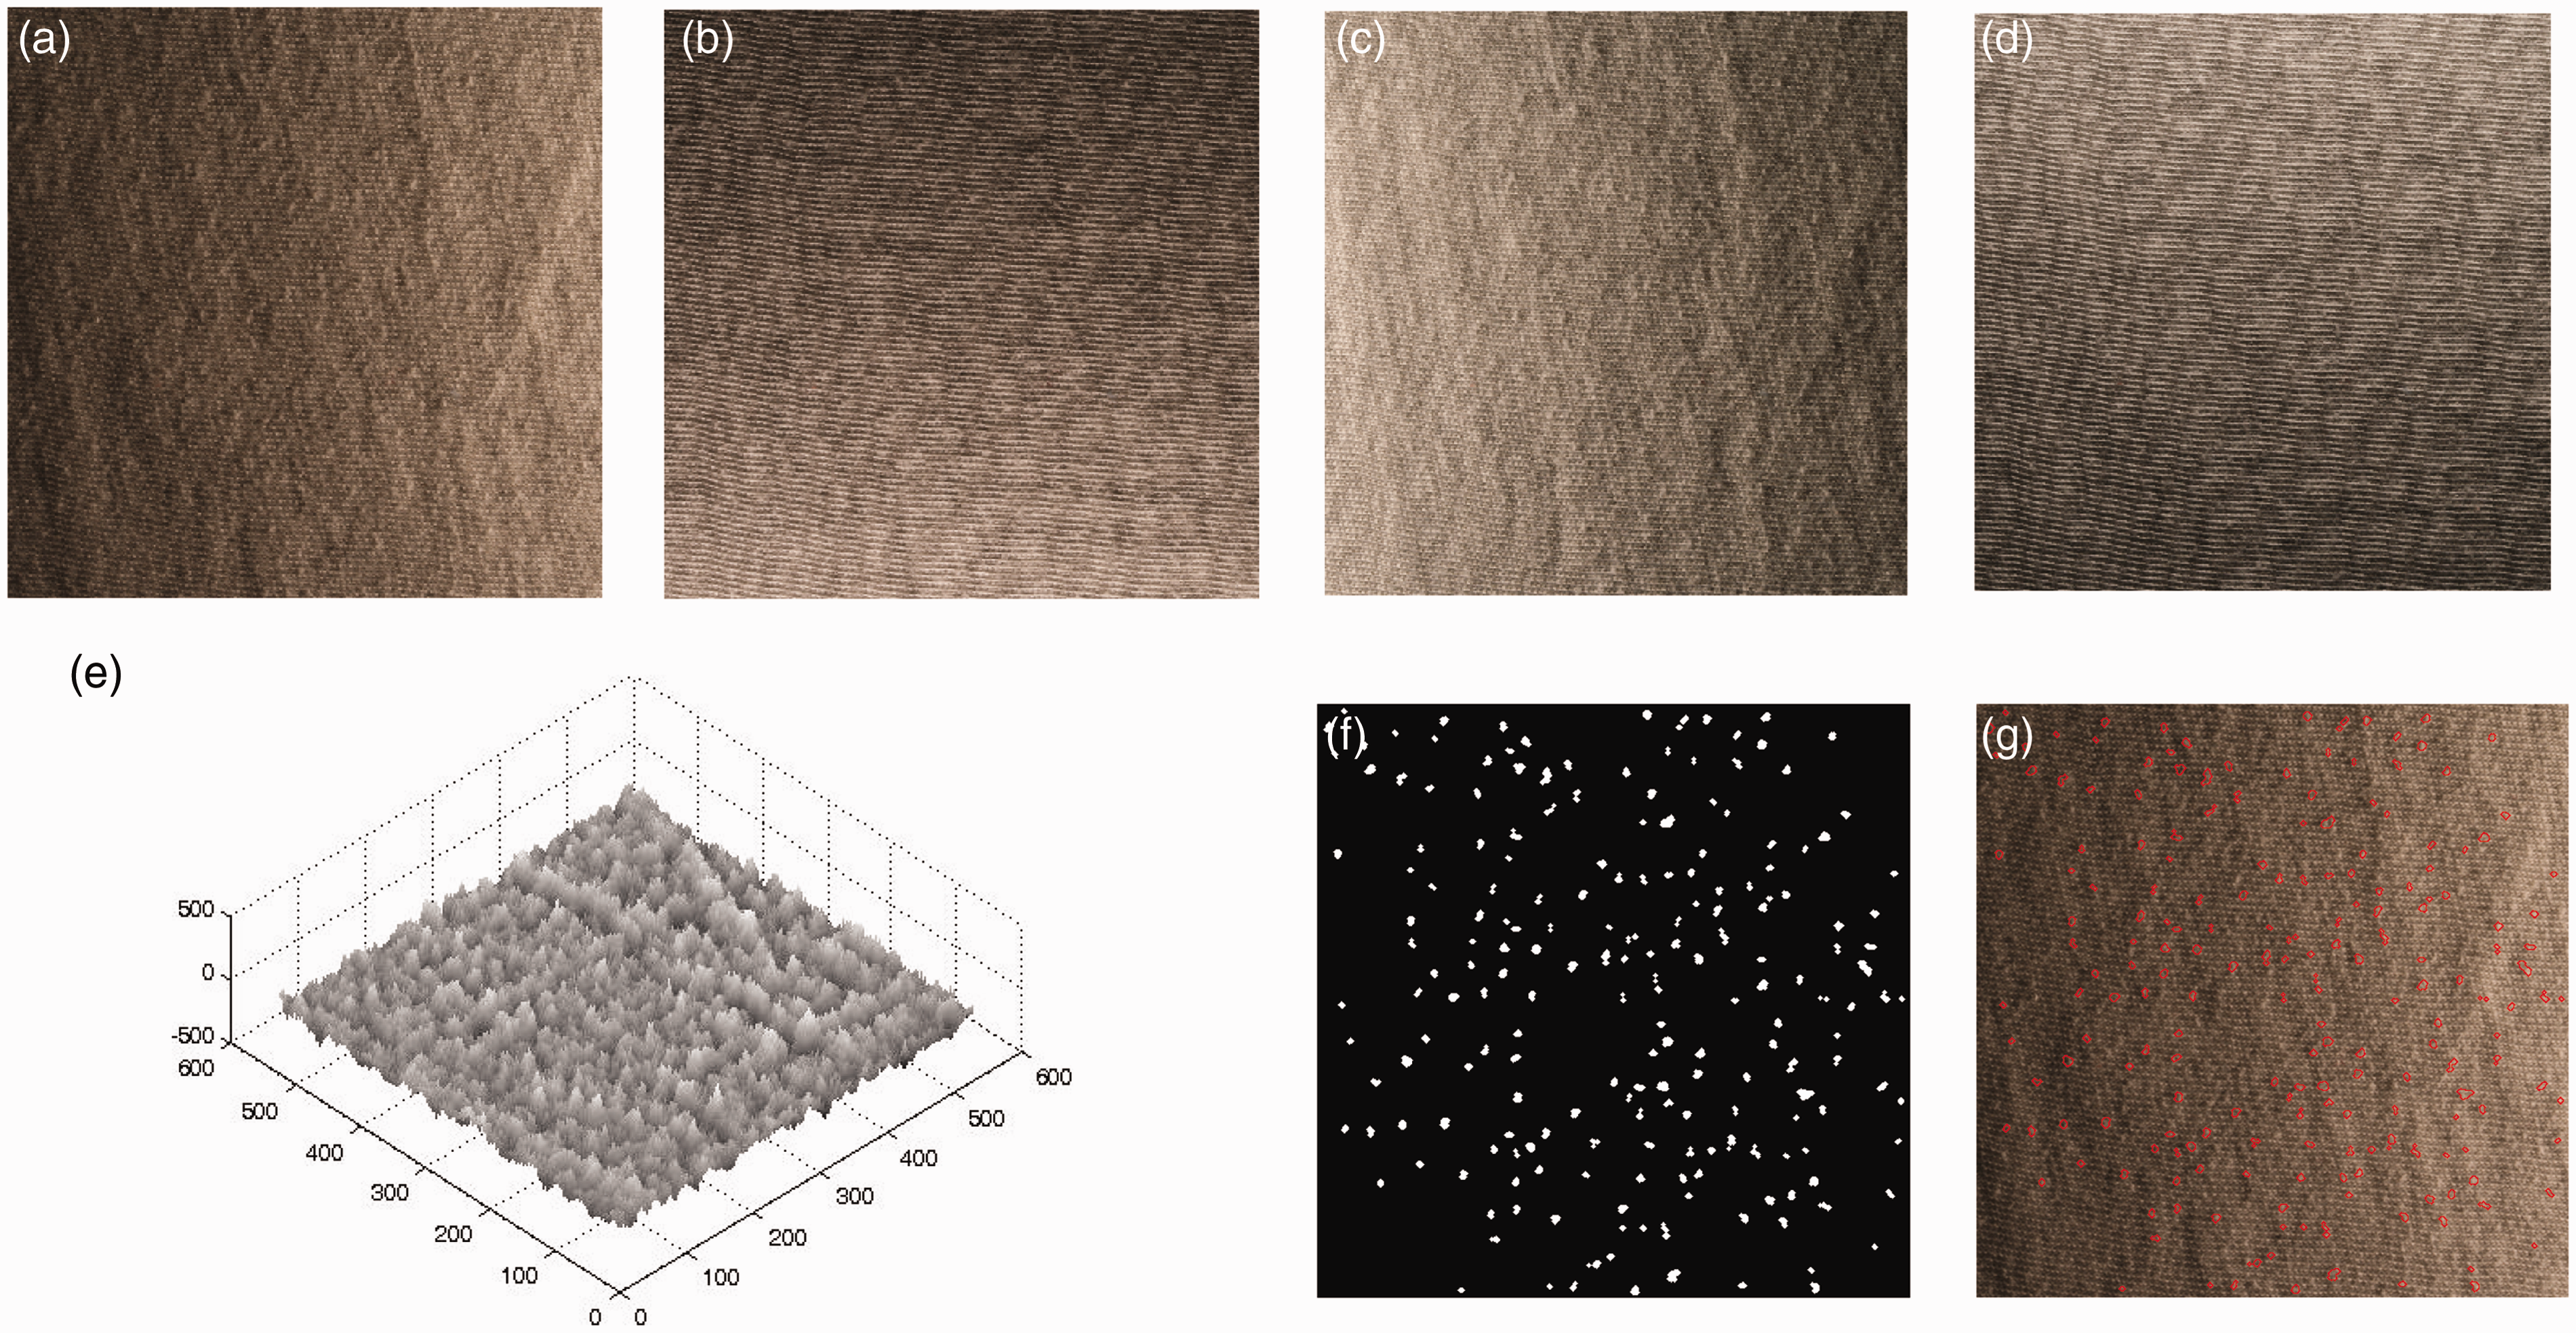
Due to basic image processing techniques it is possible to extract pill characteristics from the obtained binary images. The number of pills N [-] (the monitored area of sample is 49 cm2), the average area of pills AA [mm2], the standard deviation of area of pills SDA [mm2], the total area of pills AT [mm2] on the monitored area, the average perimeter of pills PA [mm] and the standard deviation of the perimeter of pills SDP [mm] represent the main characteristics of pills. An objective pilling grade PG [-] of the samples was estimated from the extracted characteristics based on comparison with standard pilling test images. Using statistical analysis, it was found that the number of pills N is a key factor influencing the pilling grade. The final equation for estimation of the objective pilling grade was derived as follows:

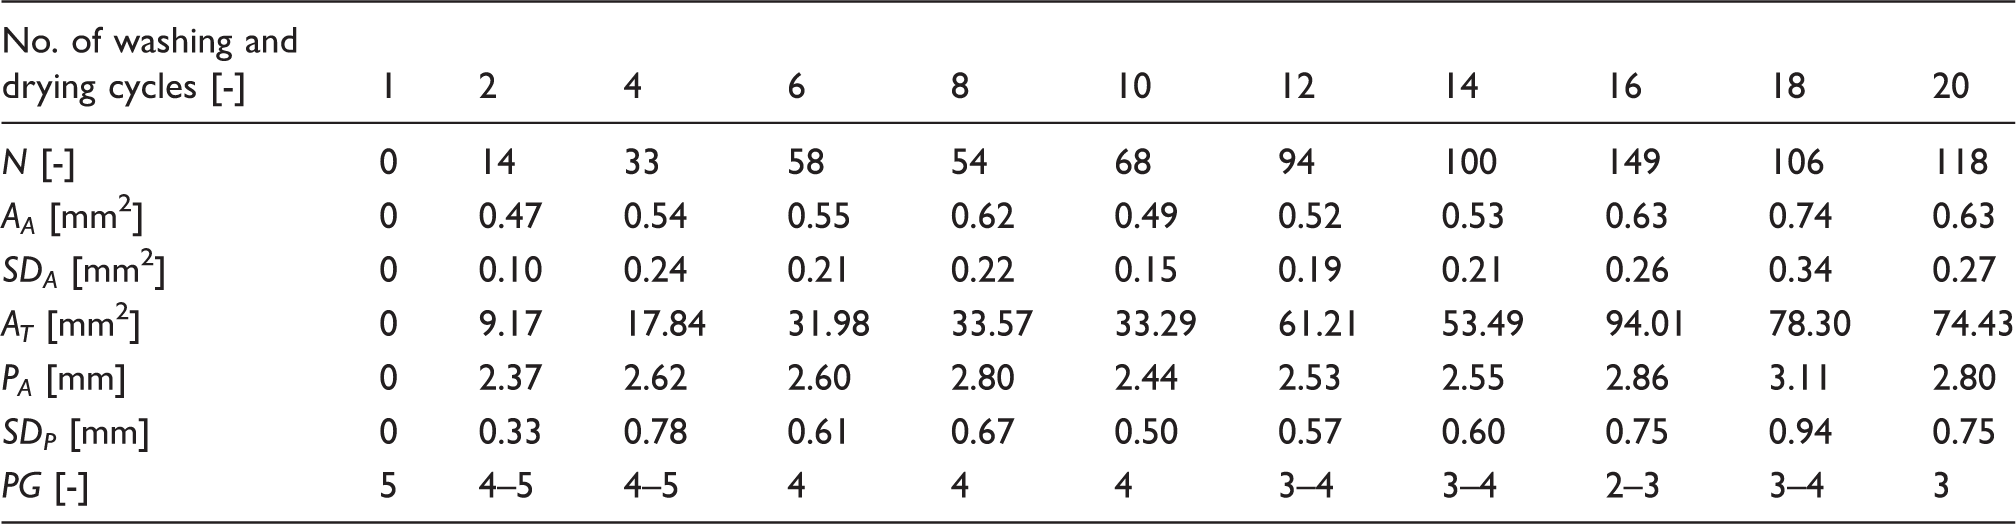
Summary of basic pill characteristics and estimated pilling grades of woven samples after individual washing cycles.
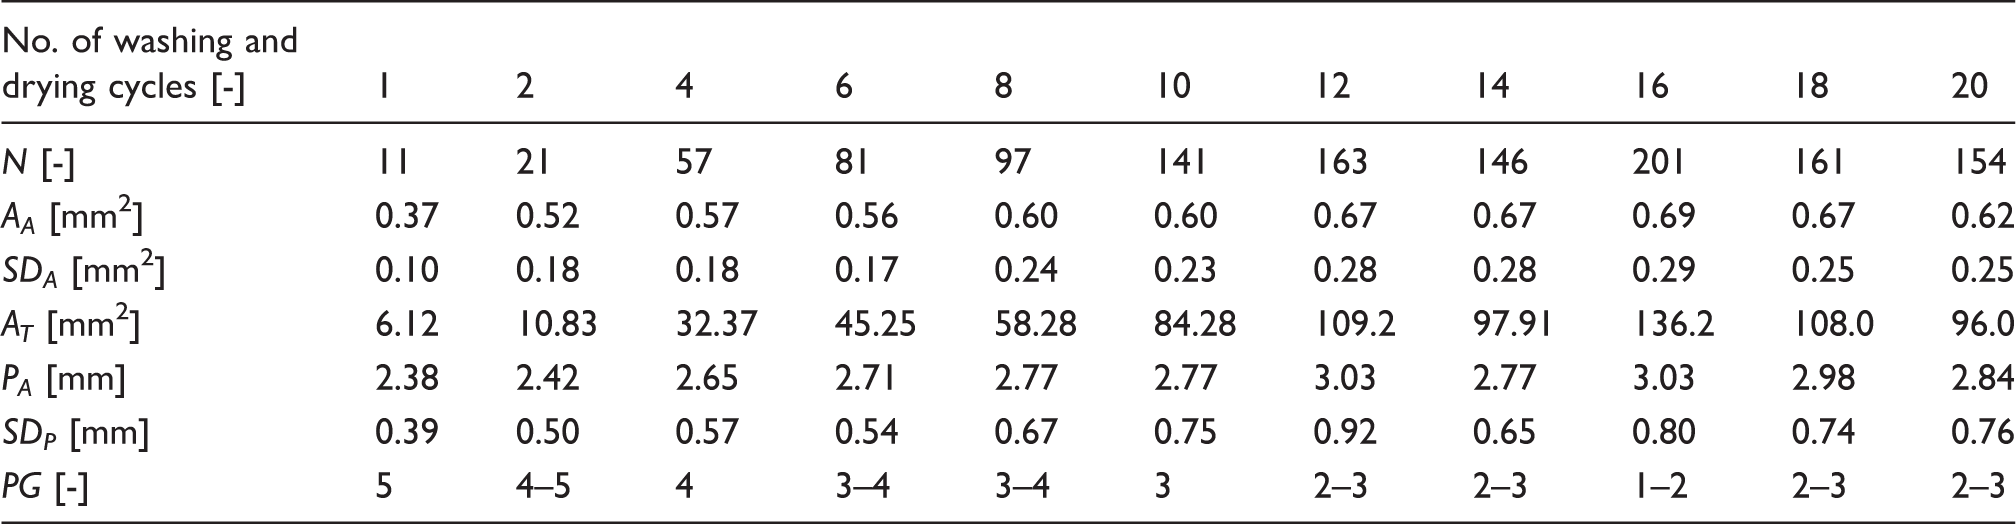
Summary of basic pill characteristics and estimated pilling grades of knitted samples after individual washing cycles.
Results and discussion
Frequency-dependent analysis of electromagnetic shielding effectiveness
It was found that the relationship between EM SE and frequency for woven samples can be obtained by the generalized logarithmic function adapted from Ott:
35
Dependence of electromagnetic (EM) shielding effectiveness (SE) on frequency for (a) the woven reference sample approximated by the logarithmic function and (b) the knitted reference sample approximated by the cubic spline function.
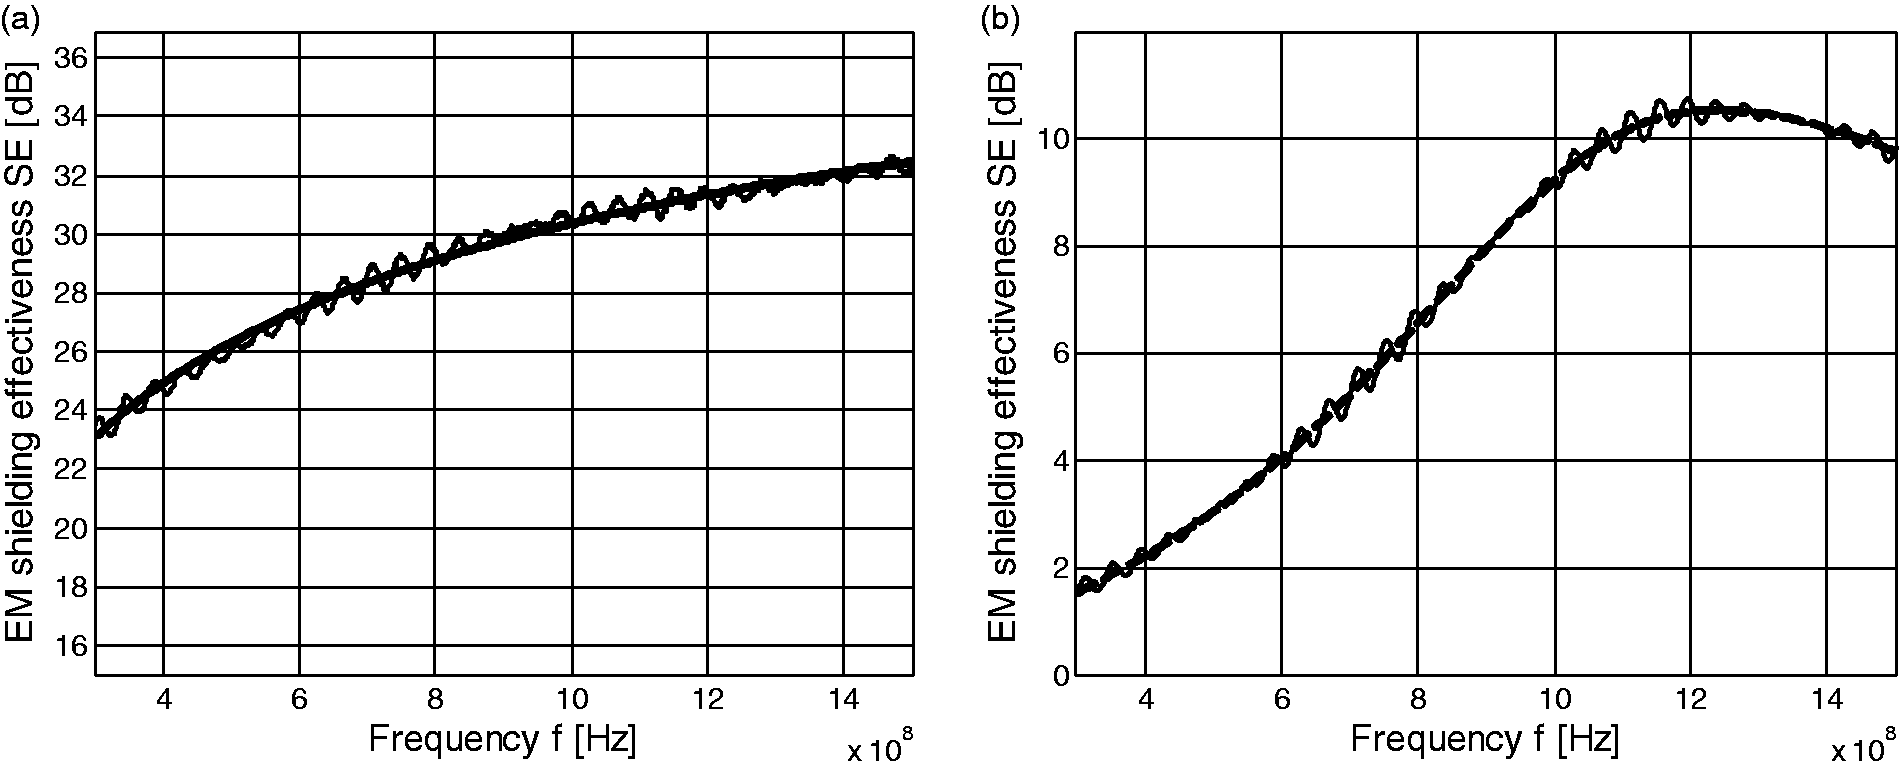
The dependence of SE on frequency for knitted samples behaves differently compared to woven samples. Frequency dependence of knitted sample SE was approximated by the cubic spline function with smoothing parameter p = 4.5 E-25, which possesses a sufficiently high degree of smoothness (see Figure 5(b)) where reference sample K15 is presented. The smooth dashed line in this graph corresponds to the regression model (cubic spline function) with parameters obtained by the minimizing sum of squared errors. The corresponding coefficient of determination R2 = 0.997 indicates the good quality of fit. This function dramatically increases in the frequency range from 30 MHz to 1.2 GHz (global maximum); after that a slight decrease occurs. In the case of knitted samples, extrapolation out of the measured range is not suitable. These findings (approximation by the logarithmic function for woven samples and usage of the cubic spline function for knitted samples) have been already verified for a wider sample set by Safarova and Militky.3,4
Effect of washing and drying on electromagnetic shielding effectiveness
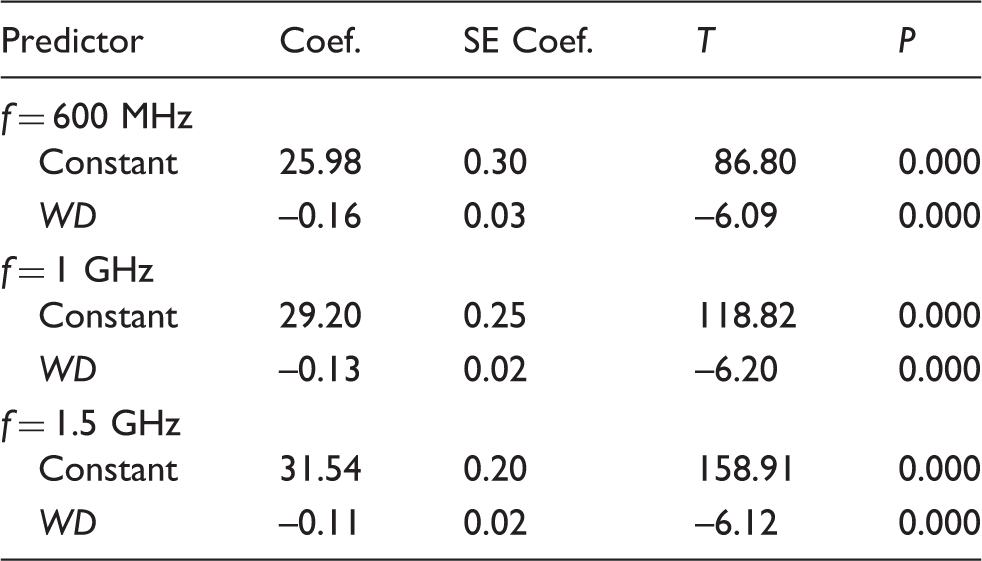
Figure 6(a) shows the variation in SE for woven fabric (W15) after the washing and drying treatment with incident frequency in the range of 30–1500 MHz. It can be seen that the unwashed sample reaches the highest values of EM shielding efficiency throughout the whole frequency band (SE > 32 dB for f = 1.5 GHz). With an increasing number of washing and drying cycles, the SE of the material decreases proportionally for all frequencies. In Figures 6(b)–(d) there are shown dependences of EM SE on the number of washing and drying cycles for woven samples for the frequencies of 600 MHz, 1 GHz and 1.5 GHz. It can be observed from the figures that the SE drops after 10 washing and drying cycles by about 2 dB compared to the original SE value of unwashed sample (matches 94% of base line). After 20 washing cycles the shielding efficiency decreases by about 3 dB (matches 90% of base line). This phenomenon is probably caused by the migration of metal fibers of the yarn structure. Dependence of EM SE on the number of washing and drying cycles can be described using a linear function. The solid lines in this graph correspond to the regression models (straight line) with parameters obtained by the minimizing sum of squared errors. The corresponding coefficient of determination R2 = 0.79 indicates the good quality of fit.
(a) The dependence of electromagnetic (EM) shielding effectiveness (SE) on frequency for sample W15. The dependence of EM SE on the number of washing and drying cycles for frequencies: (b) 600 MHz; (c) 1 GHz; (d) 1.5 GHz.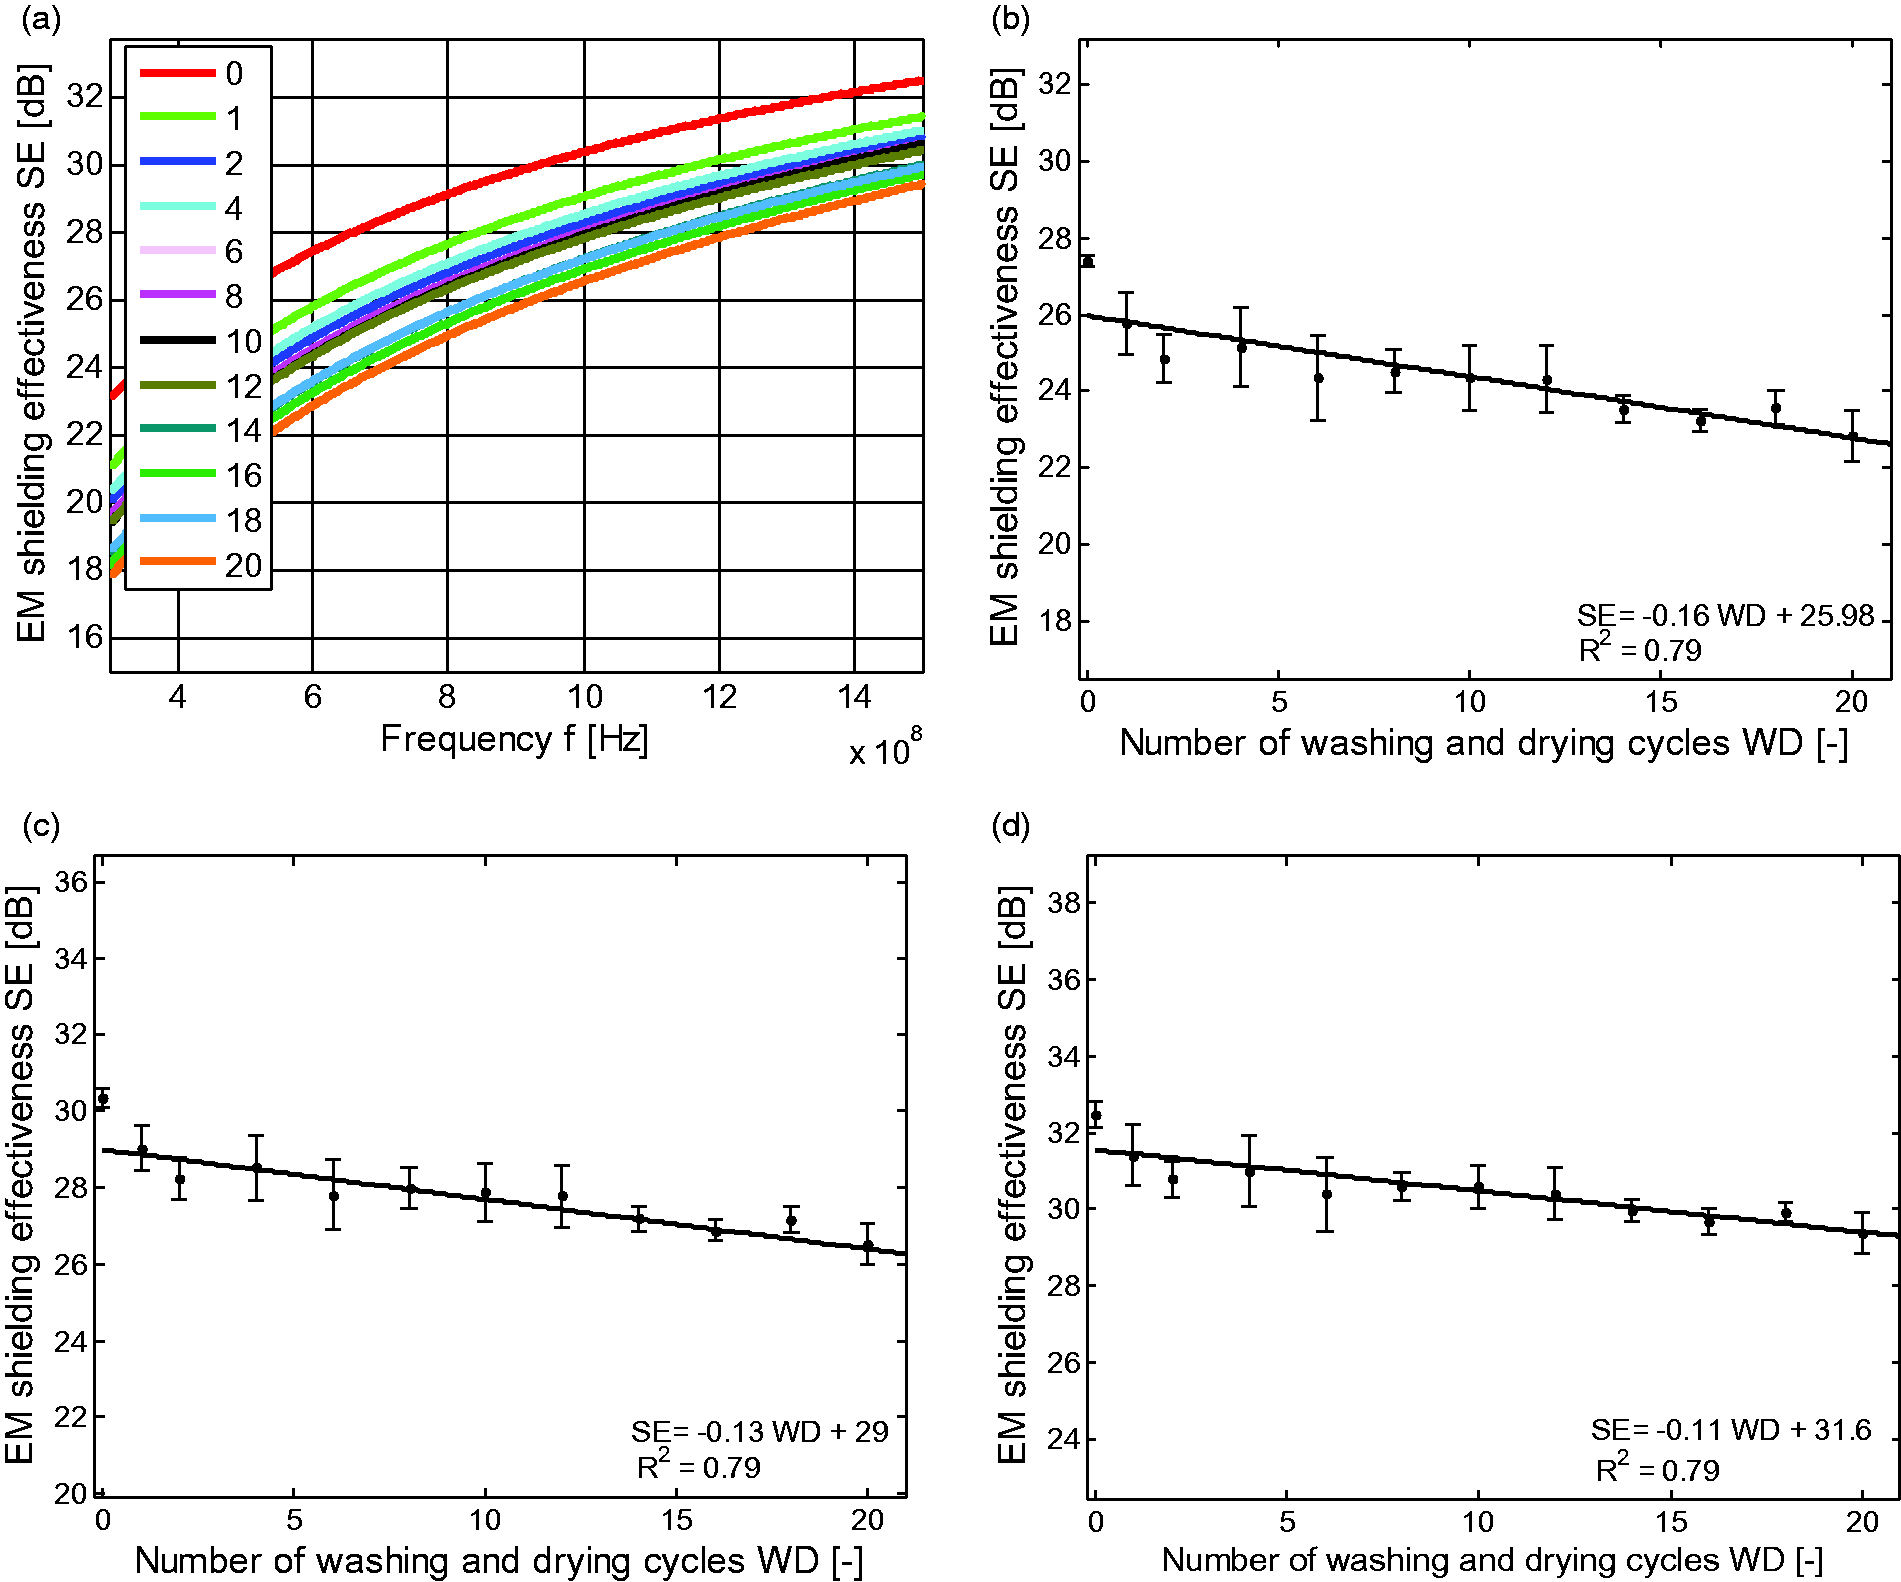
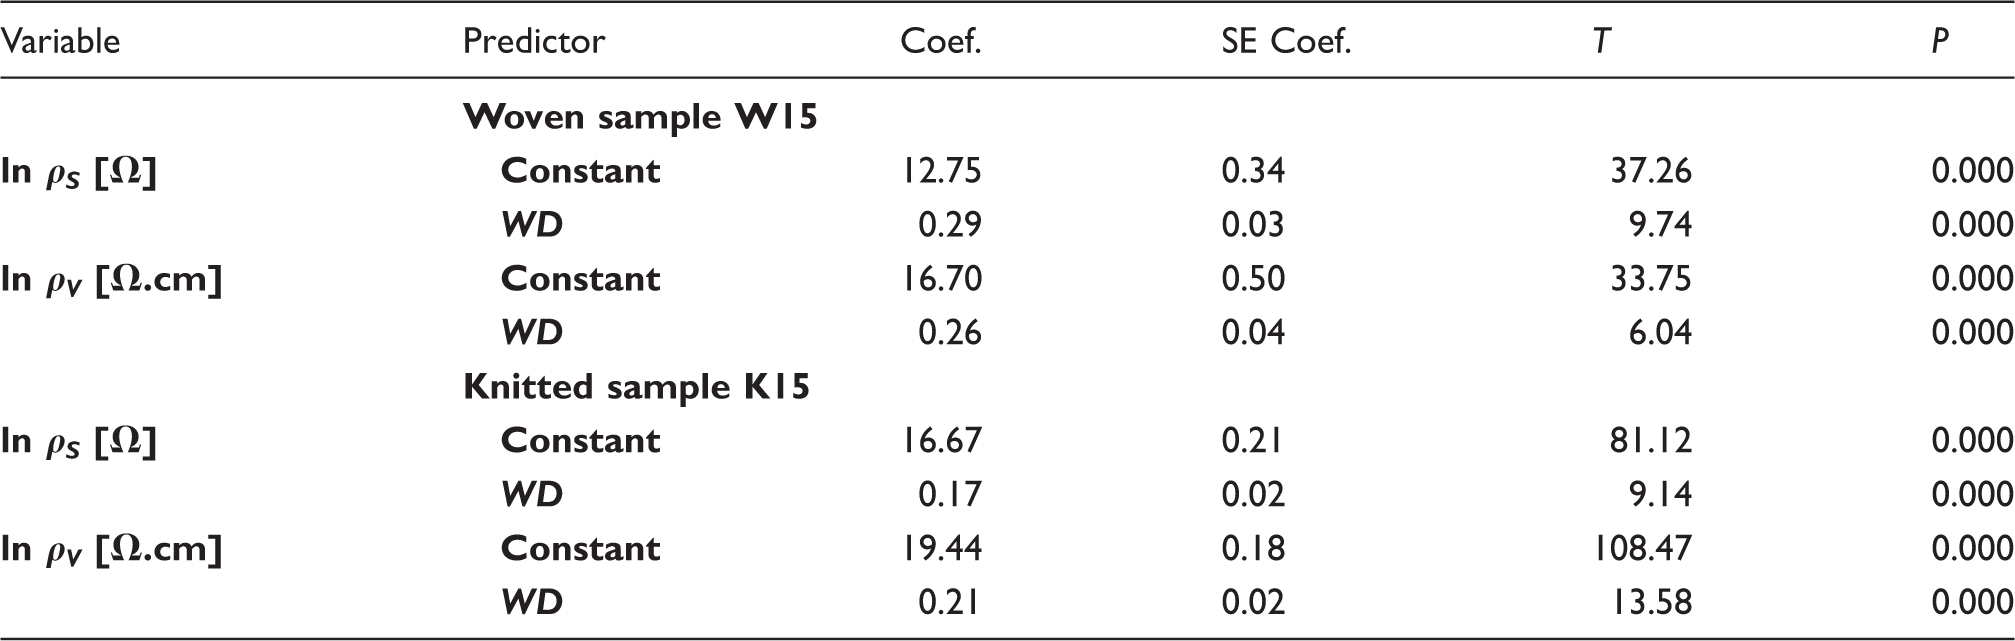
Results of linear regression analysis for sample W15.
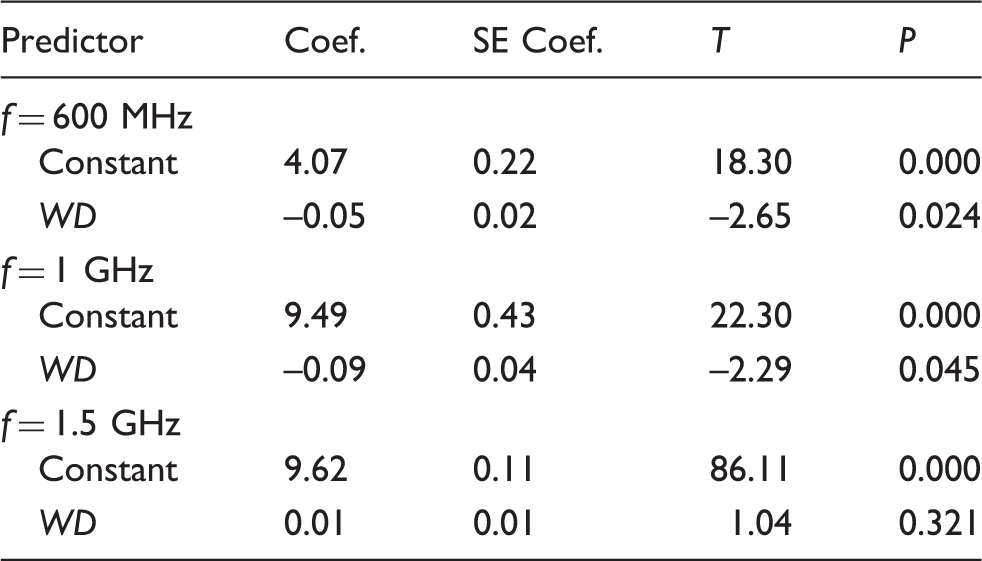
The variation in SE for knitted fabric (K15) after the washing and drying treatment with incident frequency in the range 30–1500 MHz is shown in Figure 7(a). It can be seen that the knitted samples reach EM shielding efficiency much lower (about 10 dB for frequency 1.5 GHz) than woven samples. This phenomenon is caused by usage of finer yarns with a lower mass per unit area; hence, knitted samples contain lower absolute metal fiber content compared to woven samples. The lower SE of knitted fabrics compared to woven ones can be explained by higher porosity and lower cover factor. Knitted fabrics are also unique in their anisotropic structure (horizontal direction of yarns is predominant), which causes lower total shielding, whereas woven fabrics have isotropic shielding due to the orthogonal direction of yarns. In addition, the stretch of knitted fabrics can contribute to the reduction of SE. Frequency-dependent EM shielding (Figure 7(a)) does not provide clear information about the effect of wet processing. In Figures 7(b)–(d), there are shown dependences of EM SE on the number of washing and drying cycles for knitted samples for the frequencies 600 MHz, 1 GHz and 1.5 GHz. It seems from Figures 7(b) and (c) that SE is slightly decreasing with the increasing number of washing and drying cycles at frequencies of 600 and 1000 MHz. It can be observed from the figure that the SE drops after 20 washing and drying cycles of about 1 dB compared to the original SE value of the unwashed sample (matches 90% of base line). Figure 7(d) shows an almost constant value of SE depending on the number of washing and drying cycles at f = 1.5 GHz, which indicates that the EM shielding ability of the knitted samples after washing and drying treatment remained unchanged. Dependence of EM SE on the number of washing and drying cycles was approximated by a linear function. The solid lines in these graphs correspond to the regression models (straight line), with parameters obtained by the minimizing the sum of squared errors. It has to be pointed out that the corresponding coefficient of determination R2 = 0.4 – 0.1 is low and therefore usage of the constant function instead of the linear function is more appropriate.
(a) The dependence of electromagnetic (EM) shielding effectiveness (SE) on frequency for sample K15. The dependence of EM SE on number of washing and drying cycles for frequencies: (b) 600 MHz; (c) 1 GHz; (d) 1.5 GHz.
Results of linear regression analysis for sample W15.
Effect of washing and drying on the electrical conductivity of samples
Figure 8 shows the dependence of the natural logarithm of surface and volume resistivity on the number of washing cycles for sample W15. It can be seen that the resistivity is increasing with the increasing number of wet processing cycles (increase to tens of thousands of percent compared to the baseline). This phenomenon is in agreement with the evaluation of sample EM shielding performance measurement. As the resistivity increases, the conductivity decreases, which can cause, according to theory, a decrease of shielding ability. The dependence of the natural logarithm of both resistivities on the number of washing and drying cycles can be described by a linear function. The solid lines in these graphs correspond to the regression models (straight line) with parameters obtained by the minimizing sum of squared errors. The corresponding coefficients of determination R2 = 0.90 and R2 = 0.78 indicate the good quality of fit. The linear model was chosen because of its simplicity and goodness of fit proved by high coefficients of determination. It can be summarized that electric resistivity increased about two orders of magnitude after applying 10 cycles of wet processing and about three orders of magnitude after applying 20 cycles of wet processing, compared to the reference sample. Despite the decrease of electrical conductivity in the woven sample subjected to 20 cycles of washing and drying, a certain ability of the sample to shield the EM field (at least 29 dB at frequency 1.5 GHz) are still preserved (see the Electromagnetic shielding effectiveness evaluation section).
The dependence of the logarithm of (a) surface and (b) volume resistivity on the number of washing and drying cycles for woven sample W15.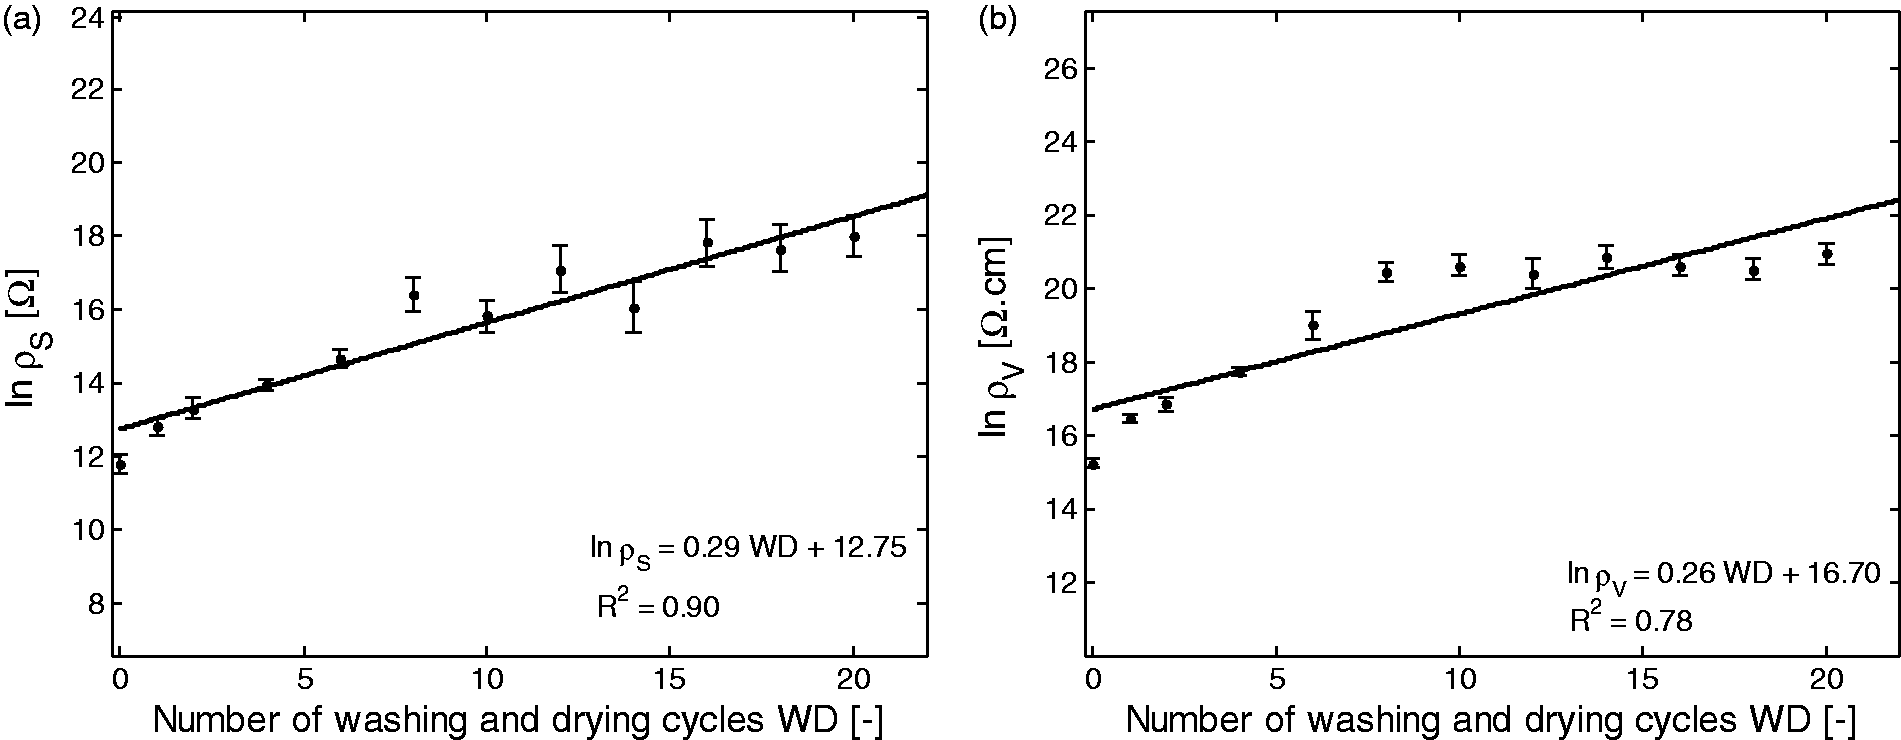
The dependence of the natural logarithm of surface and volume resistivity on the number of washing cycles for sample K15 is shown in Figure 9. It is observable also for the knitted sample that the electrical conductivity decreases after applying wet processing, which means that mean values of surface and volume resistivity are increasing (they increase to thousands of percent compared to the baseline). The dependence of the natural logarithm of both resistivities on the number of washing and drying cycles can be described by a linear function. The corresponding coefficients of determination R2 = 0.89 and R2 = 0.95 indicate the good quality of fit. From the measurement results that after 10 cycles of wet processing, resistivity increased by about one order of magnitude, while an increase of resistivity of about two orders of magnitude can be observed as compared to the reference sample after 20 cycles. The knitted sample reached lower absolute changes in resistivity after applying washing and drying cycles compared to the woven sample. It has to be mentioned that by using concentric ring electrodes for resistivity evaluation the anisotropic behavior of conductivity of knitted fabrics is neglected. Also for the knitted sample, the decrease in conductivity did not significantly change its EM shielding ability (at least 9 dB at frequency 1.5 GHz; see the Electromagnetic shielding effectiveness evaluation section.
The dependence of the logarithm of (a) surface and (b) volume resistivity on the number of washing and drying cycles for knitted sample K15.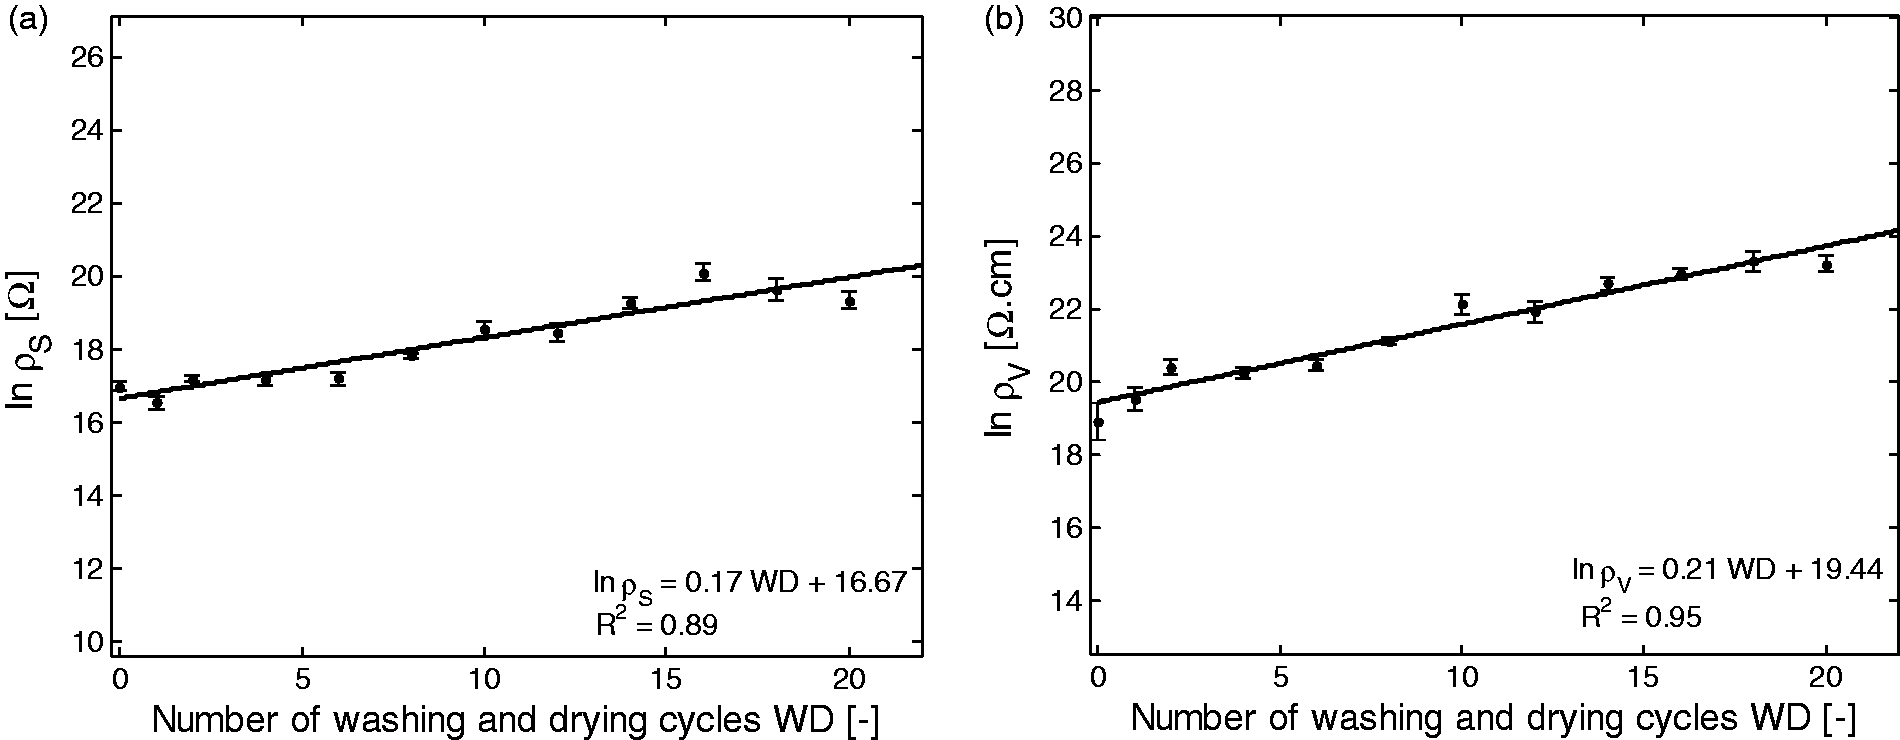
Results of linear regression analysis for sample W15.
Dimensional changes after washing
Mass per unit area of fabrics remained more or less constant after the fabrics were subjected to the repeated washing and drying processing, as shown in Figure 10. This phenomenon was observed in both structures (woven, knitted). It stands to reason that significant migration of SS fibers out of the structure did not take place. The linear regression model was applied to the data, but with a view to low coefficient of determination (R2 = 0.04, R2 = 0.11) it is clear that usage of the constant function instead of the linear function is more appropriate. It is evident that knitted samples had lower mass per unit area because of thinner yarns and a lower factor compared to woven samples. Also density of weft and warp yarn and density of wales of courses remained unchanged (see Table 7). The dependence of thickness on the number of washing and drying cycles for both samples is shown in Figure 11. It can be seen that there is a significant increase of thickness after the first washing and drying for both woven and knitted samples (about 11% and 18%, respectively, of the reference thickness of woven and knitted samples). It is supposed that this phenomenon is caused by loosening of the fabric structure and increase of yarn hairiness. When applying extra washing and drying cycles, thickness of the sample is slightly increased, probably because of the extension of fuzz and the formation of pills on the fabric surface. An unexpected drop of thickness appeared (at the 12th and 14th cycles) when studying dependence of thickness on the number of washing and drying cycles for the knitted sample. This behavior can be explained by pill evolution: (a) through abrasion, loose fibers are pulled to the fabric surface and form a layer of “fuzz”; (b) the loose fibers are then entangled by the applied abrasion to form pills; (c) abrasion continues, the anchor fibers are eventually broken and the pills break off. The fabric cover factor has the greatest effect on pilling and therefore for the knitted structure it is easier to form pills than for the woven one. The dependence of the thickness on the number of washing and drying cycles can be described by a power function. The power function was preferred to the linear one in this case because of the significantly higher coefficient of determination R2 while applying the power function. The solid lines in these graphs correspond to the regression models with parameters obtained by the minimizing sum of squared errors. The corresponding coefficients of determination R2 = 0.9 and R2 = 0.77 indicate the good quality of fit. These results help one to understand the increase of both surface and volume resistivity after applying wet processing. As the fabric structure is loosened and the yarn hairiness increase is accompanied by an increase of fabric thickness during wet processing, more insulating air gaps between fibers are formed, causing an increase of surface and volume resistivity.
The dependence of mass per unit area on the number of washing and drying cycles for (a) woven sample W15 and (b) knitted sample K15. The dependence of thickness on the number of washing and drying cycles for (a) woven sample W15 and (b) knitted sample K15.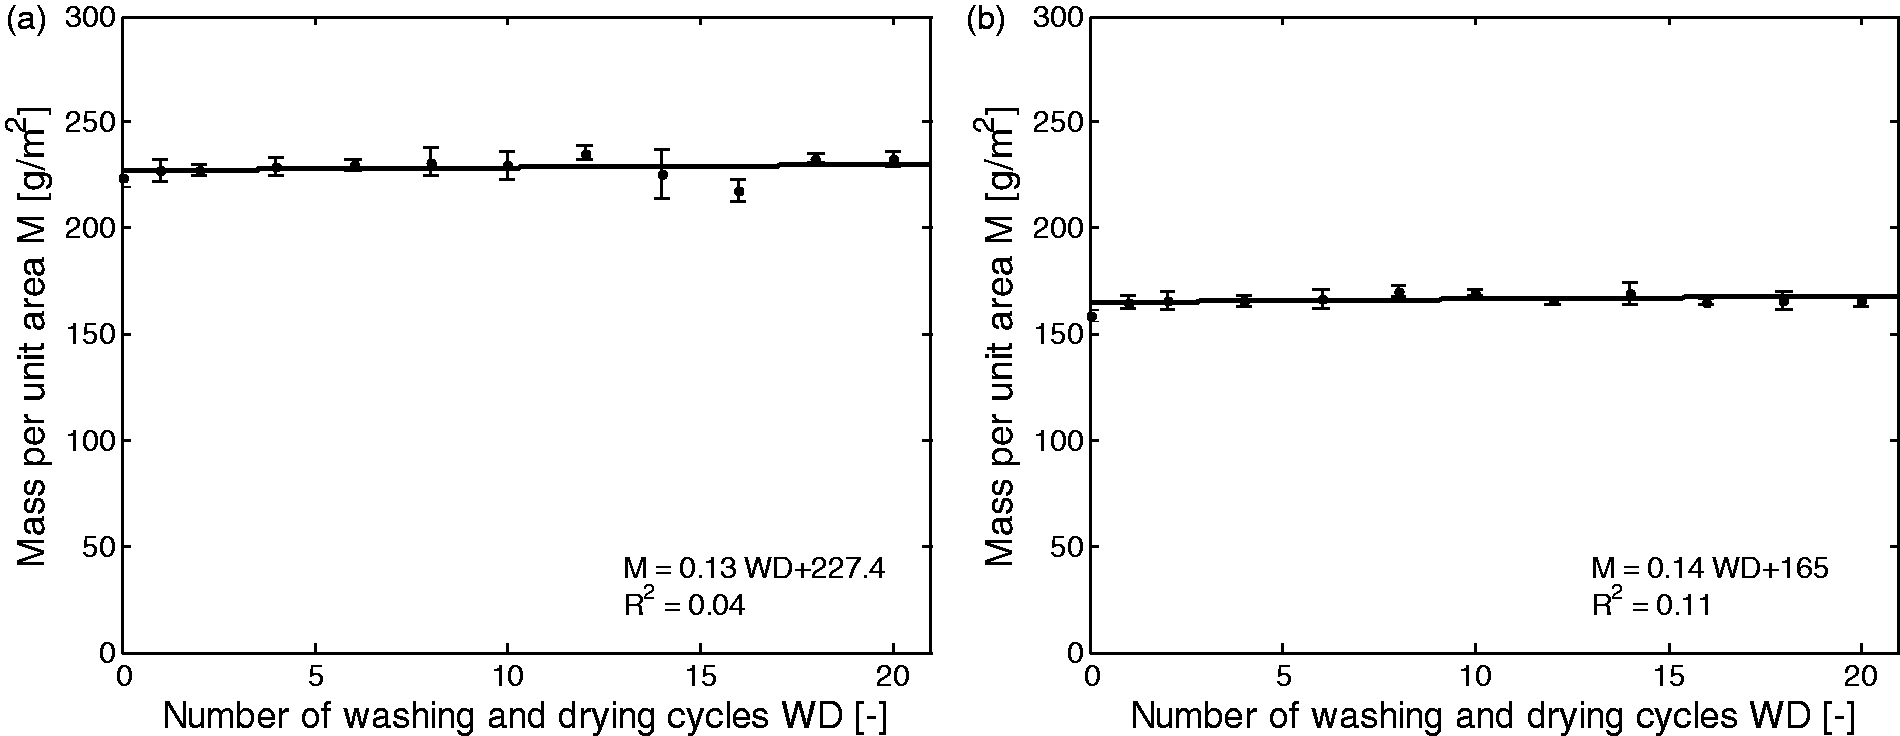

Effect of washing and drying on pilling
The intensity of pilling after the washing and drying cycle was evaluated by the objective method, based on 3D fabric surface reconstruction. The number of pills and the objective pilling grades were taken as the key factors for monitoring the pilling process during wet processing. Figures 12 and 13 display the dependence of the number of pills and estimated pilling grades on the number of washing cycles for both structures (woven, knitted). From Figures 12(a) and 13(a) it is obvious that the number of pills increases up to a certain number of washing cycles (about 12–14 cycles). After that the decrease and the increase of pill numbers is altered. It is given by a natural process of pilling – after a longer time, a fatigue of fibers appears due to long-lasting surface rubbing and pills start to fall out. It stands to reason that the knitted samples had a higher number of pills on the top of fabric surface compared to the woven sample at same number of wet processings, which is in agreement with theory stating that knitted fabrics are more prone to create pills than woven fabrics. This phenomenon is confirmed by Figures 12(b) and 13(b), where it can be seen that the knitted sample achieves a lower grade of pilling than the woven sample. According to analysis of microscopic images of samples, it can be summarized that the migration of cotton fibers from the supplement fabric to the test sample was not observed and pills on the surface of fabrics were created mostly of PP fibers.
Dependence of (a) number of pills and (b) pilling grade on the number of washing and drying cycles for woven sample W15. Dependence of (a) number of pills and (b) pilling grade on the number of washing and drying cycles for knitted sample K15.

Conclusion
Wet processing, including washing and drying, has always been an important stage during the wearing cycle. The main aim of this paper was to find out if washing/drying procedures can significantly change the fundamental properties of metal fiber-containing fabrics designed for the production of protective cloth. As functional properties, EM SE and electric conductivity were chosen. Moreover, changes in dimensional properties, including mass in per unit area, thickness, yarn densities and pilling of samples, evaluated by the objective method were studied. For the purpose of this study, fabrics with different structures (knitted, woven) containing extremely thin SS staple fibers incorporated to the yarn structure as conductive filler were chosen.
The results proved that the woven structures had higher EM shielding ability and also higher electrical conductivity than the knitted samples, both at the unwashed and the washed stages. The woven reference sample reached EM SE of about 32.5 dB for frequency 1500 MHz, whereas the knitted reference sample displayed lower SE (9.8 dB for frequency 1500 MHz). This phenomenon is caused by usage of coarse yarns, higher mass per unit area of the sample, higher absolute metal fiber content and the higher cover factor for woven samples compared to knitted ones.
The washing and drying process increased the surface and volume resistivity of samples and the changes were found to be statistically significant. After applying 20 cycles of maintenance, volume resistivity increased by 31% and 23% for woven and knitted samples, respectively, compared to reference (unwashed) samples. This means that changes in electrical properties were lower for the knitted structure. It was found that it is possible to describe the dependence of resistivity on the number of washing and drying cycles by the linear function.
Despite the relatively significant increase of resistivity, the samples did not totally lose their EM shielding ability. After applying 20 cycles of wet processing, EM SE at frequency 1.5 GHz dropped by 9.5% to 29.4 dB for the woven sample compared to reference (unwashed) samples. EM SE remained almost the same for the knitted sample at frequency 1.5 GHz after 20 cycles of washing/drying. Wet processing had a lower effect on the EM SE of knitted samples compared to woven ones (based on regression analysis and t-tests).
The following factors were found to be crucial when creating new conductive washing resistance fabrics compared to available conductive fabrics: (i) conductive material selection (SS generally does not corrode, rust or stain with water compared to other metals); (ii) type of conductive component selection (all-metal fibers prevent cracking of the conductive layer as in the case of metal-coated fibers or yarns during washing, extremely low fiber diameter decline bending rigidity of metal fibers and prevent fiber breaking in use as in the case of metal fibers with higher diameter, conductive fiber length similar to non-conductive fiber length helps to prepare compact yarns without fiber migration while using); (iii) yarn production technology (a single yarn with optimum twist level was prepared for knitted fabrics, a two-ply yarn combining two different twist directions and two different twist levels was prepared for woven fabrics, as twist generally helps to prevent fiber slippage due to helical configuration of fibers on the yarn surface); (iv) fabric construction (twill weave was chosen because it is stronger and more durable than the plain weave, plain jersey knit was chosen considering the possibility to produce comparatively lightweight fabrics than those produced by other stitches, and also optimal yarn density and number of stitches or loops per centimeter are important factors influencing the cover factor and volume porosity, which can also influence fiber migration out of the structure).
Evaluation of dimensional properties showed stable yarn, wale and course densities, and also the mass per unit of area of samples remained constant during applying wet processing. Thickness increased for both woven and knitted samples, which was probably caused by hairiness of yarns and pill creation. The results showed that the knitted sample is more prone to create pills than the woven sample. However even in the case of the knitted sample, pilling is not so considerable: the maximal pilling grade was 1–2 (the value appeared only in the case of the 16th washing cycle). The woven sample showed less prone and the maximal pilling grade was 2–3 (again, the maximal pilling grade appeared only in the case of the 16th washing cycle).
It can be concluded that both knitted and woven protective fabrics withstood satisfactorily repeated application of wet processing comprising washing and drying with respect to the main requirement – EM shielding ability. Although knitted fabrics embody lower changes of electrical resistivity and EM SE after wet processing, woven fabrics have higher electrical conductivity, higher SE and better visual properties after washing, because the production of pills is limited.
Footnotes
Acknowledgement
This paper is original and has not been presented or published until now.
Declaration of conflicting interests
The authors declared no potential conflicts of interest with respect to the research, authorship and/or publication of this article.
Funding
The authors disclosed receipt of the following financial support for the research, authorship, and/or publication of this article: This work was supported by the research project TIP-MPO VaV 2009 “Electromagnetic field protective textiles with improved comfort” of Czech Ministry of Industry.