
Abstract
Nanofiber has shown outstanding performance in many studies. Blending nanofibers into fibrous filter media is a promising way to improve the filtration performance. This paper discussed the modeling method for multi-fiber filter paper and the proper way to apply nanofiber into filter paper. Sixteen different filter papers were prepared and these filter papers covered the range of coarse-fiber-dominant and fine-fiber-dominant fibrous structure. The theoretical modeling method in this study for pressure drop and penetration of multi-fiber filter paper showed accurate results compared with the experiment data. It was found that for the higher quality factor, the nanofibers should be effectively separated by the coarse fibers. This study presented the idea of the fiber's effective contribution to filtration efficiency, which can lead to a comprehensive and distinct understanding of fibrous structure and filtration properties.
Air quality control is becoming unprecedentedly crucial in the fields where requirements of air cleanliness are becoming increasingly stringent. The food, biotechnology, pharmaceutical, semiconductor and micro-electronics industries and fields performing sensitive micromechanical work are among those industrial areas that demand air cleanliness as a prerequisite in everyday production. 1 Air filters have been used routinely for many years to protect products, process equipment and personnel from being adversely affected by airborne contaminants.2,3
Filter media is the key part of an air filter's performance. For a high-efficiency air filter, the most important property is filtration efficiency, on which product rating is based.
4
In the course of a filter's operational lifecycle, the operation cost is considerably affected by pressure drop. Lower pressure drop means less energy consumption for the air filtration system,5,6 which in return leads to lower operating cost and longer service life of the air filter. Thus, the goal of filter media design is how to lower the pressure drop while maintaining high filtration efficiency. The performance quality of filtration media is typically characterized by the quality factor,7,8 which is often termed Alpha in the industry and is calculated by equation (1)

There is a report 9 that explored the lifecycle cost (LCC) benefit of improving the quality factor from 12 to 14. In this example, if filter prices remain constant and maintenance and disposal costs were fixed, the improved energy consumption would result in a savings of approximately 8% over the lifecycle of the filter. Filtration can greatly be improved if higher quality factors can be obtained.
For improving the quality factor, nanofibers are used to manufacture the filter paper in real applications. Grafe et al. 10 reported that nanofibers provide marked increases in filtration efficiency at relatively small (and in some cases immeasurable) decreases in permeability. The current studies are mainly limited to nanofiber layer on the coarse substrate. Wang et al. 11 investigated the performance of filters with a single nanofiber layer on a substrate and showed that nanofiber filters have better filtration performance for particles larger than about 100 nm compared to conventional filters. Zhang et al., 12 Leung et al. 13 Przekop and Grado 14 and Podgorski et al. 15 also studied the filtration performance of filters with nanofibers coated on a substrate.
Blending nanofibers with coarse fibers is a promising way to manufacture high-performance filter media, since the coarse fiber can act as the separator for the nanofiber and make the fibrous structure more open. Payen et al. 16 studied the combination of coarse and fine fibers down to 10 microns and found an improvement in the filtration behavior compared to the equivalent unimodal diameter samples. This study focused on finer fibers. Since the fibrous filter paper is a complex system constituted by coarse and fine fibers, the advantages of nanofibers may not be fully achieved in the filter media. This study discussed the impact of coarse and fine fibers on the quality factor and how to take advantage of the nanofiber from the perspective of fibrous structure.
For multi-fiber filter paper incorporated with nanofibers, the prediction of pressure drop and penetration or filtration efficiency is very important for designing filter paper. Typically, the Darcy law was used to calculate the pressure drop, and single fiber theory was the classic method to calculate penetration or filtration efficiency of filter media. 17 The most important parameter in Darcy law and single fiber theory was fiber average diameter df. Currently, many theoretical modeling methods of pressure drop and penetration are confined to single fiber filter paper in order to facilitate the calculation of df. However, for multi-fiber filter paper, the coarse-fiber diameter can be 6 µm or more, while nanofiber can be merely a few hundred nanometers or less. A gap exists between these fibers, which made it very difficult to obtain an average fiber diameter. This study found a method to theoretically calculate the pressure drop and penetration or filtration efficiency of multi-fiber filter paper.
Experimental methods and single fiber theory
Fiber specification
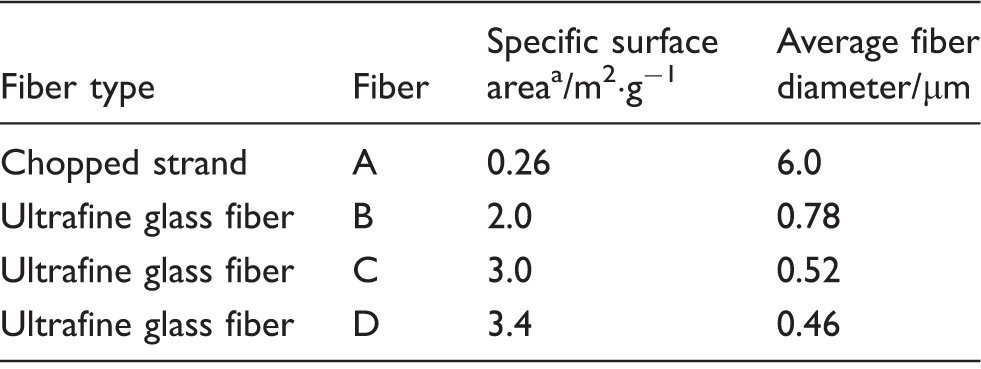
Four kinds of borosilicate glass fiber with different diameters were selected and the fiber parameters are shown in Table 1. The chopped strand glass fiber was E-glass with a uniform diameter. The surface of the chopped strand was treated to facilitate dispersion in water. Ultrafine glass fibers are the nanofibers used in this study. They were flame attenuated from commercial #475 glass with a polydisperse fiber diameter. The surface of ultrafine glass fibers was untreated but can be well-dispersed in the water. The shape of all the fibers was cylindrical (shown in Figure 1). The specific surface area was used to characterize the ultrafine glass fiber and calculate the equivalent average fiber diameter. The diameter of the ultrafine glass fiber was much smaller than the chopped strand and acted as the nanofiber in this study.
Cross-section of fiber A mixed with nanofibers. Specific surface area of selected fibers Tested by Beckman Coulter SA3100 surface area analyzer.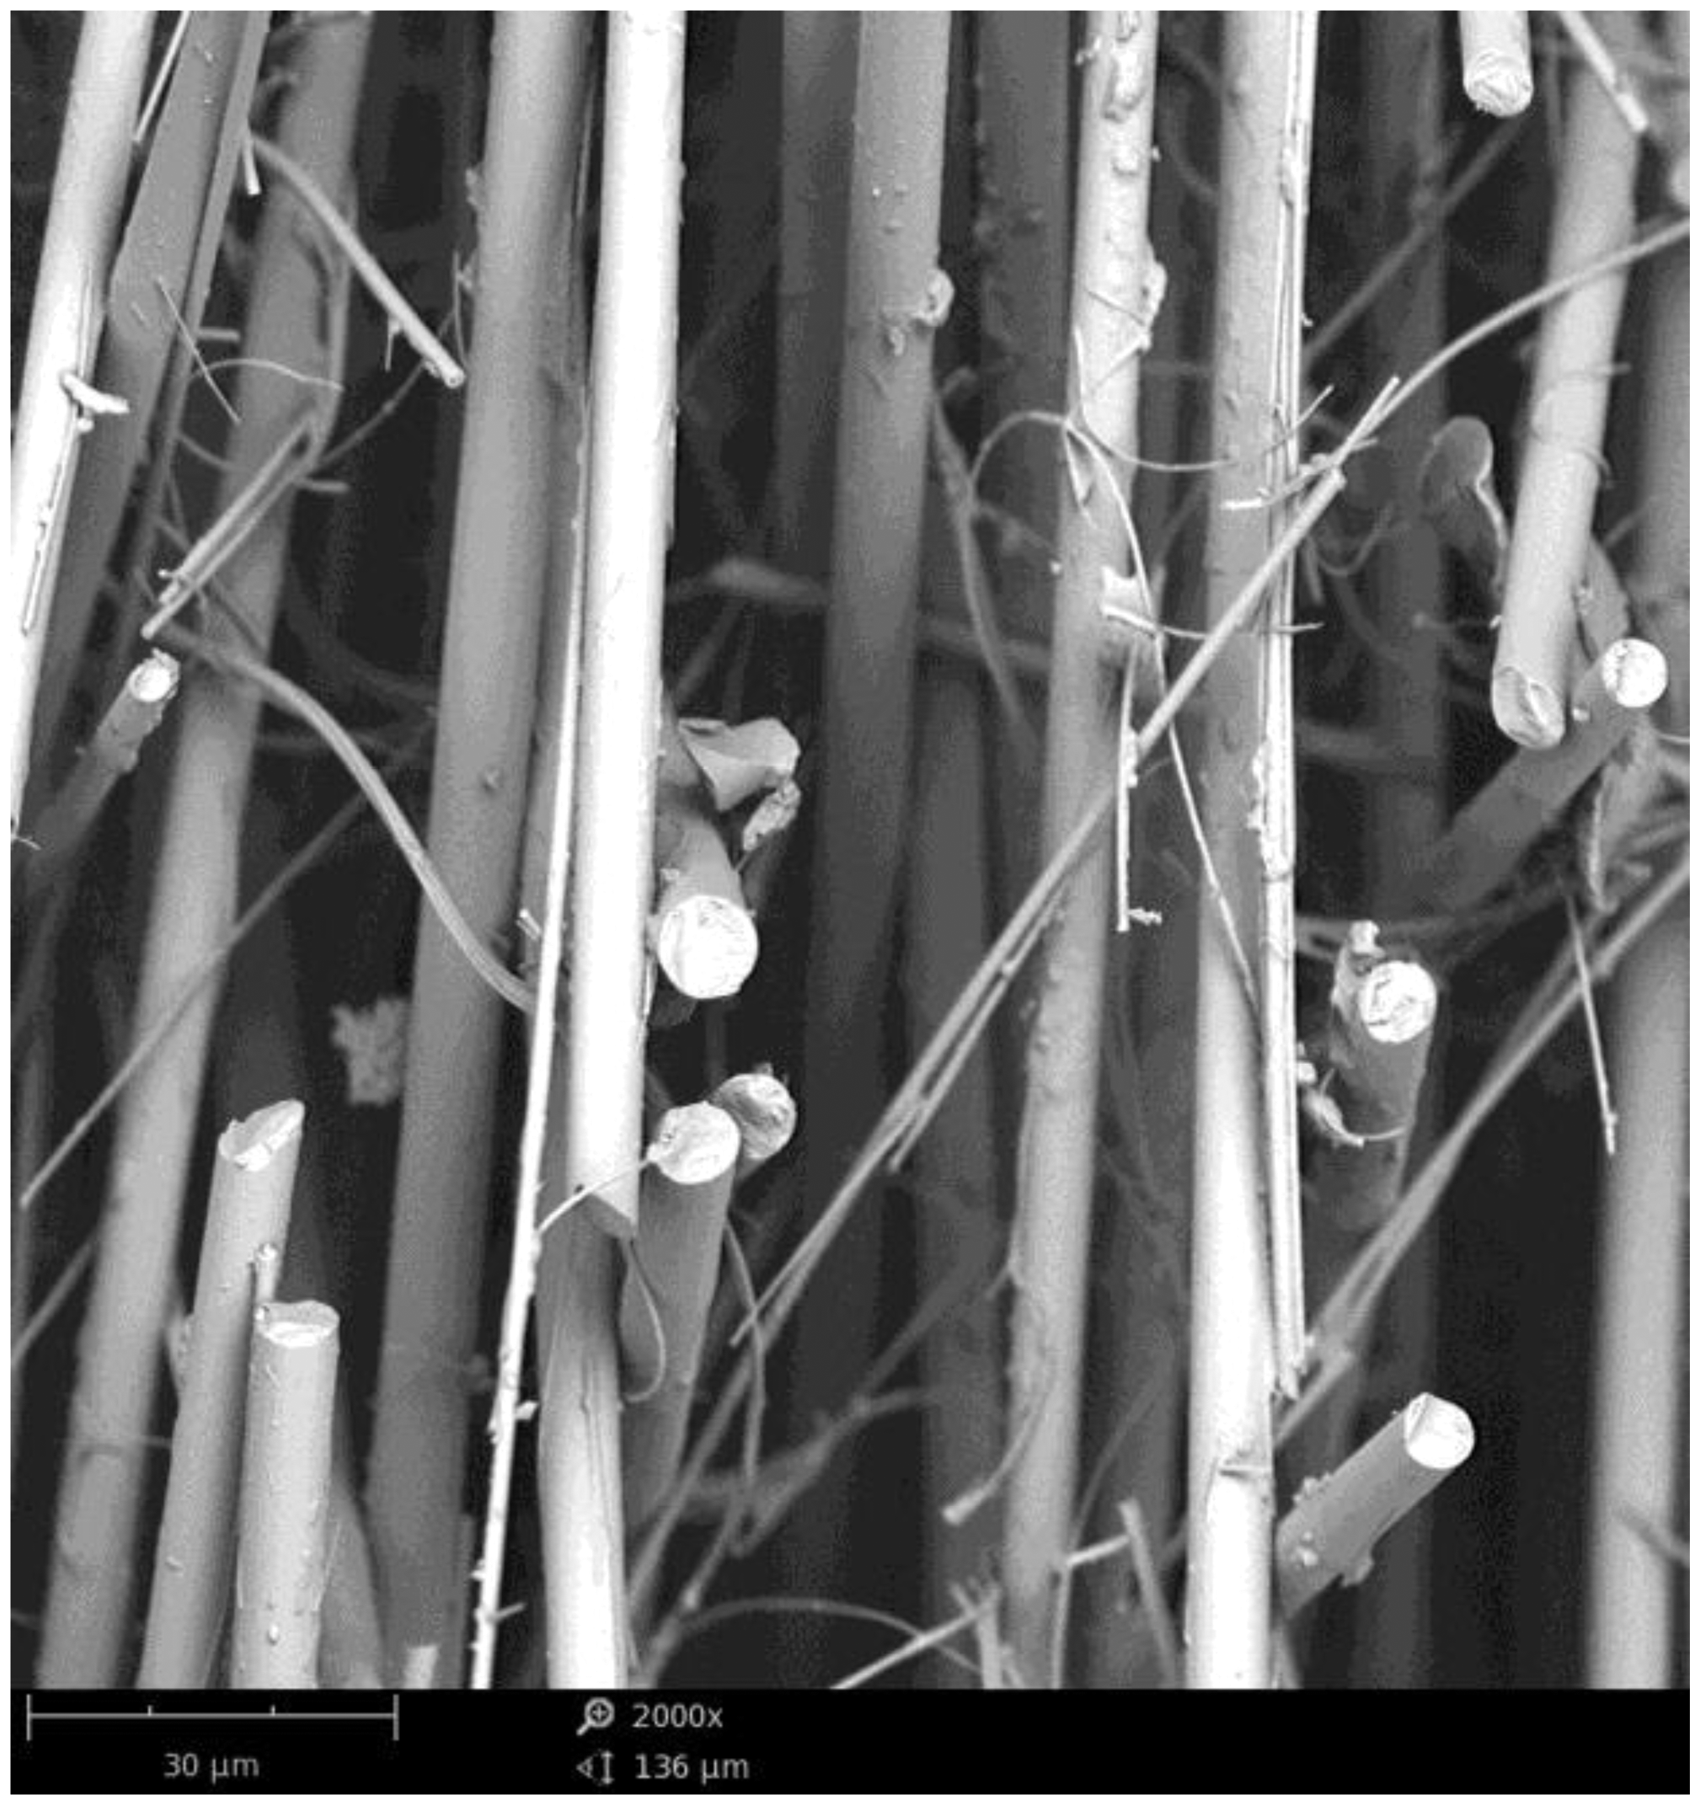
Filter paper preparation
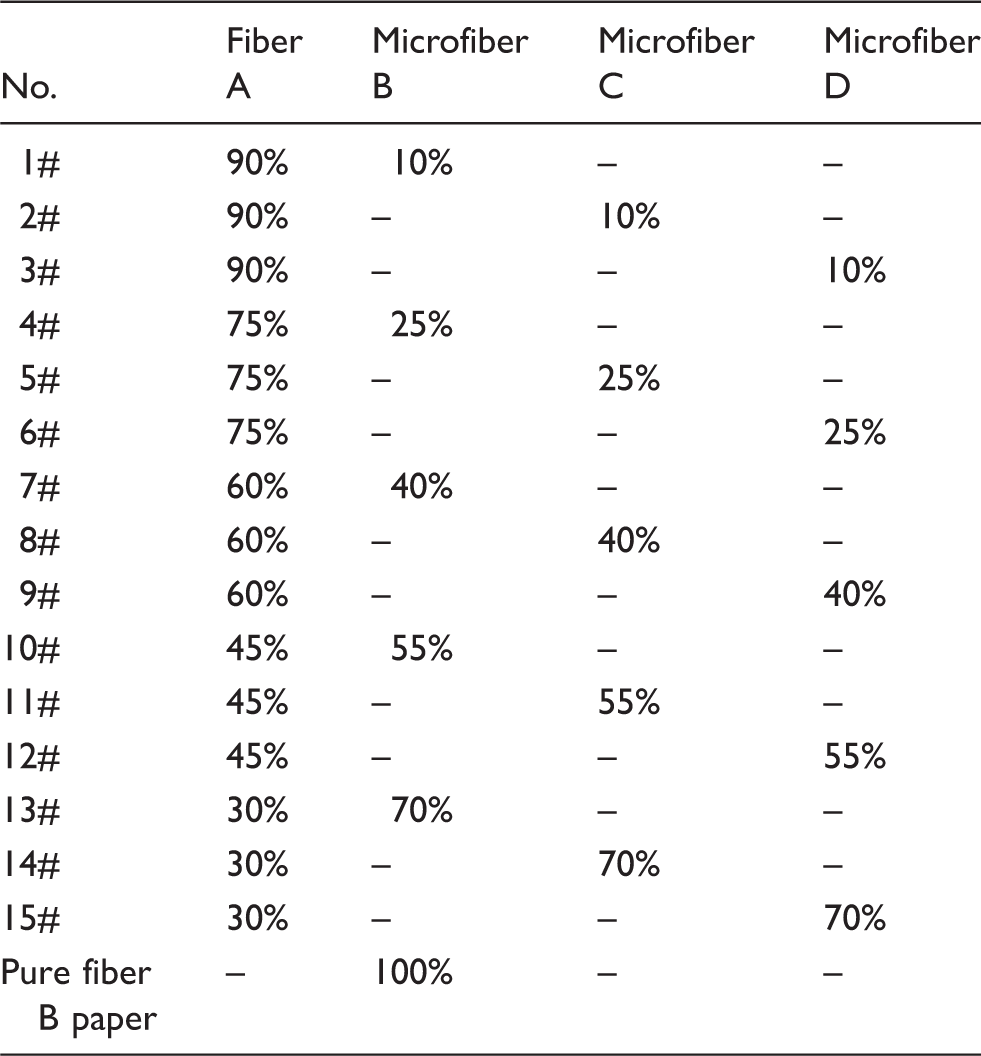
Chopped strand and ultrafine glass fiber were mixed together to prepare the filter paper. The glass fiber filter paper handsheet was prepared according to the procedures provided by ISO 5269-1:2005. 18 Different fibers were weighed by an electronic balance with 0.001 g accuracy. The fibers were then mixed with 2 L water and agitated in the standard fiber disperser under 3000 rpm for 200 seconds. The well-dispersed glass fiber suspension was transferred to the standard handsheet former. Five liters of water was added into the suspension to lower the fiber consistency and improve the handsheet formation. After drainage and formation, glass fibers were retained on the formation wire and thus a wet handsheet was formed. Finally, the wet handsheet was transferred to the dryer. During the whole preparation process, the addition of acid, for example, sulfuric acid, was necessary in order to keep the pH of fiber suspension in the range of 2.5–2.8. Acid is beneficial for dispersing glass fiber and keeping fibers from entangling. The basic weight target of filter papers 1#–15# was 60 ± 2 g/m2. The pure fiber B filter paper with a basic weight of 45 ± 2 g/m2, whose penetration could be measured using the current testing system, was prepared as comparison.
Weight percentage of fibers in the filter paper
Filtration performance test
The pressure drop and filtration efficiency were measured by automated filter testers (Model 8130, TSI Inc., Shoreview, MN, USA), as shown in Figure 2. In this study, NaCl solution with 2% mass concentration was used to generate solid particles for testing. The NaCl solution was atomized by clean and dry compressed air in an aerosol generator. The generated droplets flowed out and went to the impactor. The impactor removed large particles and made the particle size distribution narrower. Small droplets went to the mixing chamber, in which the droplets mixed with hot and highly ionized air. The water in the droplets evaporated due to the heat from the hot air. After the drying process, the particle surface may be charged due to the separation between NaCl and water molecules. The air after the neutralizer was ionized by high voltage and had a high concentration of both positive and negative ions. The dried particles were exposed to the ions in the mixing chamber and became Boltzmann Charge Equilibrium, which was near the charging state of particles in the ambient air. Then the solid NaCl particles prepared were ready for the filtration test. According to the specification of TSI Inc., the mass mean diameter of the generated NaCl particles is 0.26 µm with geometric standard deviation of less than 1.86. The particle concentration is 12–20 mg/m3. The minimum penetration that can be reliably tested is 0.001%.
Diagram of automated filter tester 8130.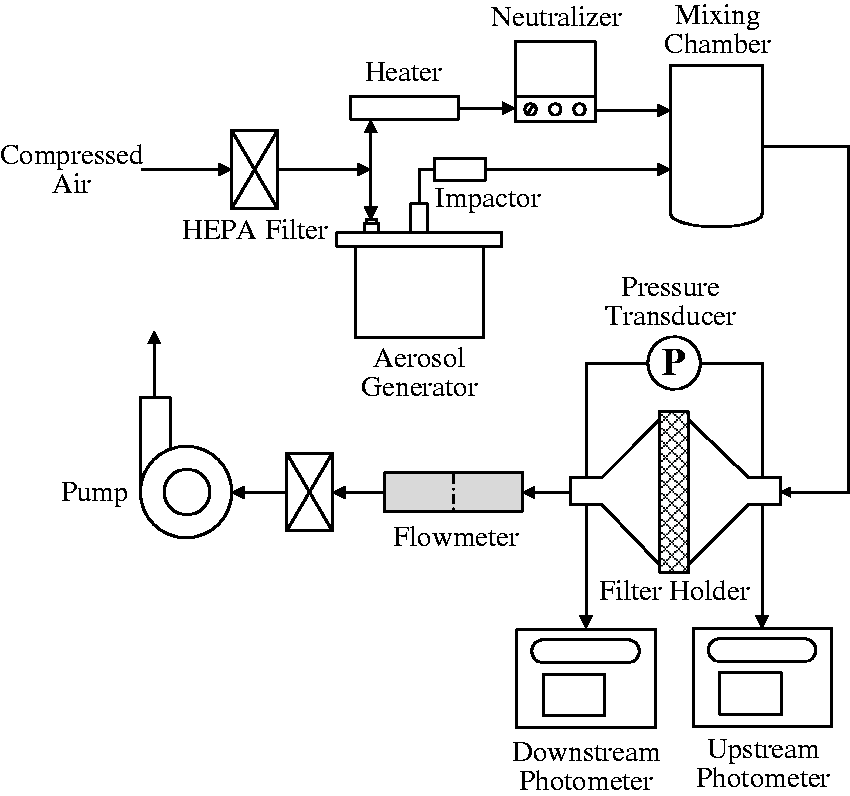
The filter papers were mounted in the filter holder with a test area of 100 cm2. The upstream and downstream of the filter holder were connected to a pressure transducer and two photometers. The pressure transducer displayed the pressure drop across the filter paper under a certain testing velocity. The photometer tested the overall particle concentration of the sampling air. The upstream and downstream concentrations were used to calculate the penetration or filtration efficiency. A flowmeter on the downstream was used to control the flow rate across the filter paper. The flow rate in this study was 32 L/min (the face velocity for the filter paper was 5.3 cm/s, which is most frequently used in this type of air filter).
Single fiber filtration theory
The theoretical particle penetration due to mechanical filtration mechanism, P, through the filter media was calculated using equation (2)
17


The ED, ER, EDR and EI values are calculated as20,21


Results and discussion
Pressure drop through filter paper and theoretical modeling
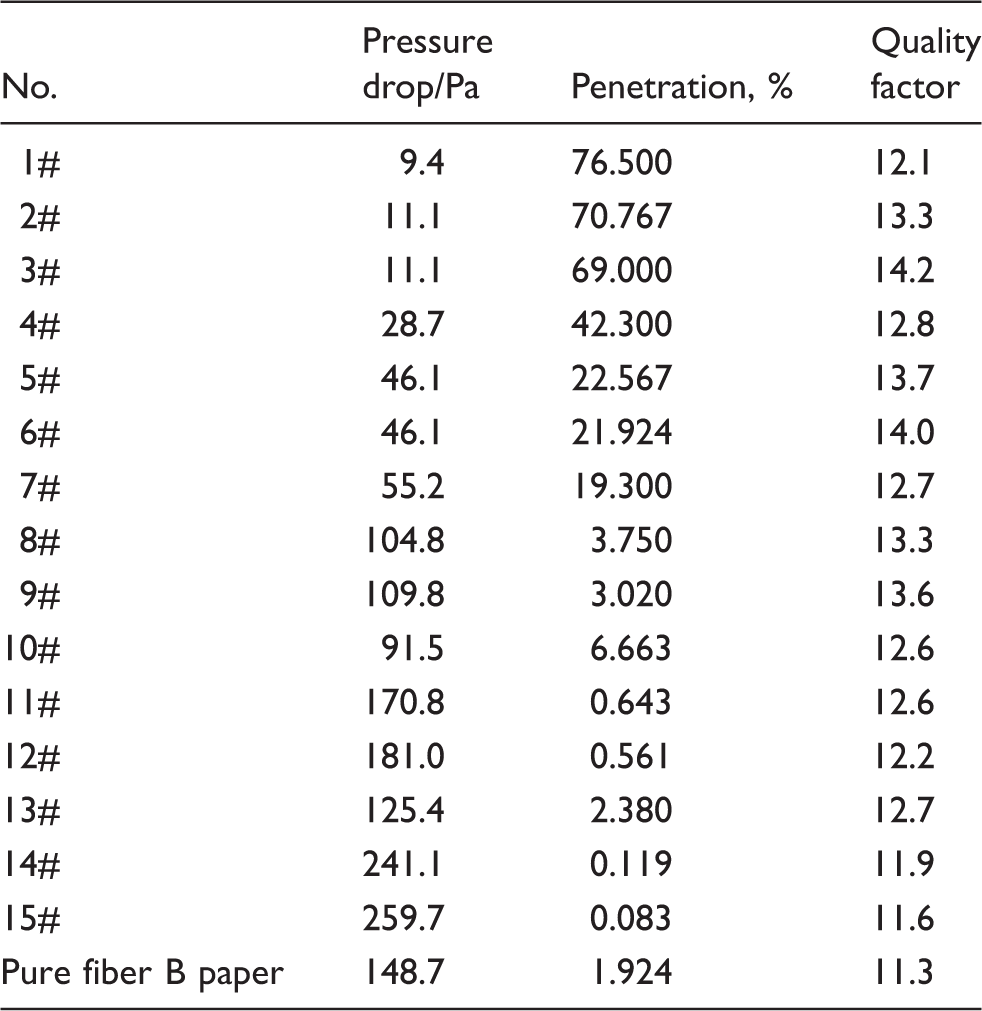
Filtration performance testing results
Since it is difficult to derive a reasonable average fiber diameter, the pressure drop was calculated in the perspective of fiber surface area from this study. For the porous filter paper, three types of pore exist: the closed-pore, blind-pore and through-pore. 22 The closed-pore and blind-pore can block the flow, while the through-pore can provide the flow path for fluid. 22 Under certain air pressure differences across the porous filter paper, the fluid flows through the through-pore. Despite the slip flow, the flow velocity adjacent to the surface of the through-pore is near zero.23,24 So, it is the surface of the through-pore that resists the flowing fluid. Pressure drop across the filter paper should be a function of the surface area of the through-pore.
Ultrafine glass fibers are stiff enough to sustain an open structure (as shown in Figure 3), so there are hardly any closed-pores or blind-pores in the fibrous filter paper. The surface area of the through-pore nearly equals the surface area of the fiber. In terms of pressure drop across the filter paper, it is quantitatively relevant to the fiber surface area.
Scanning electron microscope image of glass fiber filter media: (a) filter media #1; (b) filter media #3; (c) filter media #13; (d) filter media #15.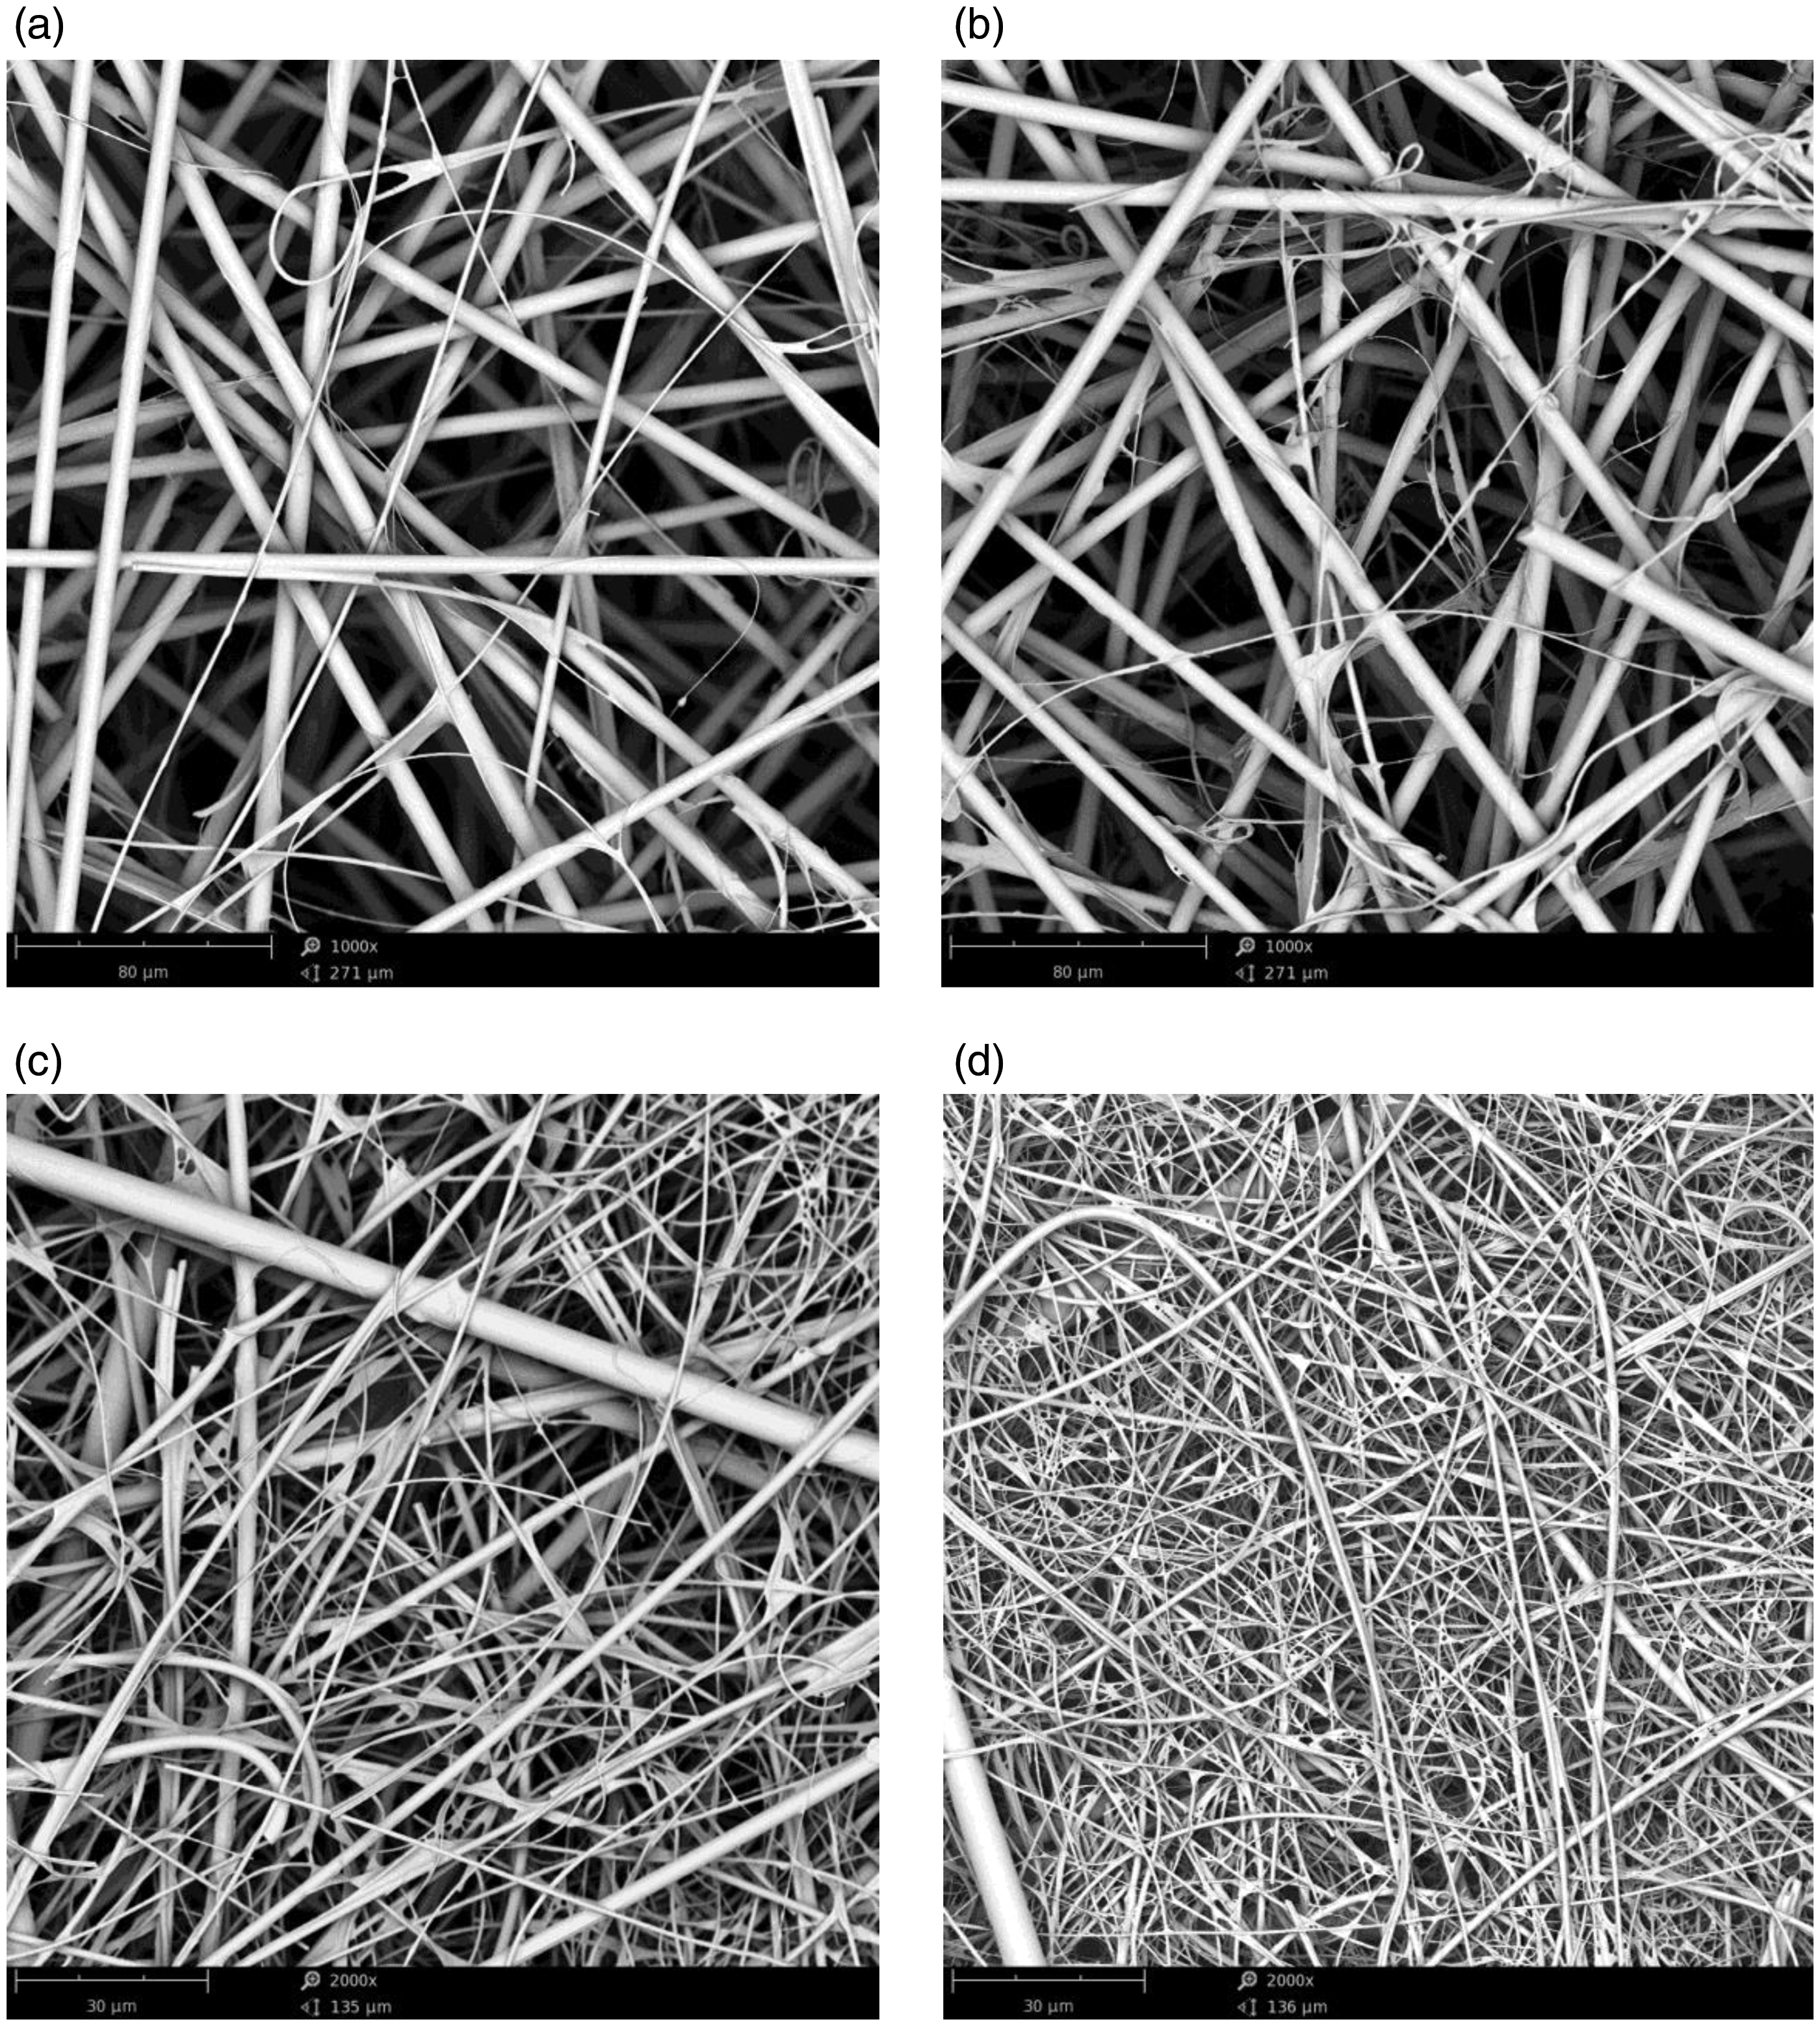
In the past, many studies have reported the relationship between the specific surface area of porous material and air permeability. In 1937, Carman used the Kozeny equation to calculate the specific surface area of powder via liquid permeability for the first time. In the 1950s, the liquid permeability method was replaced by the non-destructive air permeability test. The revised Kozeny–Carman equation is
25

If the specific surface area of each kind of fiber is known, the overall specific surface area S of the filter paper can be calculated using equation (15). Thus, the pressure drop of multi-fiber filter paper can be obtained by substituting S into the Kozeny–Carman equation

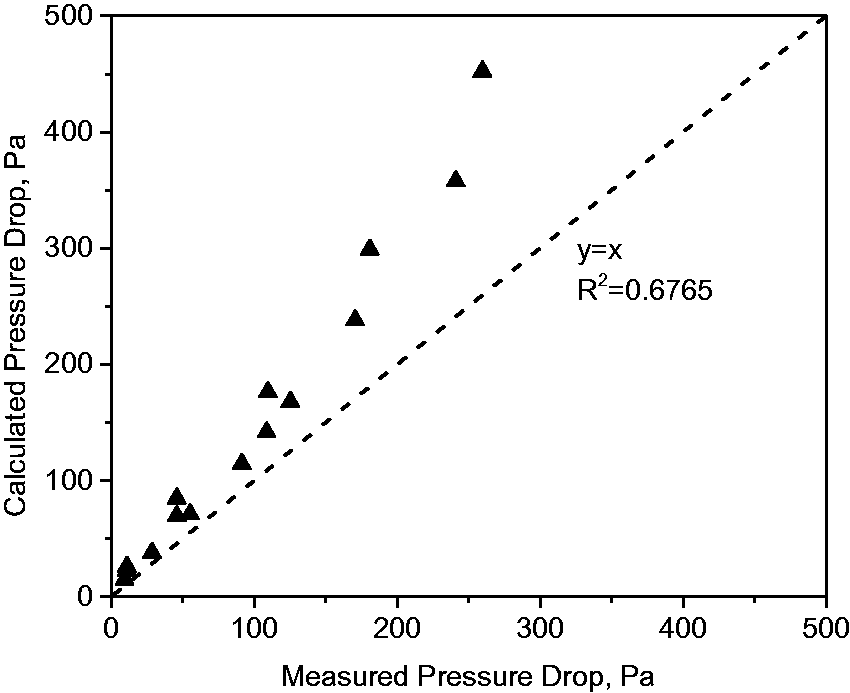
After theoretical calculation, the modeling and testing values were plotted and are shown in Figure 4. To evaluate the goodness of the model, the squared correlation coefficient R2 of the calculated and measured values using linear fit of slope = 1 and intercept = 0 was calculated. If the model was good, the data points should be close to the y = x dashed line in the figure and R2 should be close to 1. As shown in Figure 4, there is a discrepancy between the theory and experiment for high-pressure drop samples. Considering the slip flow for the ultrafine glass fiber, the slip flow correction factor was used in the following calculation. For multi-diameter fibers, the specific surface area for the pressure drop calculation was defined by equation (16) and substituted into equation (14)
Modeling and testing values of pressure drop.
After taking slip flow into consideration, the modeling and testing values can be seen in Figure 5. The theoretical modeling of pressure drop was very close to the test results with a squared correlation coefficient R2 = 0.9777. The squared correlation coefficient was very close to 1, which meant that the theoretical modeling method via equations (13), (14) and (16) was reliable.
Modeling and testing values of pressure drop using the method in this study.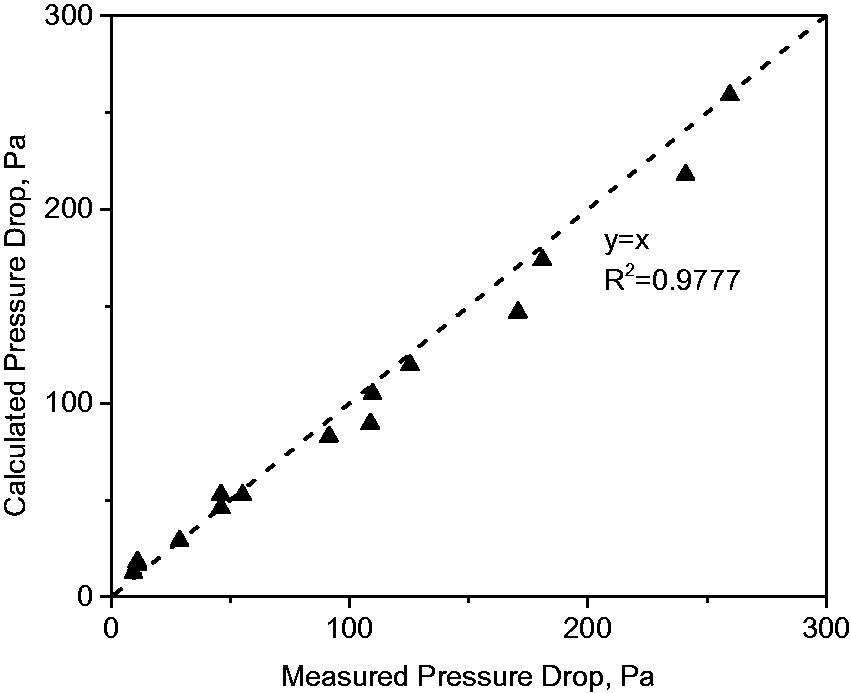
Penetration through filter paper and theoretical modeling
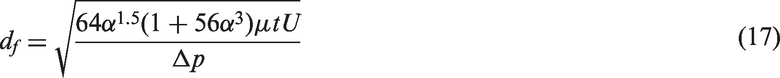
To theoretically calculate the penetration across the filter paper, the single fiber theory was used in this study. The effective fiber diameter was calculated by equation (17), which was from the Darcy pressure drop calculation17,19
The modeling and testing values are shown in Figure 6. There was a discrepancy for this calculation method. The effective fiber diameter given by equation (17) was not suitable for multi-diameter fibers. To obtain more reliable modeling results, a fiber diameter for the penetration calculation, dpen, was defined as the fiber diameter that can accurately calculate the penetration from the aforementioned single fiber theory.
Modeling of penetration by the single fiber theory and testing values.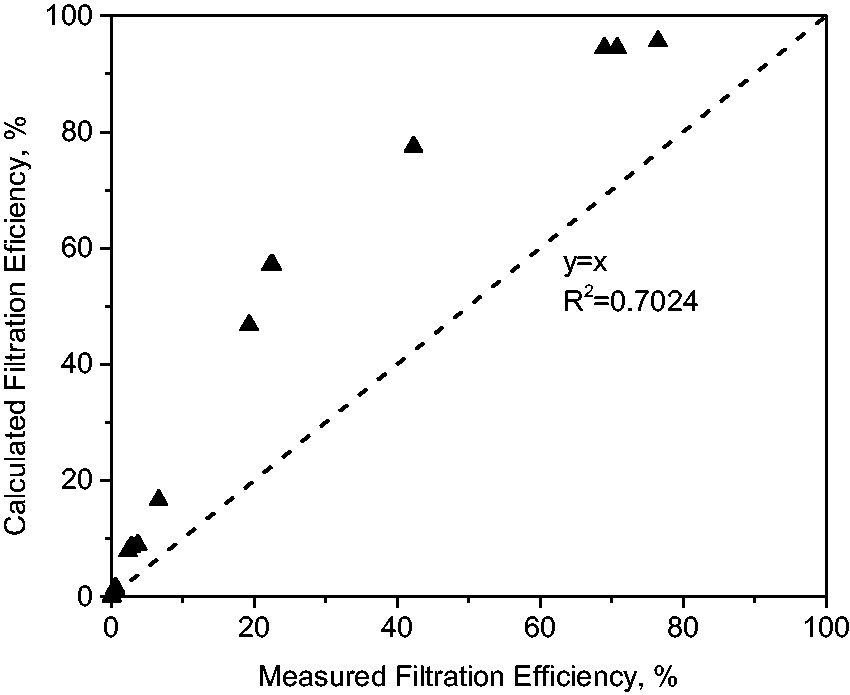
Here the fiber diameter for penetration dpen and fiber-specific surface area were correlated. The specific surface area for penetration calculation, Spen, is defined by equation (18):

It was found that lndpen and lnSpen were linearly correlated, as shown in Figure 7. Thus, the dpen can be calculated by equation (19)
Linear fitting of lndpen and lnSpen.
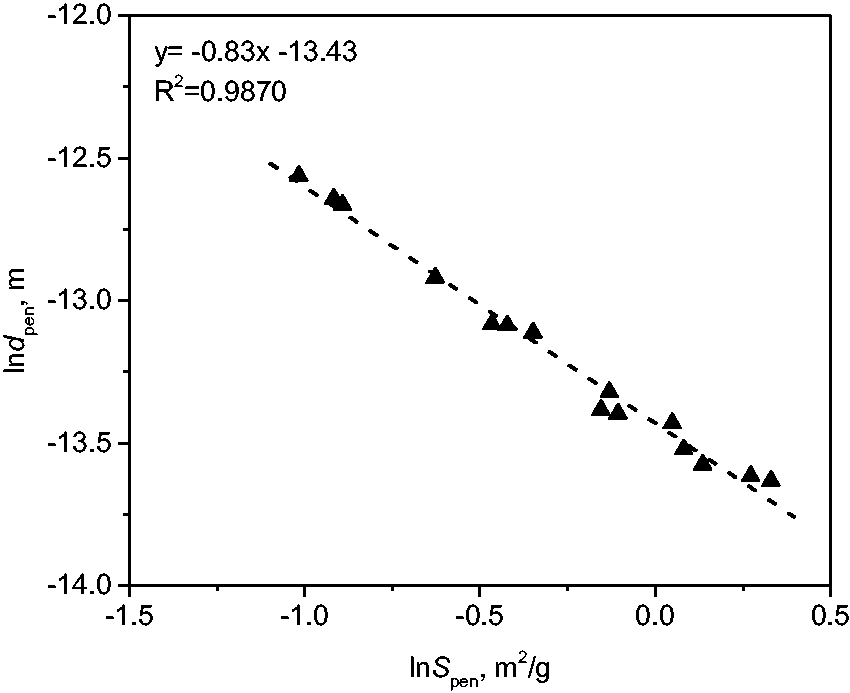
Based on equation (19), dpen was used as the effective fiber diameter in the single fiber theory to calculate the penetration of the filter paper. The modeling and testing values are shown in Figure 8. The theoretical modeling of penetration was very close to the test results, with squared correlation coefficient R2 = 0.9938. The squared correlation coefficient was very close to 1, which meant that the theoretical modeling method via equation (19) and the single fiber theory were reliable.
Modeling of penetration using specific surface area and the testing values.
Quality factor of filter paper and analysis
Quality factor was an indicator of the filtration performance. Finer fiber was generally believed to be beneficial to the quality factor. The results in this study indicated the proper way to use finer fiber.
As shown in Figure 9, the quality factor was affected by the fiber composition. When mass percentage of ultrafine glass fiber was under 40%, the nanofiber was beneficial for the quality factor. The finest fiber, ultrafine glass fiber D, resulted in the highest quality factor. The lower mass percentage of ultrafine glass fiber also slightly benefited the quality factor.
Quality factor of the filter paper under different fiber compositions.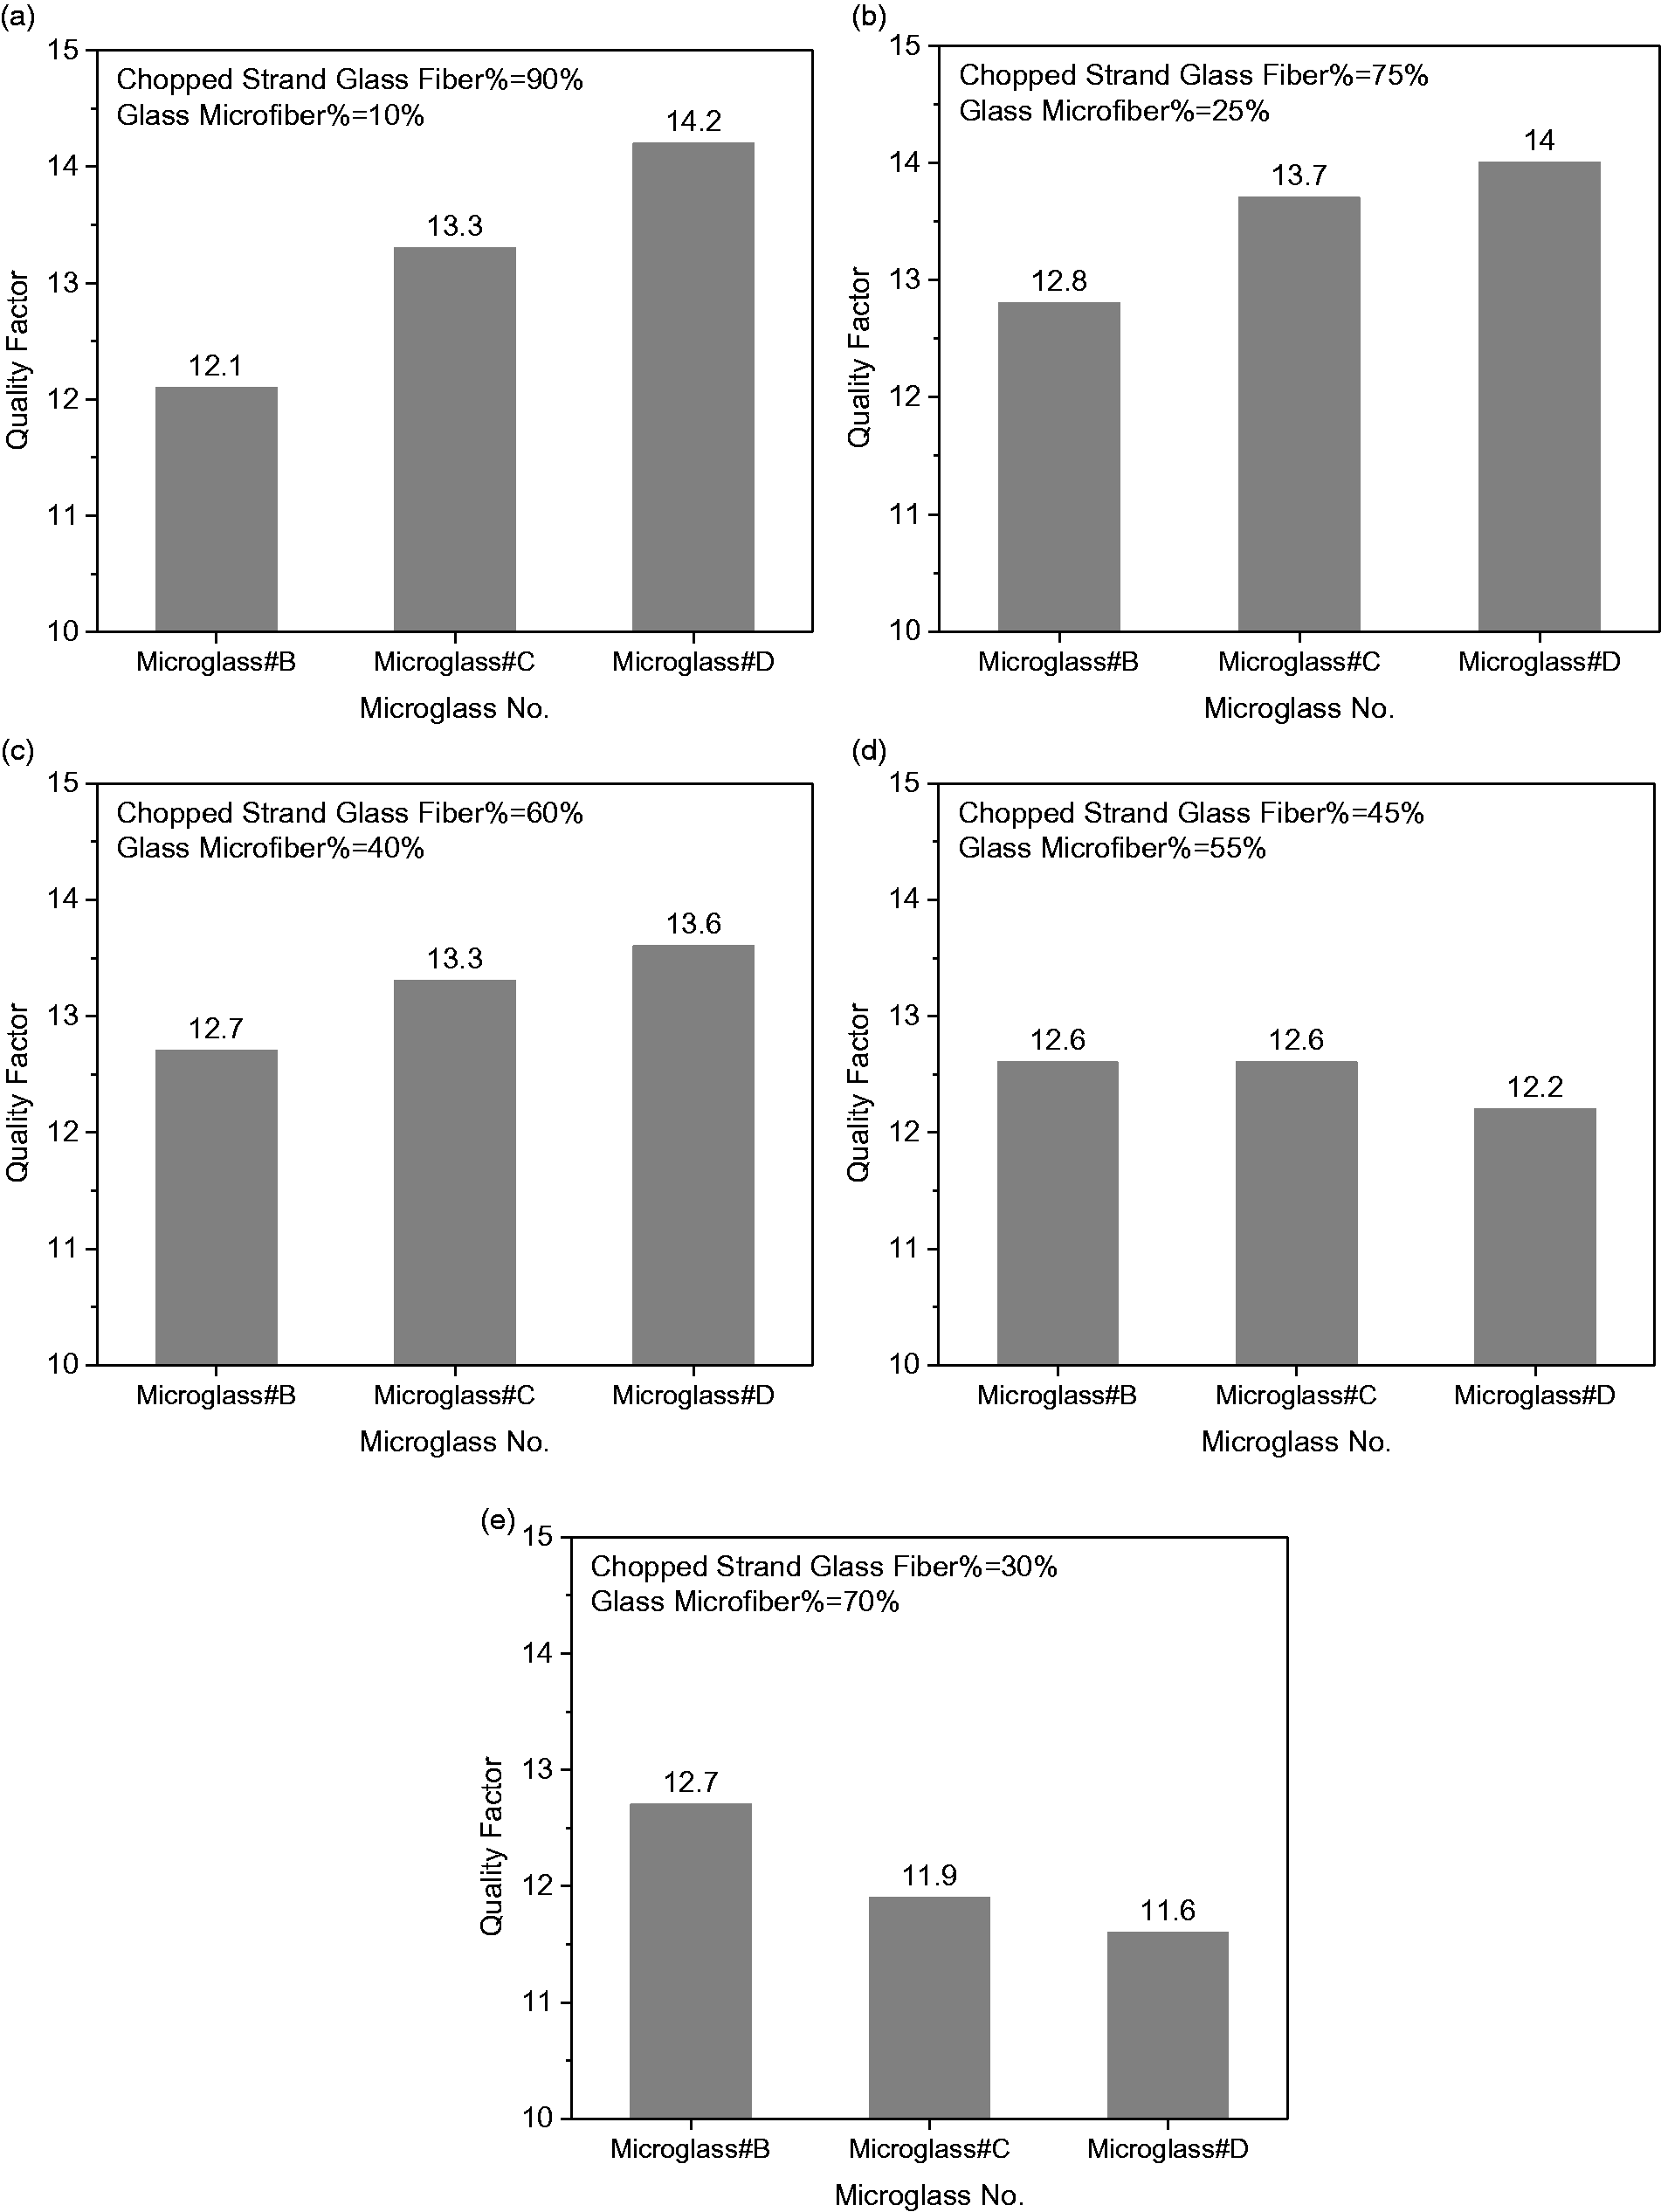
When the mass percentage of ultrafine glass fiber reached 55%, the fiber diameter barely affected the quality factor. The nanofiber cannot enhance the filtration performance in terms of quality factor. When the mass percentage of the ultrafine glass fiber was 70%, the coarser nanofiber, ultrafine glass fiber B, performed better than the finer fiber. At this point, finer nanofiber adversely influenced the quality factor. As a comparison, the quality factor of pure fiber B filter media was lower than all the other 15 filter papers.
The quality factor results could be explained in term of fibrous microstructure. Filter paper was considered as many parallel thin layers of fibers along the depth of the filter media. As shown in Figure 10, the thickness of each thin layer was assumed as t0. Due to the filtration effect of layer i − 1, the particle concentration reduced from Ni−1 to Ni. The particle concentration reaching layer i was not uniform. The areas behind the fibers of layer i − 1 had lower particle concentration, since the fibers had already captured a certain number of particles. The areas behind the pores of layer i − 1 had higher particle concentration. This meant a different fiber in layer i could have a different particle concentration. If the concerned fiber was facing a higher concentration of particles than the average concentration reaching layer i, this fiber's ability to capture particles can be highly fulfilled. To the contrary, a lower particle concentration than the average concentration reaching layer i meant that the fiber's ability to arrest particles was limited, even if this fiber was very fine and possessed outstanding single fiber filtration efficiency.
Parallel thin layers of fibers in the filter paper.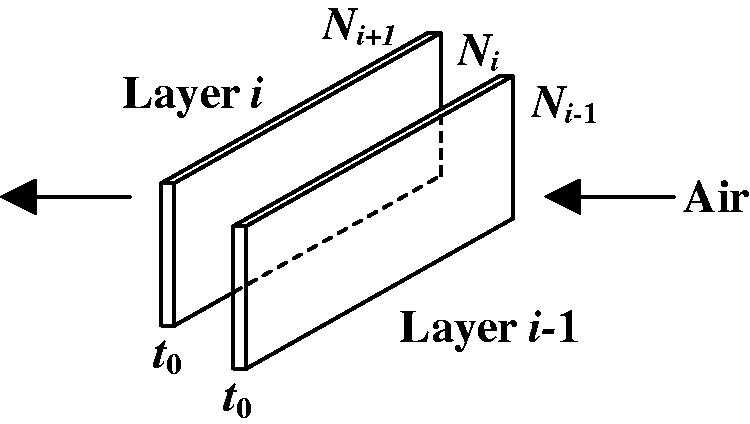
Based on those analyses, the fiber's effective contribution to filtration efficiency ef was defined as the particle concentration reaching fiber A, NA,i, compared to the average concentration reaching layer i, Ni, as shown in equation (20). Longer distance and larger angle of adjacent fibers in the neighboring fiber layers can benefit the ef

For a lower content of nanofiber, for example, less than 40% in this study, the nanofibers were sparsely separated by the coarse fibers. The distance between two nanofibers was longer. The possibility for two adjacent nanofibers in neighboring fiber layers to be near parallel was lower. For this kind of paper structure, the nanofibers were less likely to be interfered with by others, which meant the possibility for nanofibers facing equal or even higher concentrations of particles than the average concentration reaching the fiber layer is higher. The filtration ability of the nanofiber is more likely to be fully made use of. The fiber's effective contribution of filtration efficiency ef increased and the quality factor of the filter paper can take advantage of the nanofiber.
For a higher content of nanofiber, for example, higher than 40% in this study, the nanofibers were packed intensively. The distance between two nanofibers was shorter. Two adjacent nanofibers in neighboring fiber layers may easily be near parallel. The nanofiber failed to cut the fibrous structure effectively. For this kind of paper structure, it leaves little room for high ef, so the quality factor of the filter paper failed to take advantage of the nanofiber.
Nanofiber with high ef in the filter paper structure was essential in promoting filtration performance. For a higher quality factor, the nanofibers should be effectively separated by the coarse fibers.
Conclusion
This study discussed filter paper prepared by blending coarse fiber and nanofiber. Sixteen different kinds of glass fiber filter paper were prepared and those filter papers covered the range of coarse-fiber-dominant and fine-fiber-dominant fibrous structures. The pressure drop and penetration were measured by automated filter testers, and the quality factor was calculated for further analysis.
To model the pressure drop of multi-fiber filter paper, the Kozeny–Carman equation was used. For multi-diameter fibers, the specific surface area for pressure drop calculation was proposed by taking slip flow into consideration. The theoretical modeling of pressure drop was very close to the test results, with squared correlation coefficient R2 = 0.9777.
To model the penetration of multi-fiber filter paper, the fiber diameter for the penetration calculation was defined and correlated with the fiber-specific surface area. A method to calculate the fiber diameter for the penetration calculation was derived from experimental data. The theoretical modeling of penetration is very close to the test results, with squared correlation coefficient R2 = 0.9938.
It was found that the quality factor was affected by the fiber composition. When the mass percentage was under 40%, the finer nanofiber was beneficial for the quality factor. When the mass percentage reached 50%, the fiber diameter of the nanofiber barely affected the quality factor. When the mass percentage was 70%, the coarser nanofiber performed better than the finer fiber. A concept called fiber effective contribution of filtration efficiency was defined and used to explain the results. For a higher quality factor, the nanofibers should be effectively separated by the coarse fibers.
Footnotes
Acknowledgements
The authors are grateful for the support of members of the Center for Filtration Research: 3M Corporation; A.O.Smith Corporation; BASF Corporation; Boeing Commercial Airplanes; Cummins Filtration Inc.; Donaldson Company, Inc.; Entegris, Inc.; Ford Research & Innovation Center; W. L. Gore & Associates, Inc.; H.B. Fuller Company; MANN + HUMMEL GMBH; MSP Corporation; Samsung Electronics Co., Ltd; Xinxiang Shengda Filtration Technique Co. Ltd; Shigematsu Works Co., Ltd; TSI Inc.; Guangxi Watyuan Filtration System Co., Ltd; and the affiliate member of the National Institute for Occupational Safety and Health (NIOSH).
Declaration of conflicting interests
The authors declared no potential conflicts of interest with respect to the research, authorship and/or publication of this article.
Funding
The authors disclosed receipt of the following financial support for the research, authorship, and/or publication of this article: This work was supported by the Oversea Study of Guangzhou Elite Project (GEP), with approval number SuiJing [2014] 7.