
Abstract
In this study, –NH2 groups were introduced to a poly(ethylene terephthalate) (PET) fabric to make the fabric hydrophilic and, then, soybean protein was bonded on the surface of the modified PET fabric to obtain a soybean protein/PET composite fabric. The –NH2 groups allowed the soybean protein to be firmly bonded on the surface of the modified PET fabric. Scanning electron microscopy images showed that the surface of each modified PET fiber had a small number of grooves and that there was a thin film on each soybean protein/PET fiber. Attenuated total reflectance Fourier transform infrared spectra demonstrated that the nitrated and reduced PET fibers were introduced –NH2 groups and that there were –CO–NH– groups on the surface of soybean protein/PET fibers. X-ray photoelectron spectroscopy analyses showed that there was a nitrogen element on the modified PET fibers. The X-ray diffraction patterns suggested that the crystal structures of the modified fibers did not change significantly during the modification processes. The thermogravimetry results showed that the thermal stability of soybean protein/PET fiber kept well. The wearability tests indicated that the breaking strength and elasticity of the original fabric were well retained by the modified fabrics. The soybean protein/PET fabric had good levels of hydrophilicity and softness when the binding rate was below 3.0%.
Poly(ethylene terephthalate) (PET) has outstanding wearability properties because it has an excellent anti-wrinkle property, very good dimensional stability, and good wash and wear properties. However, PET clothing makes the wearer uncomfortable because PET has poor hydrophilicity, bio-inertness, 1 and low moisture regain. Soybean protein is a natural material with a good biocompatibility2,3 that has already attracted extensive attention and has been used in the manufacturing of soybean protein fiber. This fiber has been assessed as a healthy and environmentally friendly textile fiber, since it is biodegradable and can go back to the earth. 4 However, the soybean protein fabric had a poor anti-wrinkle property and poor dimensional stability. 5 Therefore, the soybean protein/PET composite fabric is expected to be a highly functional composite fabric that has good biocompatibility and an excellent mechanical property.
Some literatures reported that the biocompatibilities of PET fabrics and membranes were improved by binding various proteins onto the PET with a cross-linking agent.1,2,6 However, protein cannot be bonded on PET fibers directly with cross-linking agents because they have almost no reactive groups for protein or cross-linking agents to react. It is therefore necessary to introduce reactive groups to PET fibers first. Considerable research has been performed into modifying PET fibers to make them hydrophilic and to introduce reactive groups. Methods that have been developed to achieve these aims have included various plasma treatments,7–10 photochemical reactions, 11 semi-inlaying PET with a sucrose ester, 12 enzyme treatments,13,14 alkali deweighting, 15 ultraviolet irradiation,16,17 potassium permanganate oxidation,18,19 aminolysis surface modification,20–23 and so on.
In this study, a novel method of nitration and reduction for the PET fabric modification was invented to introduce reactive –NH2 groups onto the surface of PET fabric, and improve the hydrophilicity of PET fabric. Compared with the aminolysis method, 23 the nitration and reduction method did not break the PET macro molecule and the mechanical property was retained well. Then, the soybean protein could be bonded firmly onto the surface of nitrated and reduced PET (NR PET) fabrics with a cross-linking agent to prepare soybean protein/PET composite fabrics, which still have good mechanical property.
Experimental details
Materials
The PET fabric (27.0 tex × 22.2 tex/480 × 320, 210 g/m2) and soybeans were purchased from Yonghui Market in Beibei Chongqing, China. Sodium dodecyl sulfonate, sodium carbonate, sodium sulfide, sodium hydroxide, cyclohexane, epoxy chloropropane, tetrabutylammonium bromide, nitric acid with 65–68% concentration (w/w), and sucrose were purchased from Chengdu Kelong (China). All chemicals (AR) were used without further purification.
Nitration and reduction of poly(ethylene terephthalate)
The PET fabric was immersed in a 15.1 g/L nitric acid solution (prepared from concentrated nitric acid) for 20 min. After being immersed, the PET fabric was taken out with a liquid rate of 100%. This wet fabric was cured at 70℃ in a drying oven for 20 min to nitrify the PET fabric. The nitrated PET fabric was then washed and reduced by immersing it in a 25 g/L solution of sodium sulfide at 98℃ for 30 min. Finally, the NR PET fabric was washed with deionized water and dried at 110℃. The chemical reactions are shown in Schemes 1 and 2.
The 15.1 g/L dilute nitric acid almost had no ability to nitrify the PET fabric, but the gradual evaporation of the water during the curing process caused the nitric acid concentration to gradually increase enough to nitrify the PET macro molecules efficiently. The nitro groups were then reduced to amino groups by the sodium sulfide. These –NH2 groups made the PET surface reactive and hydrophilic.
Preparation of the sucrose glycidyl ether cross-linking agent
The sucrose glycidyl ether cross-linking agent was synthesized in an Erlenmeyer flask. Sucrose (20.0 g, precisely weighed) and tetrabutylammonium bromide (0.1 g) were added to the Erlenmeyer flask containing deionized water (190 mL) in a thermostated water bath, and the mixture was mixed with a moderate agitation. Epoxy chloropropane (30 mL) was added to the mixture dropwise (at a rate of 5 mL/min), and then NaOH (11 g) was added gradually. The water bath temperature was 40℃ and the reaction time was 4 h. The cross-linking agent solution was at around pH 9 at the end of the procedure. Scheme 3 shows the synthesis reaction of the sucrose glycidyl ether cross-linking agent.
Preparation of the soybean protein solution
Dried soybeans were ground to powder and then soaked in cyclohexane (the solid–liquid ratio was 1:1) at 40℃ for 2 h to remove the soybean oil. The mixture was then filtered and the solid residue was mixed with water again. This mixture was filtered and the liquid was retained and used as the soybean protein solution in the procedures described below. The soybean protein solution was adjusted to pH 8–9 by adding 0.5% (w/w) NaOH(aq). 24
Binding soybean protein onto the NR PET
All samples were dried in a drying oven at 110℃ for 30 min before weighing.
The NR PET fabric was cut into 20 cm × 15 cm strips, and each strip was immersed in a mixed solution of the soybean protein and the cross-linking agent for 10 min at room temperature. Then each sample was padded through two dips and two nips to reach an average wet pickup of 100%. The strips were dried at 60℃ for 30 min in a drying oven and then cured at 110℃ for 30 min. Finally, the samples were washed in 1% (w/w) Na2CO3(aq) for 30 min at 60℃ and then dried at 110℃. The soybean protein binding rate was calculated using equation (1)

where W0 is the original weight of the NR PET fabric (g) and W1 is the weight of the soybean protein/PET composite fabric (g). The synthesis reaction of the sucrose glycidyl ether cross-linking agent.
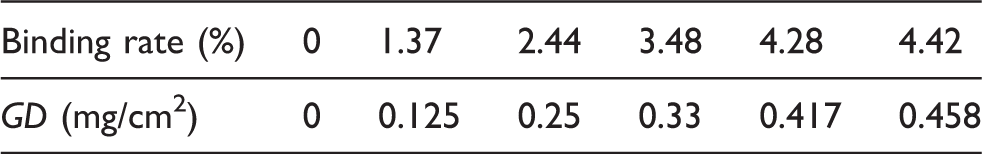
Different soybean protein solution concentrations ranging from 10 to 50 g/L were used (the soybean protein/cross-linking agent ratio by mass was always 5:1) to prepare soybean protein/PET composite fabrics with different binding rates. The density of the surface binding was calculated using equation (2)
where GD is the binding density, W0 is the original weight of NR PET fabric (mg), W1 is the weight of the soybean protein/PET composite fabric (mg), and S is the area of the sample (cm2).
Washing durability of the bonded soybean protein on the PET fabric
The soybean protein/PET composite fabric was washed in a washing solution containing 1 g/L sodium dodecyl sulfonate and 2 g/L Na2CO3 at 40℃ with a bath rate of 1:100 for 30 min
11
following the AATCC test method 61-2006 using an SW-12 type color fastness test machine (Wuxi Textile Instruments Factory Co., Ltd, China). The composite fabric was then repeatedly washed in the washing solution to test the durability of the soybean protein on the PET fabric surface. Three repeated tests were made to get a reliable mean value. The protein retention rate during washing was calculated using equation (3)
where R is the washed protein retention rate, W0 is the original weight of the NR PET fabric (g), W1 is the weight of the soybean protein/PET composite fabric (g), and W2 is the weight of the washed soybean protein/PET composite fabric (g).
The reaction of binding soybean protein onto the nitrated and reduced poly(ethylene terephthalate) (NR PET).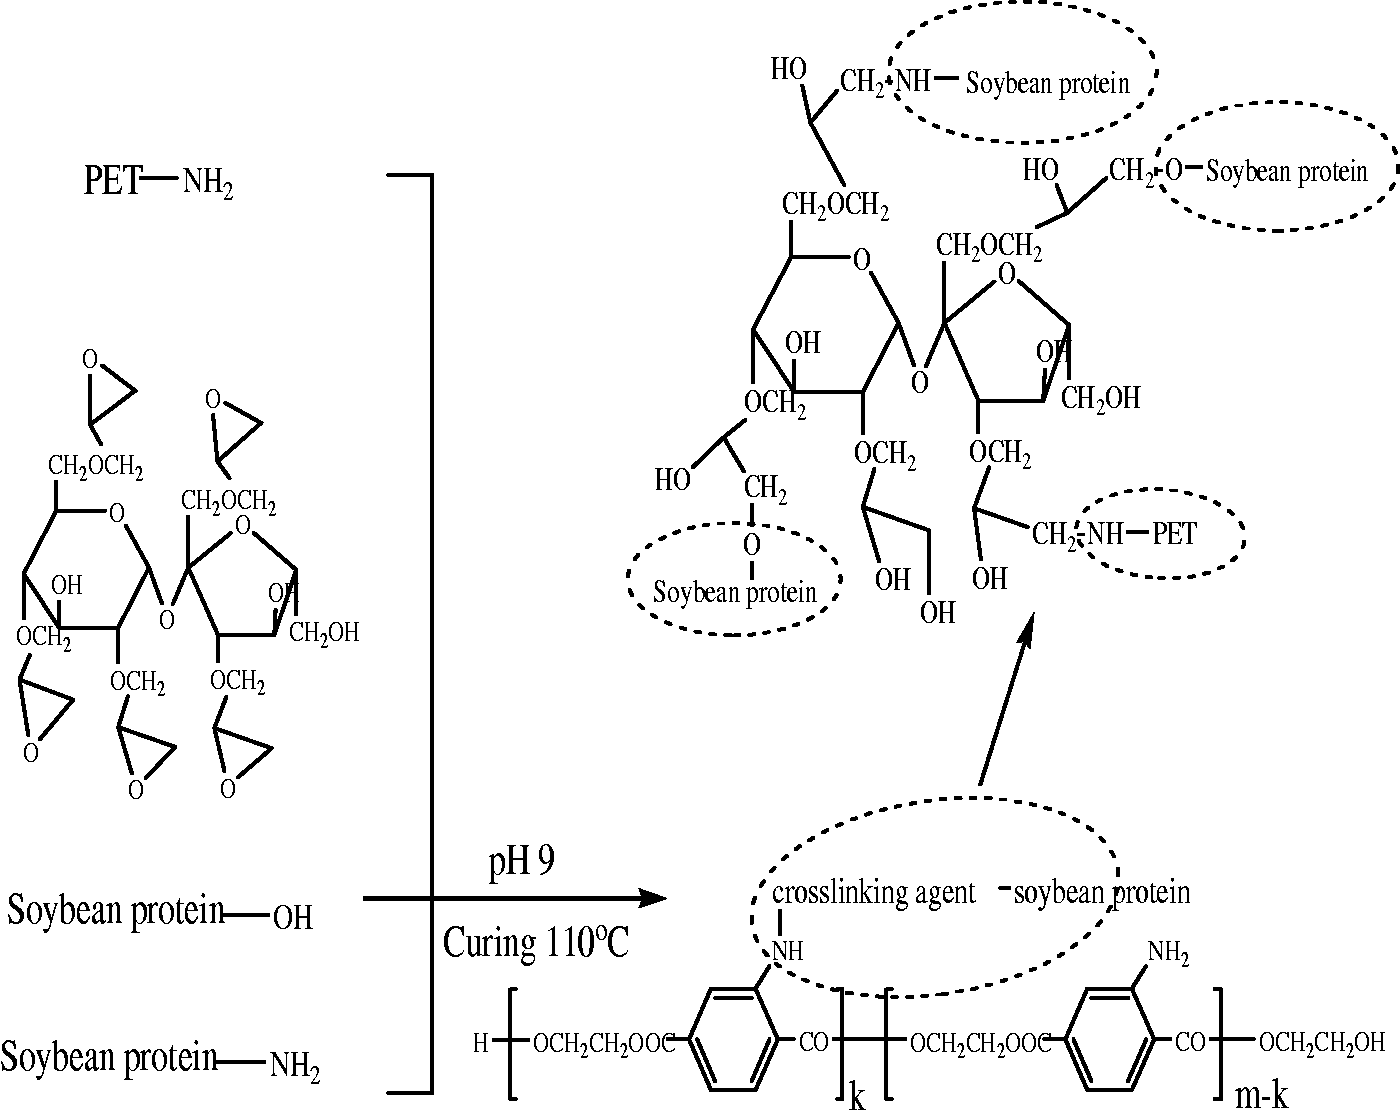
Structure characterization of the PET samples
For all soybean protein/PET composite samples, if not noted further, the 3.48% binding rate was used for characterization.
The morphological features of the surfaces of the soybean protein/PET samples were observed using a Sirion 200 thermal field-emission scanning electron microscope (SEM) supplied by the Netherlands PET Company (the Netherlands). Each soybean protein/PET sample was sputter coated with gold before being subjected to the SEM so that a clear image of the surface could be captured.
The attenuated total reflectance Fourier transform infrared (ATR-FTIR) spectrum of each sample was carried out using a Nicolet iS50 FT-IR spectrometer (Thermo Scientific, USA) with a scanning range of 4000–400 cm−1. Each spectrum was recorded with 32 scans and 4.0 cm−1 resolution.
The X-ray photoelectron spectroscopy (XPS) of each sample was performed on an ESCALab220i-XL electron spectrometer (Perkin-Elmer, USA), which was supplied by VG Scientific, using 300 W Al (Kα) irradiation operating at a working pressure of about 3 × 10⁻⁹ mbar. All binding energies were referenced to the C 1s line at 284.6 eV produced by adventitious carbon.
The atomic/molecular structure, morphological characteristics, and composition of each fabric sample was determined from the X-ray diffraction pattern of the sample, acquired using a D/max-rB X-ray diffractometer purchased from Rigaku Electric Corporation (China). Each sample was cut into very small pieces for analysis, and the analysis was performed using a step width of 0.02°, a starting angle of 5°, an end angle of 80°, a tube current of 20 mA, a tube voltage of 36 kV, and a wavelength of 1.5406 nm.
The thermal stability of the samples was evaluated using a TG 209F3 thermal gravimetric analyzer (NETZSCH instrument, Germany) under a flow of nitrogen. The temperature range selected was from 40℃ to 900℃ at a rate of 20℃ per minute.
Wearability tests of the PET samples
The crease immediate-elastic recovery angle and crease delay-elastic recovery angle of the PET fabric samples were measured following the American Association of Textile Chemists and Colorists (AATCC) standard method 66-2008 using a YG(B)541D-II-type automatic digital fabric crease elasticity measurement instrument (Wenzhou DaRong-Textile Instruments Co., Ltd, China). Three repeated tests were made to get a reliable mean value.
The stiffness of each PET fabric sample was measured following the ASTM D 1388-96 (2002) standard test method using an LLY-01 computer-controlled stiffness measurement instrument (Universal Textile Instruments Co., Ltd, Changzhou Zheng Da, China). Three repeated tests were made to get a reliable mean value.
An electronic tensile strength tester for fabric (HD026N; Nantong Hongda Experiment Instrument Co., China) was used to measure the breaking strengths and the elongations at break of each fabric sample following the ASTM D 5035-2006 (2008) standard method for testing the breaking force and elongation of textile fabric (strip method). Five measurements were made to give a reliable mean value.
The hydrophilicity of the surface of each PET fabric sample was characterized using a contact angle goniometer (OCA20; Dataphysics, Germany). A 3-µL aliquot of distilled water was dropped onto the surface of the PET fabric sample to obtain the static contact angle, which was measured after 10 s. Six measurements were made to give a reliable mean value.
Results and discussion
Relationship between the binding rate and the soybean protein concentration
The relationship between the binding rate and the soybean protein concentration is shown in Figure 1. The soybean protein binding rate increased almost linearly as the soybean protein concentration increased. This indicated that sufficient cross-linking agent was present in the soybean protein solution for the binding process to be effective. It also indicated that, under the same conditions, a higher soybean protein concentration in the solution caused more soybean protein to adhere to the PET fabric surface and react with the cross-linking agent.
Relationship between the binding rate and the soybean protein concentration.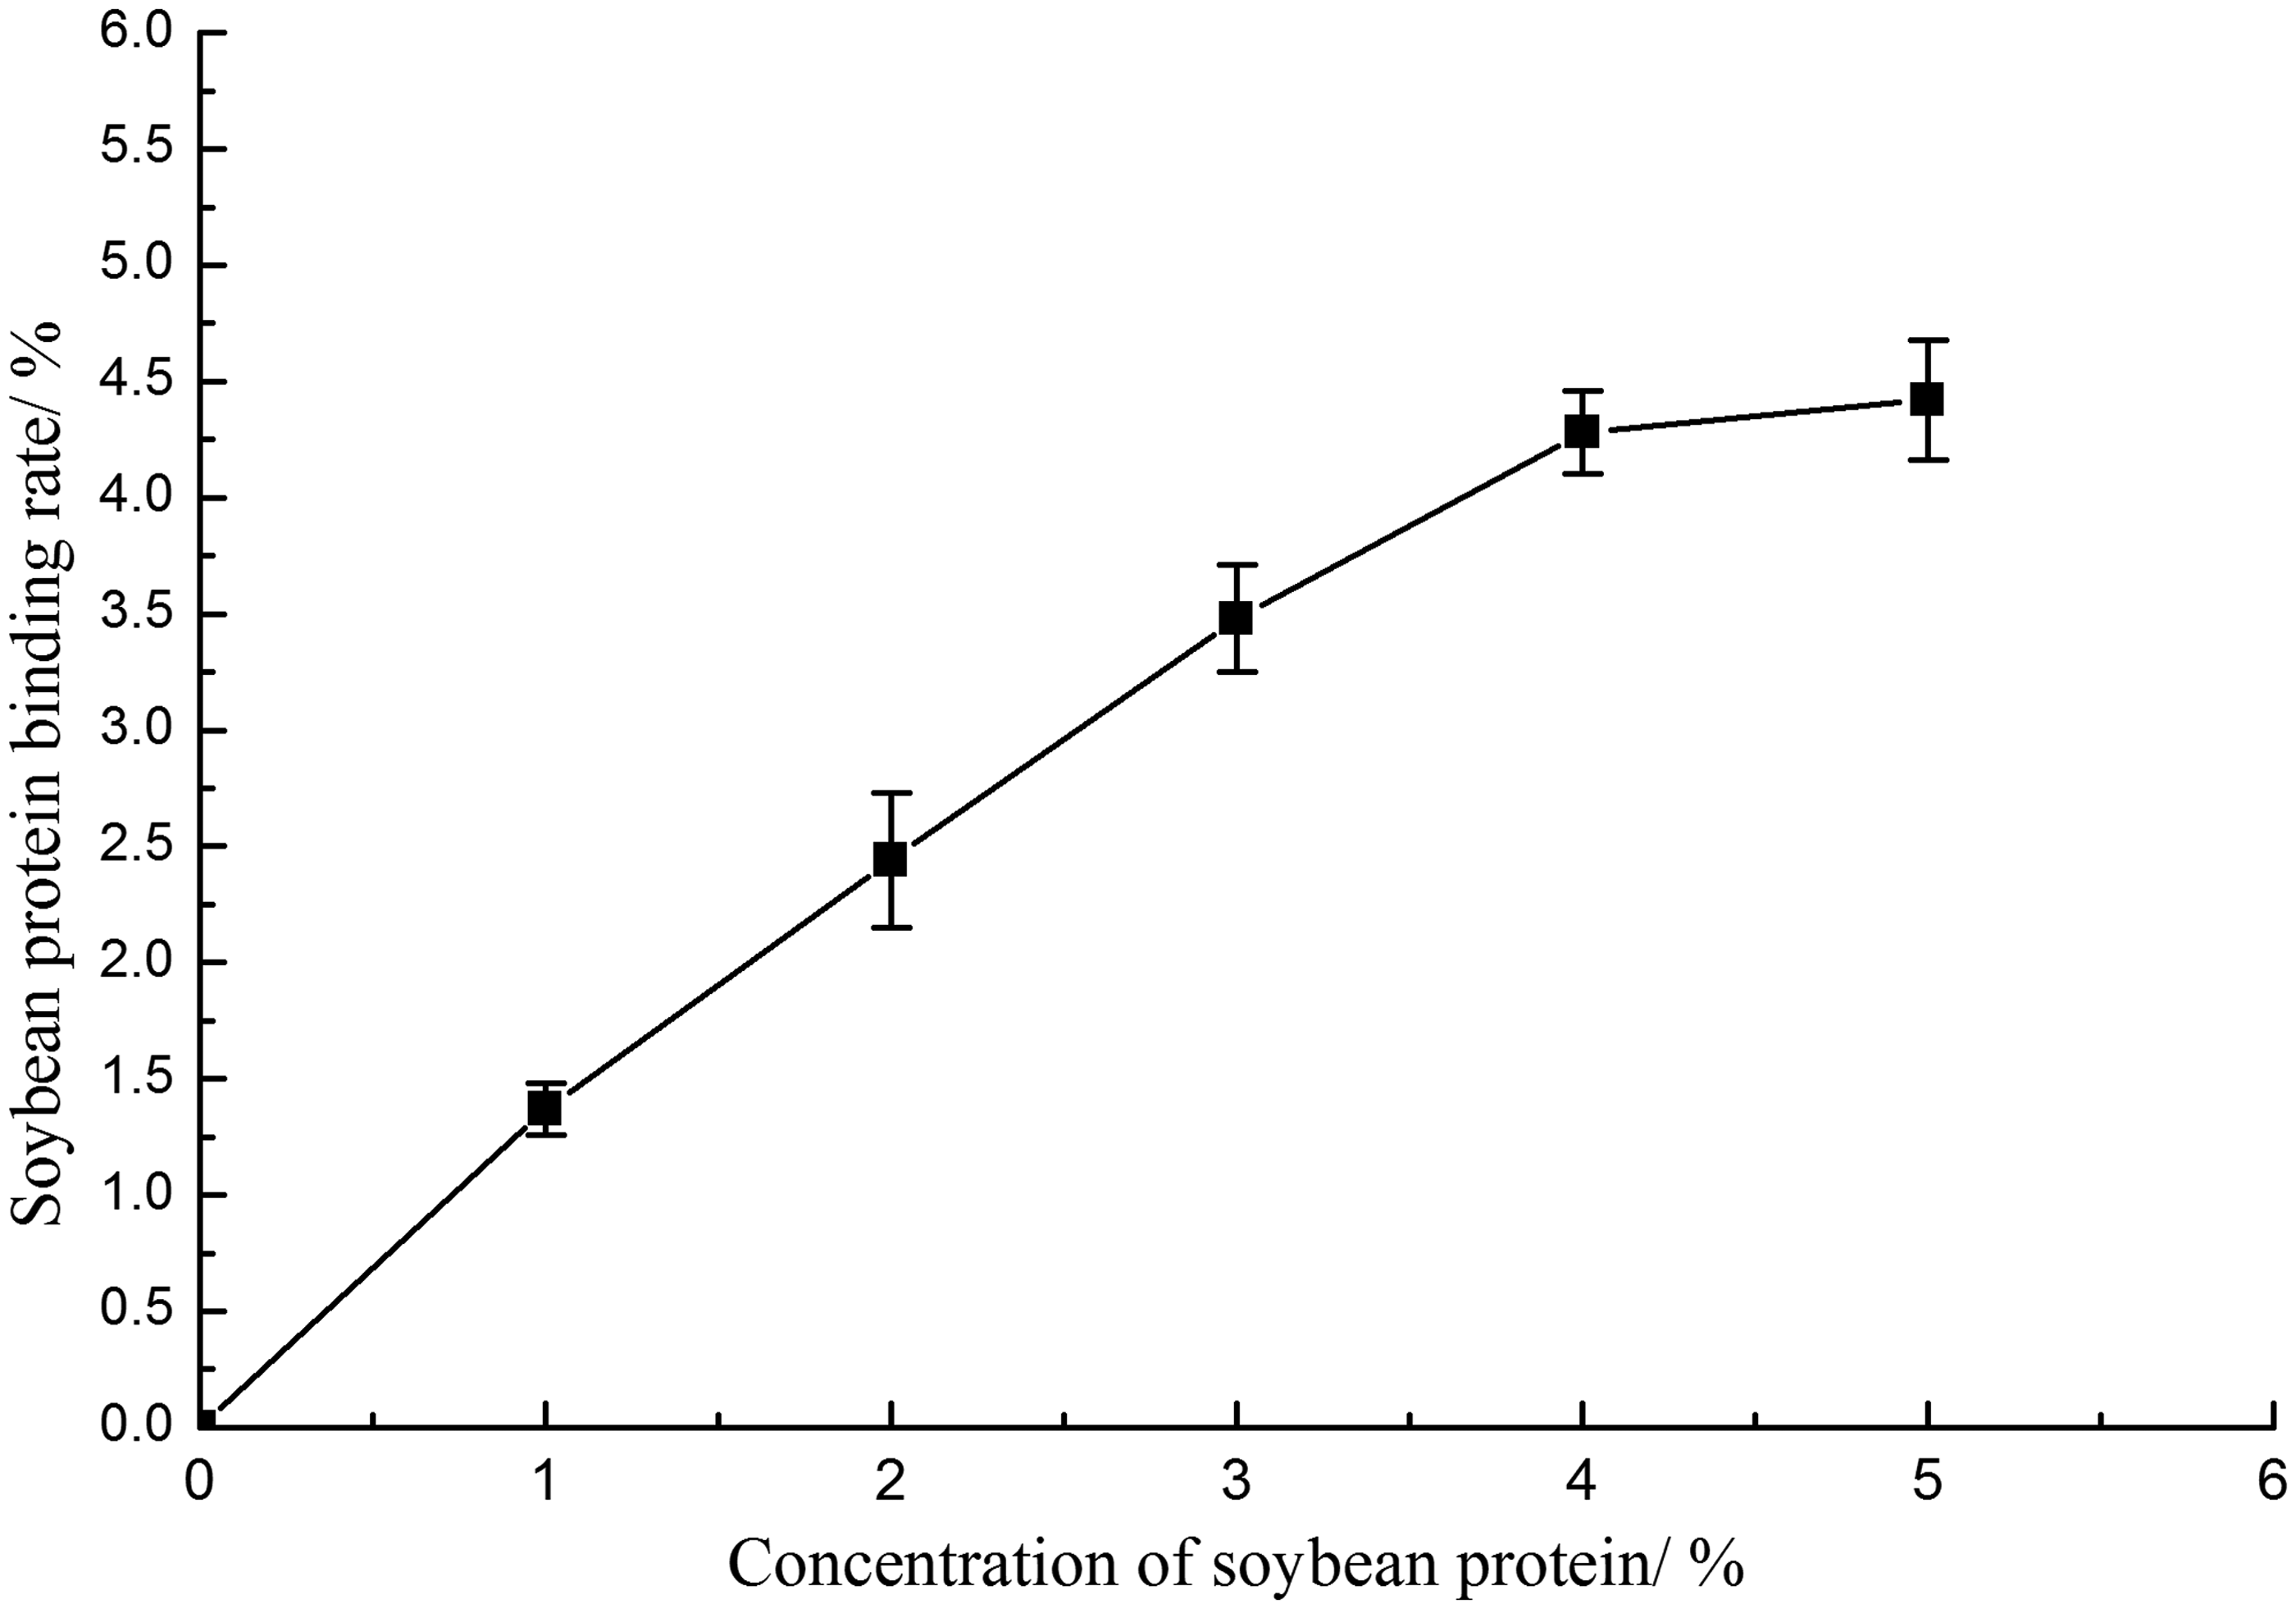
The pictures of PET fabric with different binding rates are shown in Figure 2. The pictures of original and modified PET fabrics were similar. This was because the low binding rate did not affect the macro morphology of PET fabrics.
Pictures of poly(ethylene terephthalate) (PET) fabric with different binding rates.
The GD of the soybean protein/PET composite fabric
The binding density of soybean protein/poly(ethylene terephthalate) composite fabric
GD: binding density.
SEM observations
SEM images of the original PET, NR PET, and soybean protein/PET fibers are shown in Figure 3. It can be seen that the surfaces of the original PET fibers were smooth and had few grooves (Figures 3(a) and (d)); the NR PET fibers had relatively rough surfaces that lacked luster but had not been seriously etched (Figures 3(b) and (e)). This showed that the nitration and reduction processes were facile. From the image (Figures 3(c) and (f)), it can be seen that some substance covered the PET fiber surfaces. Most of the substance covered the surface uniformly, a small amount of that aggregated to the particle, indicating that soybean protein had been bonded onto the surfaces of the PET fibers. Figures 3(g)–(i) show the cross-sectional images of the original PET, NR PET, and soybean protein/PET fibers. It can be seen that the images of the original PET, NR PET, and soybean protein/PET fibers were similar. This was because the bonded soybean protein was relatively low (3.48%).
Scanning electron microscope images (×5 k and ×800 and ×2 k) of (a), (d), (g) the original poly(ethylene terephthalate) (PET) fibers; (b), (e), (h) nitrated and reduced PET (NR PET) fibers (15.1 g/L HNO3); and (c), (f), (i) soybean protein/PET fibers.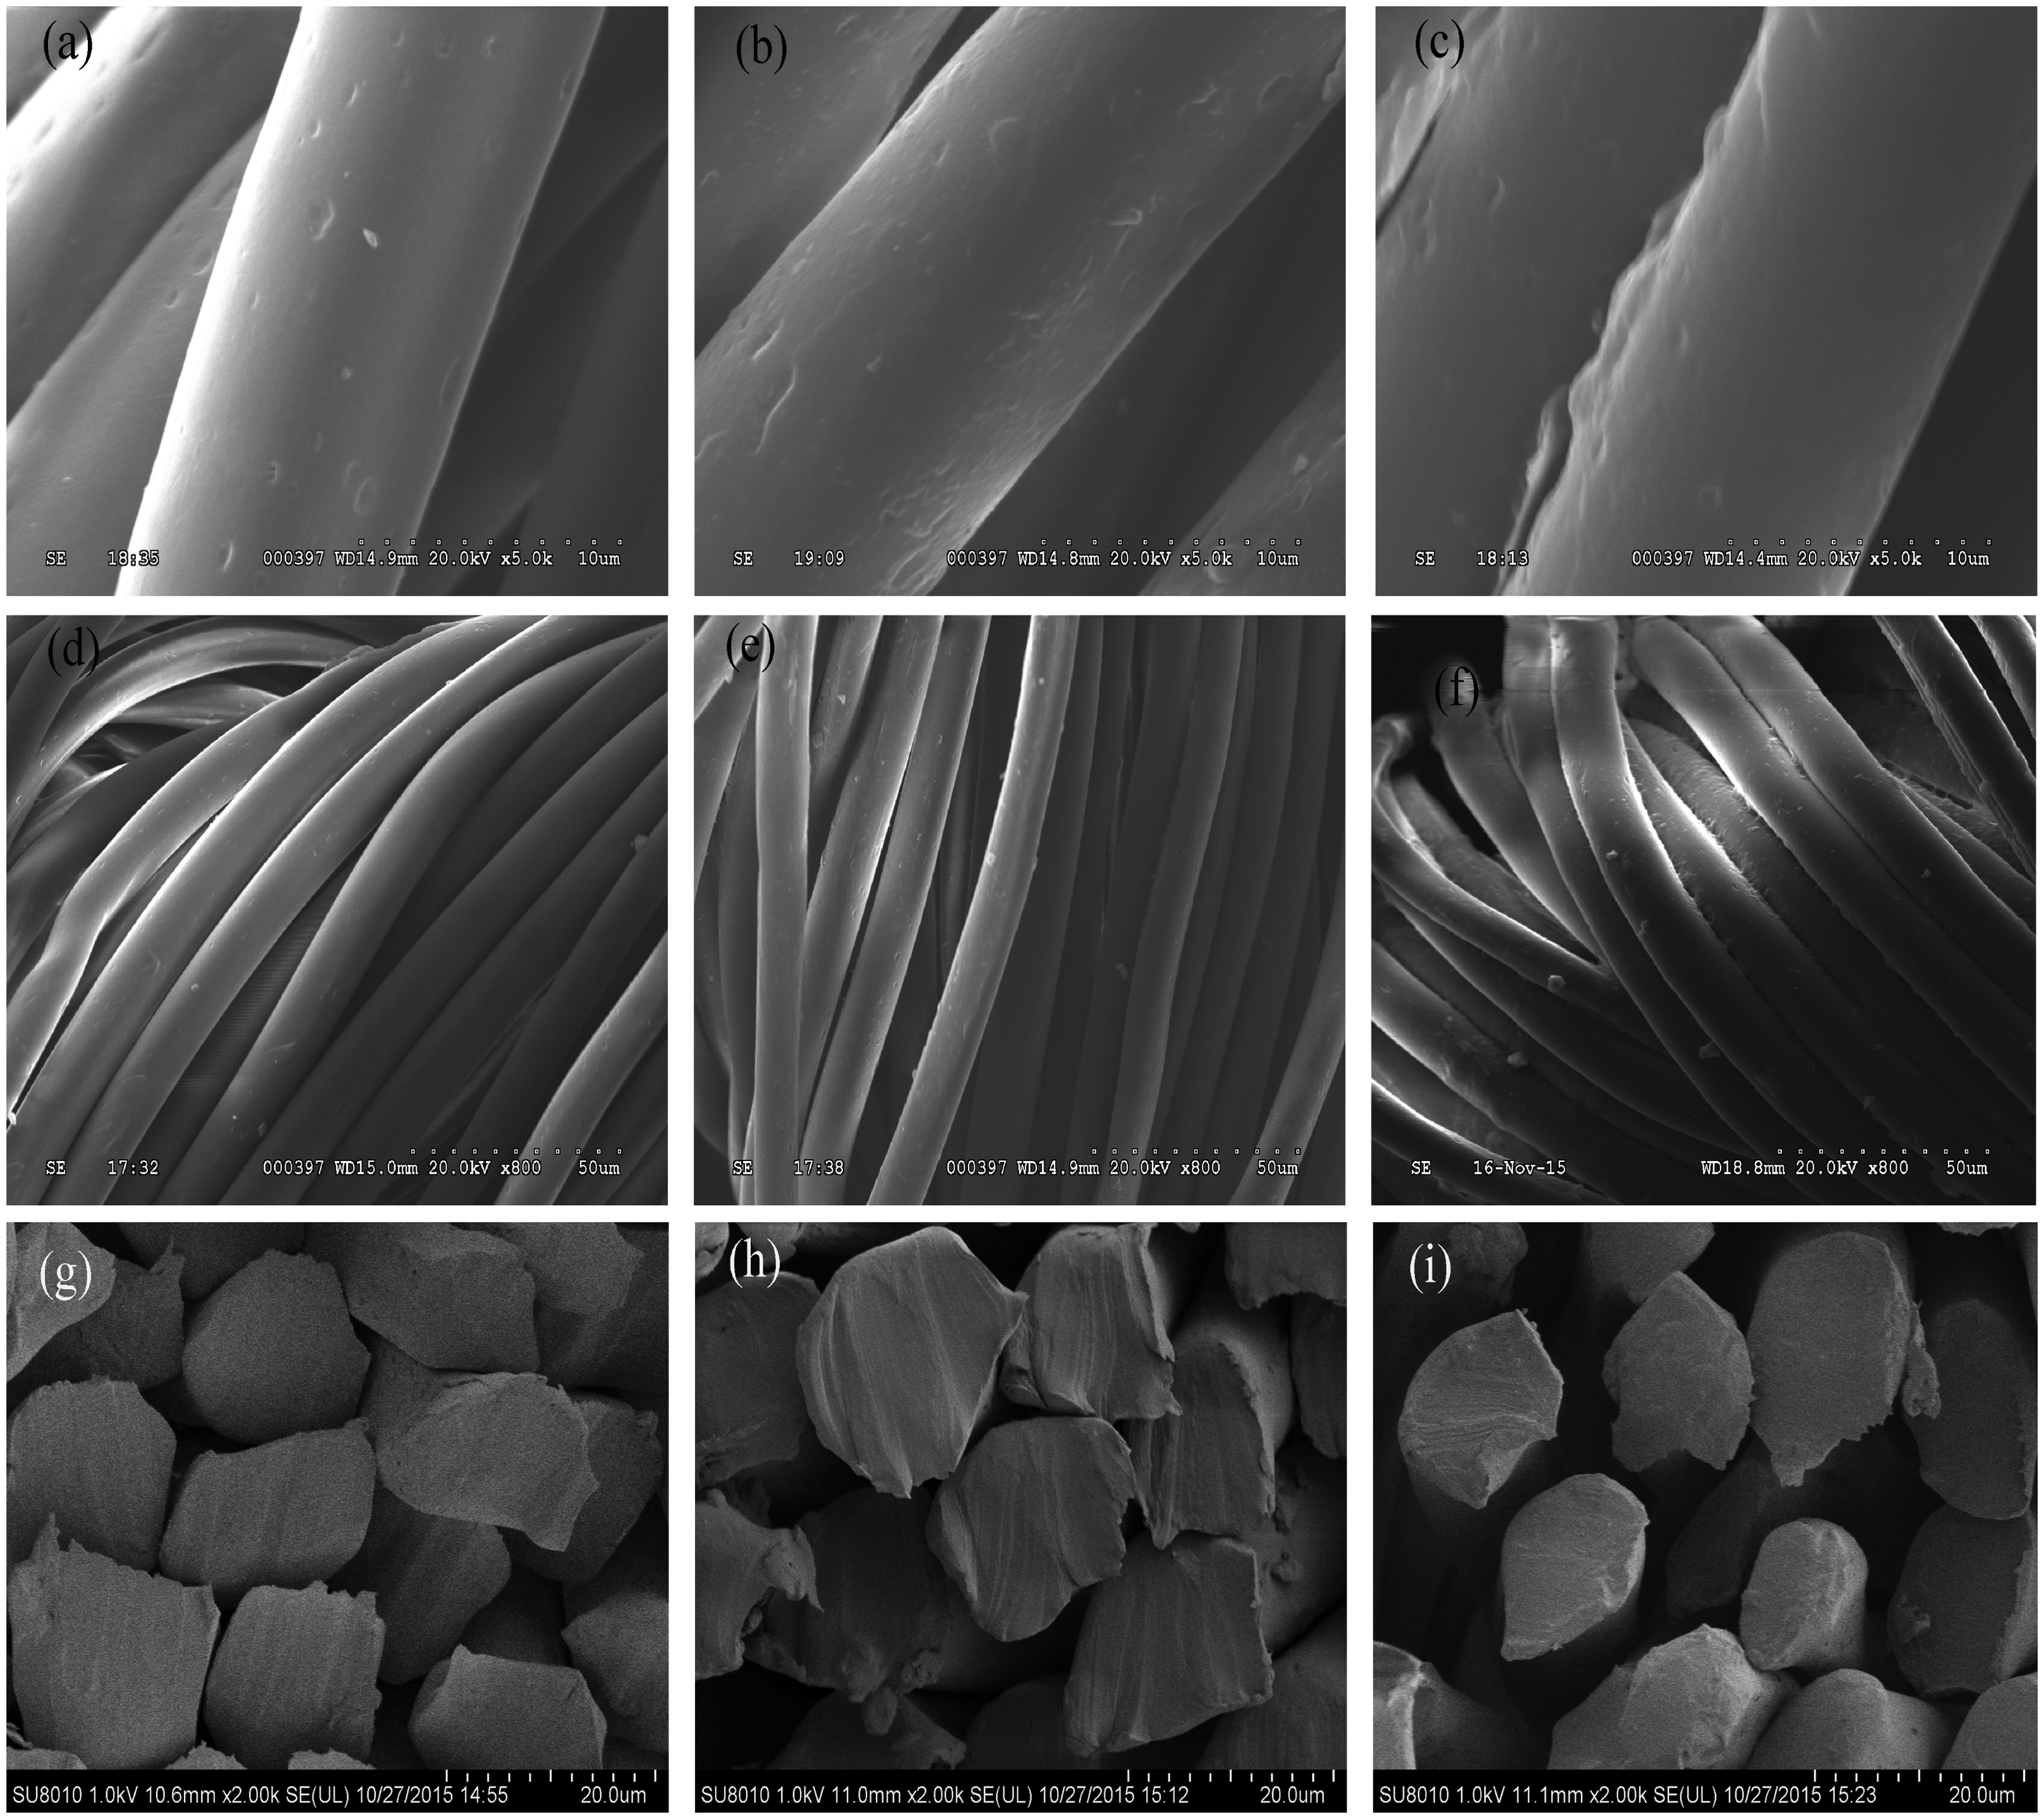
Washing durability of the soybean protein/PET composite fabric
Figure 4 shows the relationship between the soybean protein retention rate and the number of washing cycles. It can be seen from Figure 4 that the soybean protein retention rate decreased a little in the first three washing cycles and then remained almost the same as more washing cycles were performed. The soybean protein retention rate was 82.01% after 30 washing cycles. This showed that the soybean protein could be bonded firmly onto the surfaces of the PET fibers. It also indicated that –NH2 reactive groups were present on the PET fibers and that the sucrose glycidyl ether (which contains several epoxide groups) allowed the soybean protein to be effectively bonded onto the PET fibers. Compared with the cross-linking agent containing two reactive groups in another reported paper,
25
the sucrose glycidyl ether has five epoxy groups; the activity of the –OH group hydrolyzed by NaOH is lower than that of the –NH2 group produced by nitration and reduction. The sucrose glycidyl ether cross-linking agent can not only bond between soybean protein molecules and PET fibers, but also bond among the soybean protein molecules. Then the soybean protein could be bonded firmly on the NR PET fabrics.
Durability of the soybean protein on the poly(ethylene terephthalate) fabric.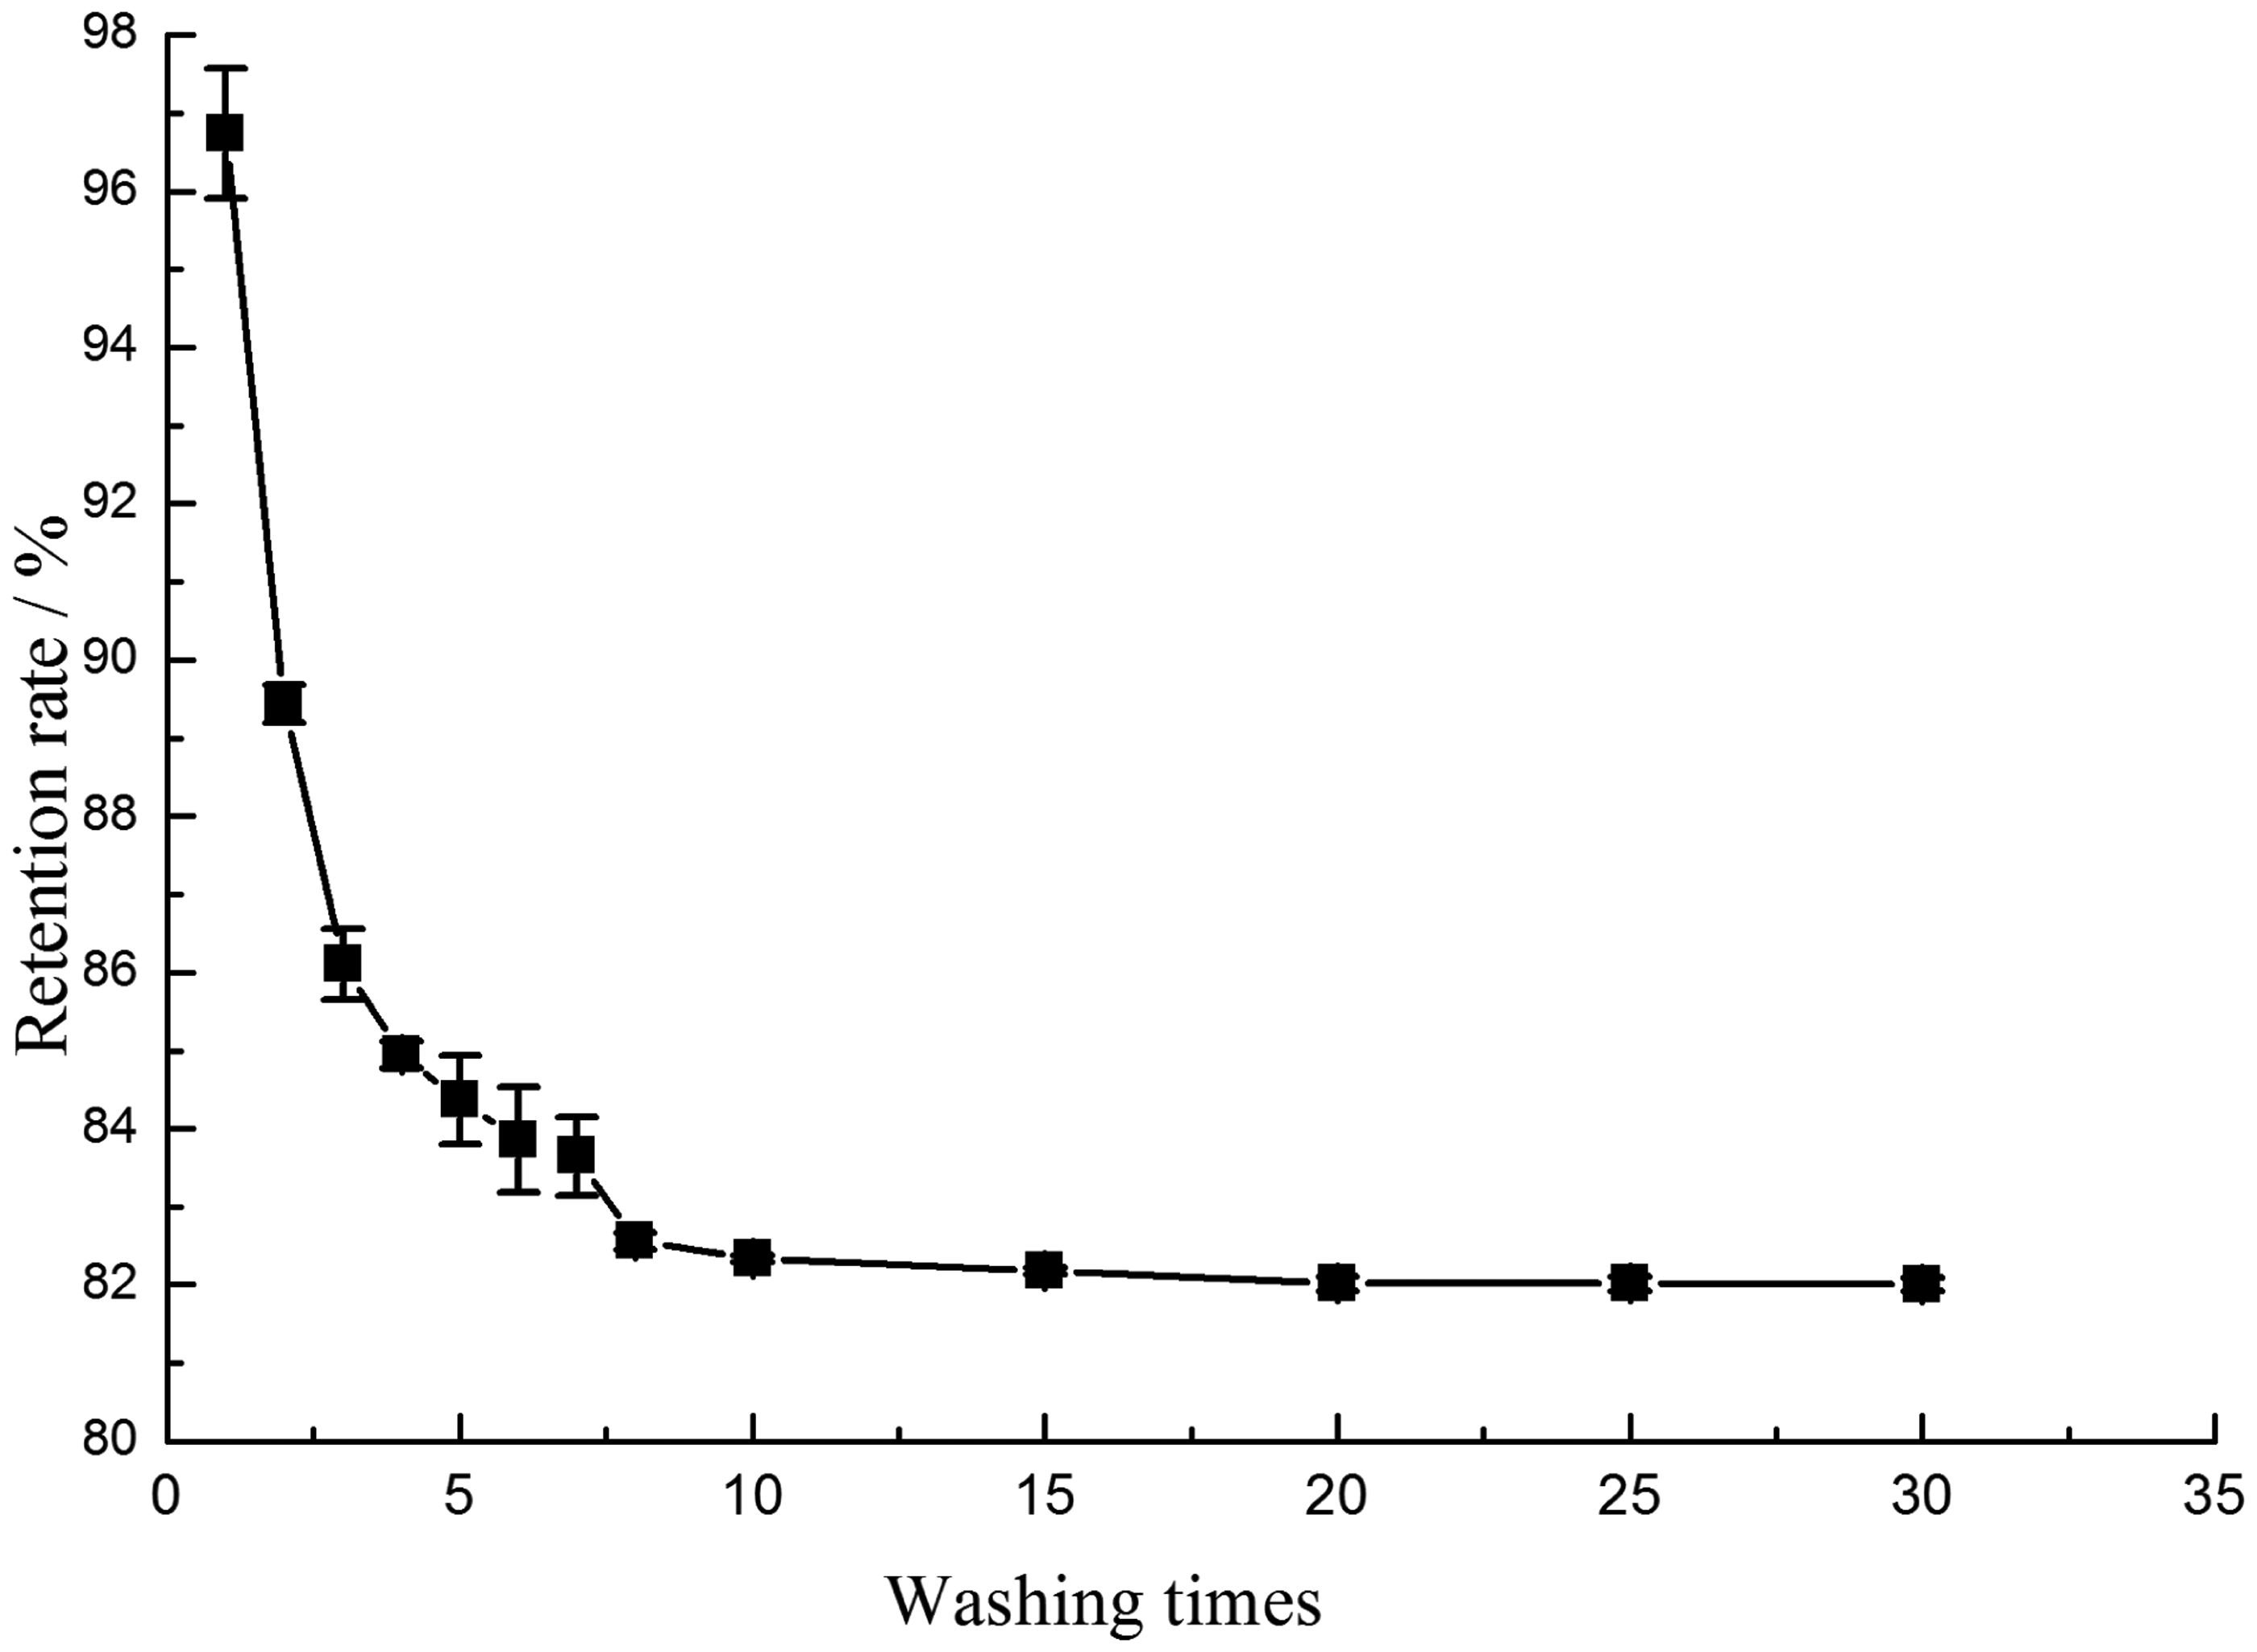
ATR-FTIR measurement
Figure 5 shows the ATR-FTIR spectra of the original PET, NR PET, and soybean protein/PET fiber. The three kinds of PET fiber all had the same main absorption peaks. These were a peak at 1716 cm−1, which was assigned to the –C=O stretching of –COO−, and a peak at 1248 cm−1, which was assigned to –CO– stretching. The NR PET fiber had a new absorption peak at 3290 cm−1, which was assigned to the single bond of N-H. The soybean protein/PET fiber had peaks at 1642 and 1541 cm−1 that were not found in the spectra of the original PET fiber or NR PET fiber. The peak at 1642 cm−1 was assigned to amide band I, and the peak at 1541 cm−1 was assigned to amide band II.
1
This indicated the successful introduction of soybean protein onto the PET surface. The peak at 3287 cm−1 was weaker in the soybean protein/PET fabric spectrum than in the NR PET fabric spectrum. This was in accordance with the expected effect of the binding reaction, in which the –NH2 groups on the PET fibers were expected to react with the sucrose glycidyl ether cross-linking agent.
Attenuated total reflectance Fourier transform infrared spectra of the original and modified poly(ethylene terephthalate) (PET) fabrics. NR PET: nitrated and reduced PET.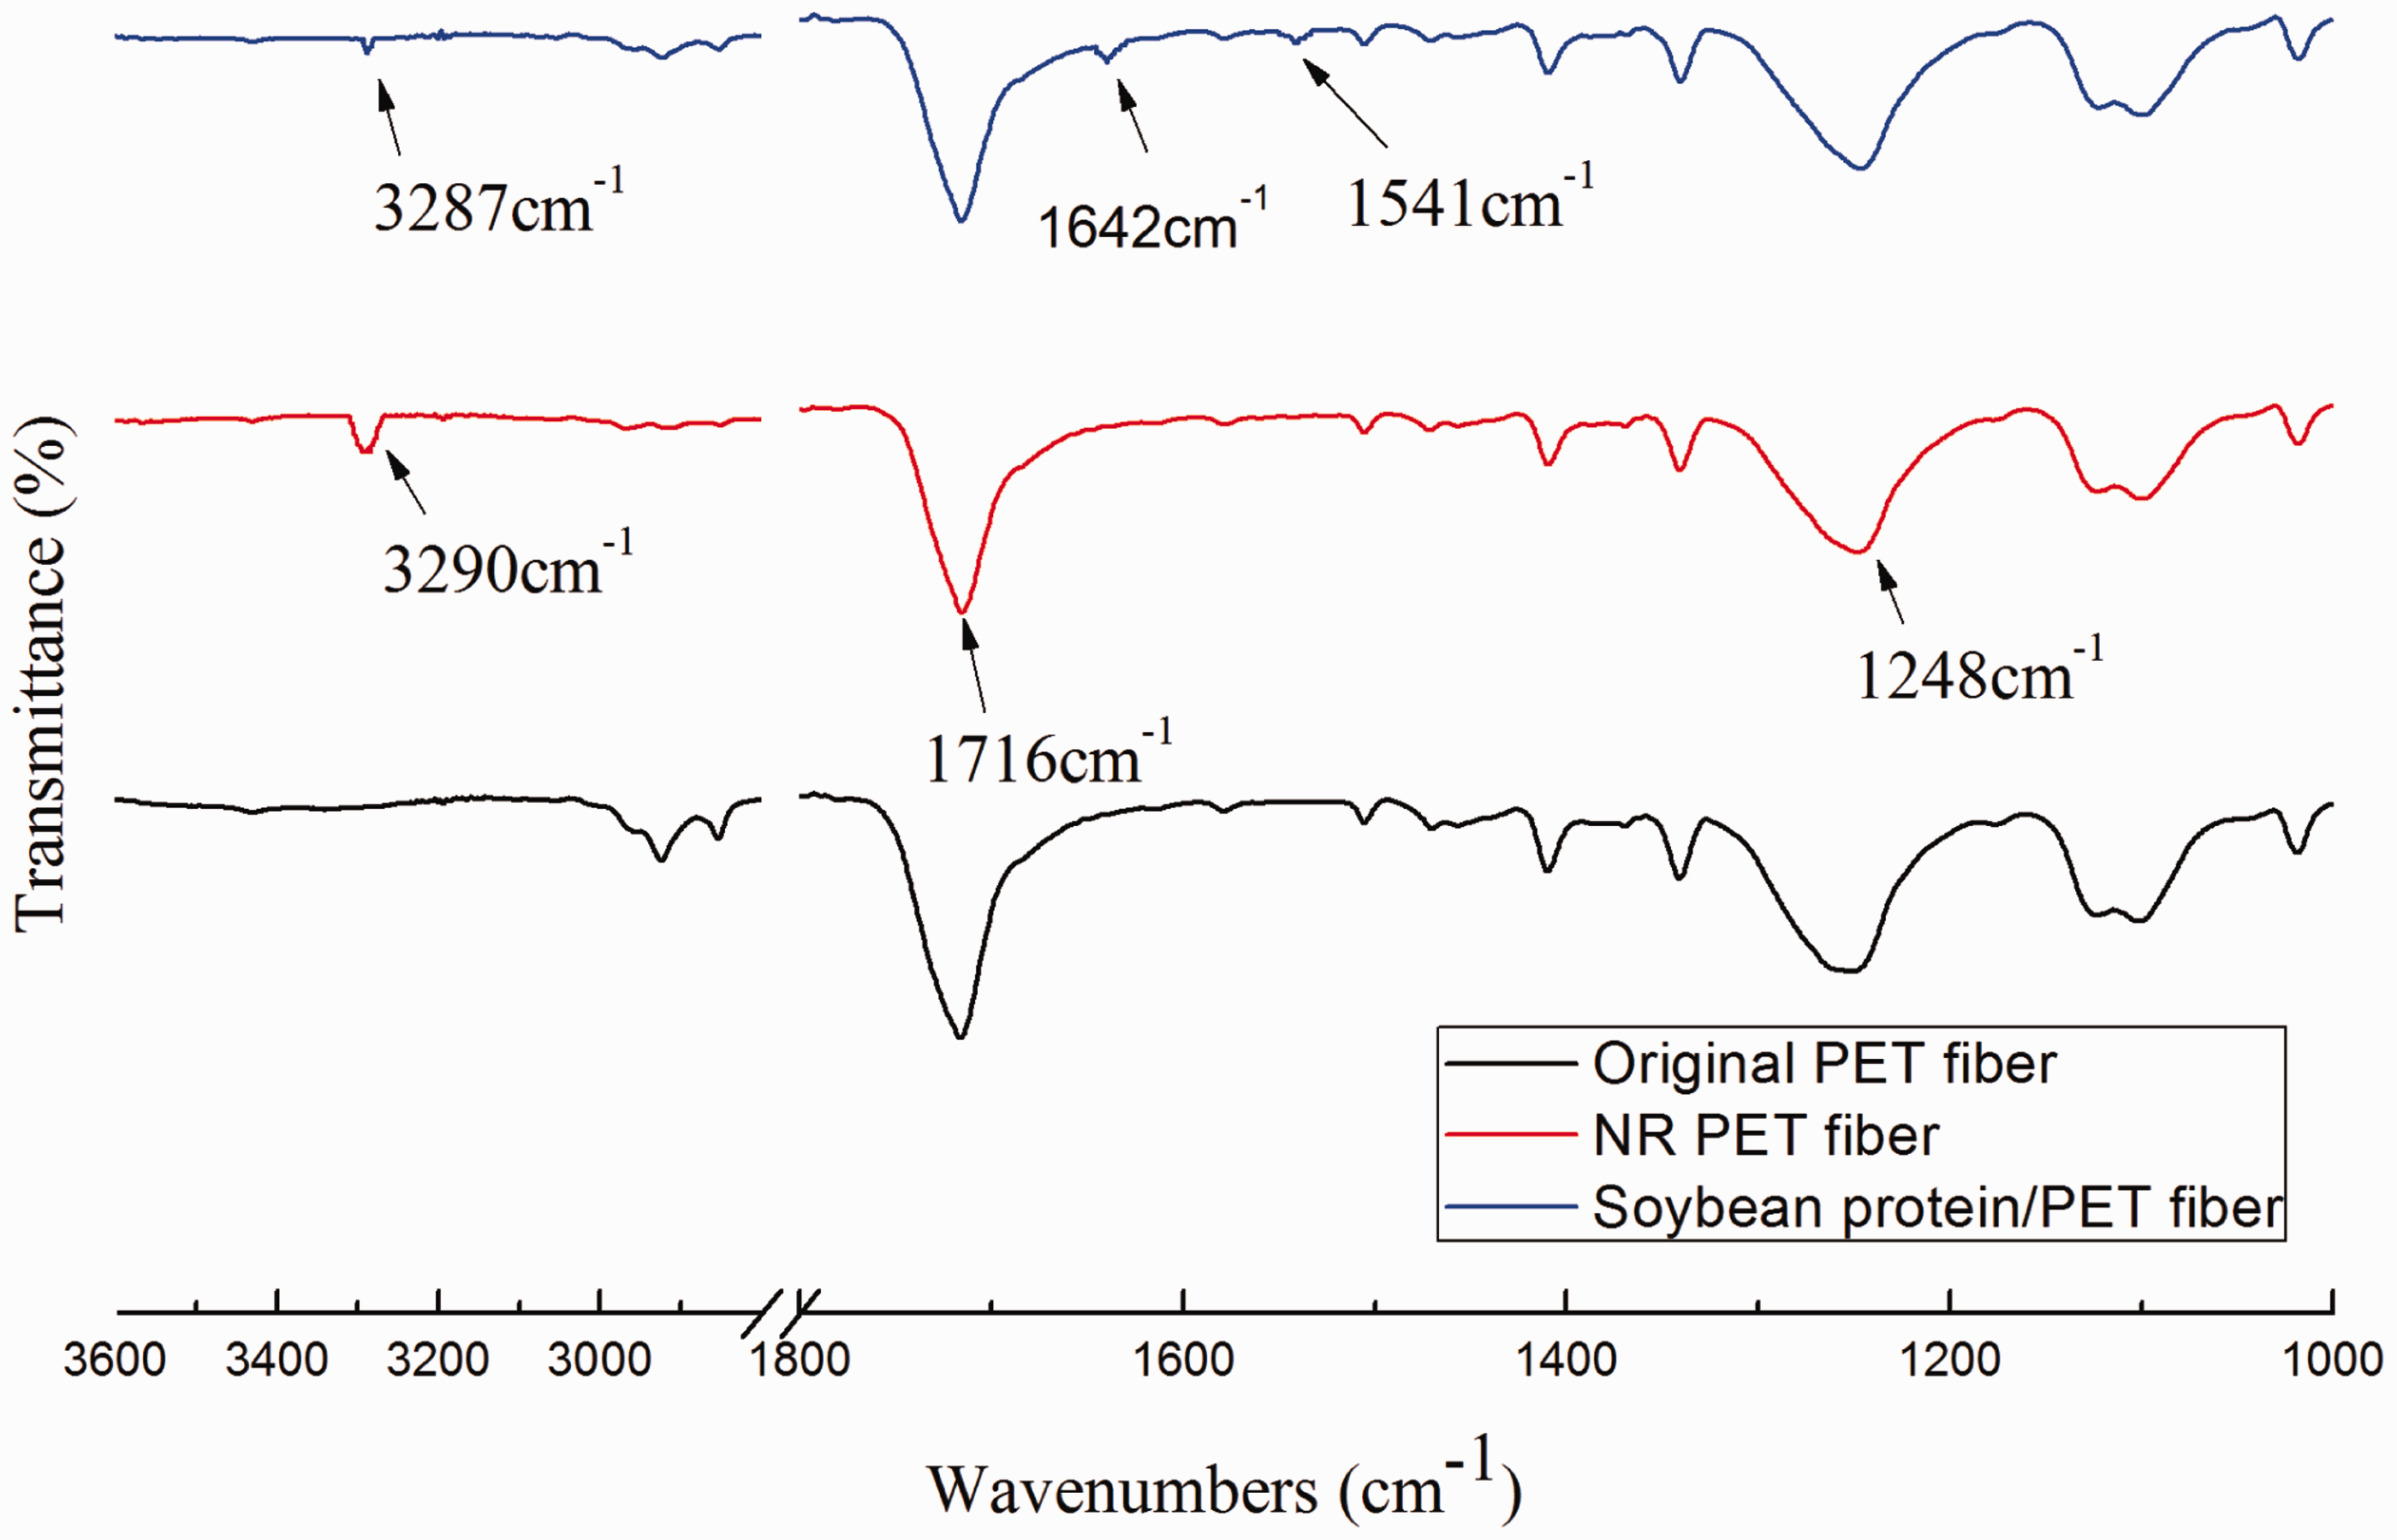
XPS diffraction analyses
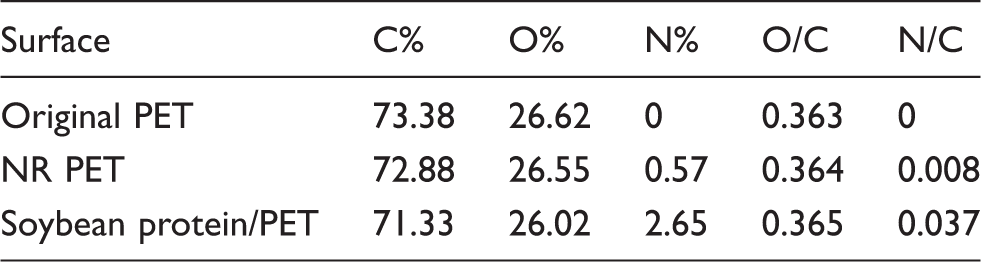
Atomic compositions and ratios of the original and modified poly(ethylene terephthalate) (PET) fibers
NR PET: nitrated and reduced PET; Soybean protein/PET.
Figure 6 shows the high-resolution C 1s, O 1s, N 1s spectra of the PET fibers. In Figure 6(a), the C 1s peaks had three components. Peak C1 at the binding energy of 282 eV (-C-C/H), peak C2 at the binding energy of 283.75 eV (–O–C/H), and peak C3 at the binding energy of 286.1 eV (–CO–O–). The C 1s spectrum of NR PET was almost the same as that of original PET. Compared with the C 1s spectrum of original PET, the spectrum of soybean protein/PET changed a little. The peak C3 decreased obviously. This is because some soybean protein was bound on the PET fibers, and the carbon atomic content of –CO–O– was relatively lower than that of original PET. From Figure 6(b), the O 1s had two components: peak O1 at the binding energy of 529.1 eV (–C=O) and peak O2 at 530.6 eV (–C–O). The O 1s spectrum of soybean protein/PET was the same as that of original PET. Compared with the O 1s spectrum of original PET, the peak O2 of NR PET increased a little. This may be because a few PET macro molecules hydrolyzed during the reduction process and the –C–O groups increased slightly. Figure 6(c) shows the N1s peak at the binding energy of 396.3 eV. The original PET had no nitrogen element; the NR PET had a small N 1s peak. The N 1s peak intensity of soybean protein/PET increased greatly. These were in accordance with that the PET fibers being nitrated and reduced and bound protein, respectively.
X-ray photoelectron spectroscopy high-resolution spectra of the original and modified poly(ethylene terephthalate) (PET) fibers: (a) C 1s; (b) O 1s; (c) N 1s. NR PET: nitrated and reduced PET.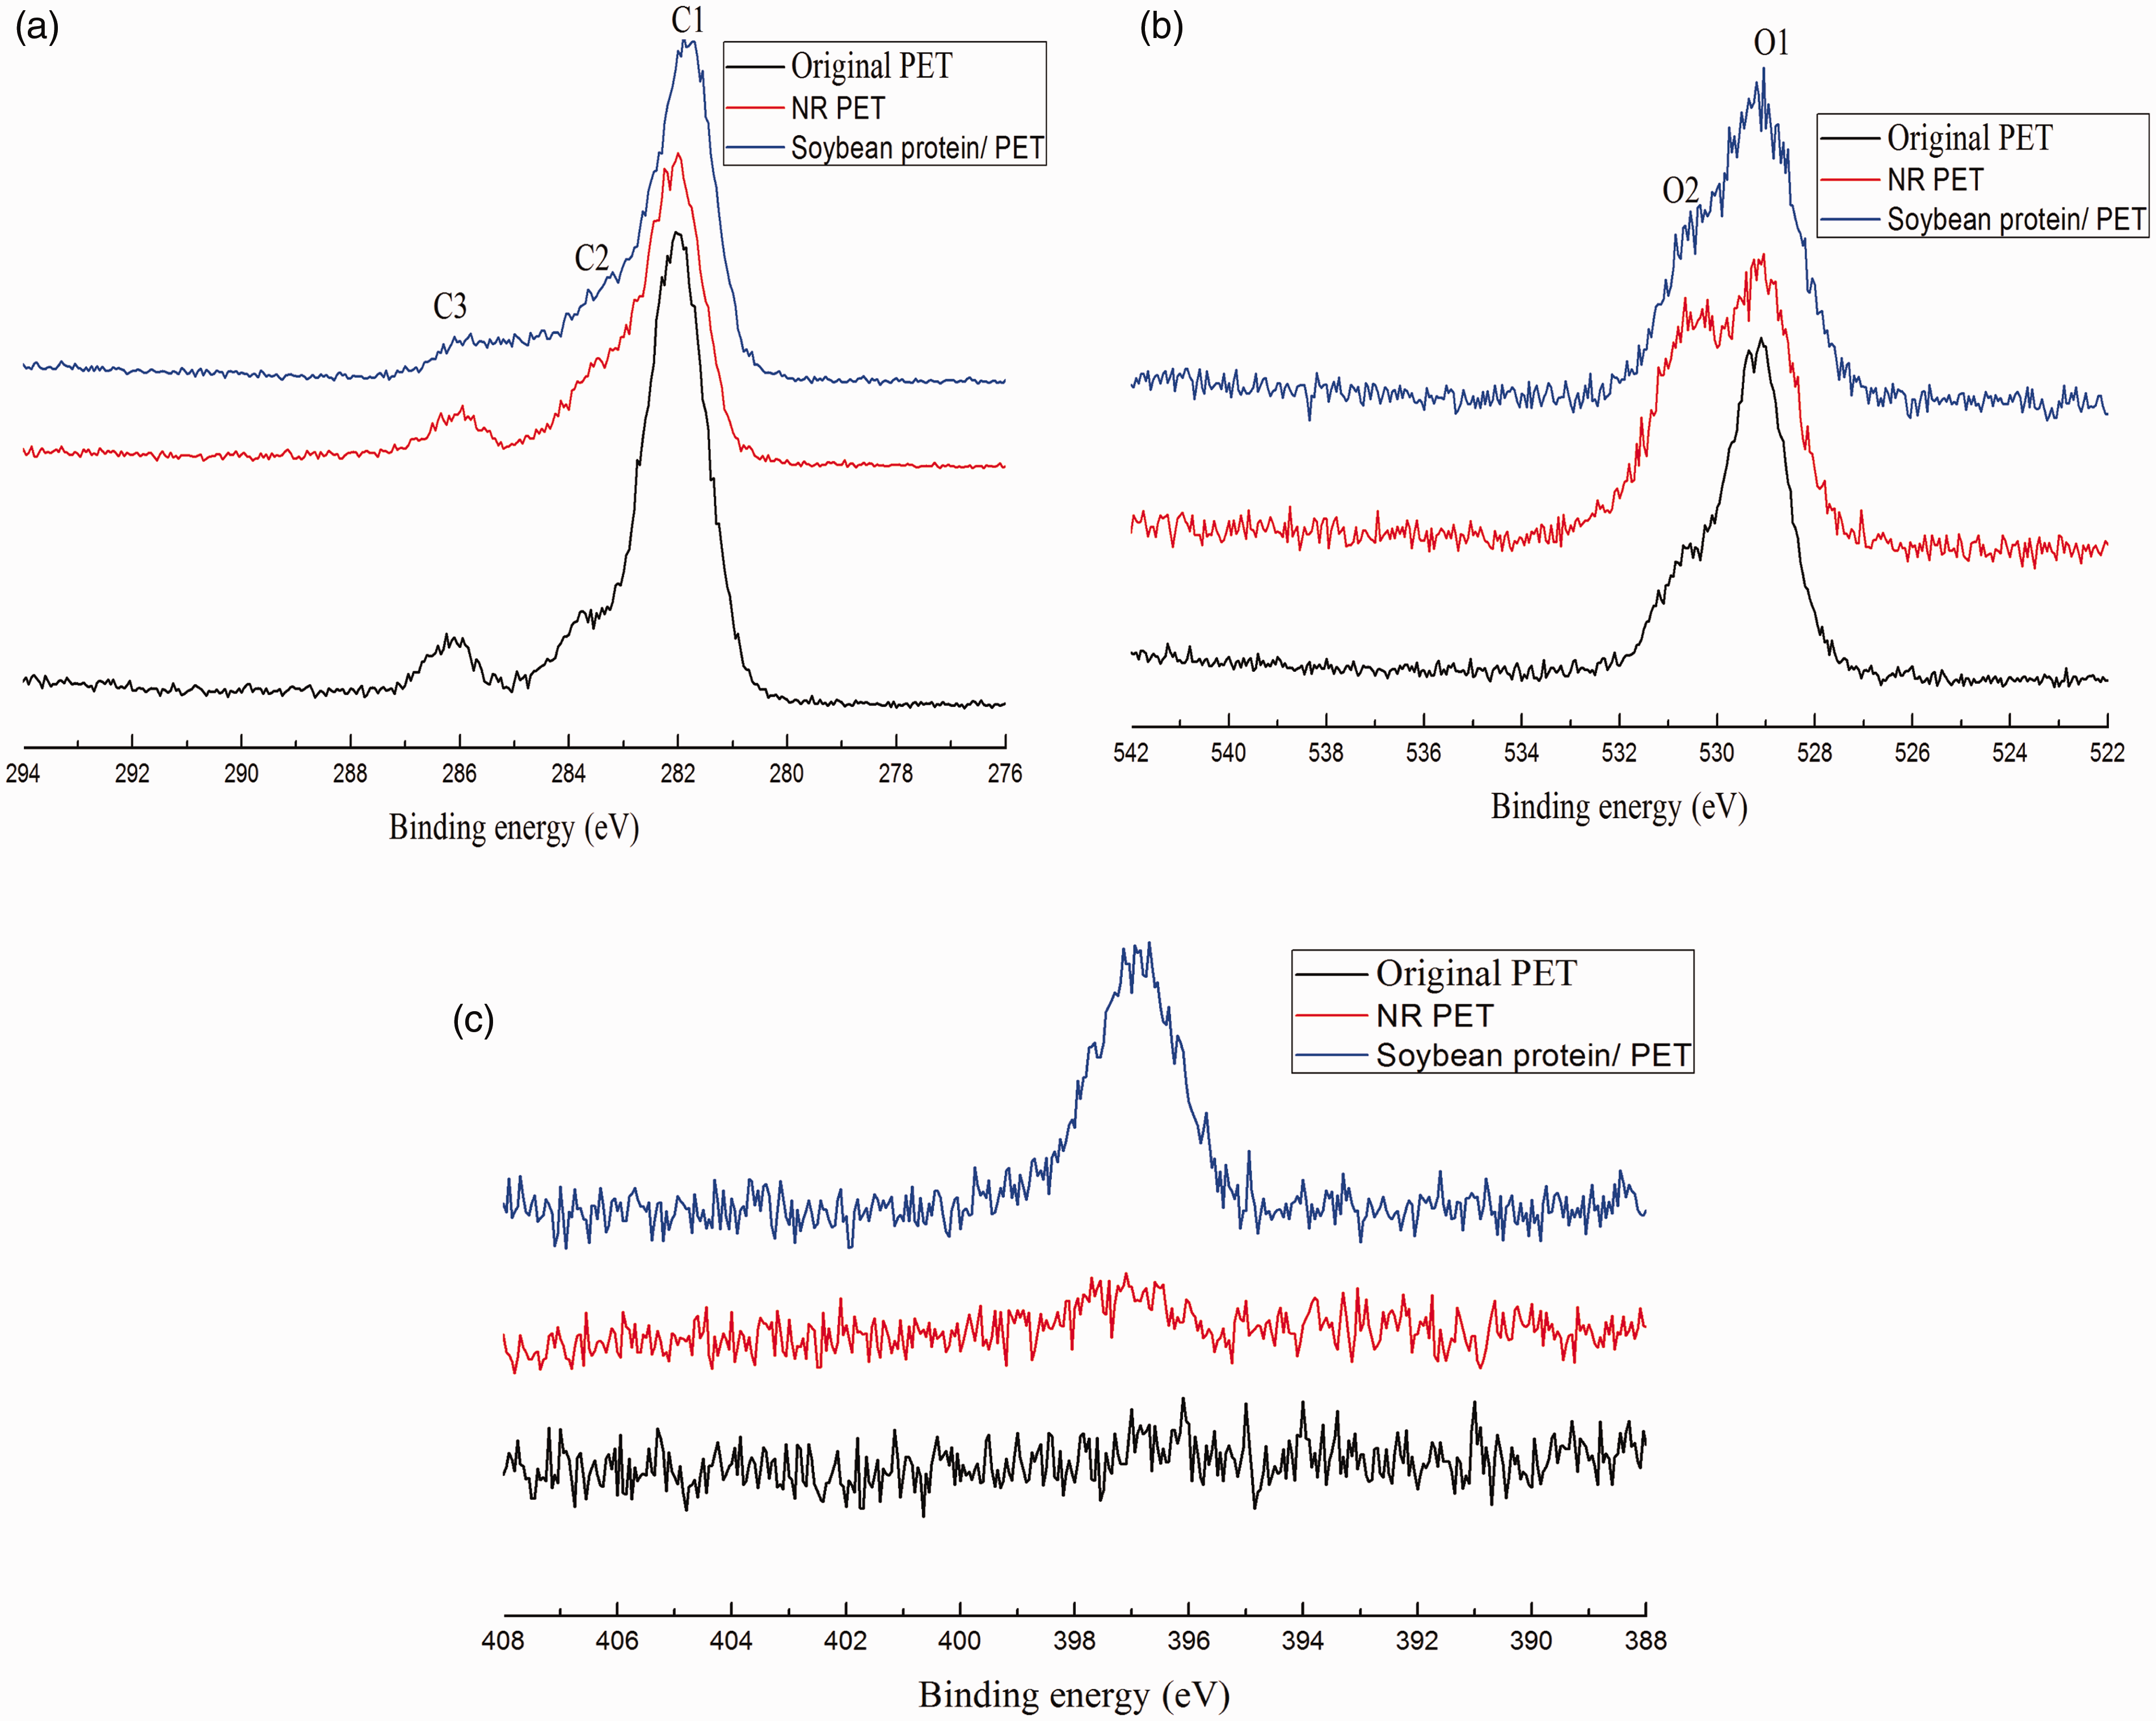
X-ray diffraction analyses
The X-ray diffraction patterns of the original PET, NR PET, and soybean protein/PET fibers are shown in Figure 7. All three X-ray diffraction patterns were similar, showing that the main structures of the PET fibers were retained well when the PET fibers were nitrated and reduced, and when the soybean protein was bonded on. The patterns showed that the PET fibers were almost undamaged during the modification processes and only the surface layers of the PET fibers were modified.
X-ray diffraction patterns of the poly(ethylene terephthalate) (PET) fibers. NR PET: nitrated and reduced PET.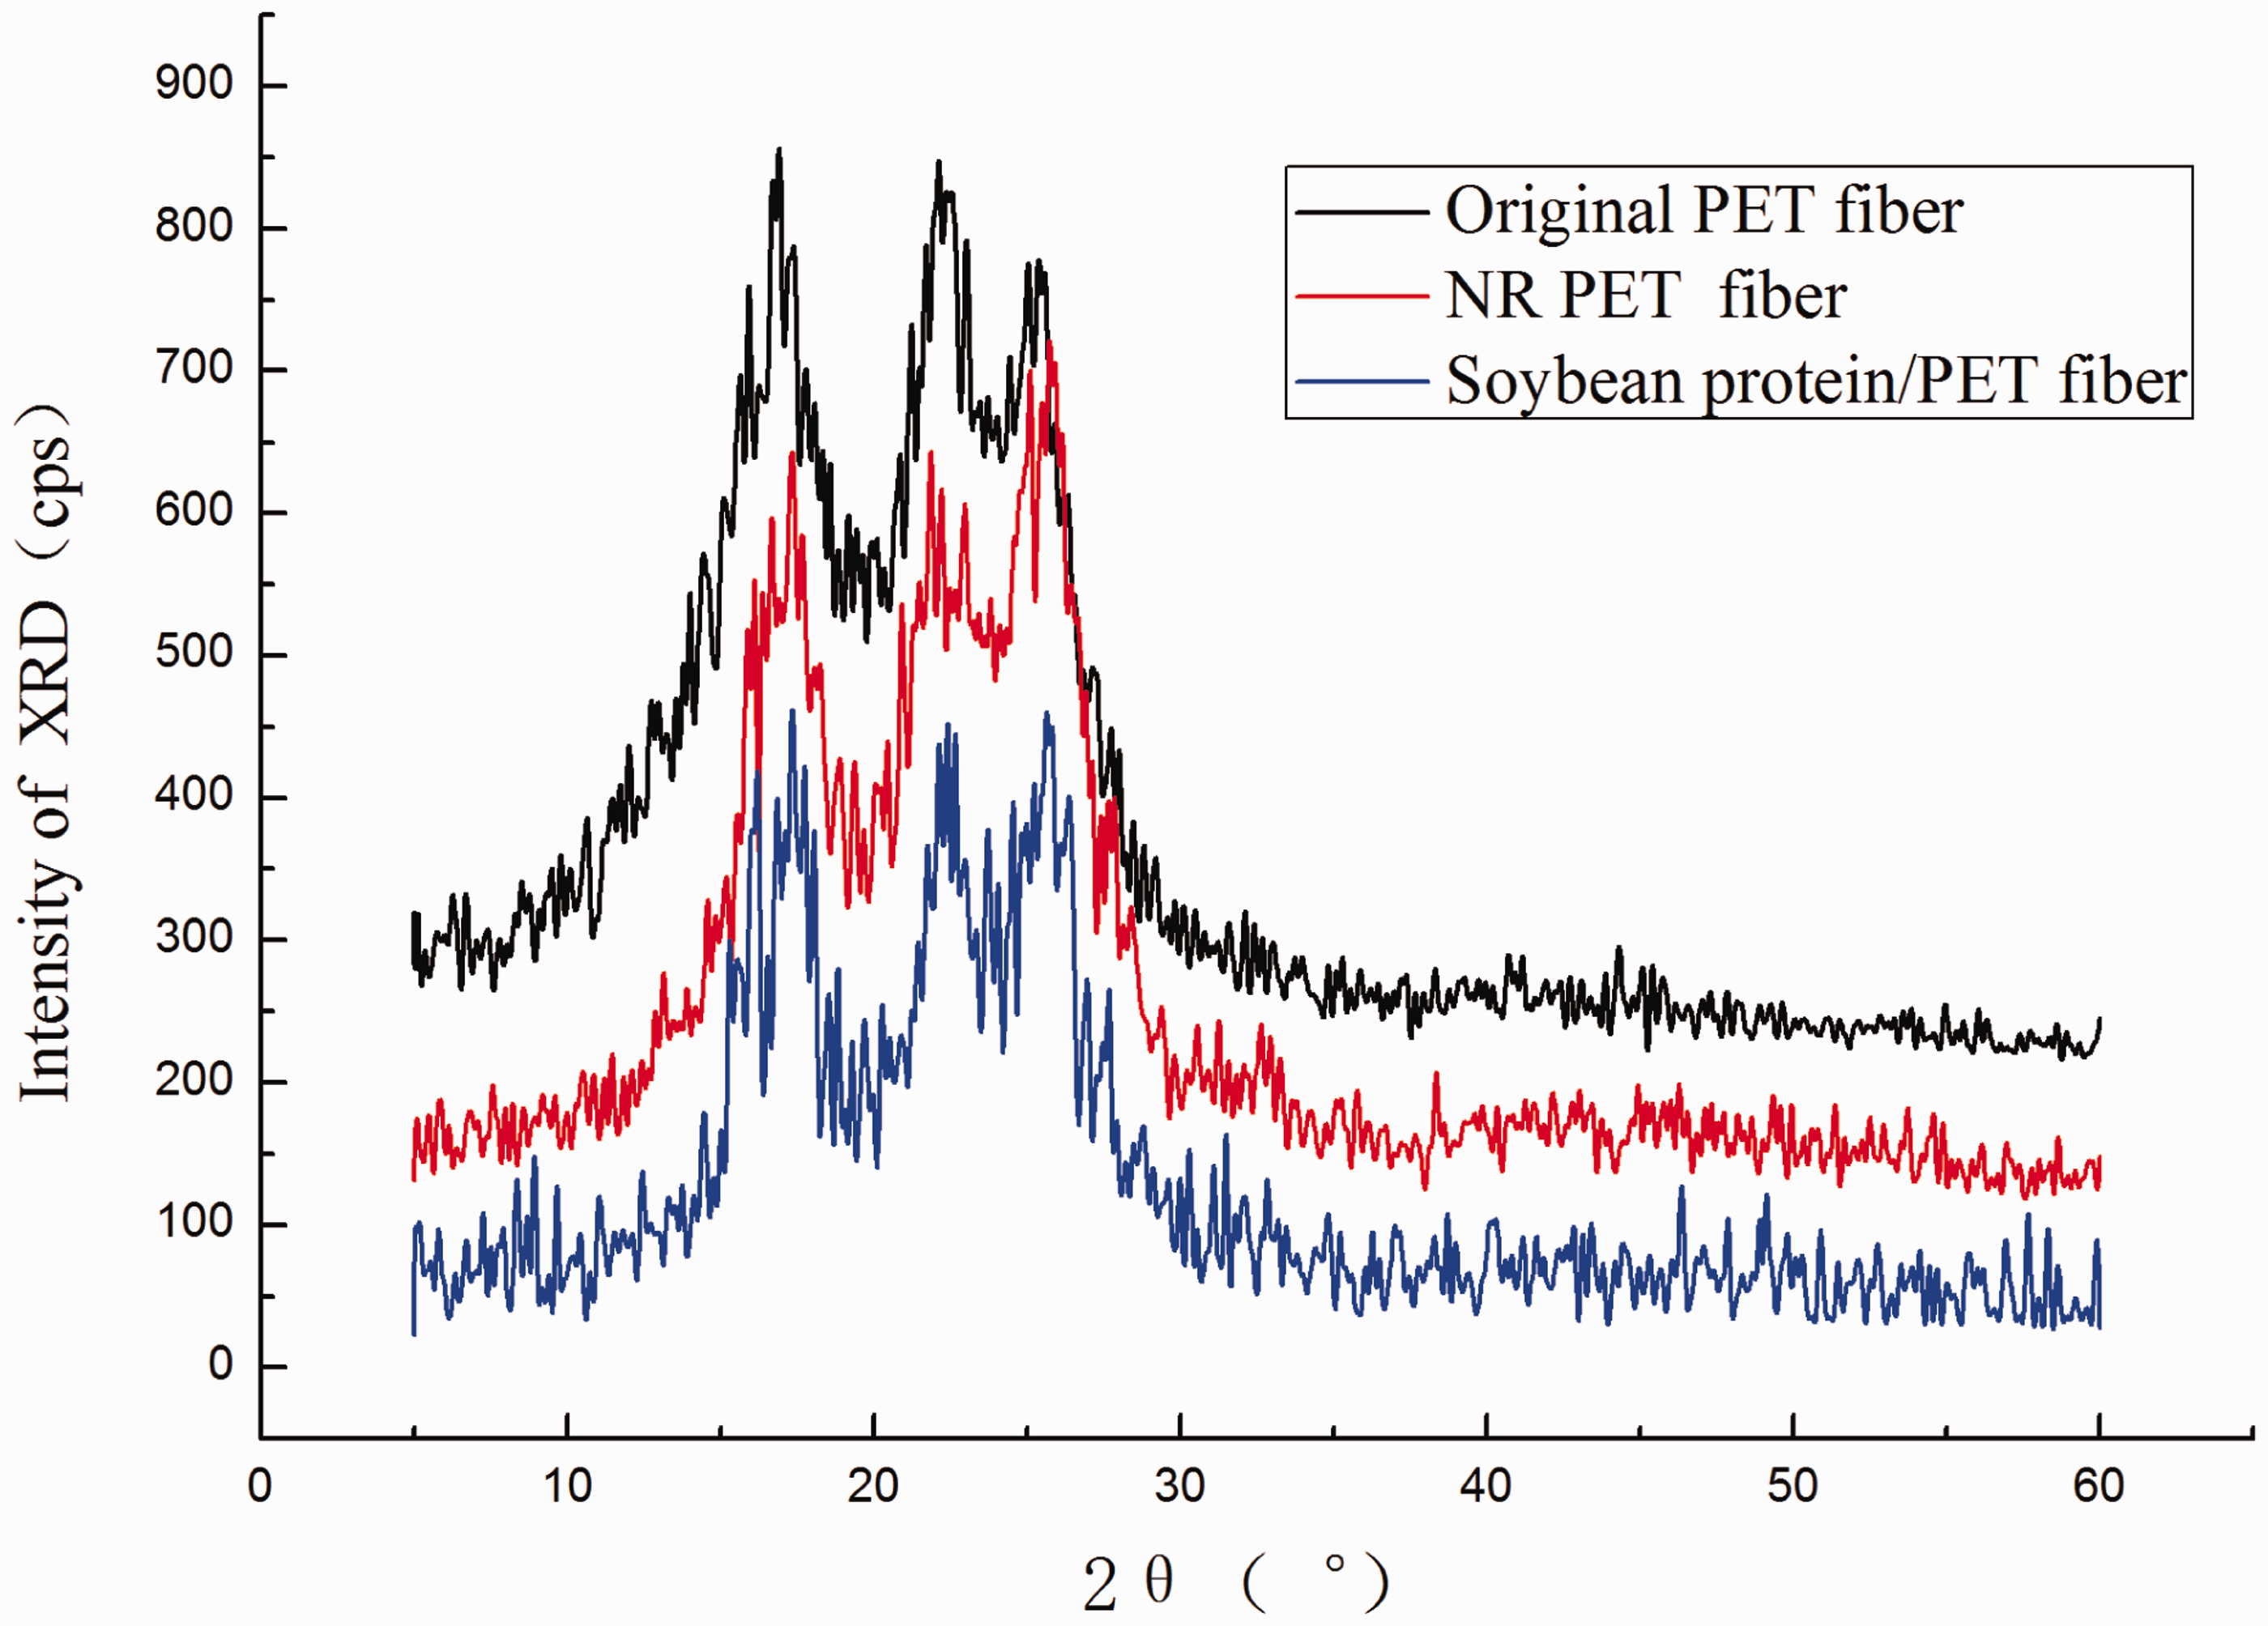
Thermogravimetry analyses
The thermogravimetry (TG) results of the original and modified PET fibers are shown in Figure 8. The TG curve of NR PET fiber was similar to the original one, as the thermal decomposition onset temperatures were both 394.5℃, whereas the soybean protein/PET fiber was 313.8℃. This is because the soybean protein that was bonded on PET fibers was easier to decompose than PET fibers. With the increase of temperature, the mass of soybean protein/PET fiber was slightly lower than that of original PET fiber until 445.1℃. The residual masses of original, NR PET, and soybean protein/PET fiber were almost the same. They were 17.05%, 16.61%, and 16.70%, respectively. Since the soybean protein binding rate was very low, the main component of composite fiber was PET. Then the thermal stability of the soybean protein/PET fiber kept well.
Thermal gravimetric analysis of original and modified poly(ethylene terephthalate) (PET) fibers. NR PET: nitrated and reduced PET.
Crease elasticity
The relationships between the crease elastic recovery angles and the soybean protein binding rates are shown in Figure 9. The 0% binding rate is the NR PET fabric. The crease immediate-elastic recovery angle and the crease delay-elastic recovery angle of the original PET fabric were 307° and 315°, respectively. As is shown in Figure 9, increasing the soybean protein binding rate only caused the crease immediate-elastic recovery angle and the crease delay-elastic recovery angle to change slightly. This was because the soybean protein was only bonded onto the surfaces of the PET fibers and the main structure of each soybean protein/PET composite fiber remained PET, and because the modification processes were facile. We concluded that the modified fibers retained the crease elasticity of the original fibers.
The relationship between the crease recovery angles and the soybean protein binding rate.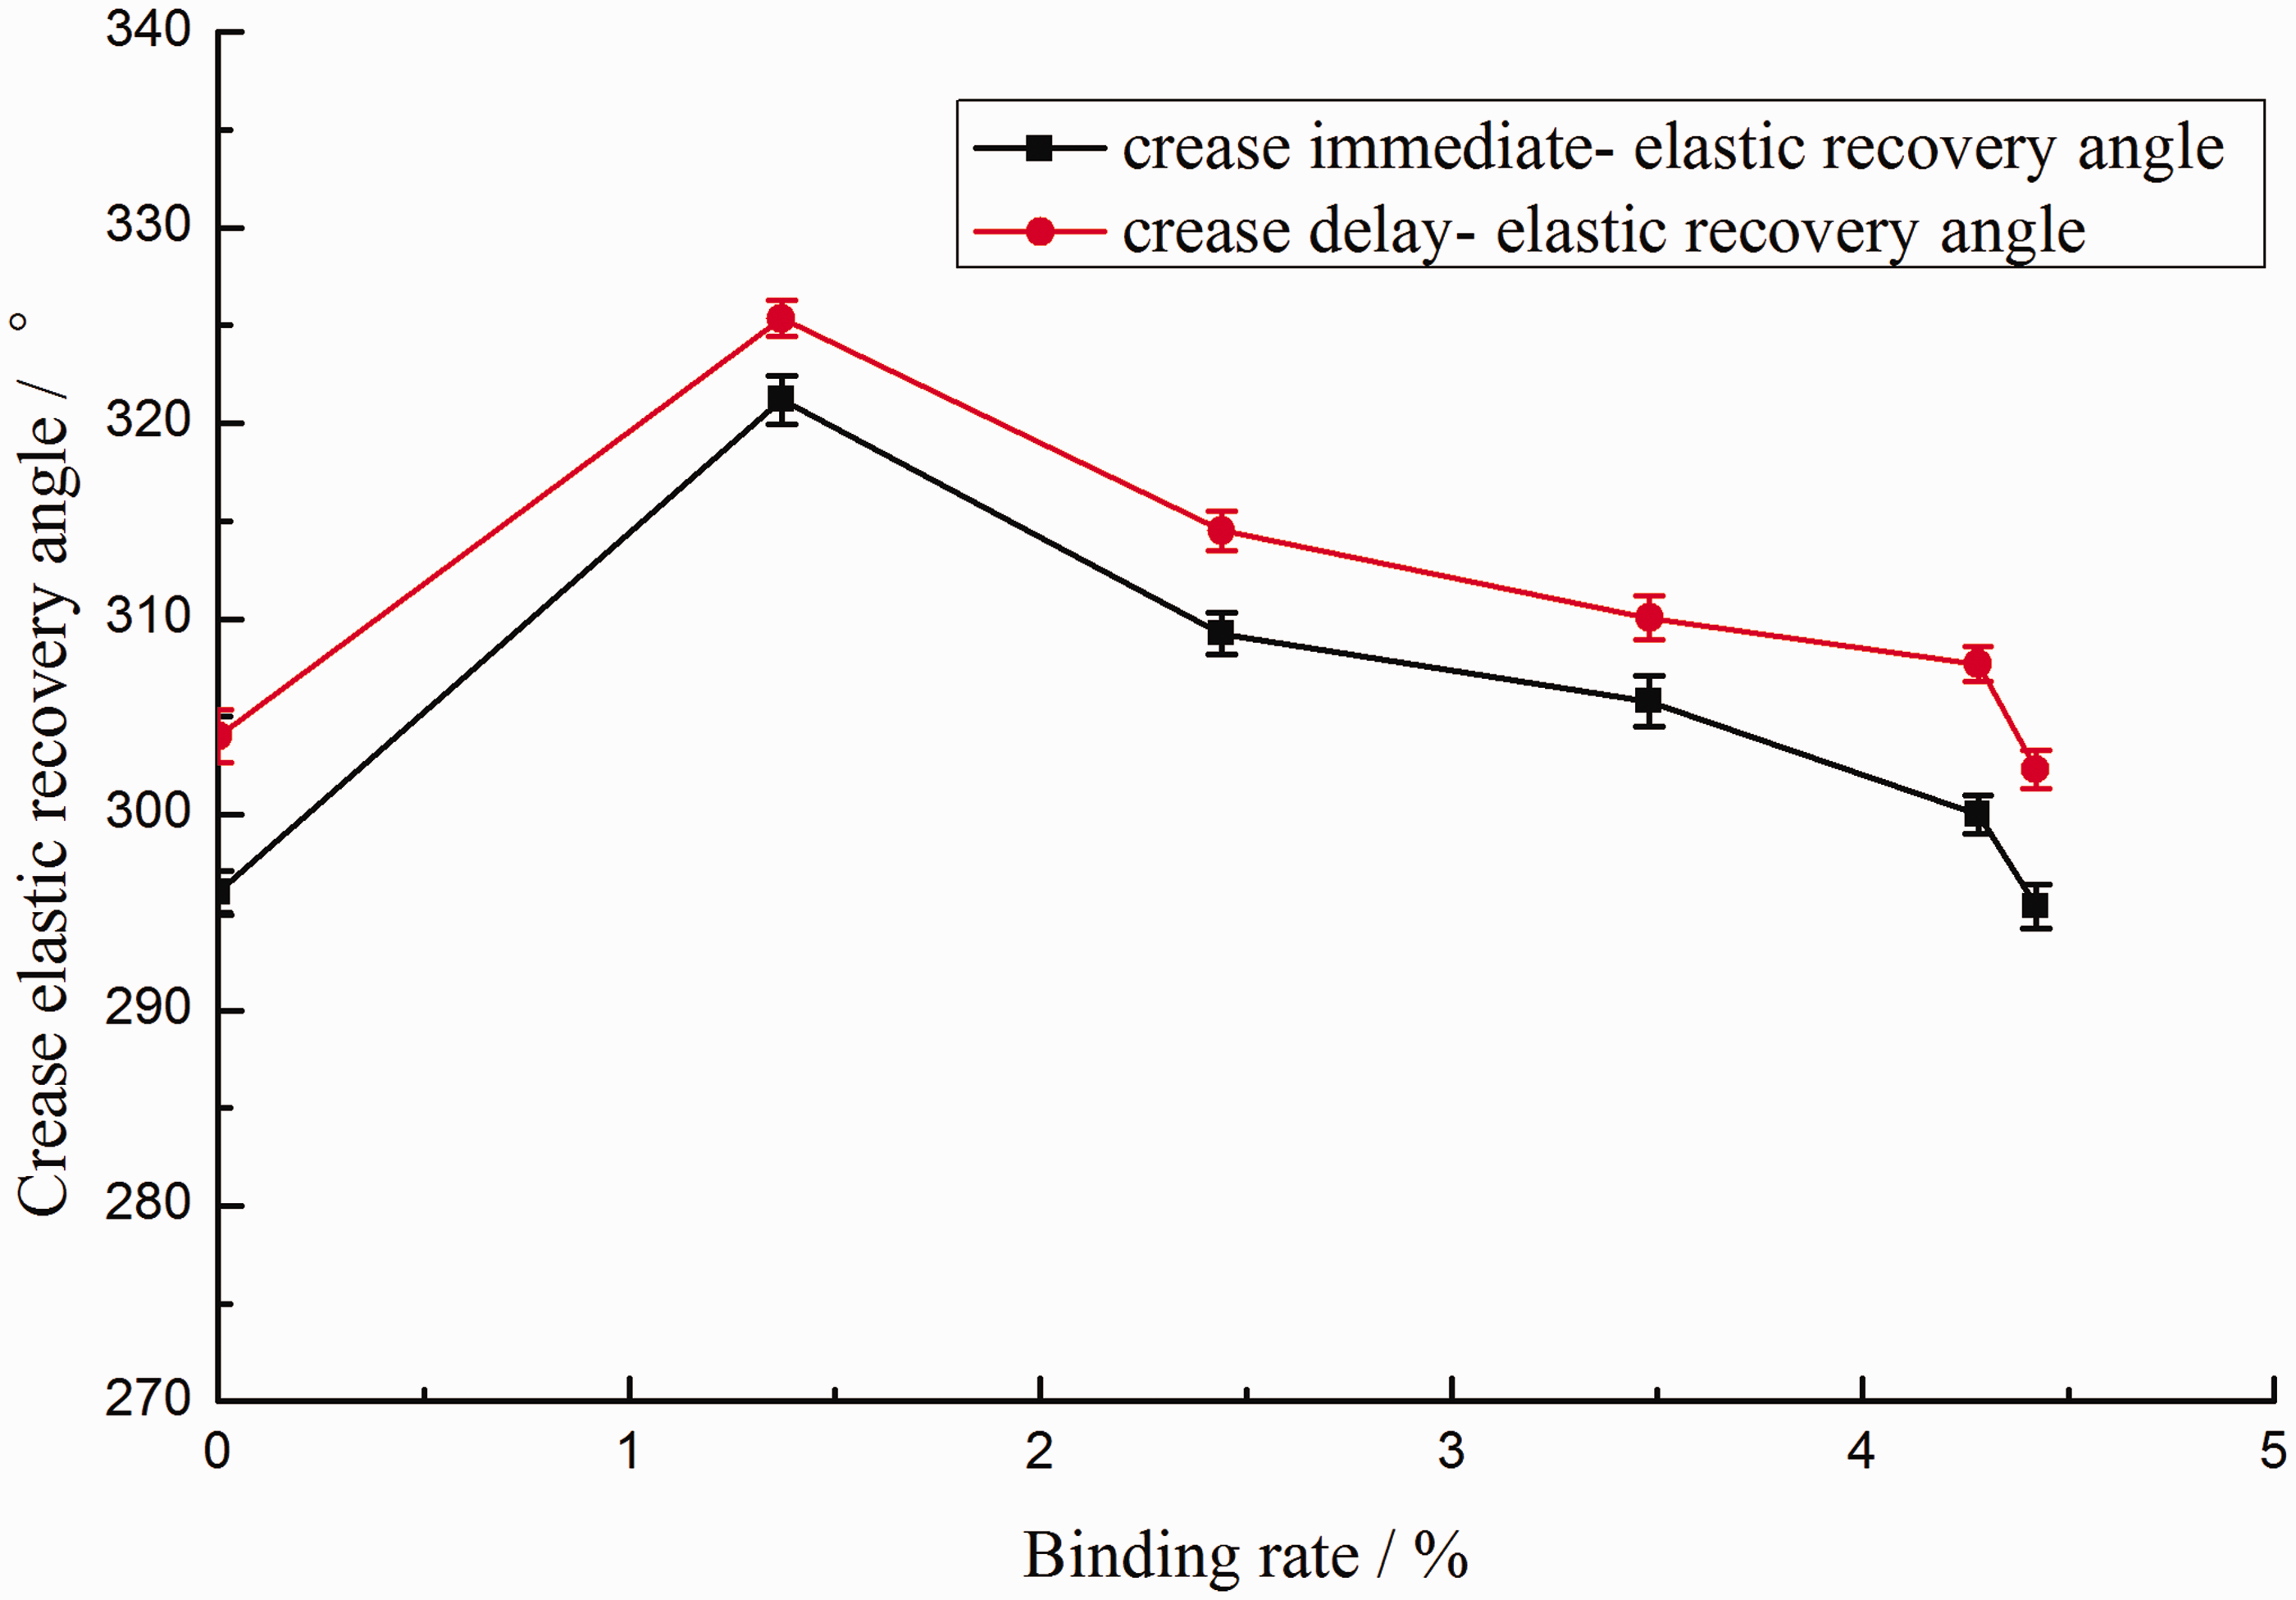
Flexural stiffness analyses
The relationship between the flexural stiffness and the soybean protein binding rate is shown in Figure 10. It can be seen that the flexural stiffness increased as the soybean protein grafting rate increased. This was because the soybean protein covered the surfaces of the PET fibers and the interactions between the –COO−, –NH3+, and –OH groups would have been relatively strong. However, it can be seen from Figure 10 that the flexural stiffness only increased slightly between a binding rate of 1% and 3%. The soybean protein binding rate generally used in the textile industry is 1–3%. Our results showed that the flexural stiffness of the original PET fibers was retained well at soybean protein binding rates of 1–3%.
Relationship between the flexural stiffness and the soybean protein binding rate.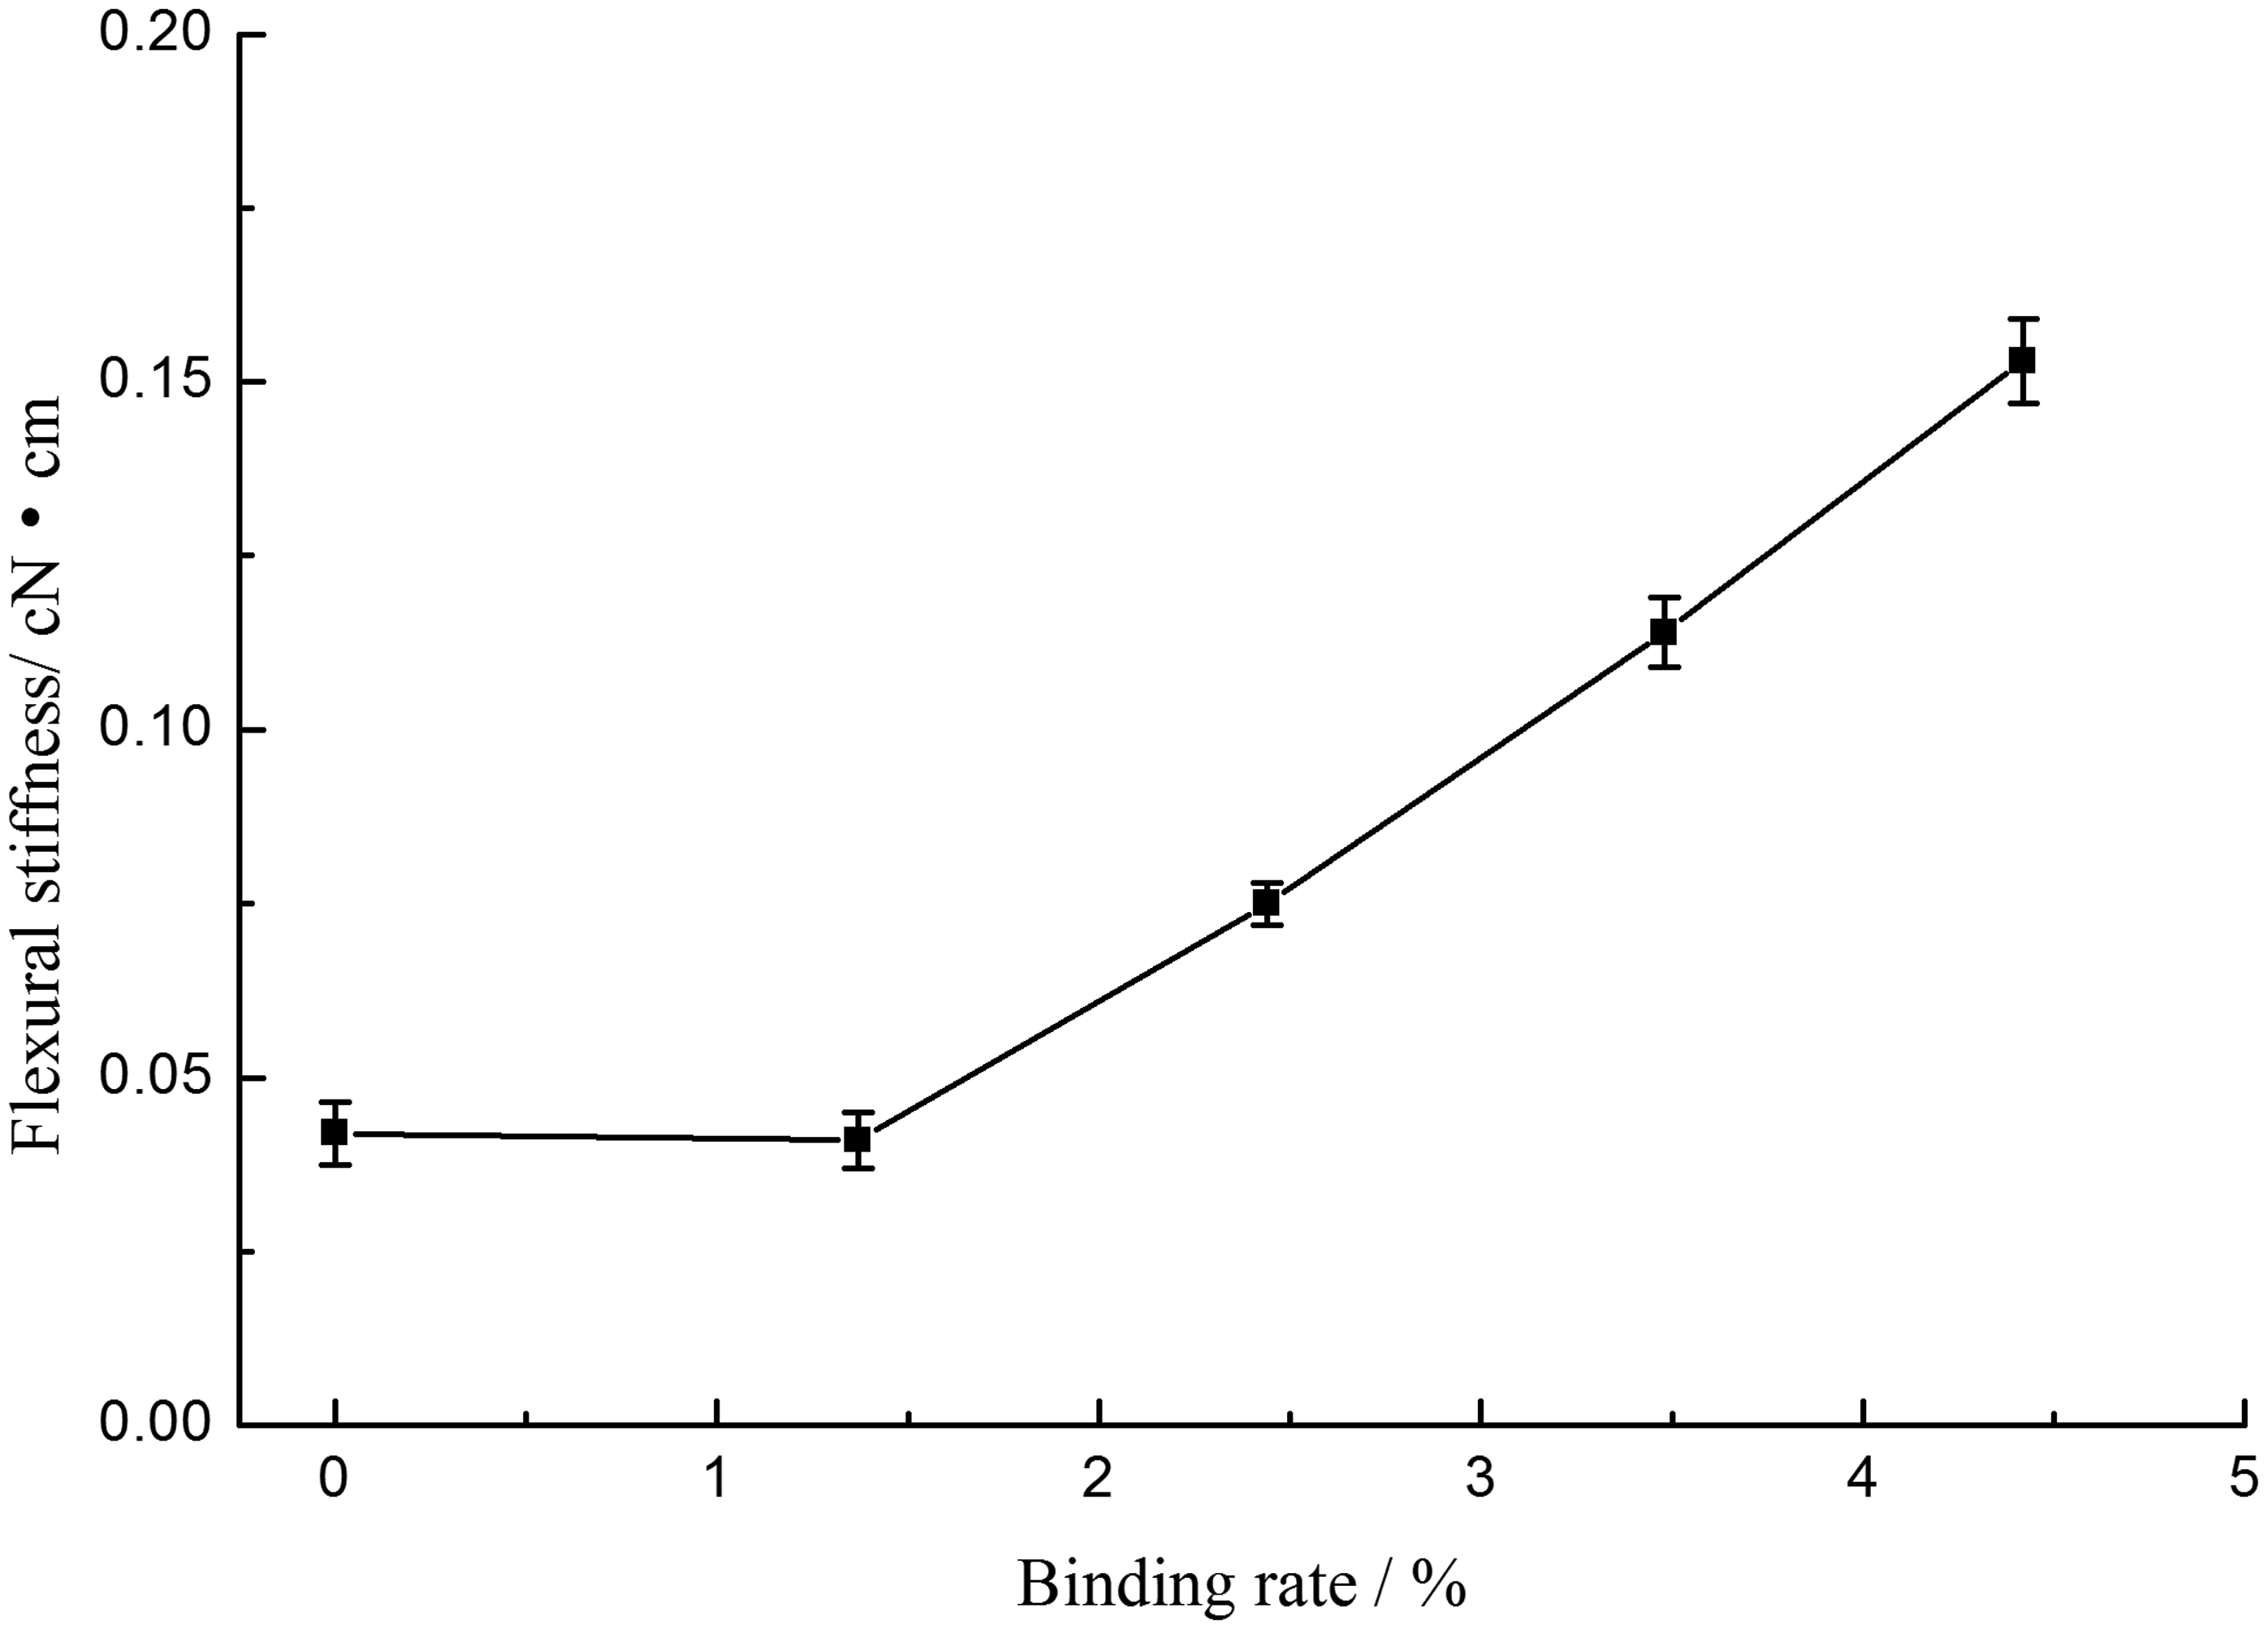
Breaking strength analyses
The breaking strengths and elongations at break of the poly(ethylene terephthalate) (PET) fabrics
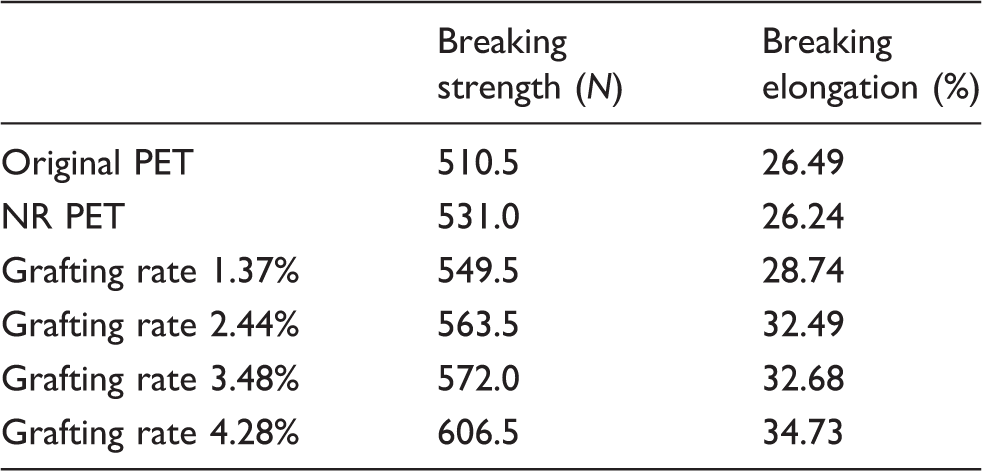
NR PET: nitrated and reduced PET.
Hydrophilicity
The water contact angles are listed in Table 4, and the images of water drops on the PET fabric before and after modification are shown in Figure 11. It can be seen that the NR PET fabric had a water contact angle of 0°, showing that NR PET fabric was hydrophilic due to the introduction of –NH2 groups. The –NH2 group is easy to form a hydrogen bond with water. The water contact angle increased as the soybean protein binding rate increased, showing that increasing the soybean protein binding rate decreased the hydrophilicity of the soybean protein/PET composite fabric. This was because soybean protein is a relatively poorly hydrophilic even though it is very biocompatible. Increasing the soybean protein binding rate meant that more –NH2 groups had reacted with the cross-linking agent and the soybean protein layer on the PET fabric was thicker; both of these factors would have caused the composite fabric to have a lower hydrophilicity. The hydrophilicity of the composite fabric with a soybean protein binding rate of 2–3% remained very good, with the water contact angle being 10–20°.
The images of the water drops on the poly(ethylene terephthalate) (PET) samples: (a) original PET; (b) nitrated and reduced PET (NR PET); (c) 1.37% grafting rate; (d) 2.44% grafting rate; (e) 3.48% grafting rate; (f) 4.28% grafting rate; (g) 4.42% grafting rate. Water contact angles of original and modified poly(ethylene terephthalate) (PET) fabrics NR PET: nitrated and reduced PET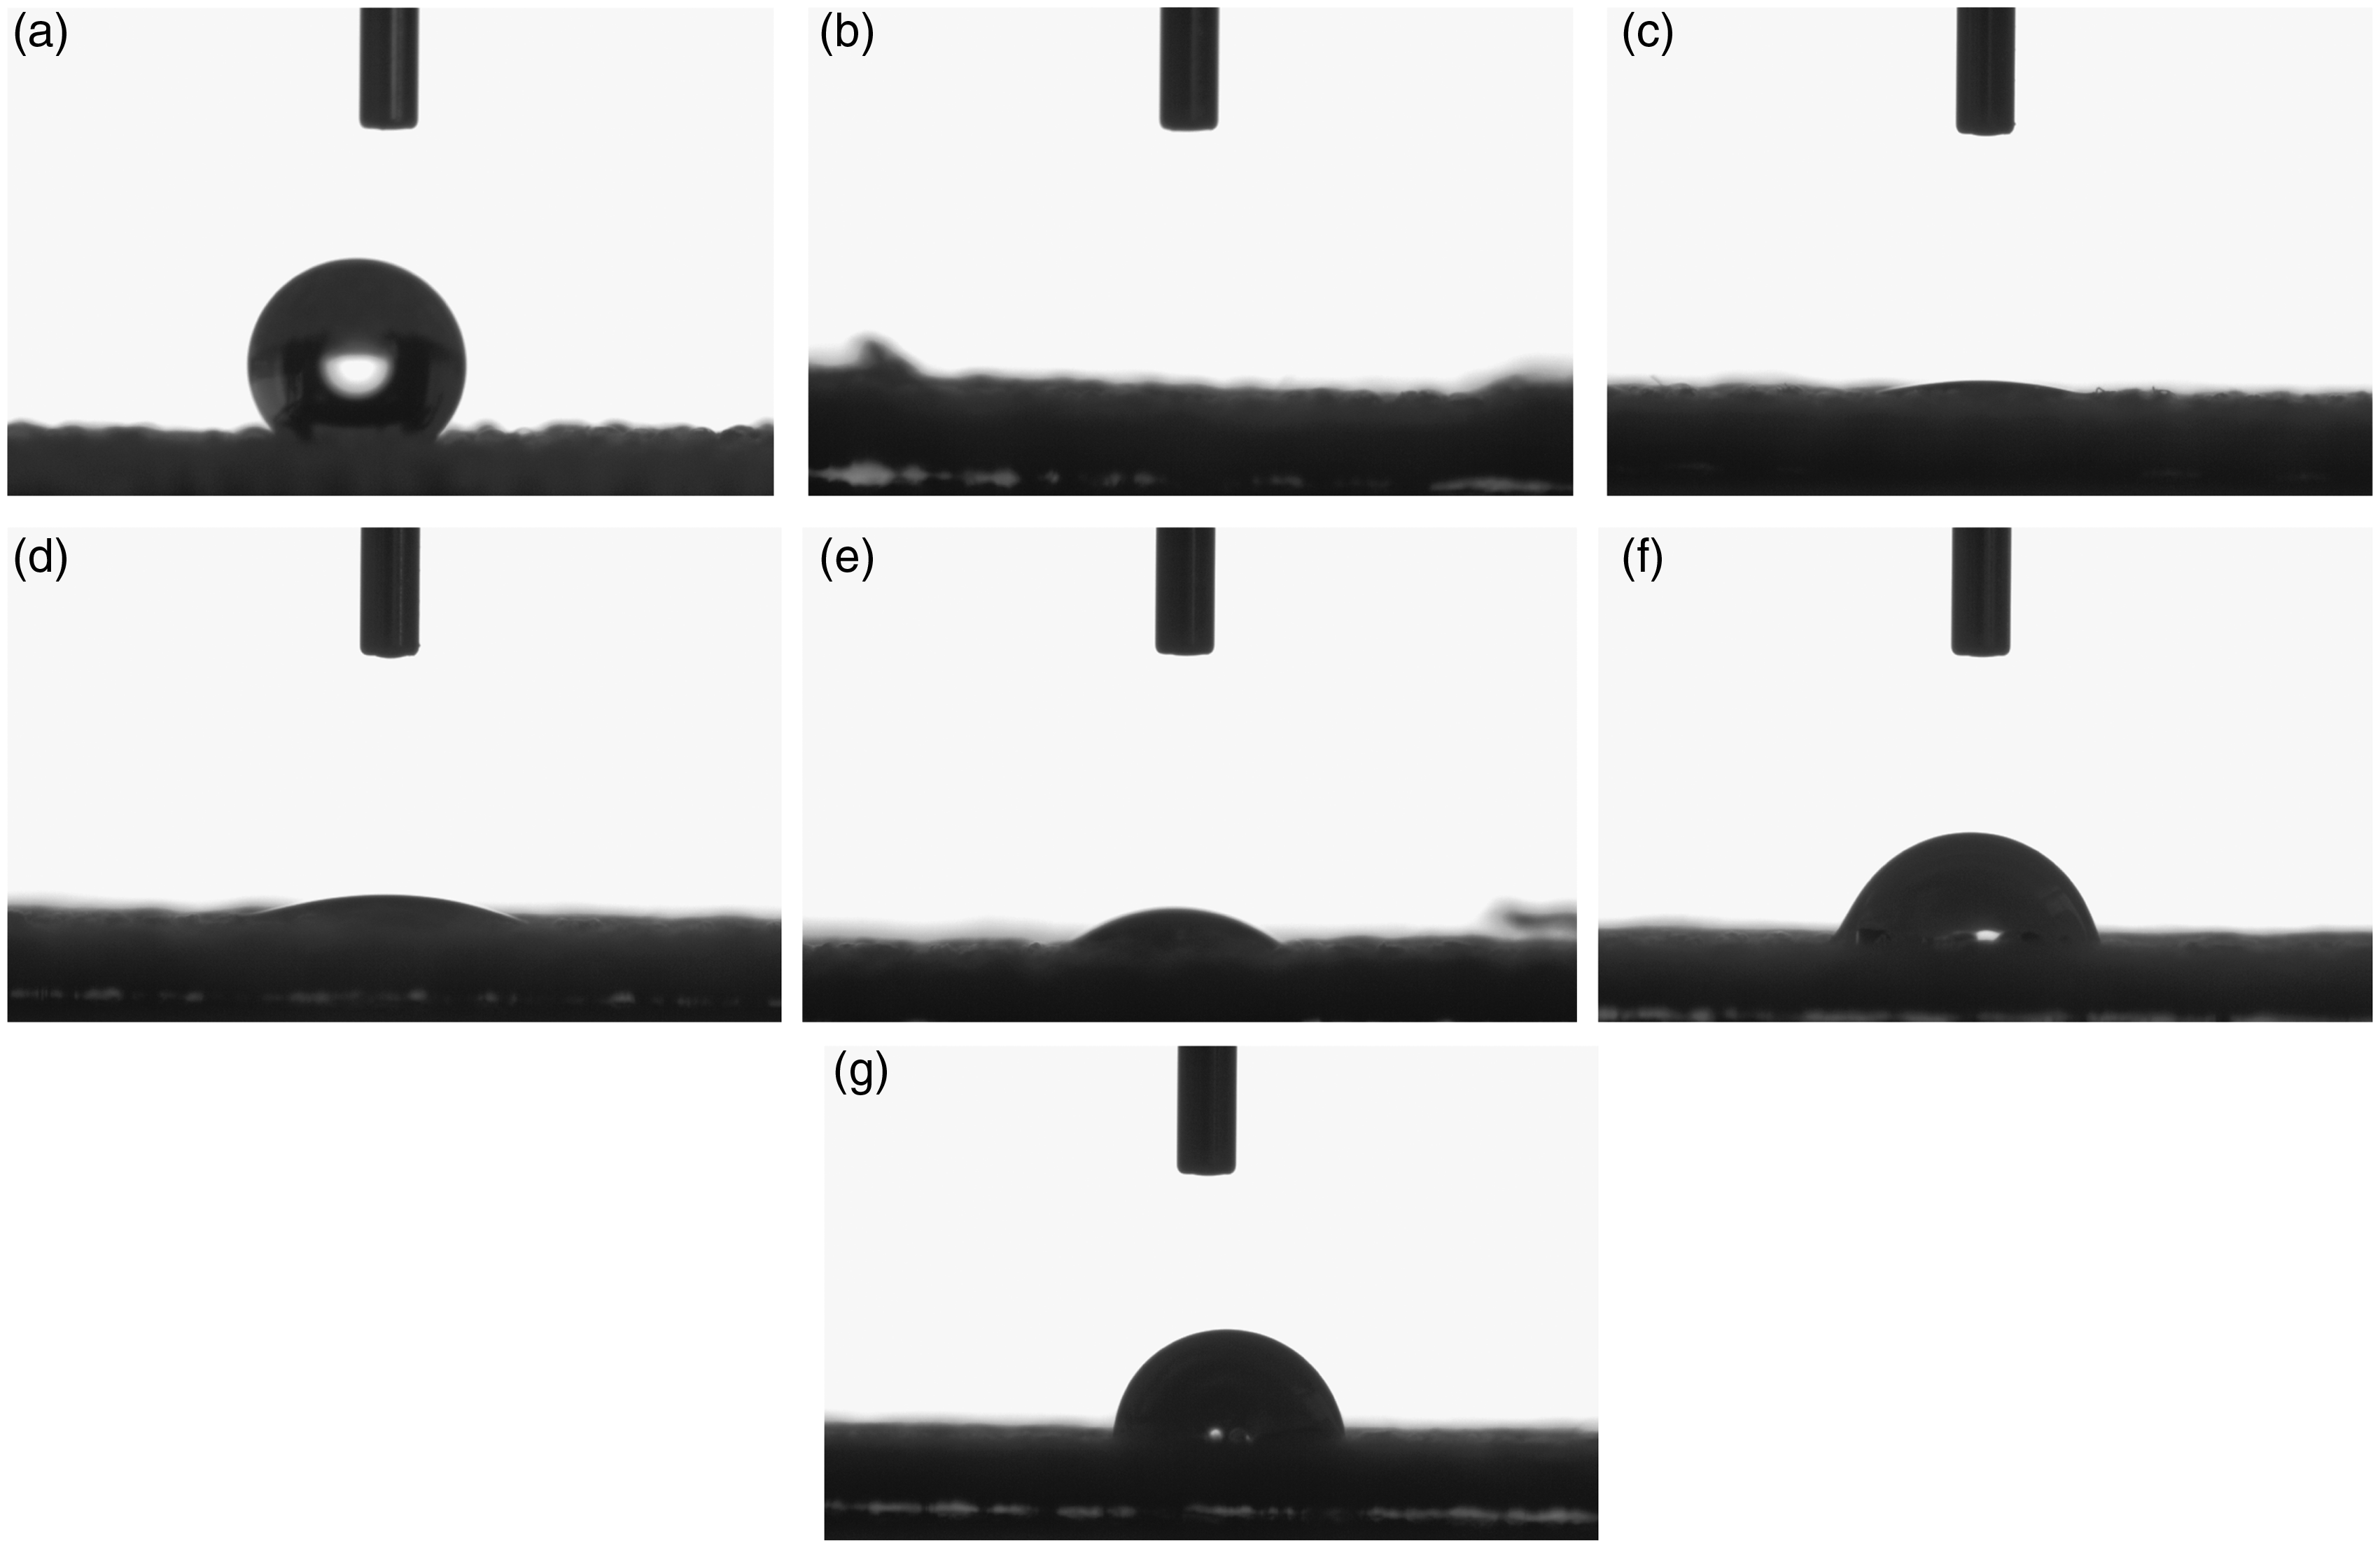

Conclusions
The facile nitration and reduction method could introduce –NH2 groups to the surface of PET fibers and make them hydrophilic. Soybean protein could be firmly bonded onto the NR PET fabric by a sucrose glycidyl ether cross-linking agent. ATR-FTIR spectroscopy and XPS indicated the NR PET had –NH2 and the soybean protein had been bonded on the PET fibers. The thermal stability, elasticity, and strength of the original PET fabric were well retained by both the NR PET and the soybean protein/PET fabric. The hydrophilicity and softness of the soybean protein PET/composite fabric were very good when the soybean protein binding rate was 1–3%. The soybean protein/PET fabric can be widely used in shirts, skirts, underclothes, and sportswear. The biocompatibility will be tested in future work.
The chemical reaction of nitrating poly(ethylene terephthalate) fabric. The chemical reaction of reducing nitrated poly(ethylene terephthalate) fabric.

Footnotes
Declaration of conflicting interests
The authors declared no potential conflicts of interest with respect to the research, authorship, and/or publication of this article.
Funding
The authors disclosed receipt of the following financial support for the research, authorship, and/or publication of this article: This work was supported by the Fundamental Research Funds for the Central Universities (grant number XDJK2013A021), the Key Application and Development Project of the Chongqing Science & Technology Commission (grant number CSTC2014yykfB50002), and the Silk Public Service Development of Commerce Department of China (project number O702-1441CITC5Y10).