
Abstract
With the use of new materials for technical textile applications, evaluation of electrical properties in accordance with the intended application is required. In this study, experimental investigations are carried out to check the electrical behavior of hybrid and non-hybrid woven structures of basalt/polypropylene, basalt/polyester, and basalt/jute fibers. Three types of weaves were used for both hybrid and non-hybrid structures. These textile fabrics were evaluated by methods of measuring surface resistance and the volume resistance. Results are discussed in terms of fiber composition and woven structure. The aim is to compare different structures on the basis of electrical properties. The purpose of this study is to identify parameters that have the strongest influence on electrical properties of fabrics.
Textiles are so important in our lives that we cannot think of living without them. They not only provide us with protection against environmental changes, alongside aesthetic appeal, but recent technological advancements have also allowed the extension of utilities beyond traditional functionality of textiles. As polymeric materials have developed, their excellent, and sometimes outstanding, dielectric properties have guaranteed their use on a broader spectrum as insulators in electrical and electronic engineering. These materials have played an important role in the evolution of electrical components and equipments. Most electrical properties are determined largely by primary chemical structure, and are relatively insensitive to microstructure. In consequence the electrical behavior of polymers is generally less variable in comparison to the mechanical behavior.1–3 The arrangement of fibers and yarns in textiles makes them, in the majority of cases, non-homogeneous and anisotropic products, hence the behavior of textile materials as dielectrics depends on the dielectric behavior of the fibers and also on the fiber forming polymers. In general, the polymers can be produced in the form of isotropic or anisotropic sheets; the measurement of dielectric properties thus becomes relatively easier. This is not always true for textile materials.4–7 The electrical conductivity of most of these polymers is so low that they are generally considered as insulators.
Conventional synthetic fibers have a specific electrical resistance ρ v = 1010–1012 Ω m. Electrically conductive fibers have a specific electrical resistance of about ρ v = 10−7 Ω m.8–10 Non-metallic textile materials located in an electric field behave as insulators.
The measurement and understanding of electrical resistance of textile material is complex in nature. For textile material: (1) uniform cross-section is not achievable and is impractical; (2) it can absorb or release moisture in the atmosphere; and (3) its structural uniformity depends on the processing parameters. It is expected that the electrical resistance of textile materials depends on the raw material, from which it has been manufactured. It also depends on the geometrical dimensions of the sample and on its structure.11–15 Textile materials always establish a dynamic equilibrium with the temperature and humidity of the surrounding air they are in contact with as the fibers are constantly exchanging water molecules with the air. However, the amount of water that a material takes until reaching this equilibrium depends on the type of material. In general, the moisture absorption changes the properties of the fabrics. Because of this, textile metrology is performed always in a conditioned environment. Water has a much higher and more stable dielectric constant (ε r = 78 at 2.45 GHz and 25℃) than textile fabrics, whose dielectric constant is generally in the range ε r = 1–2 because of their high level of porosity. Due to porous structure, fabric has more trapped air, which is bad conductor of electricity. When textile fibers absorb water they swell transversely and axially, causing tightening of the fabrics.16–18 the swelling of the fibers also contributes to the change of the dielectric properties, as swollen fibers decrease the porosity of the fabric. As fabrics are porous materials that allow the transmission of energy and mass, they are interesting materials for different functional applications.
The use of hybrid woven structures improves the overall property of fabric by combining positive aspects of dissimilar fiber components, thus making it more functional than the individual fiber.19,20 Basalt is a natural origin fiber with promising environmental friendliness. This study is based on novel hybrid woven fabrics of basalt with other thermoplastic and thermoset yarns. This opens the possibility of a new class of hybrid materials that have the advantages of organic and inorganic components. With superior electrical resistance, such hybrid structures can replace the existing polymeric materials used in electrical appliances. The influence of fabric structure and porosity is investigated in detail, so as to understand the interaction of structural parameters in determining electrical performance on the surface as well as in the volume.
Material and methods
Materials
The polyester (PET) and jute yarns used in this study were available commercially. Polypropylene yarn was supplied by Synthetic Ltd. (Pakistan) and the basalt yarn used was received from Kamenny Vek (KV) company, Russia.
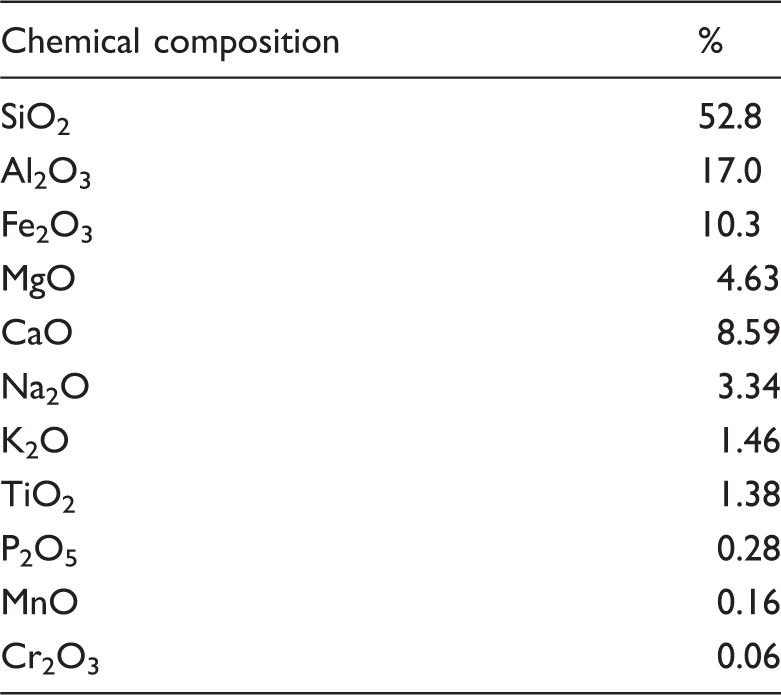
Chemical composition of basalt fiber
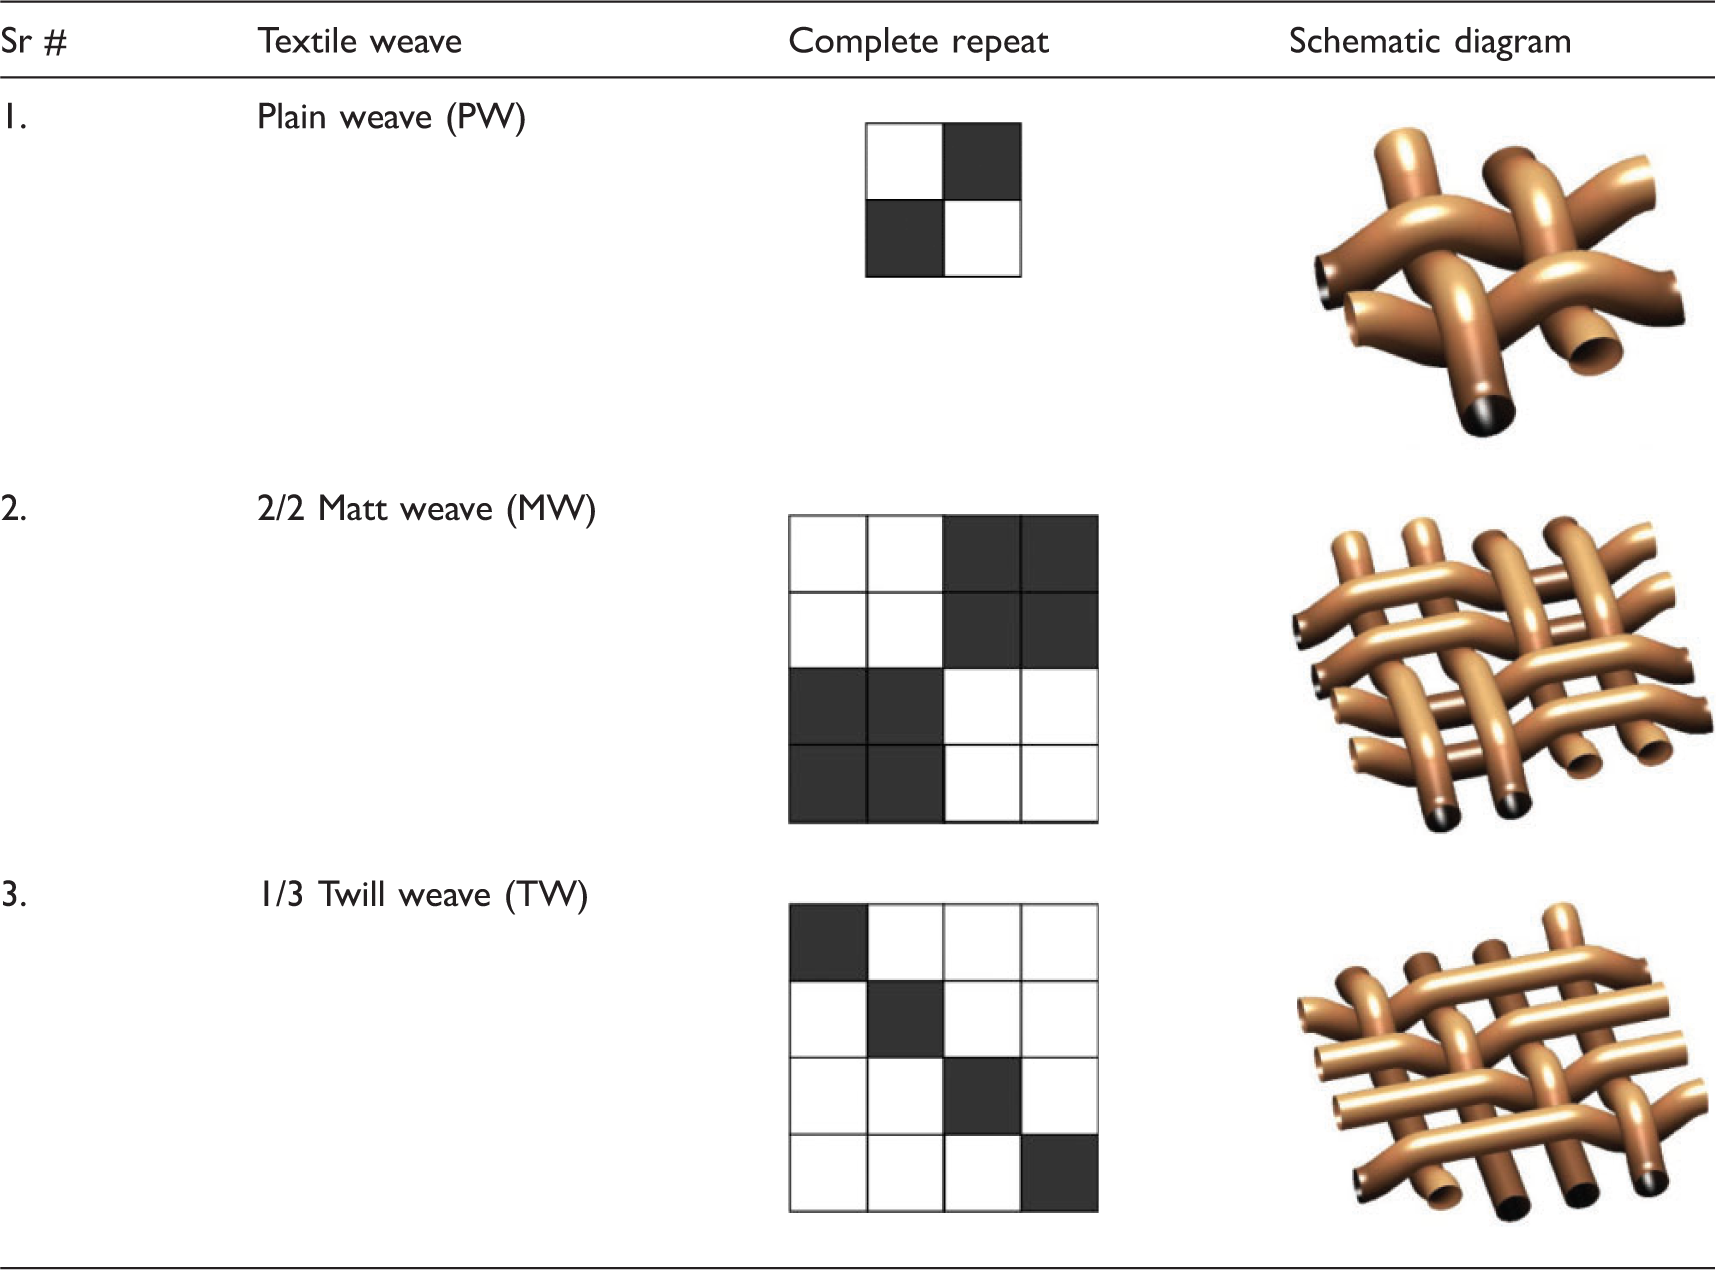
The structures of fabrics developed were: (A) plain weave: (a) hybrid basalt/PP, (b) basalt/PET, and (c) basalt/ jute; (B) matt weave: (a) basalt/Polypropylene (PP), (b) basalt/PET, and (c) basalt/jute; (C) 1/3 twill weave: (a) basalt/PP, (b) basalt/PET, and (c) basalt/jute. Non-hybrid fabrics were also made from all of these yarn types (basalt, PET, PP, and jute) and in the three different weaves (plain, matt, twill). All samples were made on the CCI rapier (CCI TECH INC.) loom with the same parameters and sett of fabrics, 12 threads/cm in warp and 8 threads/cm in weft. All the fabrics were woven under similar technological conditions.
Methods
The fabrics used in the study were stored in a conditioning room under standard atmospheric conditions (20 ± 2℃, 65 ± 2% Relative Humidity (RH)) for 24 h. All the fabric parameters were measured in the range of the basic structural parameters: the real warp and weft density, mass per unit area, and fabric thickness, according to standardized procedures. The fabric thickness was obtained using UNI-Thickness Meter (MESDAN, Italy). Measurement was done at different positions; the probe with a disc delivers a pressure of 1 kPa over an area of 1000 mm2 and the thickness is obtained in mm. Ten readings were obtained and an average was statistically computed.
Fractional porosity was calculated from physical densities of fabrics and fibers, while the number of pores can be deduced from the number of interlacing points given by warp and weft yarn density, i.e. as the product of measured warp and weft densities. 21
Calculation of fractional porosity
The fractional porosity (volume porosity) is calculated by the following formula
W = areal density of fabric (kg/m2) t = thickness of fabric (m) Dwarp and Dweft are set of warp and weft, respectively (m−1) Twarp and Tweft are fineness of warp and weft yarns, respectively (Tex) dwarp and dweft are diameters of warp and weft yarns, respectively (m)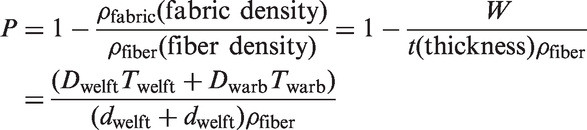
The average density of the hybrid composition is calculated based on ratio of the component fibers. The weave determines the interlacement pattern, which ultimately affects the nature of pores and fabric volume porosity.
Electrical properties
In most cases, the very high values of resistance in textile materials cannot be measured using a common ohmmeter. A special device is required for this purpose. The resistance of textiles is usually extremely high, especially if they are produced from synthetic fibers.
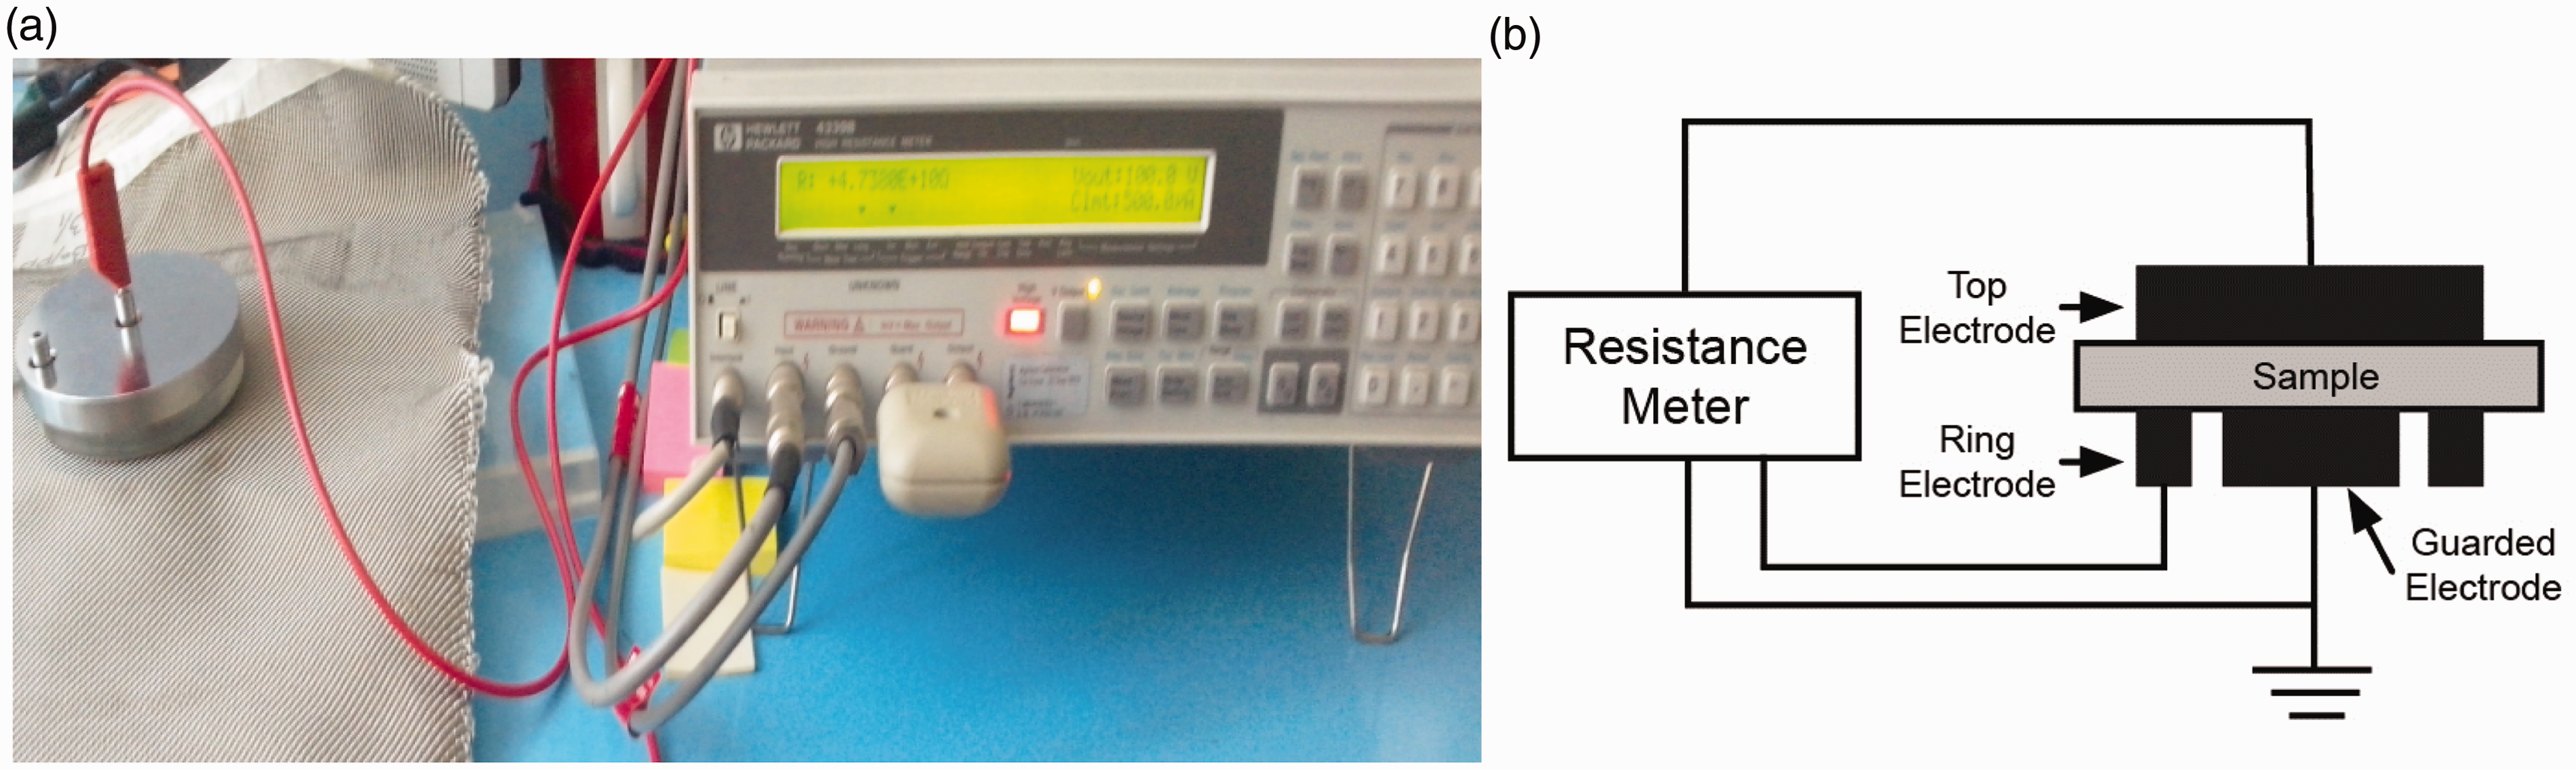
Electrical resistance measurement was done on a measuring device (ohmmeter) 4339B High Resistance Meter (Hewlett Packard). Calibration of instrument (high resistance meter) is done with standard plates of known electrical resistivity.
Textile materials always establish a dynamic equilibrium with the temperature and humidity of the surrounding air they are in contact with as the fibers are constantly exchanging water molecules with the air. However, the amount of water that a material takes until reaching this equilibrium depends on the type of material. In general, the moisture absorption changes the properties of the fabrics. Because of this, textile metrology is performed always in a conditioned environment.
The insulation resistance of dielectric materials decreases both with increasing temperature and with increasing humidity. Volume resistance is particularly sensitive to temperature changes, while surface resistance changes widely and very rapidly with humidity changes. In both cases the change is exponential. For some materials a change from 25 to 100℃ may change insulation resistance by a factor of 100,000, often due to the combined effects of temperature and moisture content change; the effect of temperature change alone is usually much smaller. A change from 25 to 90 % relative humidity may change insulation resistance by as much as a factor of 1,000,000 or more. Insulation resistance is a function of both the volume and surface resistance of the specimen, and surface resistance changes almost instantaneously with change of relative humidity. Therefore, it is absolutely essential to maintain both temperature and relative humidity within close limits during the conditioning period and to make the insulation resistance measurements in the specified conditioning environment. Therefore all experiments were limited to real conditions of temperature and relative humidity.
The electrical surface and volume resistivity of the samples developed were measured according to the standard ASTM D257-07 (2007) at the voltage of 100 V, at a temperature of 22.3℃, and relative humidity of 40.7 %. Results of measurement were recorded after 60 s from the moment of placing the electrodes on the textile sample. Volume resistivity was measured by applying a voltage potential across opposite sides of the sample and measuring the resultant current through the sample.
22
Volume resistivity ρv (Ω m) was calculated from the following equation

Surface resistivity is measured by applying a voltage potential between two electrodes of specified configuration that are in contact with the same side of a material under test (see Figure 1). Surface resistivity ρ
s
(Ω m) was calculated from equation
(a) Resistivity measurement system and (b) schematic diagram of an experimental set-up to measure electrical resistance.
23

Statistical analysis of results
The method chosen to analyze each test data sets is a subset of Analysis of Variance (ANOVA). This method is called the Tukey Test or the Tukey-Kramer HSD (Honestly Significantly Different) Test, and is well suited to look into the data in order to compare the samples and determine the real difference which exists therein. This test is an exact alpha-level test when the numbers of replications are all the same within the set of fabrics tested.
The MATLAB program was used to analyze data by linear regression models and ORIGIN Pro 8 was used to analyze the data by one way ANOVA. All the data were analyzed and found to be fitting the linear regression model. The goodness of fit (coefficient of determination, R2), were also calculated.
Results and discussion
Properties of fibers and yarns.

Fabric structures developed.
At least two or three types of pores will be present in most fabric constructions. The fabrics having plain weave construction consist entirely of Type 1 pore structure. Pore volume and shape of two fabrics woven with identical yarn diameter and yarn spacing will vary depending on the manner of interlacing of the threads. The pore walls are not flat and their cross-section changes with the fabric thickness with respect to the type of pores, type of yarns and their characteristics (see Figure 2).
Four types of pores in woven fabric (a) planar way (b) on the graph paper.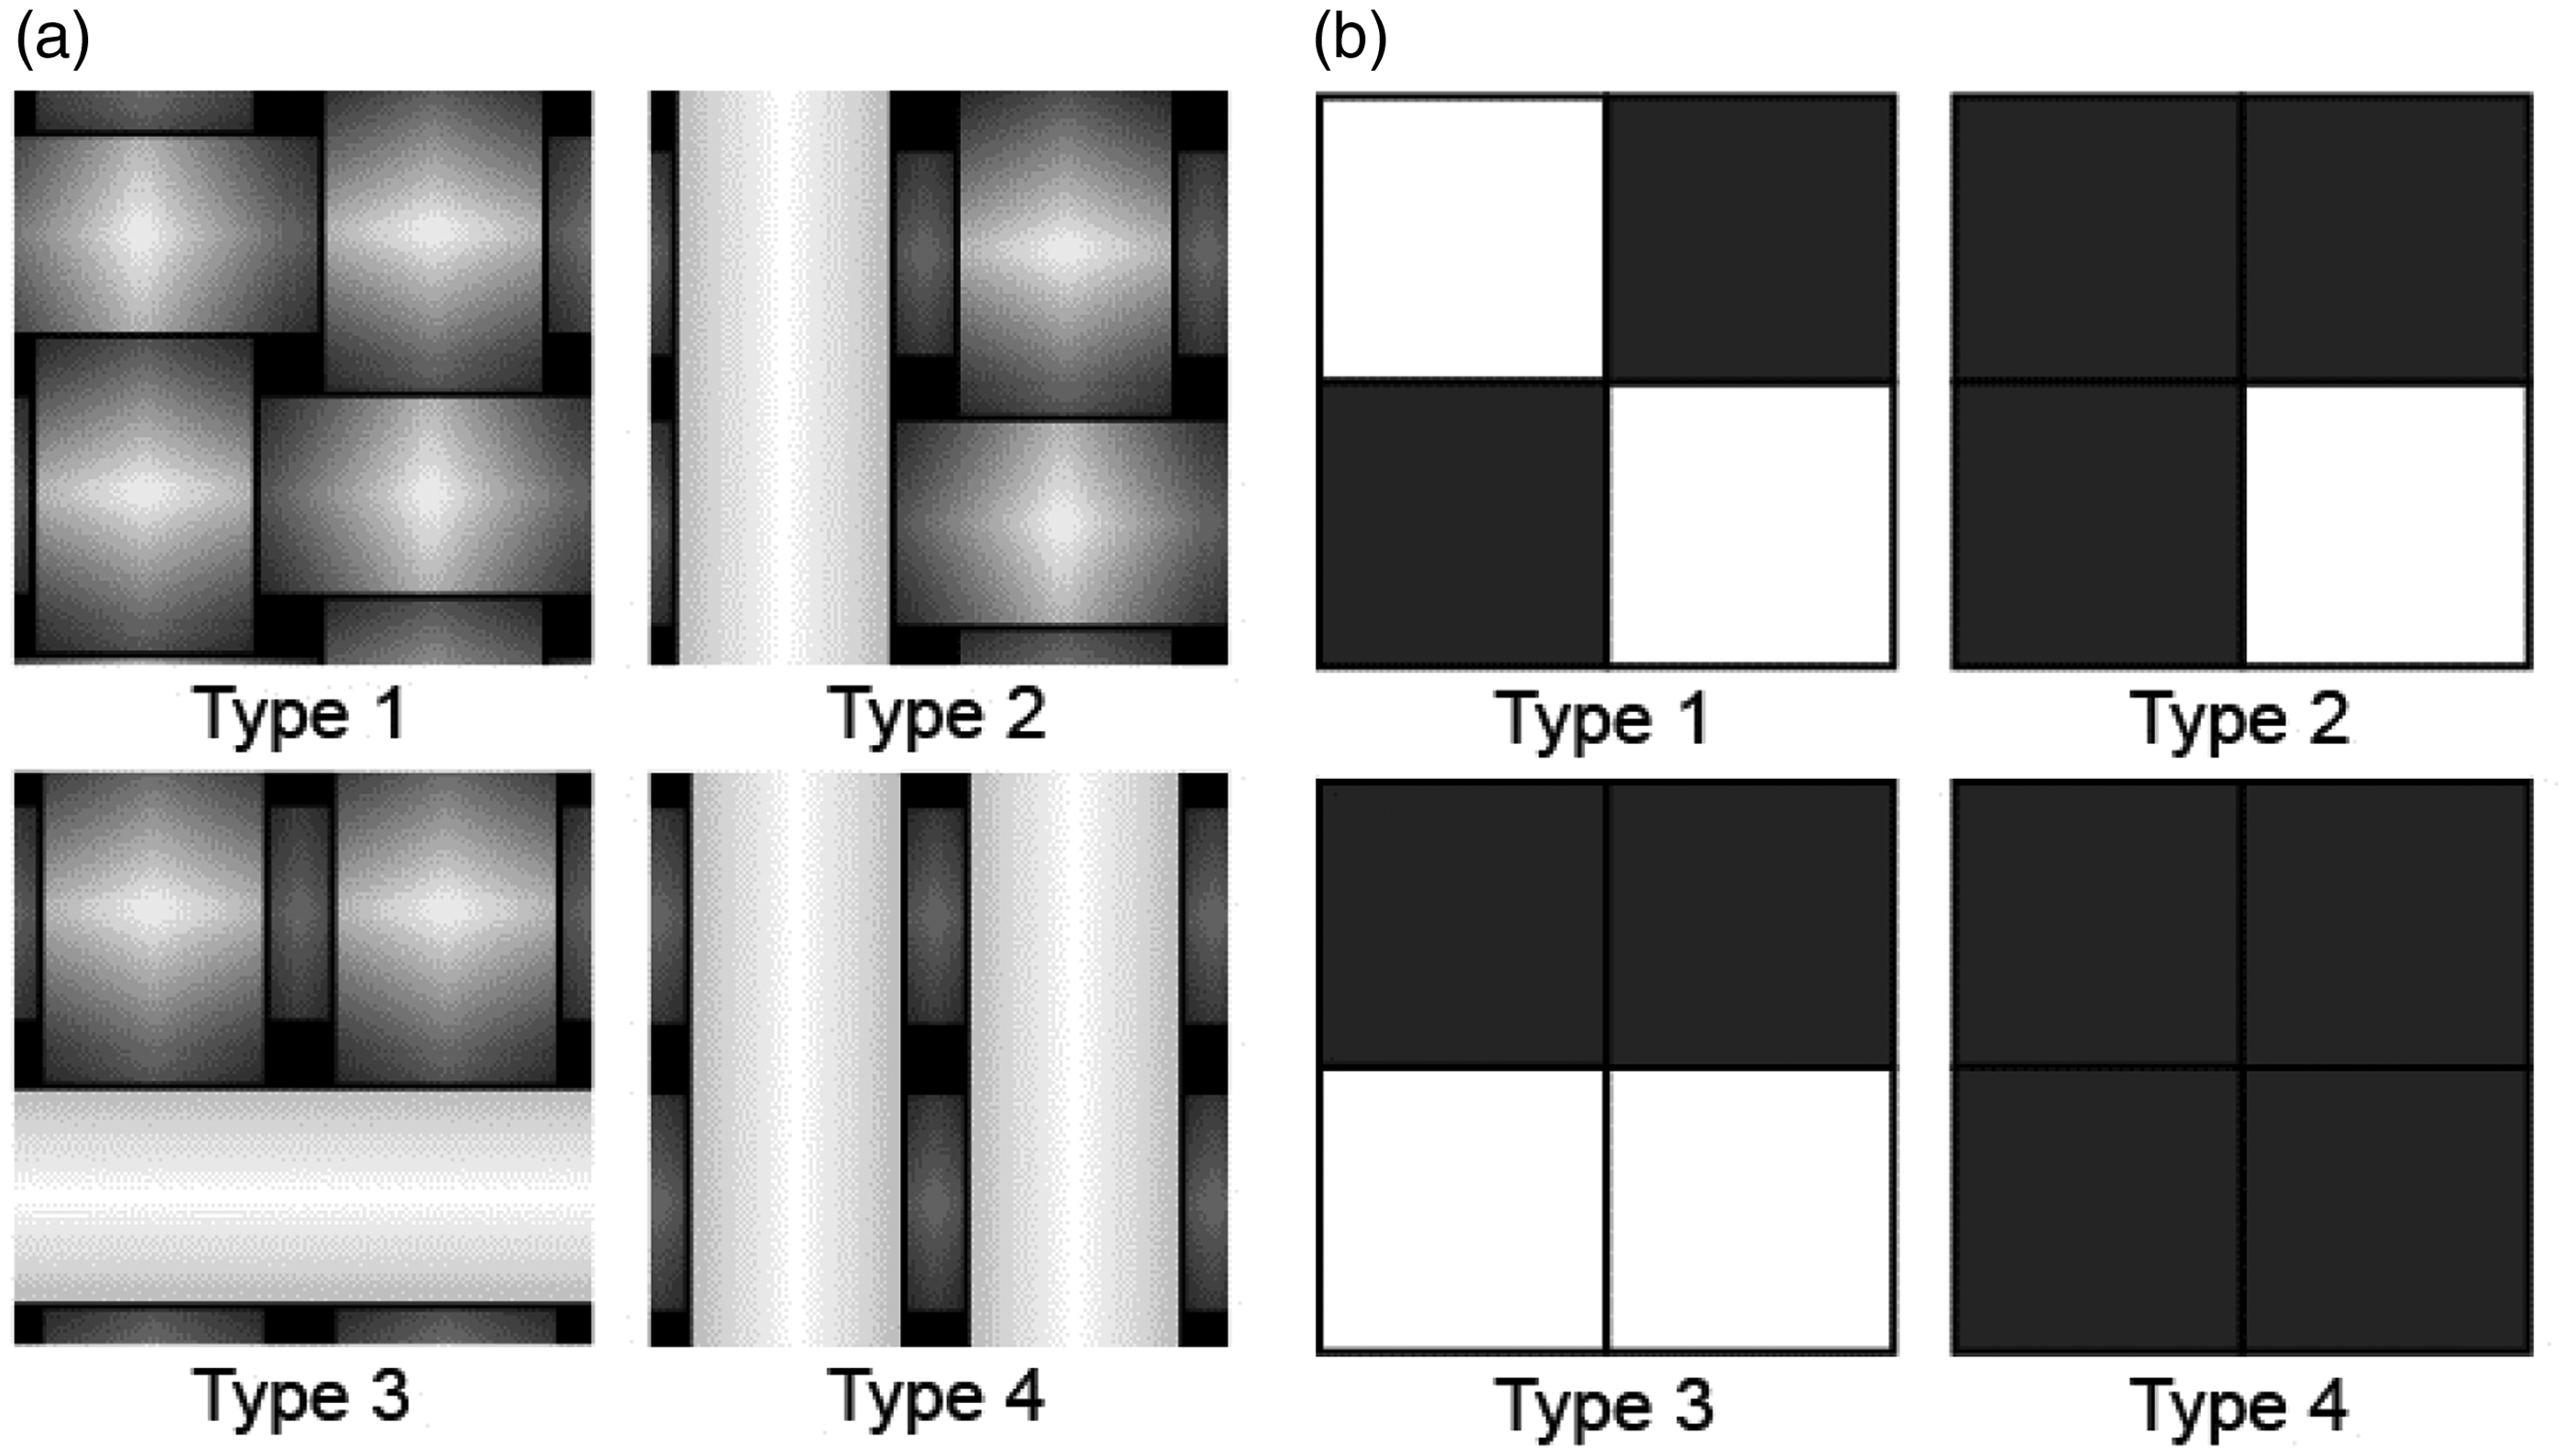
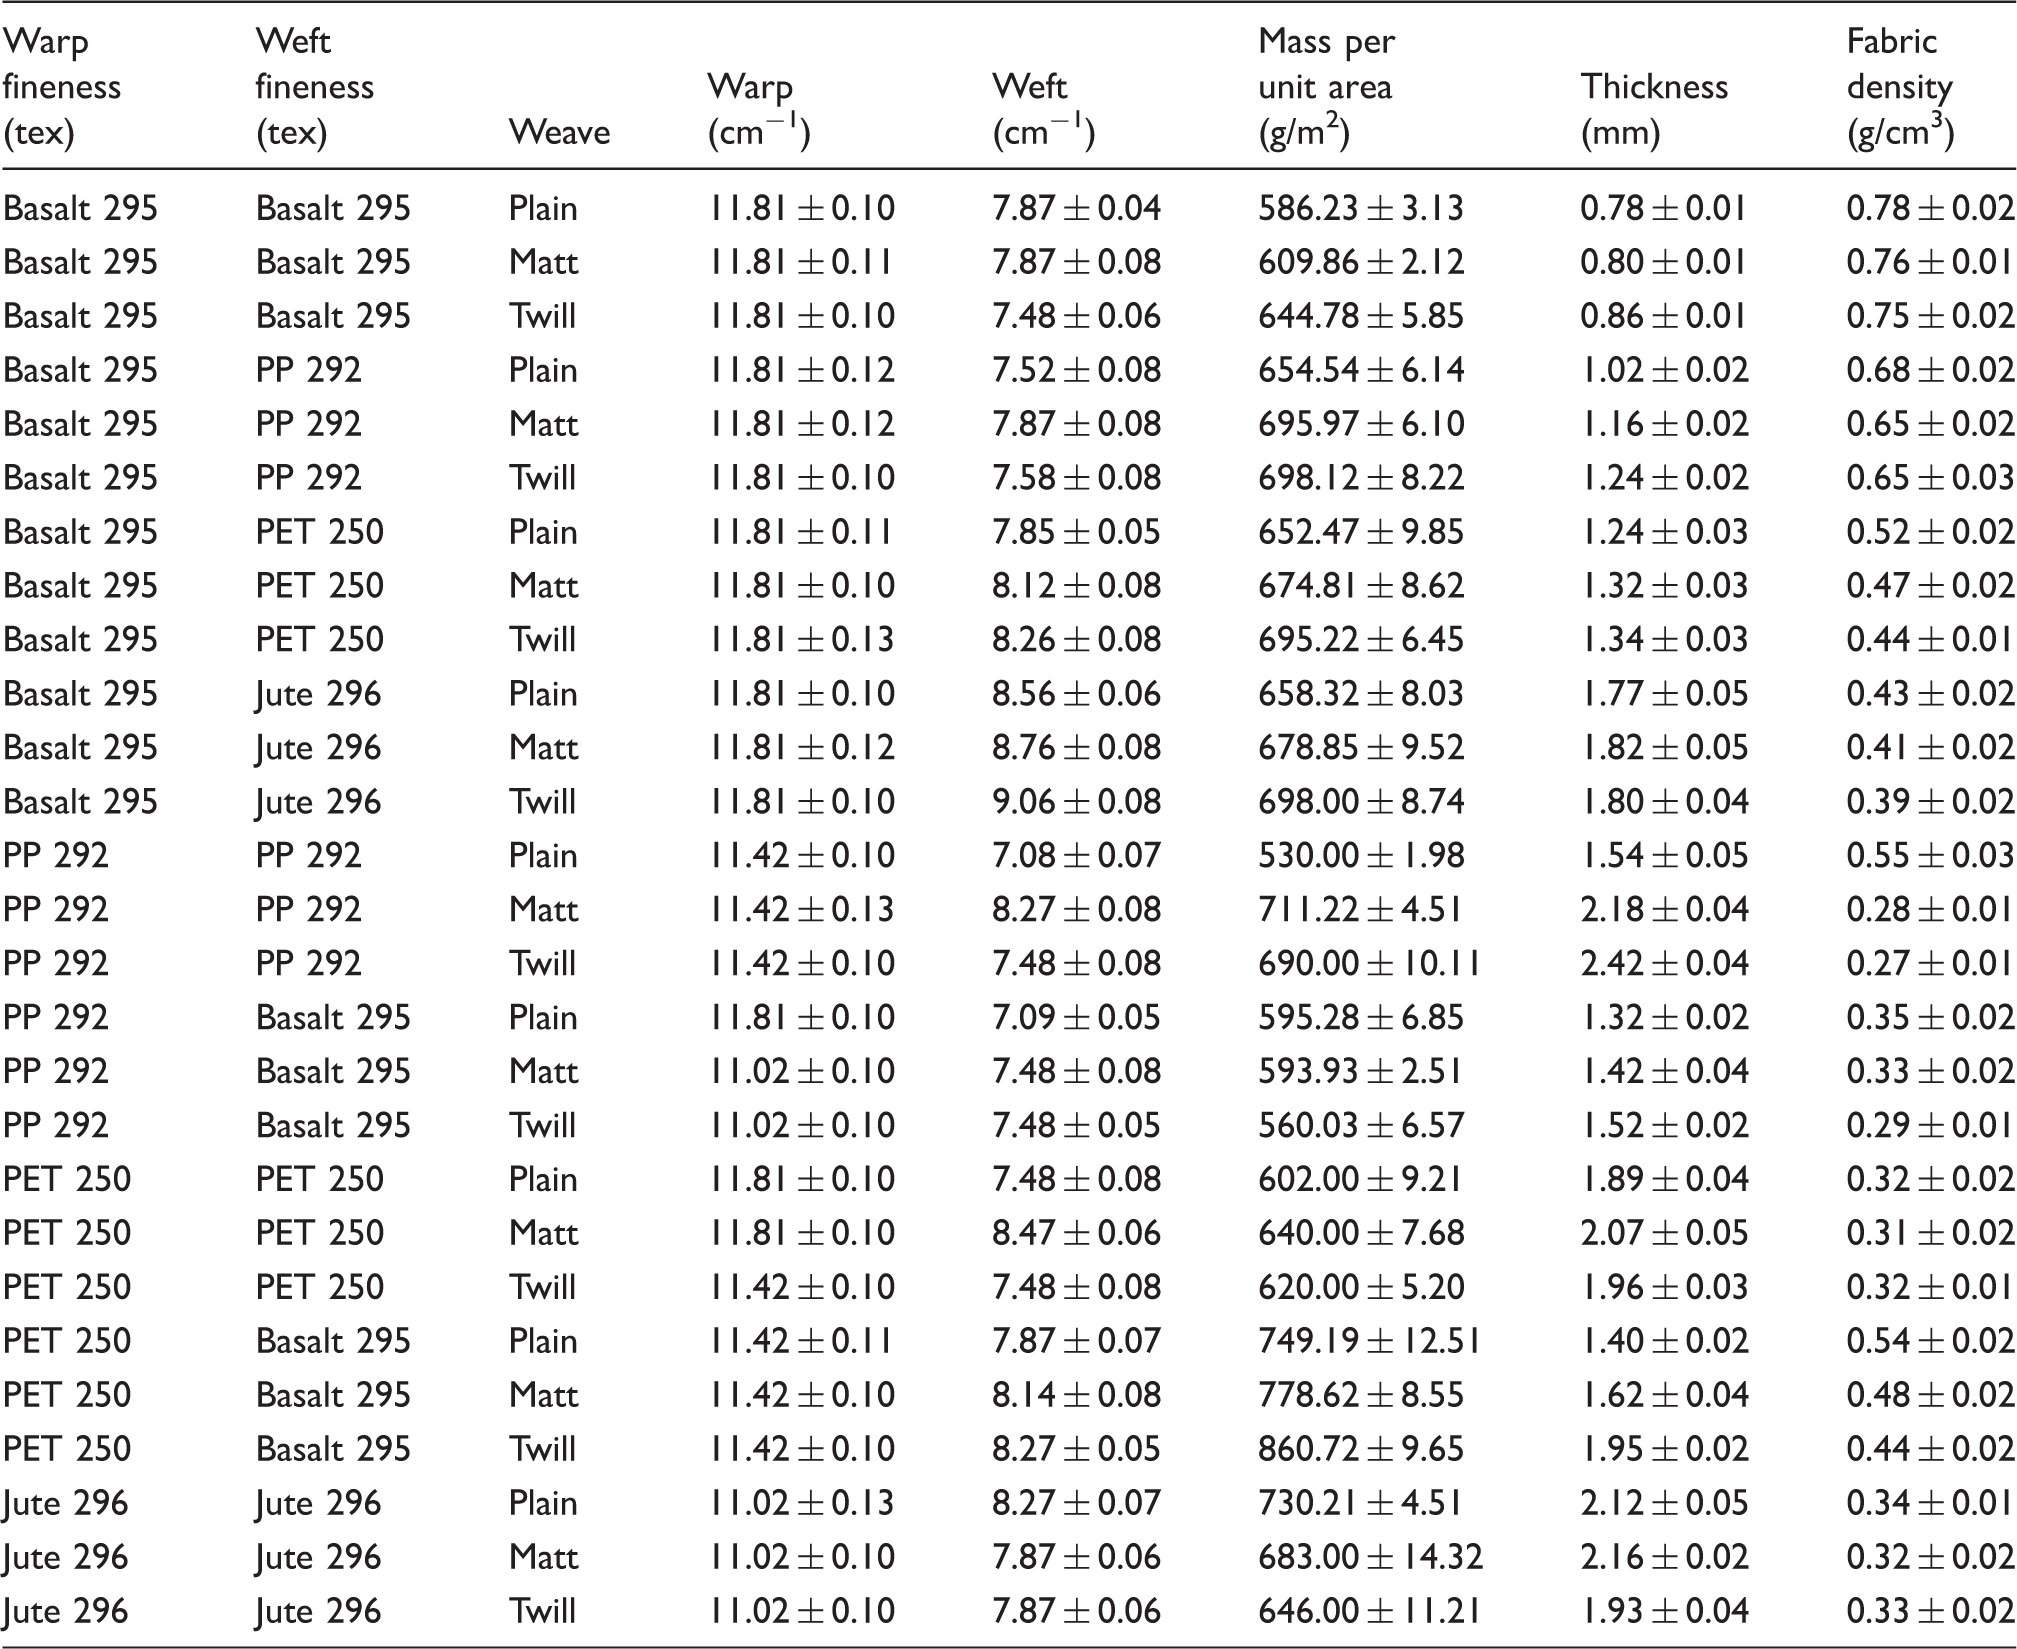
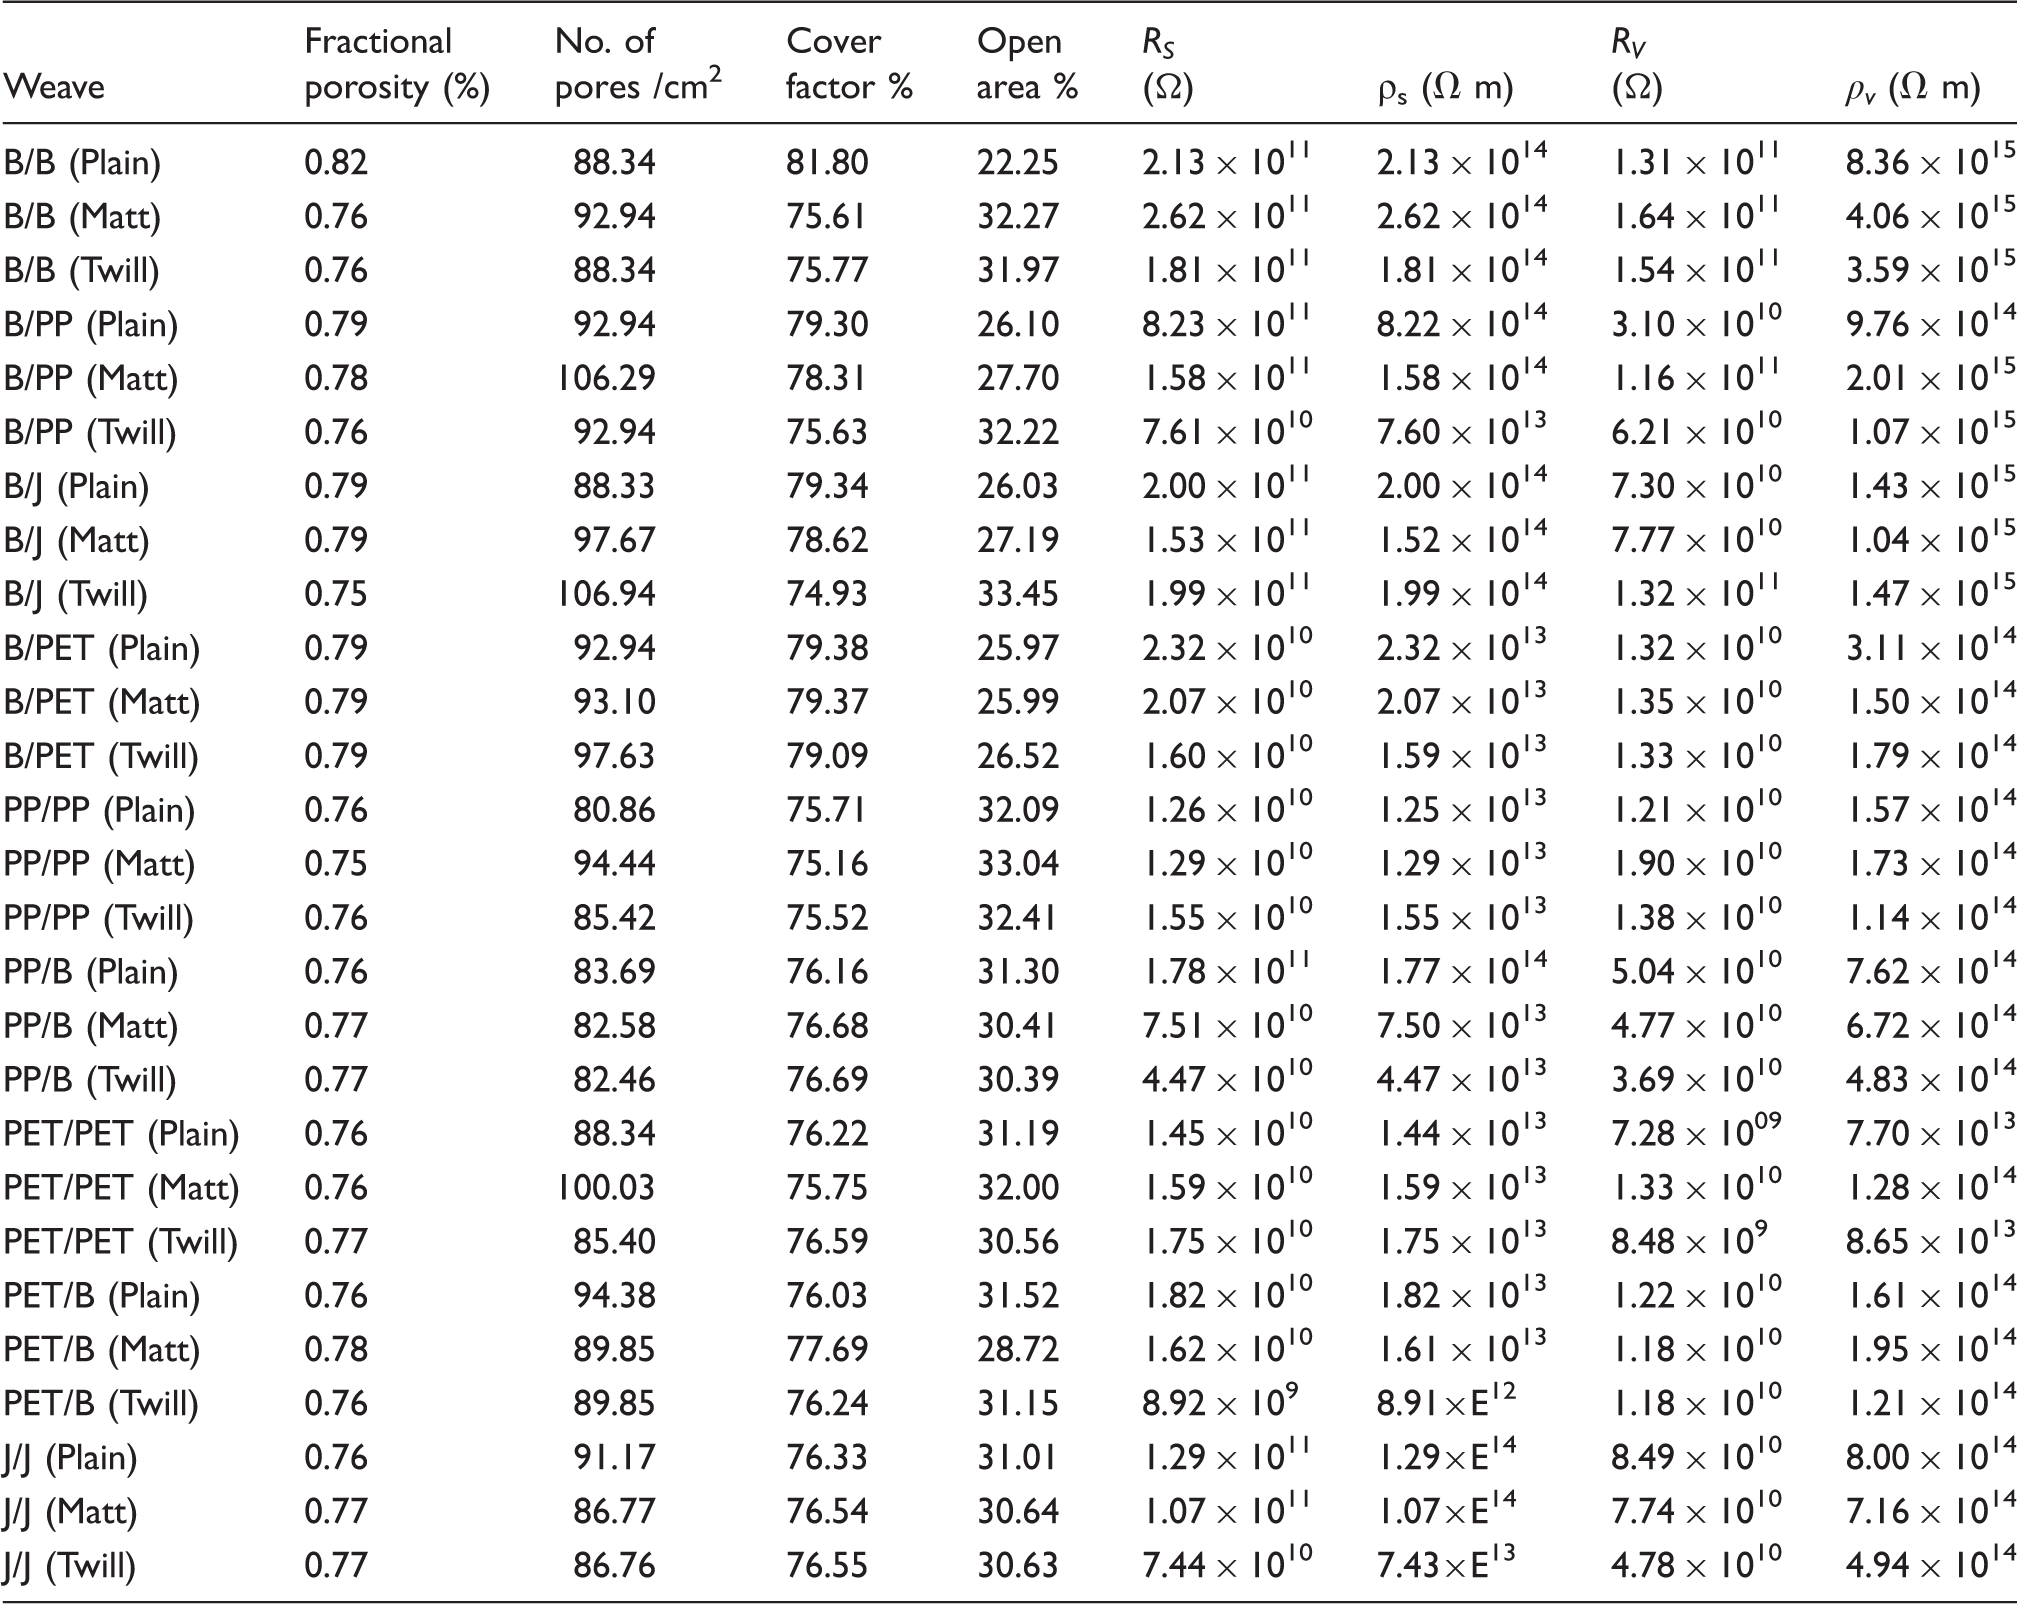
Figure 3 shows the actual images of samples developed. The construction parameters and physical properties are given in Table 4, and in Table 5 the average values of volume and surface resistance, volume and surface resistivity, fractional porosity, number of pores per unit area, cover factor, and open area % are given. All the discussion is based on the results of measured volume resistance as it gives a more accurate value of electrical resistance of fabric because of different interlacing structures related to the thickness of the fabrics.
Photographs of the structures developed with magnification 1280 × 1024. Construction parameters and measured physical properties of fabrics. Calculated porosity and measured resistance of samples.
Because the samples do not contain any additional surface modification, surface resistance (which indirectly describes ability to conduct an electric current on the surface) should not be significantly different as compared to the volume resistance (which indirectly describes ability to conduct an electric current through the bulk of the material) and in addition there should be a relation between these two characteristics.
Dependence between volume and surface resistance is shown in Figure 4 (logarithmic scale for both axes is used). It can be seen that samples with higher surface resistance have higher volume resistance. This phenomenon was expected based on previous theory and literature. Generally, when any special modification of sample surface is used, an increase of volume resistivity of the sample (caused by material composition and structural changes) is accompanied by an increase of surface resistivity under the same environmental conditions.
Dependence between volume resistance and surface resistance.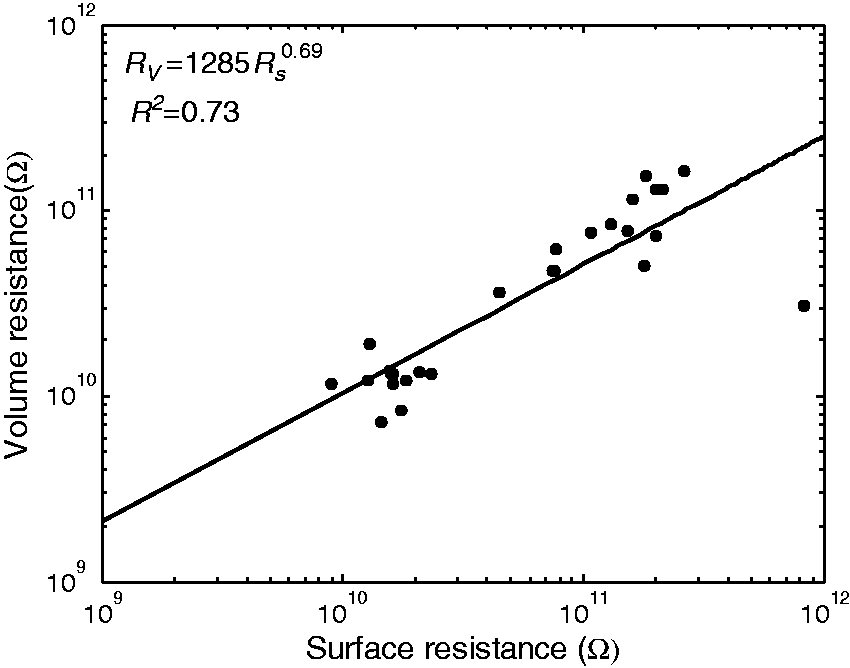
Volume resistance increases with increasing surface resistance and this relation can be approximated by power function. The solid line in this graph corresponds to the power regression model with parameters obtained by the minimizing sum of squared errors. Corresponding coefficient of determination R 2 = 0.73 indicates the good quality of fit. As in surface resistance, only surface pores are considered, so accurate results are not obtained, and also if a hybrid structure with unbalanced float is used, this effect can be more irregular. Therefore, for further investigation only volume resistance was used.
Figure 5 shows overall electrical resistances (mean values and 95% confidence intervals) of all samples under investigation. It can be seen that the highest electrical resistance is shown by 100% basalt samples with twill and matt structures. There is no statistically significant difference between electrical resistances of twill and matt weave of B/B samples. On the other hand, statistically significant difference can be observed between samples with different material composition having the same weave pattern.
Volume resistance of all samples tested.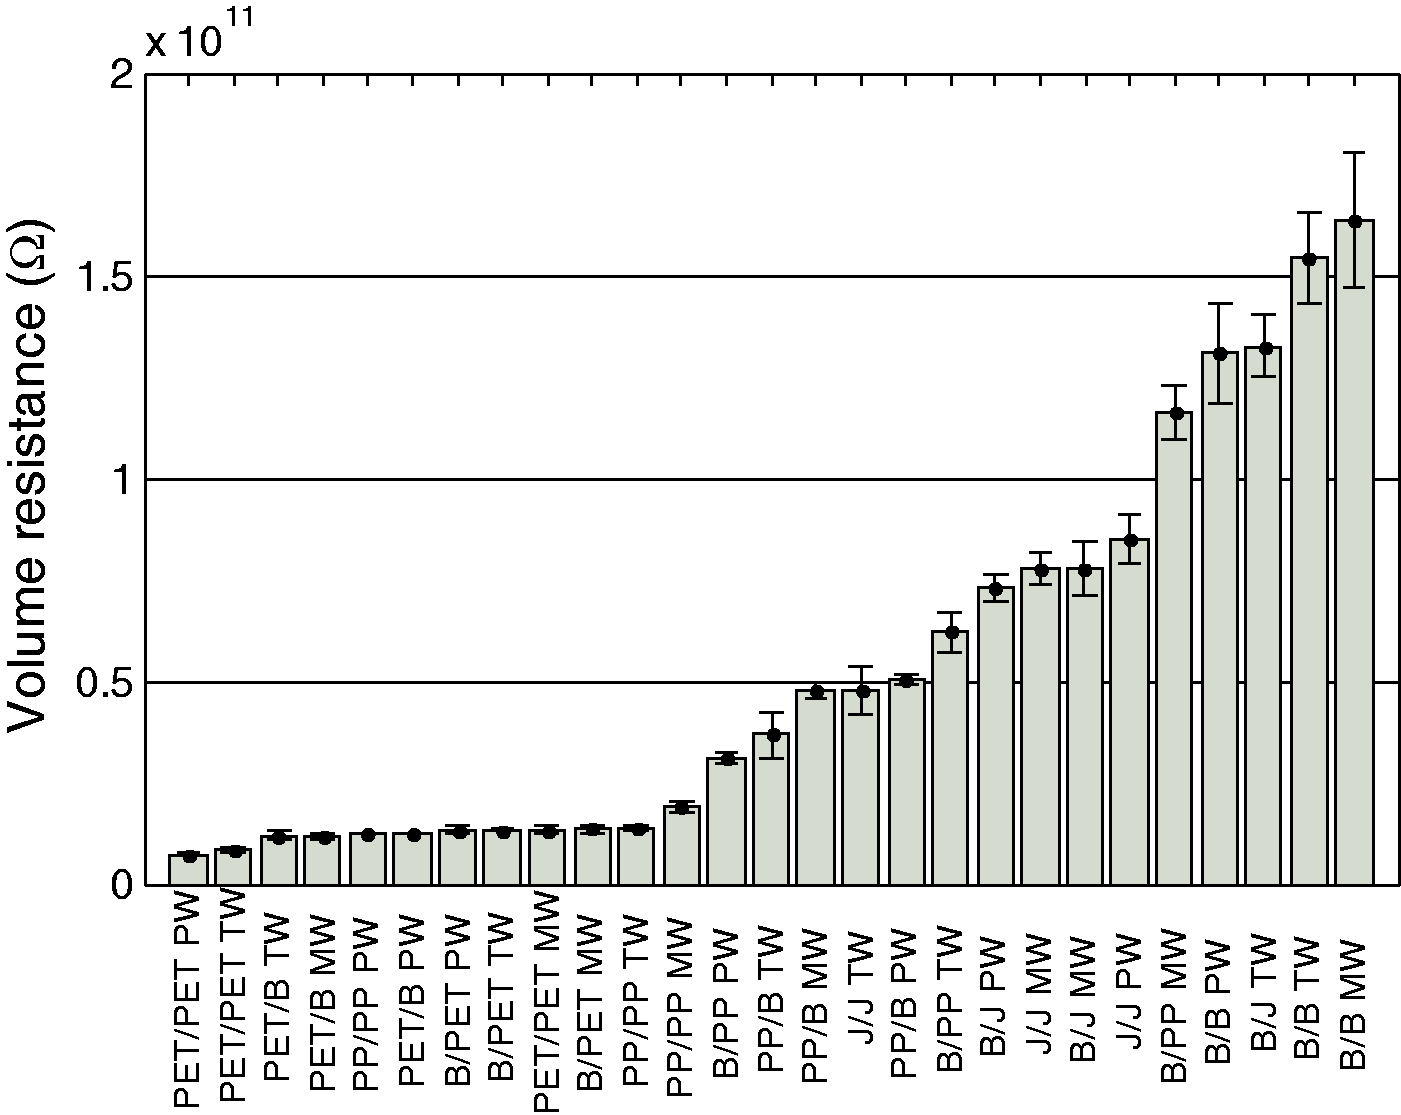
The electrical resistance values of the fabrics are mainly determined by the presence of air in the interstices, i.e. between the binding points of woven fabric. Air is a bad conductor of electricity, showing resistivity at 20℃ ranging from 1.3E+16 Ω m to 3.3E+16 Ω m. Plain and matt weaves belong to a group of similar weaves, but the floats of yarns is different by direction: in plain weave, no floating takes place, in matt weave, two floating of each yarn in both directions, and in twill woven samples there is floating over three consecutive yarns. The investigated samples differ with respect to the type of pores formed between the interlacing points. It is evident that plain weaves have only one type of pore while matt weaves and twill weaves have three types of pores.
This effect is also evident from Figure 6(a), where mean values and 95% confidence intervals of sample resistances are grouped according to the identical material composition. Based on exploratory data analysis, it can be summarized that structure (weave pattern) has statistically significant effect on the resulting resistance, especially for samples where one of the components is basalt and the second component is basalt, polypropylene, or jute. Plain woven structures have the lowest resistance, which is in agreement with the pore analysis described above. The weave structure has negligible effect for B/PET samples. Figure 6(b) shows a bar diagram for mean values together with 95% confidence intervals for sample resistances grouped according to the identical weave pattern (structure). It was confirmed that material composition of warp and weft has statistically significant effect on resulting electrical resistance for all sample groups, whereas the highest resistance is observed in B/B samples and lowest resistance in B/PET samples.
Volume resistance of: (a) hybrid structures grouped according to the identical material composition, (b) hybrid structures grouped according to the identical weave pattern, (c) chosen basalt hybrid samples, (d) non-hybrid samples.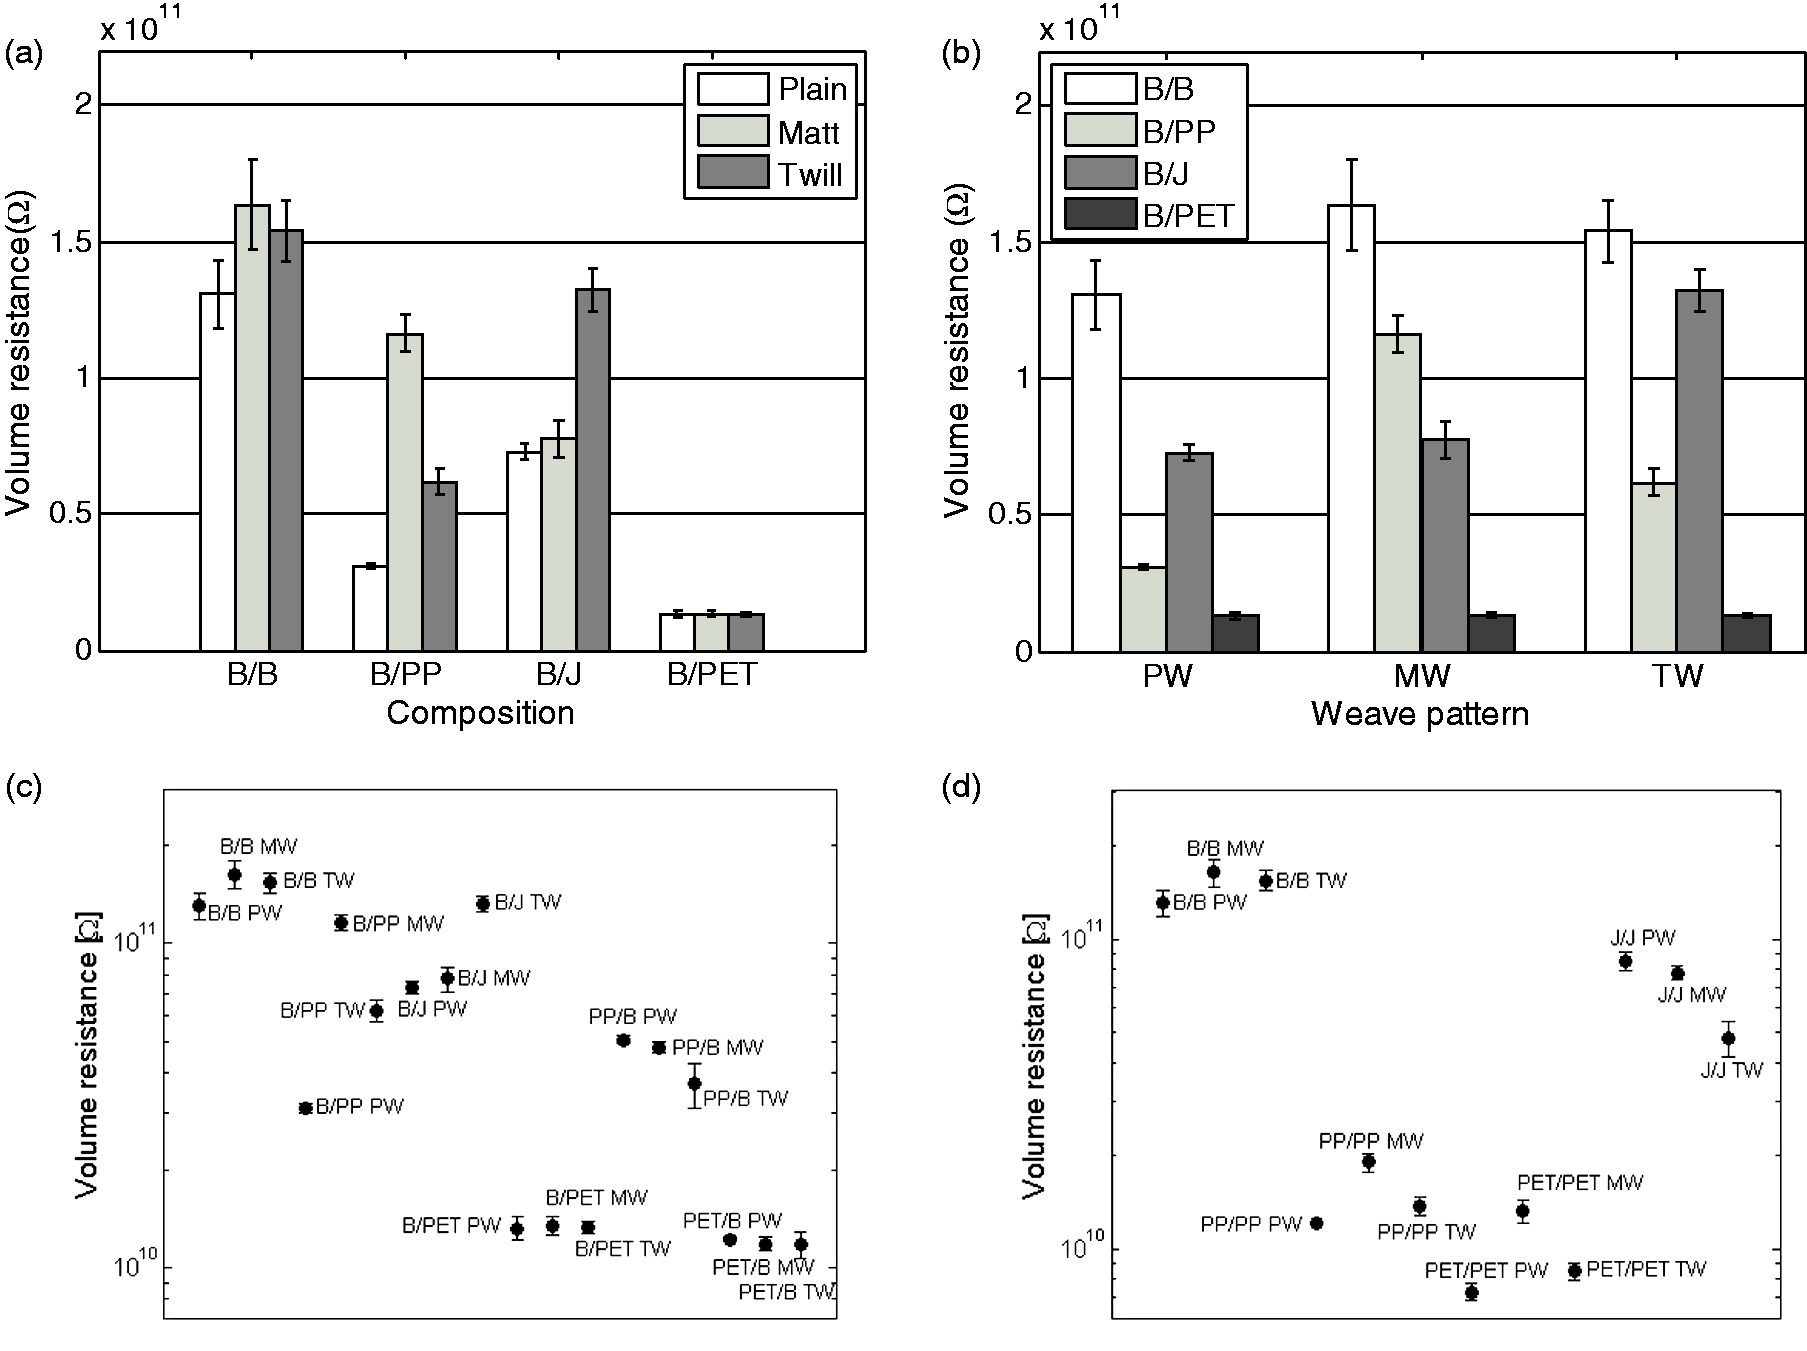
It can be seen in Figure 6(c) that if hybrid structures (when basalt is used only in warp) are compared with B/B, it is quite clear that B/B has the highest electrical resistance among all compositions. In all compositions, plain weave has the lowest electrical resistance as it has only one type of pores in it. Plain weave has relatively lower porosity parameters, i.e. fewer number of pores and lower portion of open area as compared to matt and twill weaves. The 100% basalt plain woven fabric shows relatively lower electrical resistance because of more compact structure; because of the use of compact basalt yarn in both directions, thickness is substantially low. Both matt and twill weaves have higher thickness due to longer float lengths of yarn and lower level of interlacement. Matt weaves show the highest number of pores and percentage open area, thus more air can be entrapped in the structure and it offers more resistance to electric current.
It can also be observed that in all the hybrid structures, the highest electrical resistance is in B/J structures. Although jute material has lower electrical resistivity than polyester and polypropylene, the synthetic fibers (PET and PP) tend to generate static electricity and thus exhibit lower resistance. Electrical properties are influenced by the size of electrostatic charge that is directly related to the size of the electrical resistance and thermal resistance of textile fabrics. Static electricity is the collection of electrically charged particles on the surface of a material; various materials have a tendency of either giving up electrons and becoming positive (+) in charge or attracting electrons and becoming negative (−) in charge. Some materials cause or create more static electricity than others. Static electricity can be generated on the surface of insulating materials in the following ways: charging by electrostatic induction, charging by friction, charging by ionizing radiation, etc. The high resistivity of polymers allows large electrostatic charges to accumulate. Antistatic formulations of polymers have much reduced resistivity so that electrostatic charge may be dissipated by leakage currents. Polyester is very sensitive to static electricity and this is may be the major reason for its low value in all hybrid and non-hybrid structures.1,13 Jute is staple yarn and highly twisted, while in other structures, i.e. B/PP, PP/B, B/PET, and PET/B, the constituent yarns have a lower amount of twist, which leads to inherent yarn flatness, the fibers in the yarn spread out in the fabric resulting in smaller inter yarn pores.
Among hybrid structures where basalt is used in weft, plain weave shows maximum resistance; this may be due to an increase in the number of pores and percentage of open area, as both PP and PET are filament yarns with very light twist and thus they become more flattened in twill weave due to relatively longer yarn floats.
It is also observed that among non-hybrid structures, B/B composition has the highest electrical resistance followed by J/J. Although material engineering theory predicts that basalt- and jute-based materials should exhibit lower electrical resistivity than polyester and polypropylene, the deviation in electrical behavior may be due to static electricity generated on synthetic materials and the relatively higher amount of twist in basalt as well as jute yarns. Among the different woven structures investigated, matt weave shows the highest electrical resistance followed by twill weave except in J/J compositions. This may be because jute is a staple spun yarn having a lot of hairiness on the surface, thus a higher level of porosity resulting in enhanced electrical resistance.
Conclusion
Electrical properties of fabrics, especially electrical resistivity, are affected not only by the electrical properties of material used, but also by structure (thickness, porosity, mass per unit area, etc.) and therefore also by fabric weave. Generally, the fabric containing more air gaps (conserving the same material properties), the higher the electrical resistivity of textile structure is observed.
It was confirmed that both material of fiber and structure, represented by porosity (different weave) show statistically significant effect on resulting electrical resistance. The highest resistance was observed in samples made of 100% basalt fiber regardless of weave type. It can be concluded that plain weave structures show lower electrical resistance compared to non-plain weave patterns. This phenomenon is in agreement with the fact that plain weave structures have higher cover factor compared to matt and twill weaves. From this analysis it was found that samples prepared in matt weave have higher electrical resistance value, especially when basalt is used in warp. Electrical resistance higher than 4E+10 Ω can be reached using either 100% basalt fabrics, basalt/polypropylene fabrics, basalt/jute fabrics, or 100% jute fabric, regardless of weave type. The static charge generated on synthetic yarns, e.g. PET and PP, reduces their effective electrical resistance.
Basalt and its hybrid structures show significant superiority in electrical resistivity. Thus they can be efficiently used in electrical resistance applications, replacing conventional polymers and e-glass.
Footnotes
Declaration of conflicting interests
The authors declared no potential conflicts of interest with respect to the research, authorship, and/or publication of this article.
Funding
The authors disclosed receipt of the following financial support for the research, authorship, and/or publication of this article: This work was supported by a Czech–India project (grant number DEBEL‐19027) and Students Grant Scheme, Technical University of Liberec, Project Number SGS 21044.