



Abstract
This study investigates the effect of the drawing process of ethylene vinyl alcohol (EVOH) fibers on their physical properties. Three different ethylene contents, namely EV-32, EV-38 and EV-44, were used where the ethylene content has the order of EV-44 > EV-38 > EV-32. The result indicates that at the same drawing temperature and draw ratio, the online drawing stress of the fiber with high ethylene content is higher than that with low ethylene content. Moreover, the drawn EVOH fiber, at the drawing temperature of 80℃ and the draw ratio of 2.0, exhibits an optimal mechanical property. As the draw ratio increases, the online drawing stress, birefringence and initial modulus increase. Notably, unlike typical polymeric fibers, the glass transition temperature (Tg) of the drawn EVOH fibers decreases with the draw ratio due to more water being absorbed by thinner fibers within the same number of samples. The draw ratio was found to have little effect on the melting temperature (Tm). At the same draw ratio, the online drawing stress, birefringence, stress and initial modulus of the fiber EV-44, which has the highest ethylene content, is higher than those of EV-32 and EV-38. The creep strain of the drawn fibers EV-32 and EV-38 linearly increase with the drawing time when the applied stress maintains constant at 150 MPa, while an insignificant increase is observed for EV-44, suggesting that EV-44 is difficult to deform and has higher size stability. In the stress relaxation test, the elongation increases with the initial stress. At the same elongation percentage, the initial stress of the drawn fibers has the following trend: EV-44 > EV-38 > EV-32 and the stress relaxation time (τ) has the following trend: EV-44 > EV-38 > EV-32, indicating again that EV-44 is relatively difficult to deform during drawing. Finally, EV-44 fiber performed the best in the hot water resistance test.
Keywords
Ethylene vinyl alcohol (EVOH) copolymer fibers have received great attention because EVOH copolymers have a hydrophilic nature but they are difficult to fabricate. The single-component EVOH fibers were previously studied for melt-spinnability using three different ethylene contents. 1 The properties of EVOH have also been studied2–5 and are influenced by its ethylene content,1,6–8 crystallinity, temperature, humidity and other factors. Higher ethylene content in EVOH corresponds to a lower gas barrier9–13 and a lower temperature of extrusion. Oxygen diffusion through EVOH is limited by high intermolecular and intramolecular cohesive energy. 14 Moreover, water that is dissolved in EVOH has a plasticizing effect that facilitates the relative motion of molecular chains and macromolecules. Therefore, the presence of water in the hydrophilic polymer matrix not only influences the sorption and diffusion of the permeate but also leads to depression of the glass transition temperature (Tg) of the polymer due to the plasticization effect of water.15–18
EVOH has been widely used as an oxygen barrier in food packaging and as a modifier in composite fibers to give fire-resistant, antibacterial, anti-oxidant properties and biocompatibility, etc. Commercialized EVOH fibers were attempted by several companies, such as DuPont and Kuraray Co., Ltd, but failed due to immature processing techniques to conquer the problem of heat durability of EVOH during fiber formation. Up to 1997, Kuraray developed a composite spinning technique to produce a sheath-core composite fiber of EVOH as a sheath and polyethylene (PE) terephthalate as a core, known as “Sophista”. 19 In addition, the use of Sophista fibers showed relief of the cutaneous pruritus syndrome for a patient with atopic dermatitis by fabricating Sophista fibers into underwear to replace the usual underwear. 20
The composite fibers containing EVOH may have various forms, including sheath-core, multilayers, multi-hollows and others. The commercially available EVOH pellets can be obtained from Kuraray Co., Ltd, Nippon Gohsei Co., Chang Chun Petrochemical Co. and other companies. However, the use of EVOH alone to form single-component fibers with good fiber quality remains a challenge for the industry.
Generally, a drawing process is utilized to improve the mechanical property of fibers, especially the degree of orientation and crystallinity. Selection of the drawing temperature during the drawing process plays an important role. If the drawing temperature is too low, the draw ratio is reduced. On the contrary, if the drawing temperature is too high, molecular chains become unoriented. If the drawing temperature is too low or too high, the mechanical property of fibers is decreased accordingly.21–23 The degree of orientation of fibers can be determined by birefringence, sonic modulus or X-ray diffraction methods where the birefringence method measures the orientation of the segment of molecular chains, the sonic modulus method measures the bulk-orientation of fibers and the X-ray diffraction method measures the orientation of the crystalline region.24–26
In this study, as-spun fibers were fabricated by melt spinning 1 using EVOH raw materials with various ethylene contents (EV-32, EV-38 and EV-44 roughly having 32, 38 and 44 mole% of ethylene composition units, respectively) to search for the optimal drawing temperature. The characteristics of the fibers drawn at the conditions of the optimal drawing temperature and various draw ratios were analyzed. The initial modulus, creep, stress relaxation, elastic recovery and hot water shrinkage (HWS) of fibers were investigated to evaluate fiber deformation and dimensional stability.
Experimental details
Materials
Physical properties of EV-32, EV-38, and EV-44 fibers at the drawing temperature of 80℃ and various draw ratios

Characterization of raw materials
Melt spinning
Before spinning, EVOH pellets were dried in hot air until their water content was below 30 ppm (parts per million). The melt spinning of EVOH was conducted using a Killion single extruder (Model KLB-100) machine purged with nitrogen at spinning temperatures of 265℃, 255℃ and 245℃ for EV-32, EV-38 and EV-44, respectively, at a take-up speed of 100 m/min. The spinning temperature was based on the rheological and thermal-degradation analyses and was set at the lowest temperature at which the spinning process could be performed without any degradation fuming or highly viscous flow. 1 The pellets were extruded via a single screw extruder that was connected to a mono-hole spinnerette with a diameter of 2.0 mm and a L/D ratio of 4. The mass throughput of EV-32, EV-38 and EV-44 was 25.2, 24.5 and 23.9 (g/min), respectively.
Notably, EVOH was melt spun at the spinning temperature of 245–265℃ and at the take-up speed of 100 m/min to form fibers. Since the un-oriented yarn was formed by a low spinning speed, the fibers formed from the melt were completely solidified at the position 1 m below the spinneret, and the temperature gradient along the spinning channel is expected to have very little impact on fiber properties. Thus, the simulation on the effect of temperature gradient during EVOH melt spinning is unnecessary in this work.
Drawing process and online draw stress
An online draw stress tester, a Dynafil M apparatus (Figure 1(a)) by Textechno GmbH, was used for drawing fibers and measuring the online draw stress. The length of the drawing hot box is 80 cm and the drawing speed is 5 m/min. The draw ratios were set to 1.4, 1.8, 2.0, 2.2 and 2.6. The temperature of the drawing hot box was set to 60℃, 70℃, 80℃, 90℃ and 100℃. The means and standard deviations were obtained from five measurements at the same conditions.
(a) Experimental setup to measure online draw stress and (b) relationship of online draw stress and drawing temperature for EV-32, EV-38 and EV-44 fibers at a draw ratio of 2.0. EVOH: ethylene vinyl alcohol.
Birefringence measurement
In this work, the birefringence method based on ASTM D276-12 was used to evaluate the degree of orientation. Fibers show optical birefringence because the alignment of polymer chains induces the differences in the refractive index. Measurement of the birefringence can be used to indicate the degree of orientation. Birefringence (△n) of a fiber can be calculated from the following equation:27,28

Differential scanning calorimetry measurement
Differential scanning calorimetry (DSC) thermograms were measured using a Perkin Elmer-DSC7 calorimeter (Massachusetts, USA). The amount of polymer utilized in a given thermal scan was kept between 5 and 8 mg. The DSC was calibrated with indium and zinc standards. All experiments were conducted under a nitrogen purge and a DSC baseline was determined by running empty pans. The experiments were performed with a first heating scan from 30℃ to 230℃ at a heating rate of 10℃/min.
Scanning electron microscopy images of EVOH fibers
Scanning electron microscopy (SEM) images of EVOH fibers were captured by a JEOL scanning electron microscope (JSM-6500F) at an accelerating voltage of 15 kV and a working distance of 12–13 mm. Samples were prepared by cryofracture in liquid nitrogen. The cryofractured surfaces were coated with platinum under a vacuum to avoid charging. Fiber diameters were measured from the SEM micrographs at their original magnification.
Mechanical properties of EVOH fibers
The mechanical properties of EVOH fibers were obtained using a tensile tester base on ASTM D3822-14. The relationship between the tensile stress and the strain of EVOH fibers was measured using a tensile strength tester (Uster Tensorapid 4 from Uster Technologies AG) at a constant strain rate of 700 mm/min (initial length: 200 mm). The fibers were prepared as described in the Melt spinning section. Each as-spun sample was measured five times at 22 ± 1℃ and 65 ± 2% relative humidity (RH) and then the mean and standard deviation of the five measurements were obtained.
Creep
The creep of EVOH drawn fiber was measured using a tensile strength tester based on ASTM D7337-12 (Uster Tensorapid 4 from Uster Technologies AG) at a constant strain rate of 200 mm/min (initial length: 200 mm). The applied stresses were set to 50, 100 and 150 MPa and the duration of measurement was set to 120 seconds to obtain the curve of strain versus time.
Stress relaxation
The stress relaxation of EVOH drawn fiber was measured using a tensile strength tester base on ASTM E328-13 (Uster Tensorapid 4 from Uster technologies AG) at a constant strain rate of 200 mm/min (initial length: 200 mm). The elongation was set to 5%, 10% and 15% and the duration of measurement was set to 120 seconds to obtain the curve of stress versus time.
Elastic recovery
The elastic recovery of EVOH drawn fiber was measured using a tensile strength tester based on ASTM D1774-79 (Uster Tensorapid 4 from Uster Technologies AG) at a constant strain rate of 200 mm/min. After the fiber with a length L0 of 200 mm was processed at the conditions of five cycles of loading–unloading with the elongation of 5%, 10% and 15%, the unrecoverable length L was measured and the elastic recovery of the fiber was then calculated by the following equation:

The means and standard deviations of the five measurements were obtained.
Hot water shrinkage
Hot water shrinkage (HWS) of the drawn fiber was determined with the method described in DIN53840. The initial length (L0) of the drawn fiber was measured under a pretension of 5.0 g. The fiber sample was immersed in hot water at 60℃, 70℃ and 80℃ for 1, 15 and 30 minutes. After free shrinkage occurred, the sample was removed from the water bath and the final length (LS) was measured. HWS was calculated using the following equation:

Results and discussion
Effect of drawing temperature and draw ratio on drawing stress
Evaluation of a fiber was conducted firstly using an online draw stress tester at a drawing temperature higher than the glass transition temperature of the fiber and a draw ratio of 2.0. The measured online draw stress will reflect the stretching force of a fiber as it is heated and drawn. The stretching force is closely related to the molecular structure and molecular weight of the fiber. Figure 1(a) shows the experimental setup to measure online draw stress and Figure 1(b) shows the relationship of the online draw stress and the drawing temperature for EV-32, EV-38 and EV-44 fibers at a draw ratio of 2.0. As shown in Figure 1(b), the online draw stress decreases with the increase of the drawing temperature, indicating that the kinetic energy of the polymer chain segments increases with the drawing temperature and the slippage between chains becomes easier so as to decrease the online draw stress. 29 In addition, at the same drawing temperature, the online drawing stress of the fiber with the high ethylene content (EV-44) is higher than that with the low ethylene content (EV-32 and/or EV-38), indicating that EV-44 is more difficult to deform during thermal drawing.
Figure 2 shows the relationship of the stress and the drawing temperature for EV-32, EV-38 and EV-44 fibers at a draw ratio of 2.0. As shown in Figure 2, at the draw ratio of 2.0, the optimal mechanical property of the drawn fiber can be obtained at the drawing temperature of 80℃. When the drawing temperature is within the range of 60–80℃, as the temperature is increased, the molecular chains are more easily extended along the stretching direction and aligned along the fiber axis so that the degree of orientation and the stress of the drawn fiber are increased. On the other hand, when the drawing temperature is within the range of 80–100℃, as the temperature is increased, chain relaxation becomes increasingly significant due to the increase of molecular mobility so that the effect of disorientation of molecular chains is larger than the effect of orientation to decrease the stress of the drawn fiber.
30
Thus, for EVOH unoriented yarn, the optimal drawing temperature is 80℃. Besides, at the same drawing temperature, the stress of EV-44 is higher than that of EV-32 and EV-38.
Relationship of stress and drawing temperature for EV-32, EV-38 and EV-44 fibers at a draw ratio of 2.0.
At the drawing temperature of 80℃, as the draw ratio is increased, the online drawing stress is increased. Figure 3 shows the relationship of the online draw stress and the draw ratio for EV-32, EV-38 and EV-44 fibers at the drawing temperature of 80℃. As shown in Figure 3, as the draw ratio is increased, the stretching force is increased and the internal stress of molecular chains to resist the external force is increased so that online draw stress is significantly increased. In addition, at the same draw ratio, the online drawing stress of EV-44 fiber is higher than that of EV-32 and EV-38.
Relationship of online draw stress and draw ratio for EV-32, EV-38 and EV-44 fibers at the drawing temperature of 80℃.
Figure 4 shows SEM cross-sectional images of EV-32 fiber for draw ratios of (a) 1.0, (b) 1.4, (c) 1.8, (d) 2.2 and (e) 2.6 at the drawing temperature of 80℃. The diameters of the cross-sections of the drawn fibers, EV-32, at the draw ratios of 1.0, 1.4, 1.8, 2.2 and 2.6 are 180, 144, 138, 115 and 111 µm, respectively. The diameter of the drawn fiber is gradually decreased as the draw ratio is increased.
Scanning electron microscopy images of EV-32 fibers for a draw ratio of (a) 1.0 (as-spun), (b) 1.4 (c) 1.8, (d) 2.2 and (e) 2.6 at the drawing temperature of 80℃.
Effects on orientation
Figure 5 shows the relationship of the birefringence and the draw ratios for EV-32, EV-38 and EV-44 fibers at the drawing temperature of 80℃. As shown in Figure 5, when the draw ratio is increased, the molecular chains of the fiber are extended toward the stretching direction and aligned along the fiber axis so as to increase the degree of orientation.
31
At the same draw ratio, the degree of orientation of EV-44 is higher than that of EV-32 and EV-38, which may be due to the relative low content of OH side groups of EV-44 so that molecular chains have less steric hindrance and molecular interaction of hydrogen bond during drawing.
Relationship of birefringence and draw ratio for EV-32, EV-38 and EV-44 fibers at the drawing temperature of 80℃.
Figure 6 shows DSC thermograms of (a) EV-32, (b) EV-38 and (c) EV-44 fibers at the drawing temperature of 80℃ and various draw ratios. Table 1 shows the glass transition temperature (Tg), melting temperature (Tm) and crystallinity (Xc) of EV-32, EV-38 and EV-44. The melting enthalpy ΔHm was calculated from the area below the melting peak in the thermogram. ΔH0
PVA
(156.1 J/g) and ΔH0
PE
(290.0 J/g)32,33 were the melting enthalpies of 100% crystalline PVA (polyvinyl alcohol) and PE, respectively. The crystallinity (Xc) was calculated using the following equations:
Differential scanning calorimetry thermograms of (a) EV-32, (b) EV-38 and (c) EV-44 fibers at the drawing temperature of 80℃ and various draw ratios.


As the draw ratio is increased, the drawn fiber has the higher degree of orientation to induce crystallization of the molecular chains so as to increase the crystallinity. The crystallinity (Xc) of the three drawn fibers, EV-32, EV-38 and EV-44, has the following trend: EV-32 > EV-38 > EV-44. Since the quantity of the hydrogen bonds between molecular chains has the following order: EV-32 > EV-38 > EV-44, during thermal drawing, the molecular chain aligned along the fiber axis becomes easily encased in a crystal lattice as the hydrogen bonds increase. Thus, EV-32 has the higher crystallinity (Xc) among the three fibers. On the other hand, as the draw ratio is increased, the glass transition temperature (Tg) is decreased. Since the moisture existing in EVOH behaves as a plasticizer, which reduces the entanglement and bonding between molecules, the free volume and mobility of EVOH are increased. The presence of water in EVOH leads to depression of the glass transition temperature (Tg) of the polymer due to the plasticization effect of water.34–37 Therefore, as the draw ratio is increased, the area of fiber cross-section becomes smaller and the specific surface area of fibrous EVOH becomes larger, indicating a larger area in contact with moisture so that the plasticization effect of water is increased and the glass transition temperature (Tg) is therefore decreased. However, the melting temperature (Tm) is not changed with the draw ratio.
Effects on mechanical properties
Generally, the degree of orientation determines the stress of a fiber. As the draw ratio is increased, the stress is increased. Figure 7 shows the relationship of the stress and the draw ratio, while Figure 8 shows the relationship of the strain and the draw ratio for EV-32, EV-38 and EV-44 fibers at the drawing temperature of 80℃. As shown in Figure 7, at the same draw ratio, the stress of EV-44 is higher than that of EV-32 and EV-38. As shown in Figure 8, since the degree of orientation is increased, the possibility of further stretching the molecular chains is decreased and thus the strain is decreased. Figure 9 shows stress versus strain curves for (a) EV-32, (b) EV-38 and (c) EV-44 fibers at the drawing temperature of 80℃ and the draw ratios of 1.0, 1.8 and 2.6. As shown in Figure 9, at the draw ratios of 1.0, 1.8 and 2.6, the stress of EV-44 is higher than that of EV-32 and EV-38, while the strain is lower than that of EV-32 and EV-38.
Relationship of stress and draw ratio for EV-32, EV-38 and EV-44 fibers at the drawing temperature of 80℃. Relationship of strain and draw ratio for EV-32, EV-38 and EV-44 fibers at the drawing temperature of 80℃. Stress versus strain curves for (a) EV-32, (b) EV-38 and (c) EV-44 fibers at the drawing temperature of 80℃ and the draw ratios of 1.0, 1.8 and 2.6.


The initial modulus is an index of the ability of resisting elastic deformation of a fiber, indicating the stress and strain relationship within a small range of strain, which is the region of elastic deformation. Since the molecular chains in the amorphous region have higher mobility than those in the crystalline region, the initial deformation of a fiber being drawn is determined by the molecular orientation in the amorphous region.38–40 Figure 10 shows the relationship of the initial modulus and the draw ratio for EV-32, EV-38 and EV-44 fibers at the drawing temperature of 80℃. As shown in Figure 10, as the draw ratio is increased, the degree of orientation in the amorphous region is higher; the molecular chains are more closely arranged; the whole bonding force is stronger; and the deformation of the fiber is more difficult so as to have a higher initial modulus. In addition, at the same draw ratio, the initial modulus of EV-44 is higher than those of EV-32 and EV-38, indicating that EV-44 drawn fiber is stiffer.
Relationship of initial modulus and draw ratio for EV-32, EV-38 and EV-44 fibers at the drawing temperature of 80℃.
Creep of a fiber reveals the dimensional stability of the fiber. At the same applied stress, the smaller creep strain indicates better dimensional stability of the fiber.41,42 The behavior of creep can be represented using the following equation:

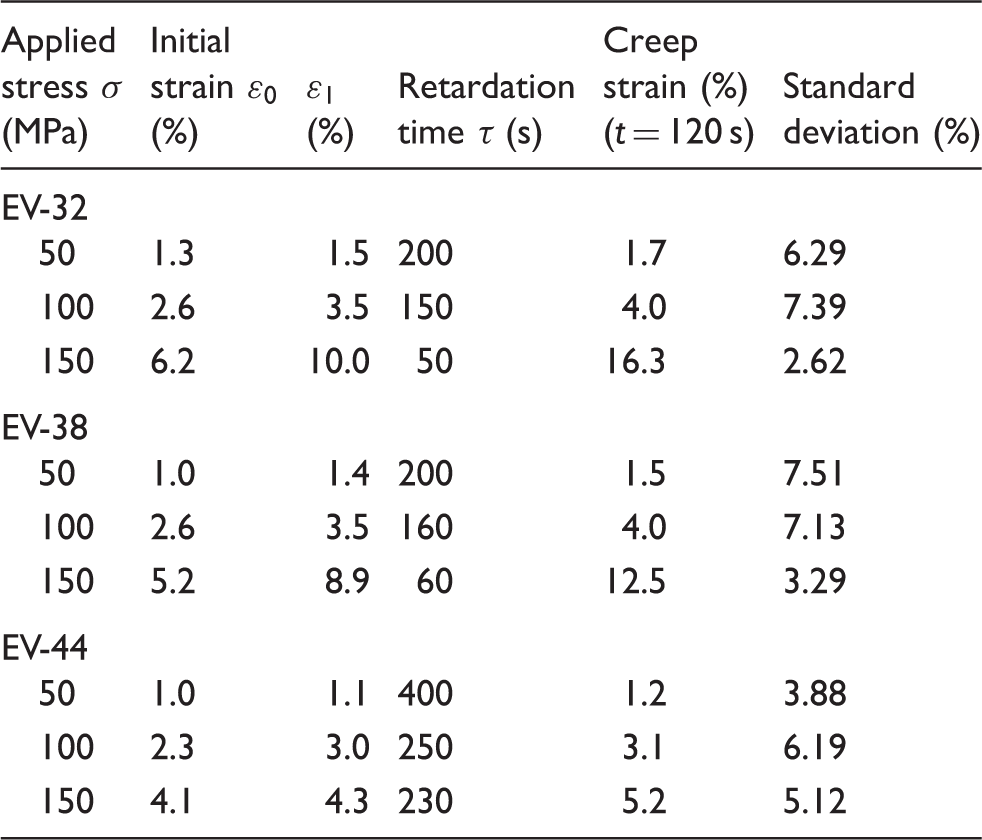
Figure 11 shows the creep strain curves of (a) EV-32, (b) EV-38 and (c) EV-44 fibers at a draw ratio of 2.6 with applied stresses of 50, 100 and 150 MPa. Table 2 shows the measurement result. As the applied stress is 50 and 100 MPa, the creep strain is not distinctively increased along with the increase of the applied stress, because the applied stress is small. The differences in the creep strain of the three drawn fibers EV-32, EV-38 and EV-44 are not significant. However, when the applied stress is increased to 150 MPa, the creep strain of the drawn fibers EV-32 and EV-38 has a significant increasing trend with the increase of drawing time, while the creep strain of the drawn fiber EV-44 is only slightly increased. The creep strain of the three drawn fibers EV-32, EV-38 and EV-44 is 16.3%, 12.5% and 5.2%, respectively, for a drawing period of 120 seconds, indicating that the internal stress of EV-44 is higher when the molecular chains of EV-44 are changed from the state of curling to extending.
43
That is, EV-44 is more difficult to deform and has higher size stability. The trend of retardation time also confirms such results and it will be discussed in detail later.
Creep strain curves of (a) EV-32, (b) EV-38 and (c) EV-44 fibers at a draw ratio of 2.6 with applied stresses of 50, 100 and 150 MPa.
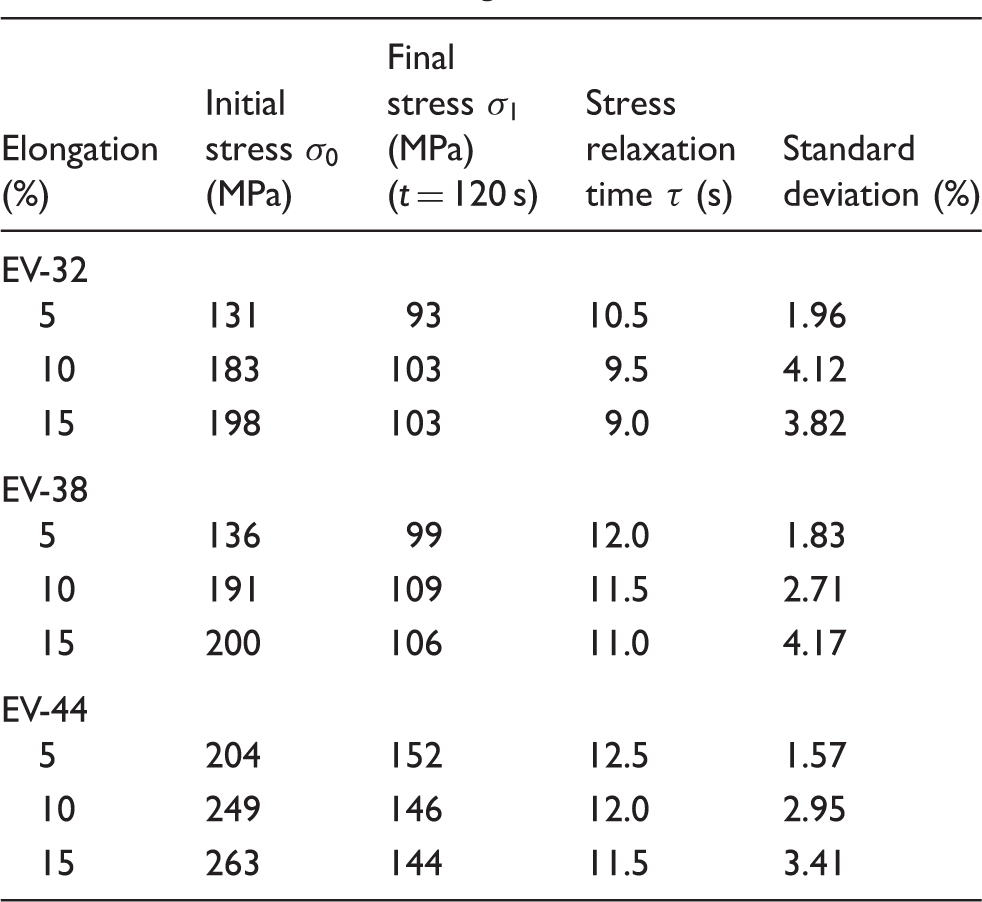
Stress relaxation is a process of configuration change of polymer chains. After the fiber is drawn, the molecular chain is changed from the curled configuration to extended configuration. The molecular chain is unstable at the time and, as time passes, the chain segment in the molecular chain undergoes thermal motion to gradually decrease the internal stress.42–44 The process of stress relaxation can be represented by the following stress relaxation equation:

Figure 12 shows the graph of natural logarithm functions of stress Stress relaxation curves of (a) EV-32, (b) EV-38 and (c) EV-44 fibers at a draw ratio of 2.6 with the elongation of 5%, 10% and 15%. Creep strains of EV-32, EV-38 and EV-44 fibers at a draw ratio of 2.6 with applied stresses of 50, 100 and 150 MPa
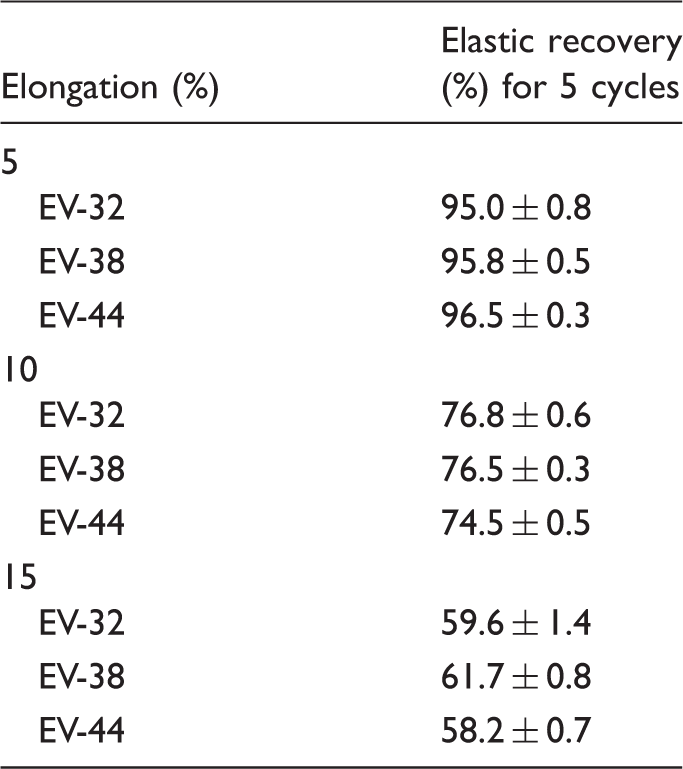
When the fibers are in practical use, for example fabricated to cloth, the fibers experience repeated extension to have deformation and/or form wrinkles. Therefore, it is important to evaluate the size stability by measuring the elastic recovery of the fiber so that the plastic deformation generated by repeated extension of the fiber can be revealed. Figure 13 and Table 4 show the elastic recovery of (a) EV-32, (b) EV-38 and (c) EV-44 fibers at a draw ratio of 2.6 during five cycles of loading–unloading with the elongation of 5%, 10% and 15%. The results reveal that the elastic recovery of the drawn fibers EV-32, EV-38 and EV-44 is kept at 95% or higher when the elongation is 5%. When the elongation is 10%, the elastic recovery of the three is decreased to ca. 75%. When the elongation is 15%, the elastic recovery of the three is only about 60%. This indicates that the drawn fiber has the better ability of elastic recovery when the elongation is 5%. Moreover, there is little difference in the five cycles of loading–unloading test among the three drawn EVOH fibers.
Elastic recovery of (a) EV-32, (b) EV-38 and (c) EV-44 fibers at a draw ratio of 2.6 during five cycles of loading–unloading with the elongation of 5%, 10% and 15%. Stress relaxation of EV-32, EV-38 and EV-44 fibers at a draw ratio of 2.6 with the elongation of 5%, 10% and 15% Elastic recovery of EV-32, EV-38 and EV-44 fibers at a draw ratio of 2.6 during five cycles of loading–unloading with elongation of 5%, 10% and 15%
Effects on water shrinkage
Generally, thermal shrinkage of a fiber is related to the percentage of the amorphous regions and the degree of orientation. When the fiber absorbs heat from its environment, the molecular chains in the amorphous regions become disordered and the degree of oriented alignment of the molecular chains is decreased to thereby show the shrinkage phenomenon. When the percentage of the amorphous regions and the degree of orientation are high, the number of molecular chains becoming disordered due to heat becomes larger so as to lower the length of the fiber to have a more significant shrinkage phenomenon.
Figure 14 shows the HWS of (a) EV-32, (b) EV-38 and (c) EV-44 fibers at a draw ratio of 2.6 under water temperature of 60–80℃ for 1, 15 and 30 minutes. The HWS of the drawn fibers EV-32, EV-38 and EV-44 is increased along with the increase of the temperature of the water bath. This may be because the molecular chains of the fiber receive energy to have thermal motion, when the temperature of the water bath is higher than Tg, to have slipping and curling of the molecular chains. Thus, the initial modulus of the fiber is lowered to increase the ability of deformation so as to increase the shrinkage. Although the crystallinity of the three fibers has the order of EV-32 > EV-38 > EV-44, the HWS of EV-32 drawn fiber should be the lowest, theoretically. However, based on the experimental result, the shrinkage has the order of EV-32 > EV-38 > EV-44, indicating that EV-44 has the best hot water resistance. Since water bonds with OH hydrophilic groups of the molecular chains of EVOH, the hydrogen bonds between the molecular chains are weakened and water is a plasticizer to EVOH fibers. The plasticization effect of hot water for EV-32 is the highest because of the highest content of OH hydrophilic groups of the three fibers and thus it is easier for EV-32 fiber to deform. Therefore, EV-32 fiber has the largest HWS among the three.
Hot water shrinkage of (a) EV-32, (b) EV-38 and (c) EV-44 fibers at a draw ratio of 2.6 under water temperature of 60–80℃ for 1, 15 and 30 minutes.
Conclusions
Three forms of EVOH with different ethylene contents (namely EV-32, EV-38 and EV-44, roughly having 32, 38 and 44 mole% of ethylene composition units, respectively) were used in this work to investigate the drawing process of EVOH copolymer fibers. The as-spun fibers by melt spinning were used to evaluate the optimal drawing temperature. Characterization of the fibers drawn at the conditions of the optimal drawing temperature and various draw ratios was carried out.
The result indicates the online drawing stress of the drawn fiber is decreased with the increase of drawing temperature and, at the same drawing temperature, the online drawing stress of the fiber with the high ethylene content (EV-44) is higher than that with the low ethylene content (EV-32 and/or EV-38). At the draw ratio of 2.0, the drawn fiber at the drawing temperature of 80℃ has the optimal mechanical property. At the same drawing temperature, the stress of EV-44 is higher than that of EV-32 and/or EV-38. As the draw ratio is increased, the online drawing stress, birefringence, stress and initial modulus increase, while the glass transition temperature (Tg) and strain decrease. At the same draw ratio, the online drawing stress, birefringence, stress and initial modulus of EV-44 fiber is higher than those of EV-32 and EV-38. EV-44 is relatively difficult to deform during drawing. Finally, EV-44 fiber performed the best in the hot water resistance test.
Footnotes
Declaration of conflicting interests
The authors declared no potential conflicts of interest with respect to the research, authorship and/or publication of this article.
Funding
The authors disclosed receipt of the following financial support for the research, authorship, and/or publication of this article: This work was supported by the National Science Council of the Republic of China, Taiwan (Contract No. NSC 102-2218-E-027-015).