




Abstract
A novel approach to predicting the filtration performance of spunbonded nonwoven using a rough set theory- and support vector machine-based model is presented. The meso-structure of spunbonded nonwoven was characterized using a structural parameter set (Os) containing nine parameters. Four reducts were extracted from Os using rough set theory. Twenty models, each based on either a support vector machine (SVM) or a back-propagation artificial neural network (BP-ANN), were established to predict the filtration performance (under varying filtration velocity and particle size) of spunbonded nonwoven by taking the parameters of each reduct and Os as inputs. The results show that the prediction accuracy of the model that takes thickness, fiber diameter, and pore size as its input parameters is higher than that of any other model, regardless of the model type. Moreover, the predictive power of the SVM-based model was found to exceed that of the BP-ANN-based model.
Keywords
Nonwoven materials have excellent filtration properties given that they have a three-dimensional network structure and contain multiple micropores. Studies have shown that the filtration performance of a nonwoven material is closely related to its fiber web structure.1–6 However, several parameters can be used to characterize the fiber web structure of spunbonded nonwoven. Establishing an equation system that includes all the parameters used in researching the influence of the fiber web structure on the filtration performance of spunbonded nonwoven would be a computationally intensive and inconvenient to apply. In addition, not every structural parameter has the same degree of influence on filtration performance; some parameters are redundant. Therefore, we should select as few parameters as possible for modeling—including only those parameters that have the greatest influence on filtration performance. The classical rough set (RS) theory developed by Pawlak in the early 1980’s, 7 based on the conventional indiscernibility relation, can be used as a tool to discover data dependencies and to reduce the number of attributes, which are contained in a dataset, using the data alone without requiring any additional information. There is a complex nonlinear relationship between the parameters of the fiber web structure and the filtration performance of nonwoven, which is difficult to analyze using traditional methods such as mathematical statistics. A support vector machine (SVM) is a machine-learning algorithm based on statistical learning theory that has found applications in regression analysis and pattern recognition since it was first introduced in 1995. SVMs have also been applied, and found to work well, in the textile field.8–14
Rough set theory
For a given dataset with discretized attribute values, it is possible to identify the most informative subsets (termed reducts) of the original attributes by applying RS theory.
15
Let

Support vector machines
An SVM maps the input vectors into a high-dimensional feature space using suitable kernel function, and thus can be applied to solve the nonlinear case. SVM models are closely related to neural networks. The output is a linear combination of the intermediate nodes. Each intermediate node corresponds to one support vector. Based on the structural risk minimization principle, SVMs have been found to be more suitable than artificial neural networks (ANNs) because of their improved generalization capability and higher predictive power for smaller samples.
16
Figure 1 shows the basic structure of an SVM model.
Support vector machine model.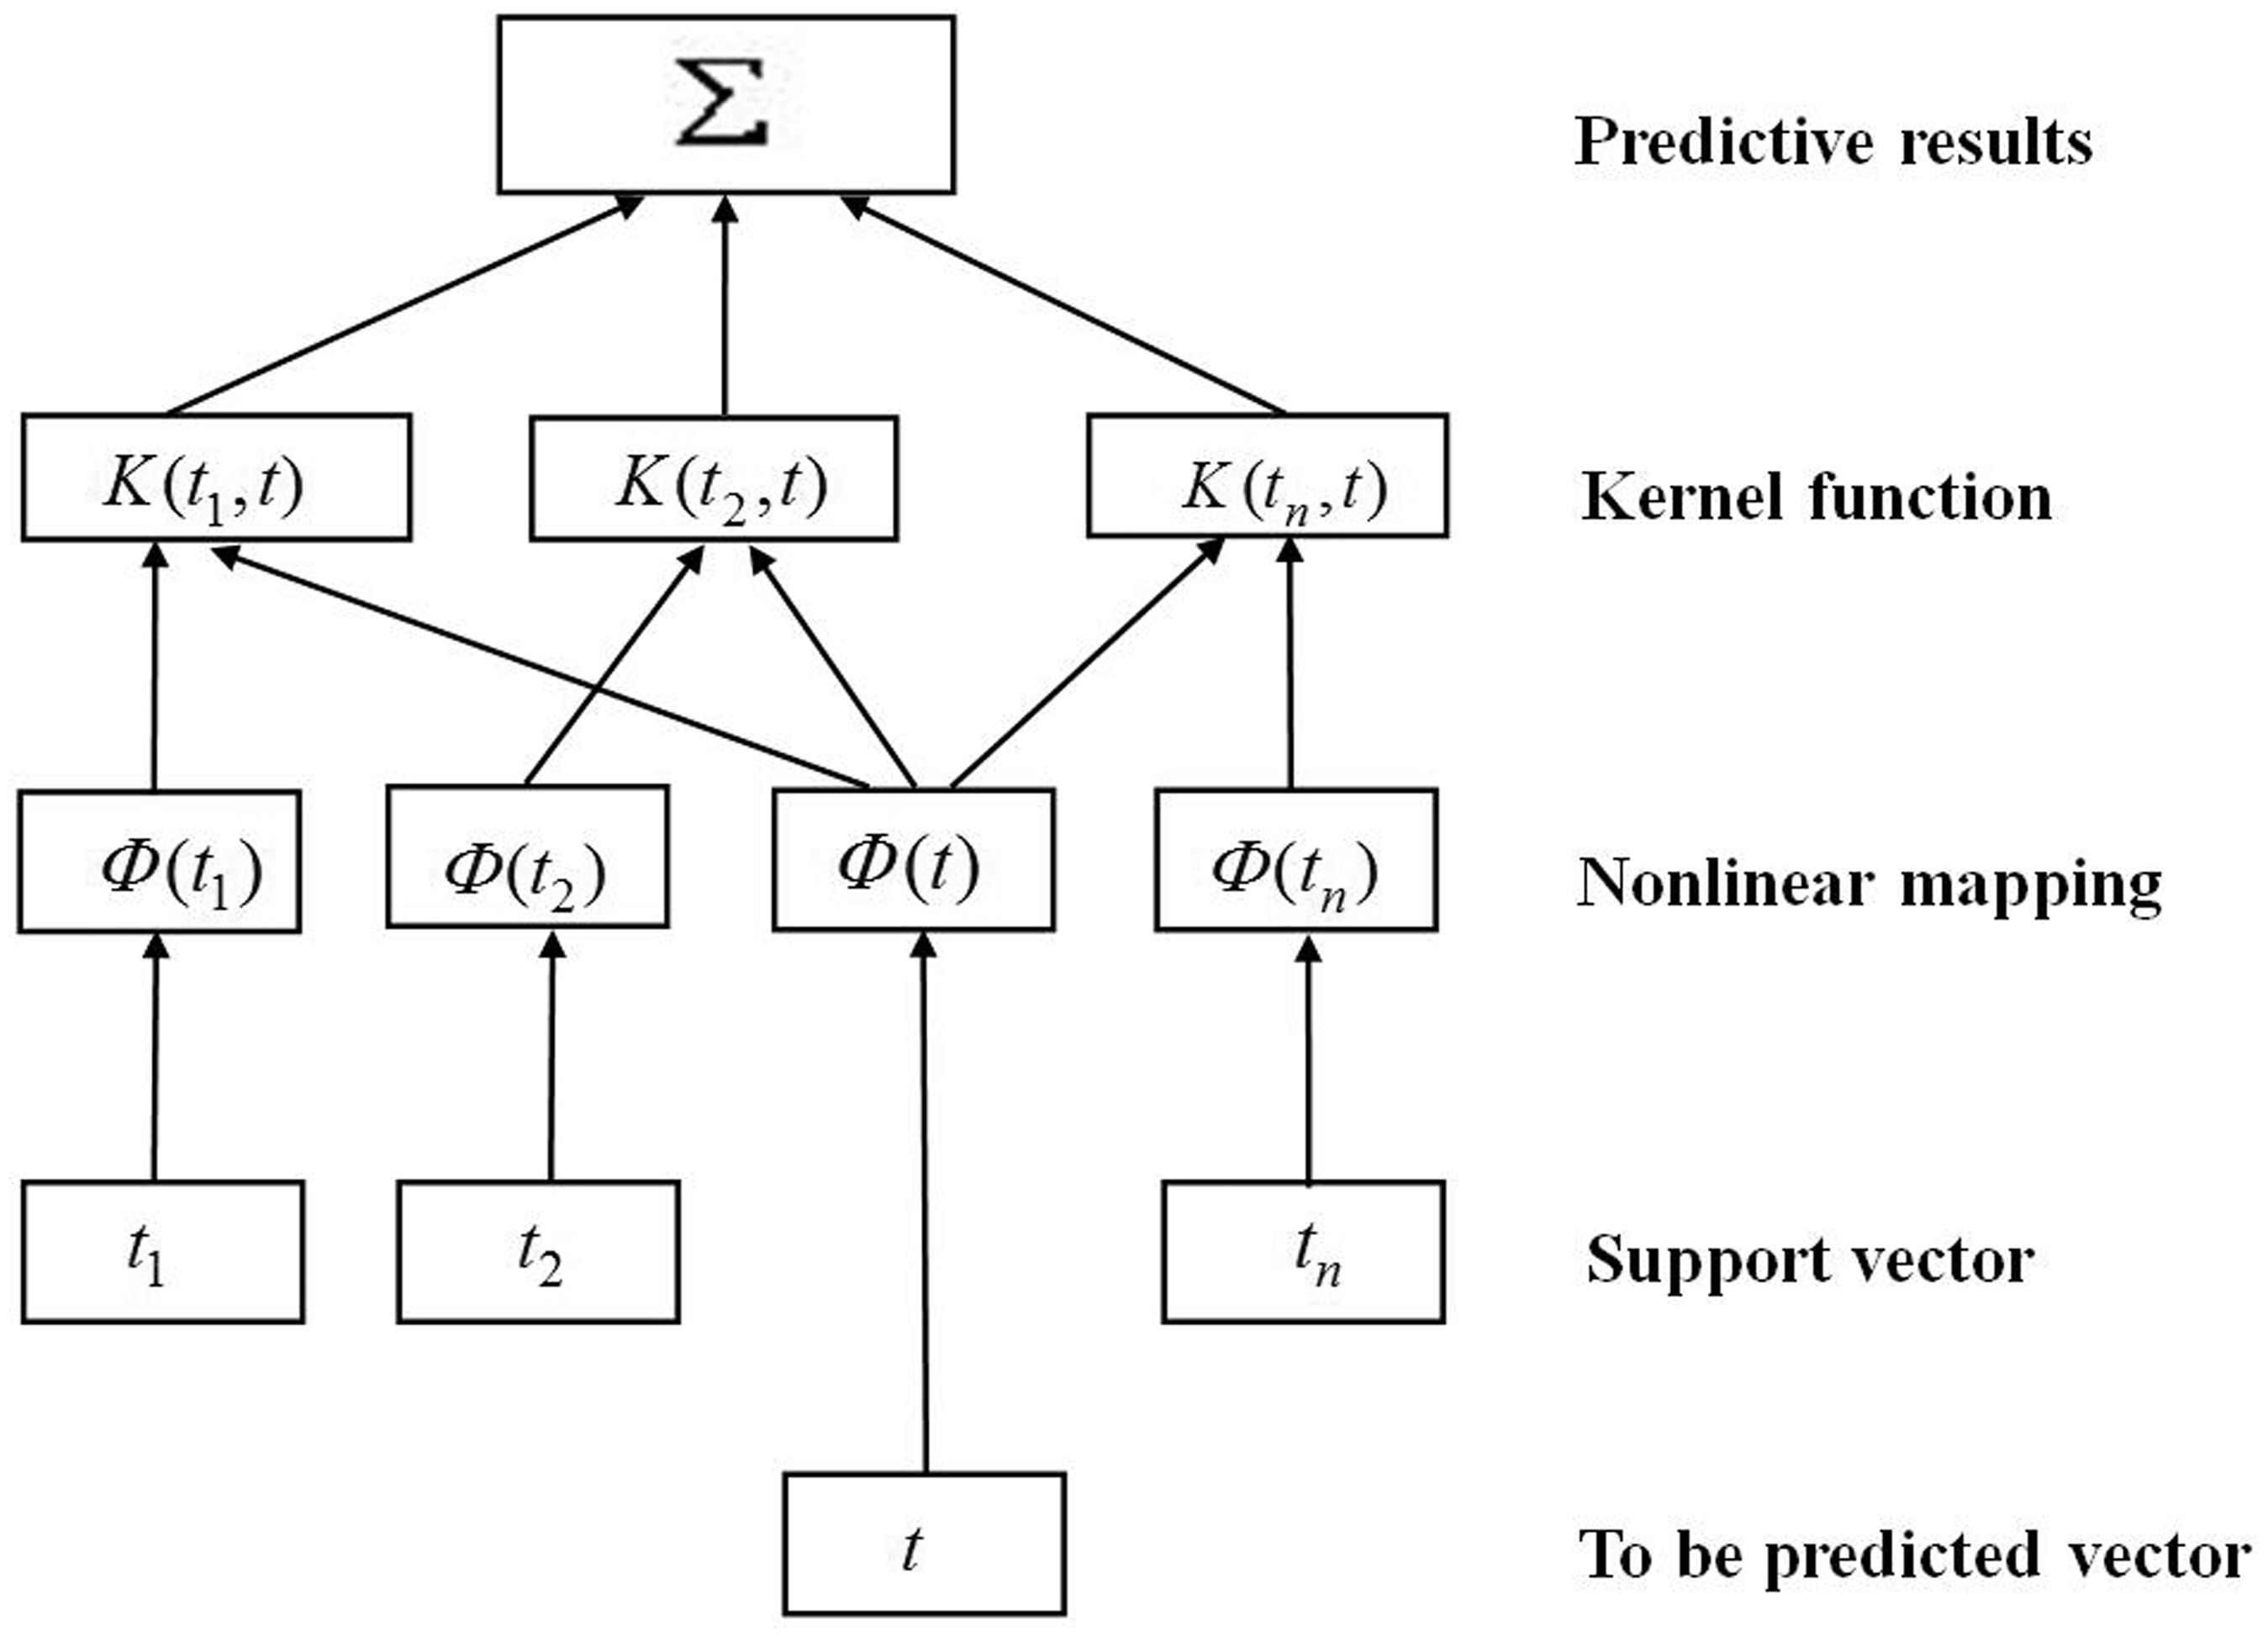
Materials and methods
Meso-structure and filtration performance of spunbonded nonwoven samples
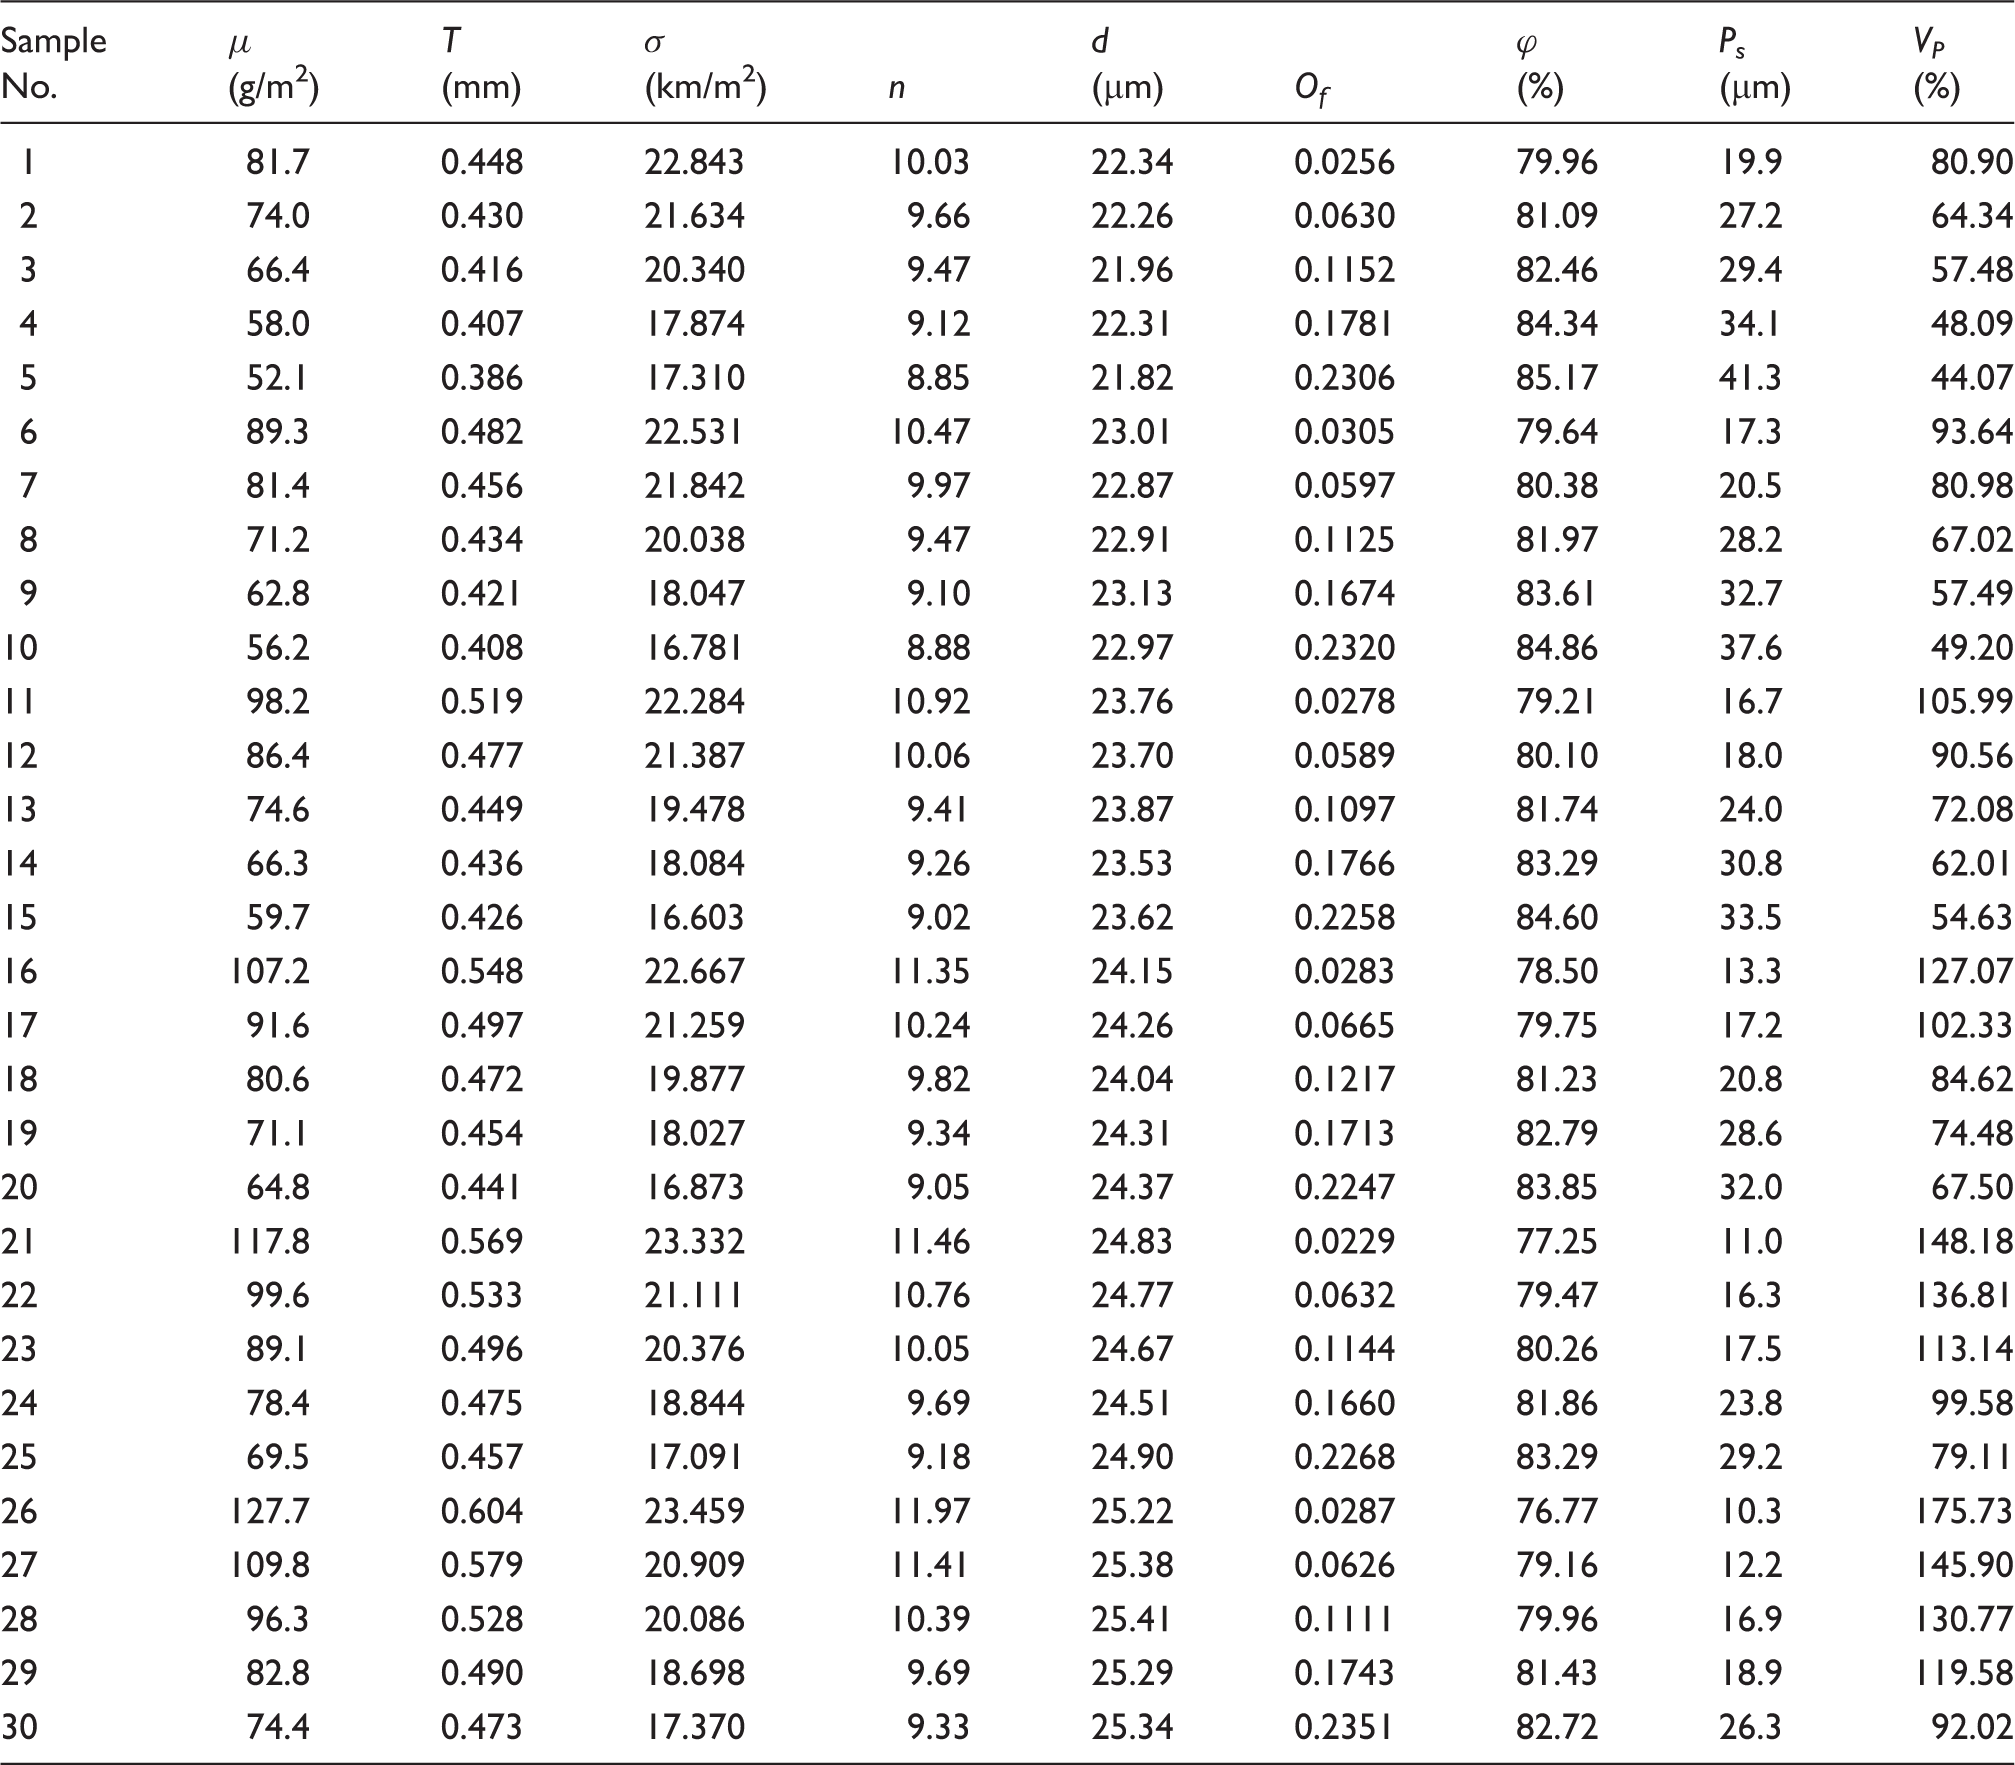
Thirty samples of polypropylene spunbonded nonwoven, acquired from the Key Laboratory of Advanced Textile Material and Manufacturing Technology, Ministry of Education, Zhejiang Sci-Tech University, were selected. We used nine parameters to characterize the meso-structure of these spunbonded nonwoven samples: basis weight μ (g/m2), thickness T (mm), feature length of the elemental fiber deposition plane (elemental plane in short) σ (km/m2), number of elemental planes n, fiber diameter d (µm), orientation factor Of, porosity ϕ (%), pore size Ps (µm), and variation coefficient of pore size VP (%).
The test of μ was performed in the AL204-IC electronic scale. Ten different places were tested on each sample. The test of T was performed in the YG (B) 141D fabric thickness tester at a pressure of 0.5 kPa, 10 different places were tested on each sample.
The parameter d was measured on the images of the sample. Scanning electron microscopy (SEM) images of the samples were collected using a JSM-5610LV scanning electron microscope (JEOL Company, Ltd., Tokyo, Japan) with an amplifying multiple of 200. Ten different regions were scanned, and correspondingly 10 images were collected, for each sample. For example, Figure 2 shows SEM image No.1 of sample No.1 for an image size of 400 × 400 pixels. Image Pro-Plus (IPP) was applied to measure the fiber diameter. A total of 100 fibers in different SEM images were measured for each sample.
SEM image No.1 of sample No.1.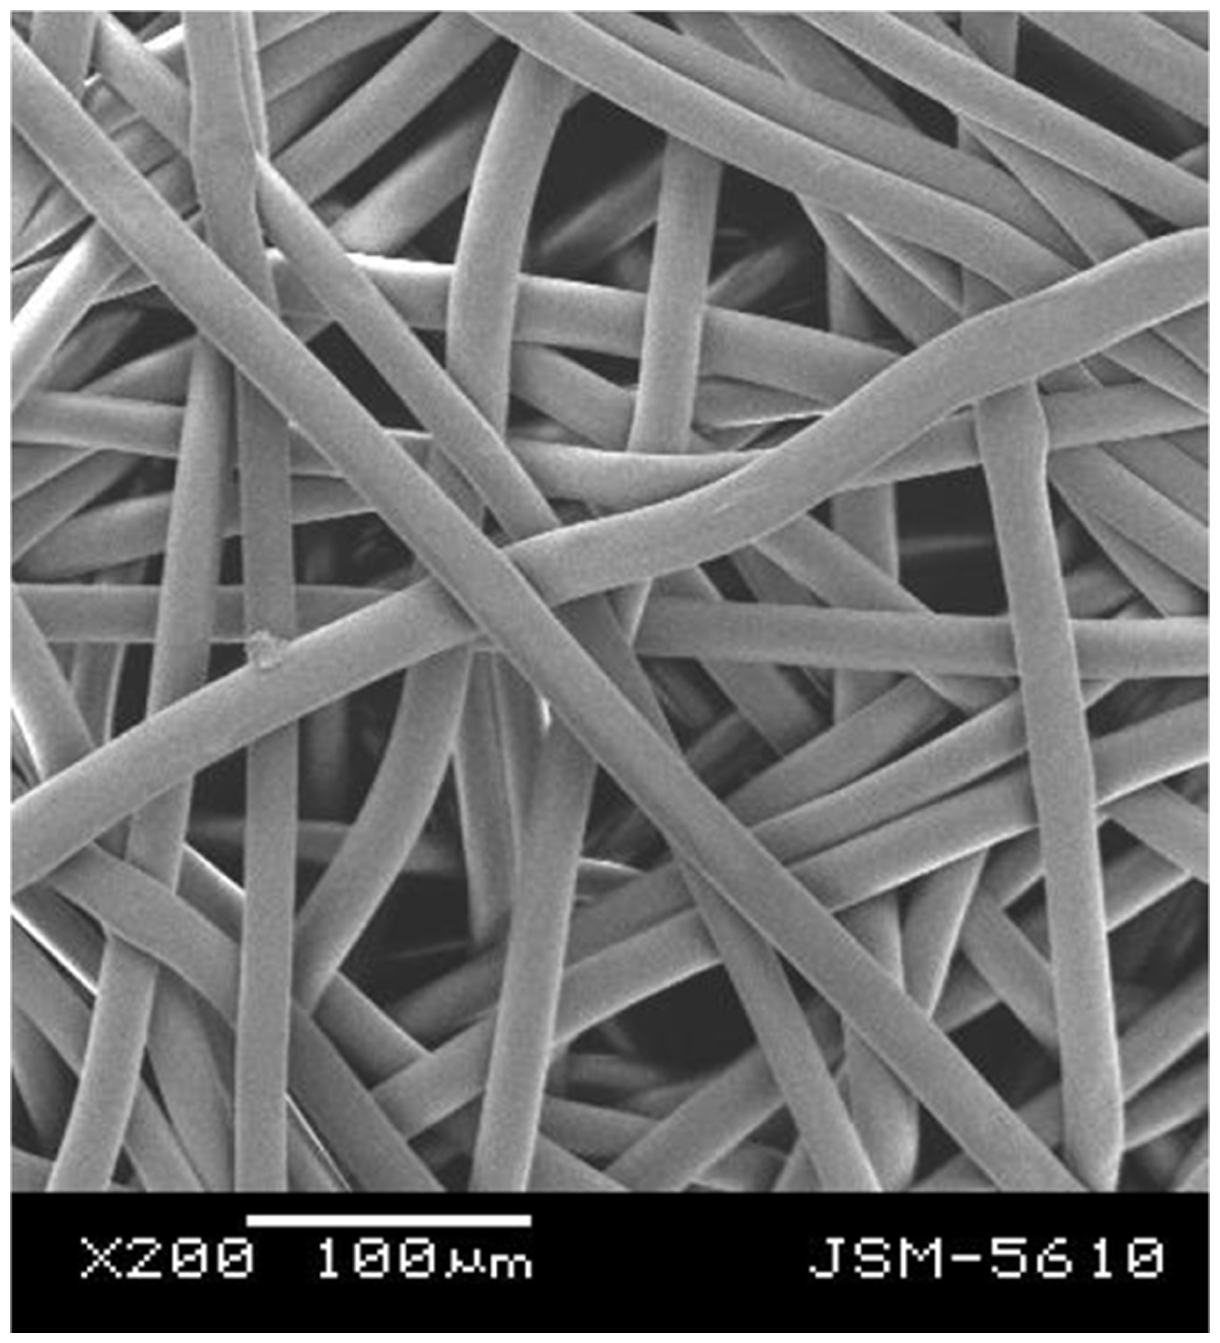
The orientation factor Of was employed to characterize the fiber orientation degree of the samples, and it is defined by equation (2)

Tests of pore size Ps and its standard deviation were performed in the PSM165 pore size tester (Topas GmbH, Frankfurt, Germany). Five different places were tested on each sample.
Test results of fiber web structure parameters of 30 spunbonded nonwoven samples

Nonwoven can be considered as a fiber assembly that is composed of several layers of superimposed elemental planes. These elemental planes comprise several fibers in a crossover arrangement with a thickness that is twice the fiber diameter. The feature length of an elemental plane σ can be calculated as follows

The number of elemental planes n is calculated by

The parameter ϕ is calculated by

Values of all nine parameters characterizing the meso-structure of 30 spunbonded nonwoven samples
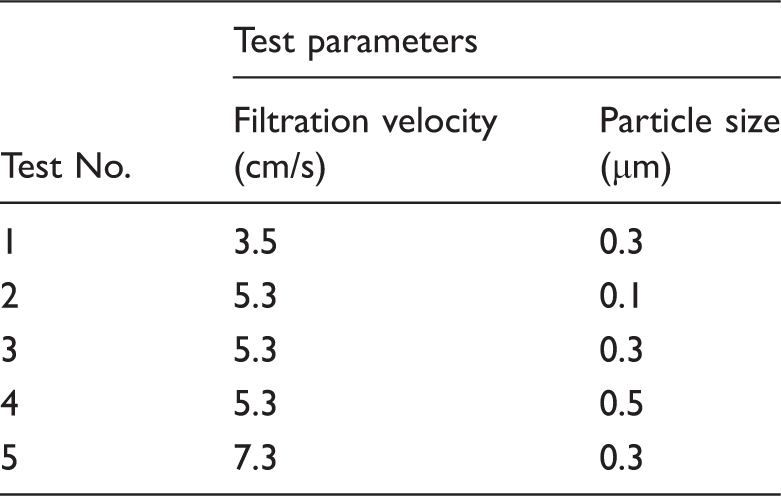
Test scheme for filtration performance
Test results of filtration performance

Notes: FE—filtration efficiency (%)
ΔP—pressure drop (Pa)
Attribute reduction
Discrete normalization result of the attribute values

In this study, attribute reduction was performed using a genetic algorithm by applying the software ROSETTA. Let Os be the original structural parameter set of the fiber web, that is

Four reducts of Os were obtained after attribute reduction; let ri represent the ith reduct (i = 1, 2, 3, 4). The reducts are given by




From equations (6), (7), (8), (9), and (10), it can be seen that the parameters considered to be redundant in Os are μ, ϕ, and Vp. This can be attributed to the fact that μ can be calculated using T, σ, ρ, and d according to equation (3), and ϕ can be calculated using σ and d according to equation (5) and equation (3). Moreover, the variation of Vp coincides well with that of Ps, which can be clearly inferred from the data in Table 2.
Prediction model
Structures of prediction models
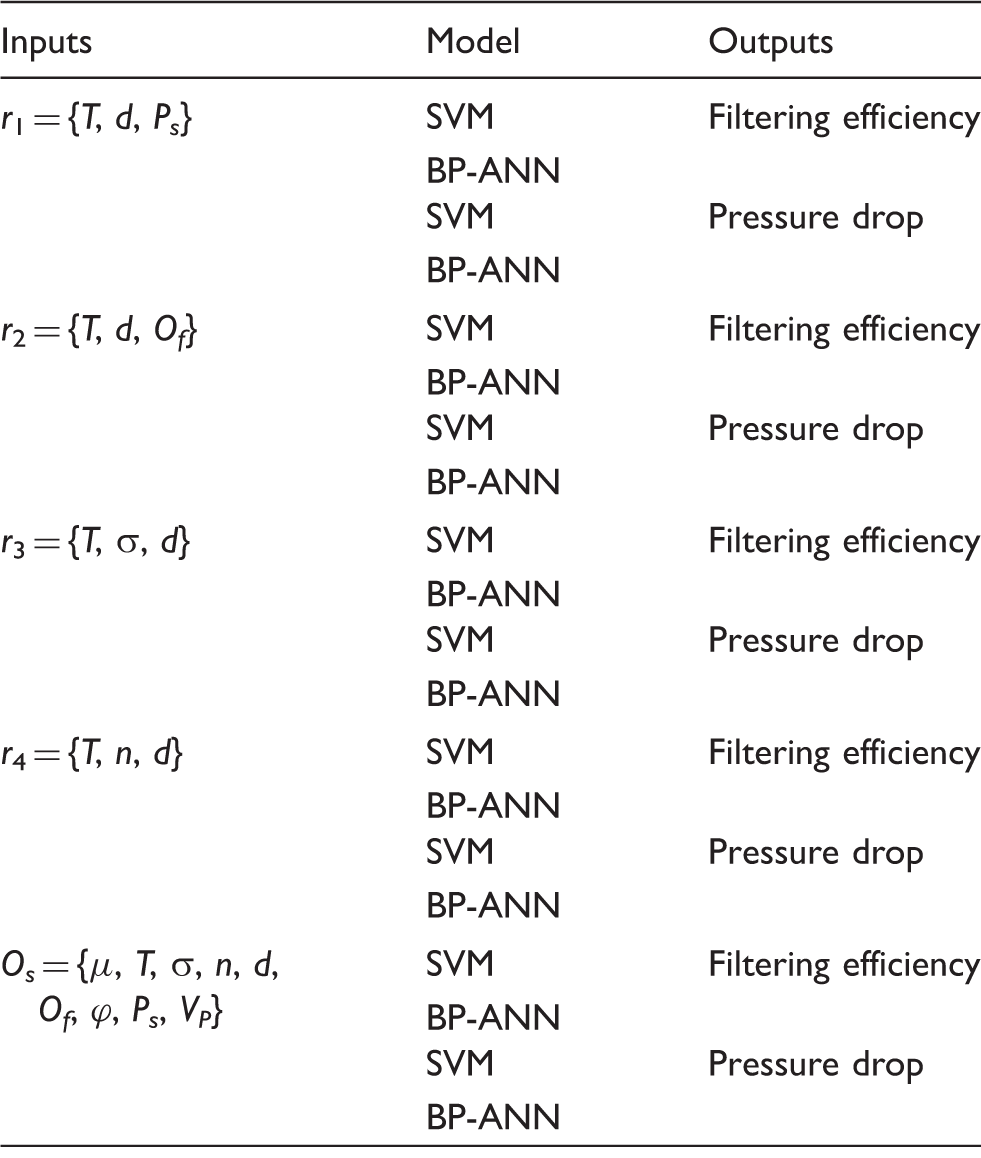
BP-ANN: back-propagation artificial neural network; SVM: support vector machine.
Optimized SVM parameters and nodes in the hidden layer of BP-ANN models

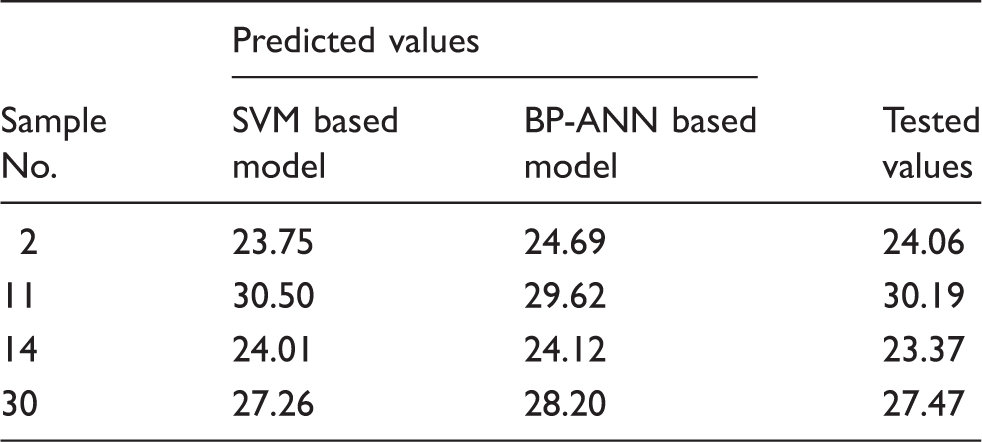
Prediction of filtration performance using SVM and BP-ANN based model
Filtration efficiency data obtained from predicting and from testing in the example
Results and discussions

Prediction accuracy of models that take the original structural parameter set of the fiber web and its four reducts as the inputs
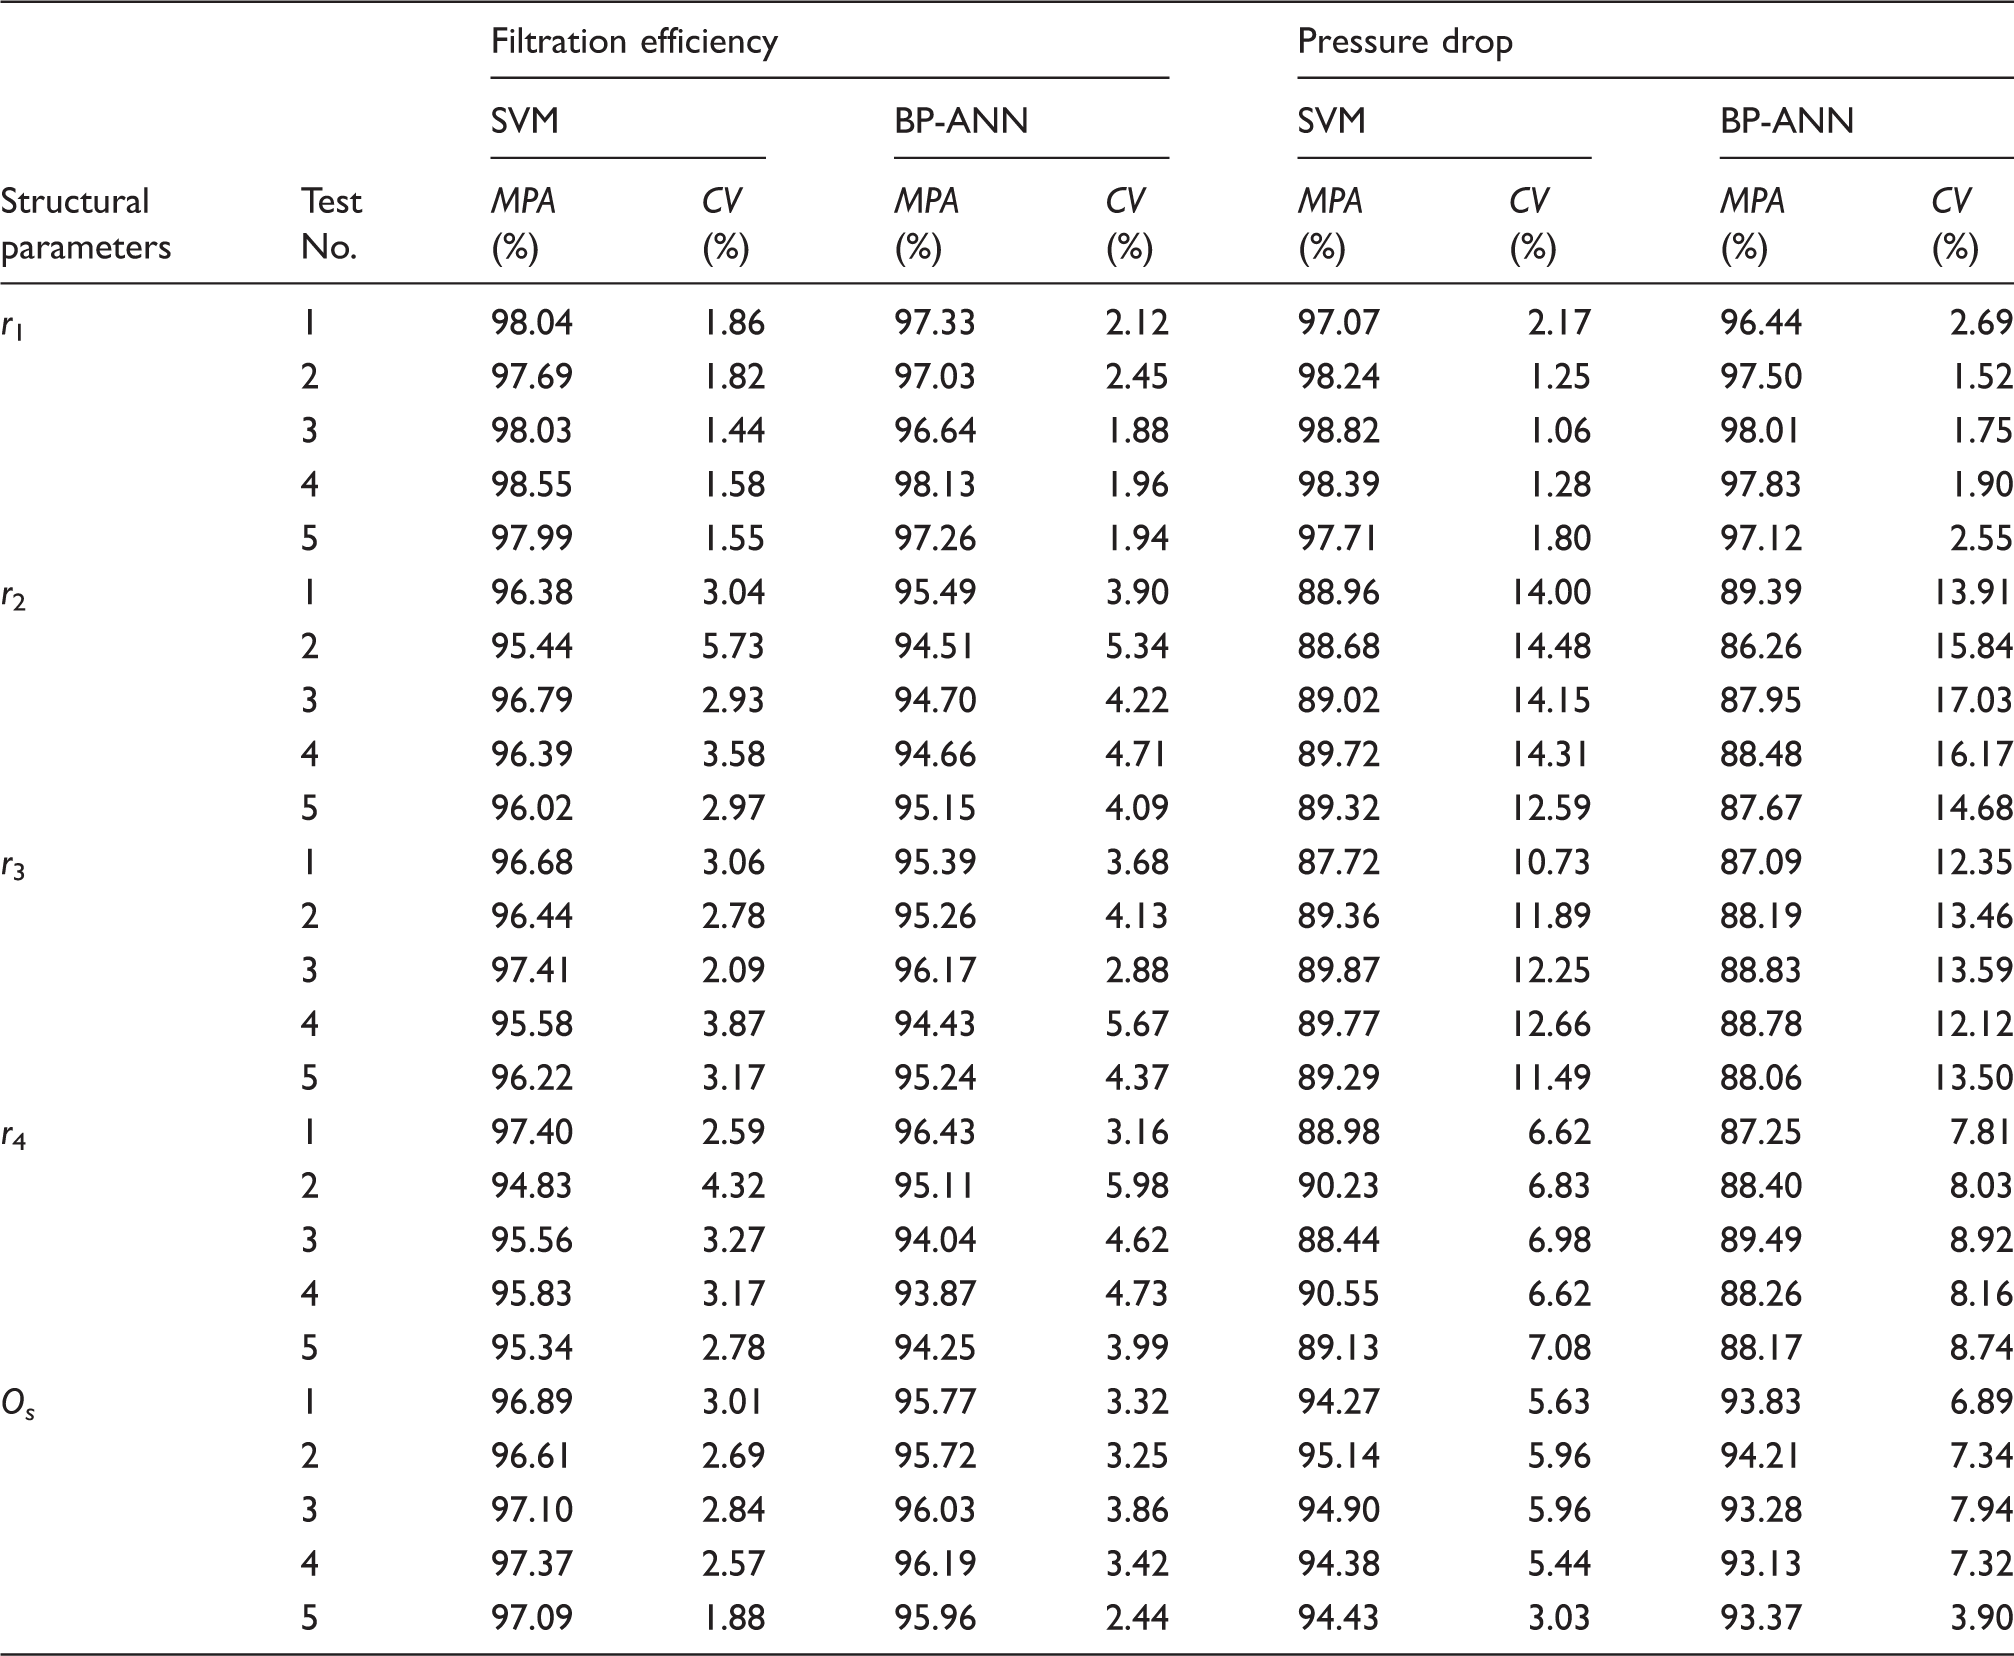
The abbreviation MPA indicates the mean value of PA. It can be seen from the table that the prediction accuracy of the model that takes r1 as input is higher than any other model except the one that takes Os as input. This indicates that there exist fiber web structure parameters that have low impact on the filtration performance within Os. Apart from the models that take r3 and r4 as inputs to predict the filtration efficiencies in Test No. 3 and Test No. 1, respectively, the prediction accuracy of the models that take r2, r3, and r4 as inputs are all lower than that of the model that takes Os as input, according to both MPA and CV. Therefore, it can be concluded that r1 is the most representative reduct of Os for predicting the filtration performance of spunbonded nonwoven. The ranking of the inputs as regards to predictive ability is r1 > Os > r4 > r3 > r2. This ranking is based on the prediction accuracy for pressure drop because the results show that the differences in the prediction accuracy for pressure drop were far greater than those for filtration efficiency. In fact, all three elements in r1, i.e., the thickness, fiber diameter, and pore size, influence the filtration performance of spunbonded nonwoven considerably. The filtration efficiency increases as the pore size decreases; however, the pressure drop increases correspondingly. This is because smaller pores allow fewer particles to pass through and generate higher resistance to air flow.2,6,17 Increasing the thickness of a spunbonded nonwoven material can improve its filtration efficiency and increase its pressure drop. This is because the pores in nonwoven materials are interconnected and three-dimensional; hence, the thicker the material, the more tortuous its pore channels are. As a result, more particles can be intercepted with increasing resistance to air flow.18,19 Decreasing the fineness of fibers can improve the filtration efficiency of nonwovens. The main reason is that the specific surface area of the fiber increases when the fiber diameter decreases, such that the fiber can intercept more particles.4,5 The influence of fiber diameter on filtration efficiency can also be observed in the experimental results in this investigation. The values of basis weight and thickness of sample No.12 are larger than those of sample No.1, while the pore size of sample No.12 is smaller than that of sample No.1. However, the values of their respective filtration efficiencies are almost the same irrespective of the test No., as can be observed from Table 4, because the fiber diameter of sample No.1 is smaller than that of sample No.12. Similar situations can also be seen in other two sample pairs: sample No.4 and No.15; and sample No.6 and No.17. Further, the influence of parameters σ, n, and Of on the filtration performance of spunbonded nonwoven is considered to be comparatively indirect. From among them, n can be calculated using T and d, according to equation (4). Besides, the influence of parameters σ and Of on the filtration performance can be reflected indirectly by using parameter Ps. The reason is that the pore size can be considered to be determined by several elemental planes. 20 (For straight stiff fibers, the number of elemental planes Nep is 2; thus, for spunbonded nonwoven materials, Nep can be considered to be 2.) The elemental plane can be characterized using the three parameters σ, d, and Of; therefore, the parameter Ps can reflect the information contained by parameters σ and Of about the fiber web structure to a certain degree. Generally, the basis weight of a nonwoven plays an important role in influencing the filtration performance. The reason why the basis weight fails to be taken as the governing parameter for predicting the filtration performance according to rough set theory may be due to the fact that, according to the filtration mechanism, it is the fibers that intercept the particles. Therefore, it is the number of fibers per unit volume, the character of the fiber (including its diameter, cross-section shape, etc.) and the stacking morphology of fibers (namely the pore structure), as opposed to the weight of the fiber in a unit area that determine the filtration performance of a nonwoven. The basis weight can only influence the filtration performance of nonwovens indirectly. 18
Parameter optimizing results of models taking “r1 − 1” and “r1 + 1” as the inputs
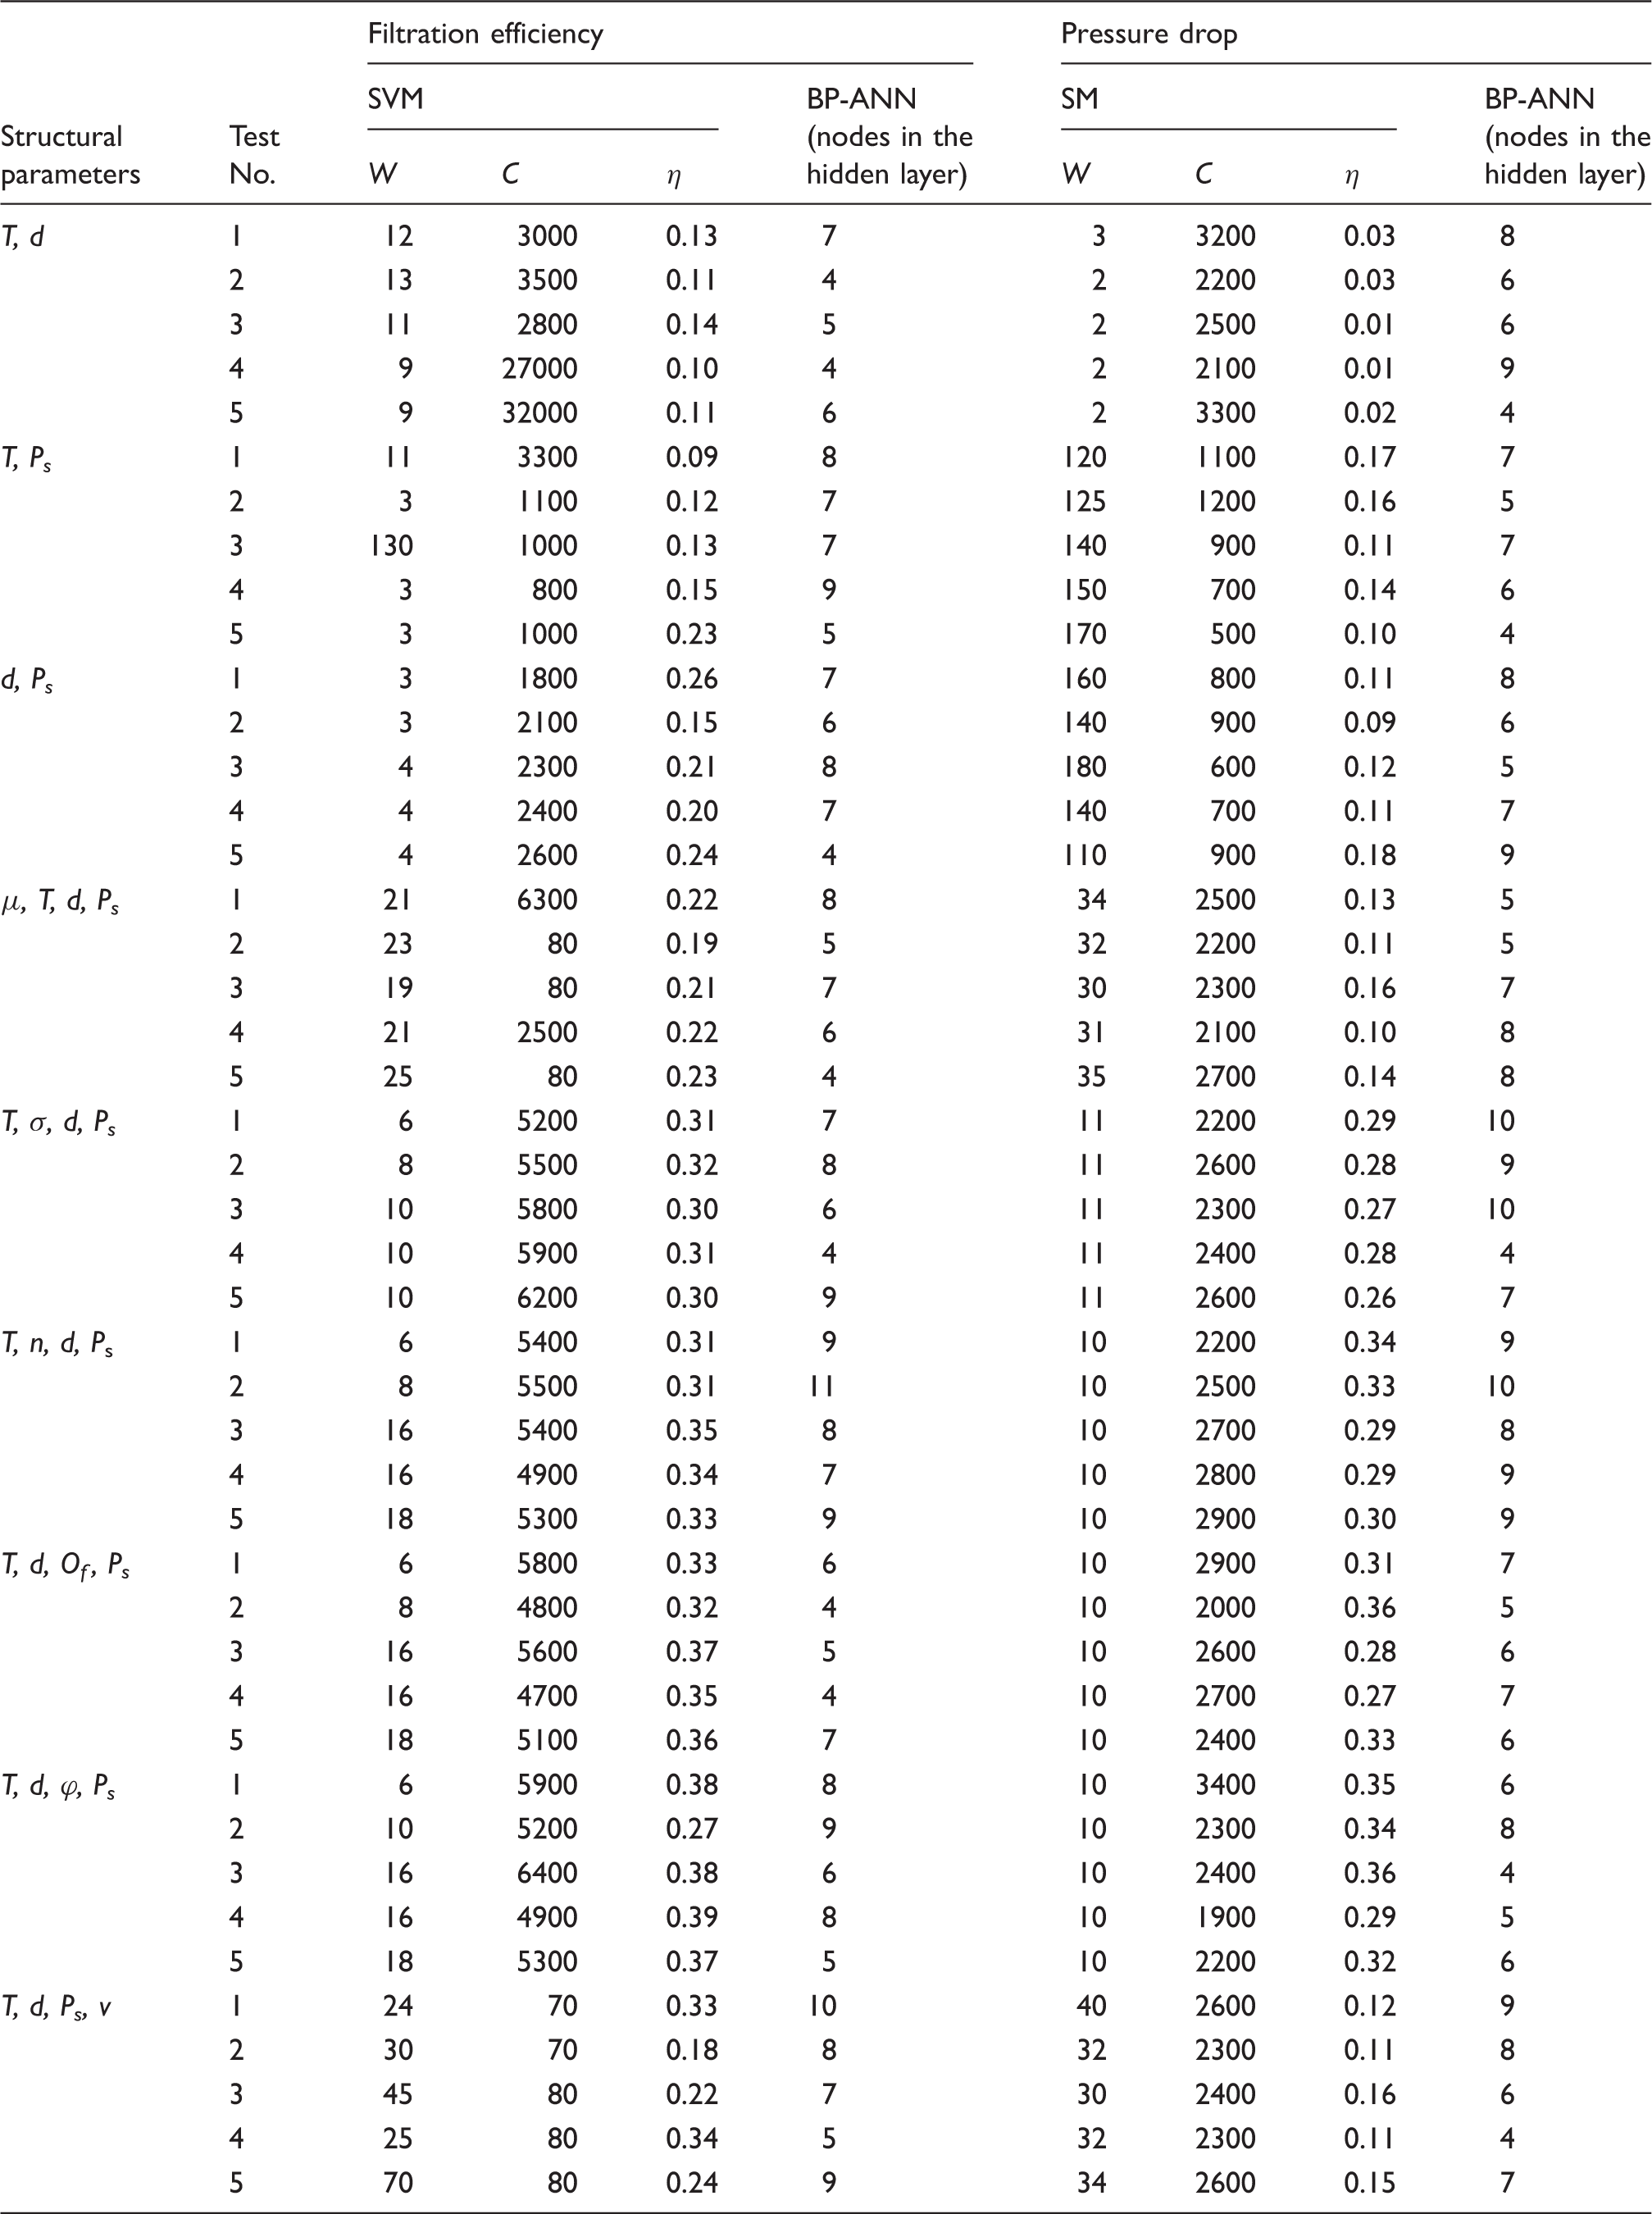
Filtration performance predicting results of models taking “r1 − 1” and “r1 + 1” as the inputs
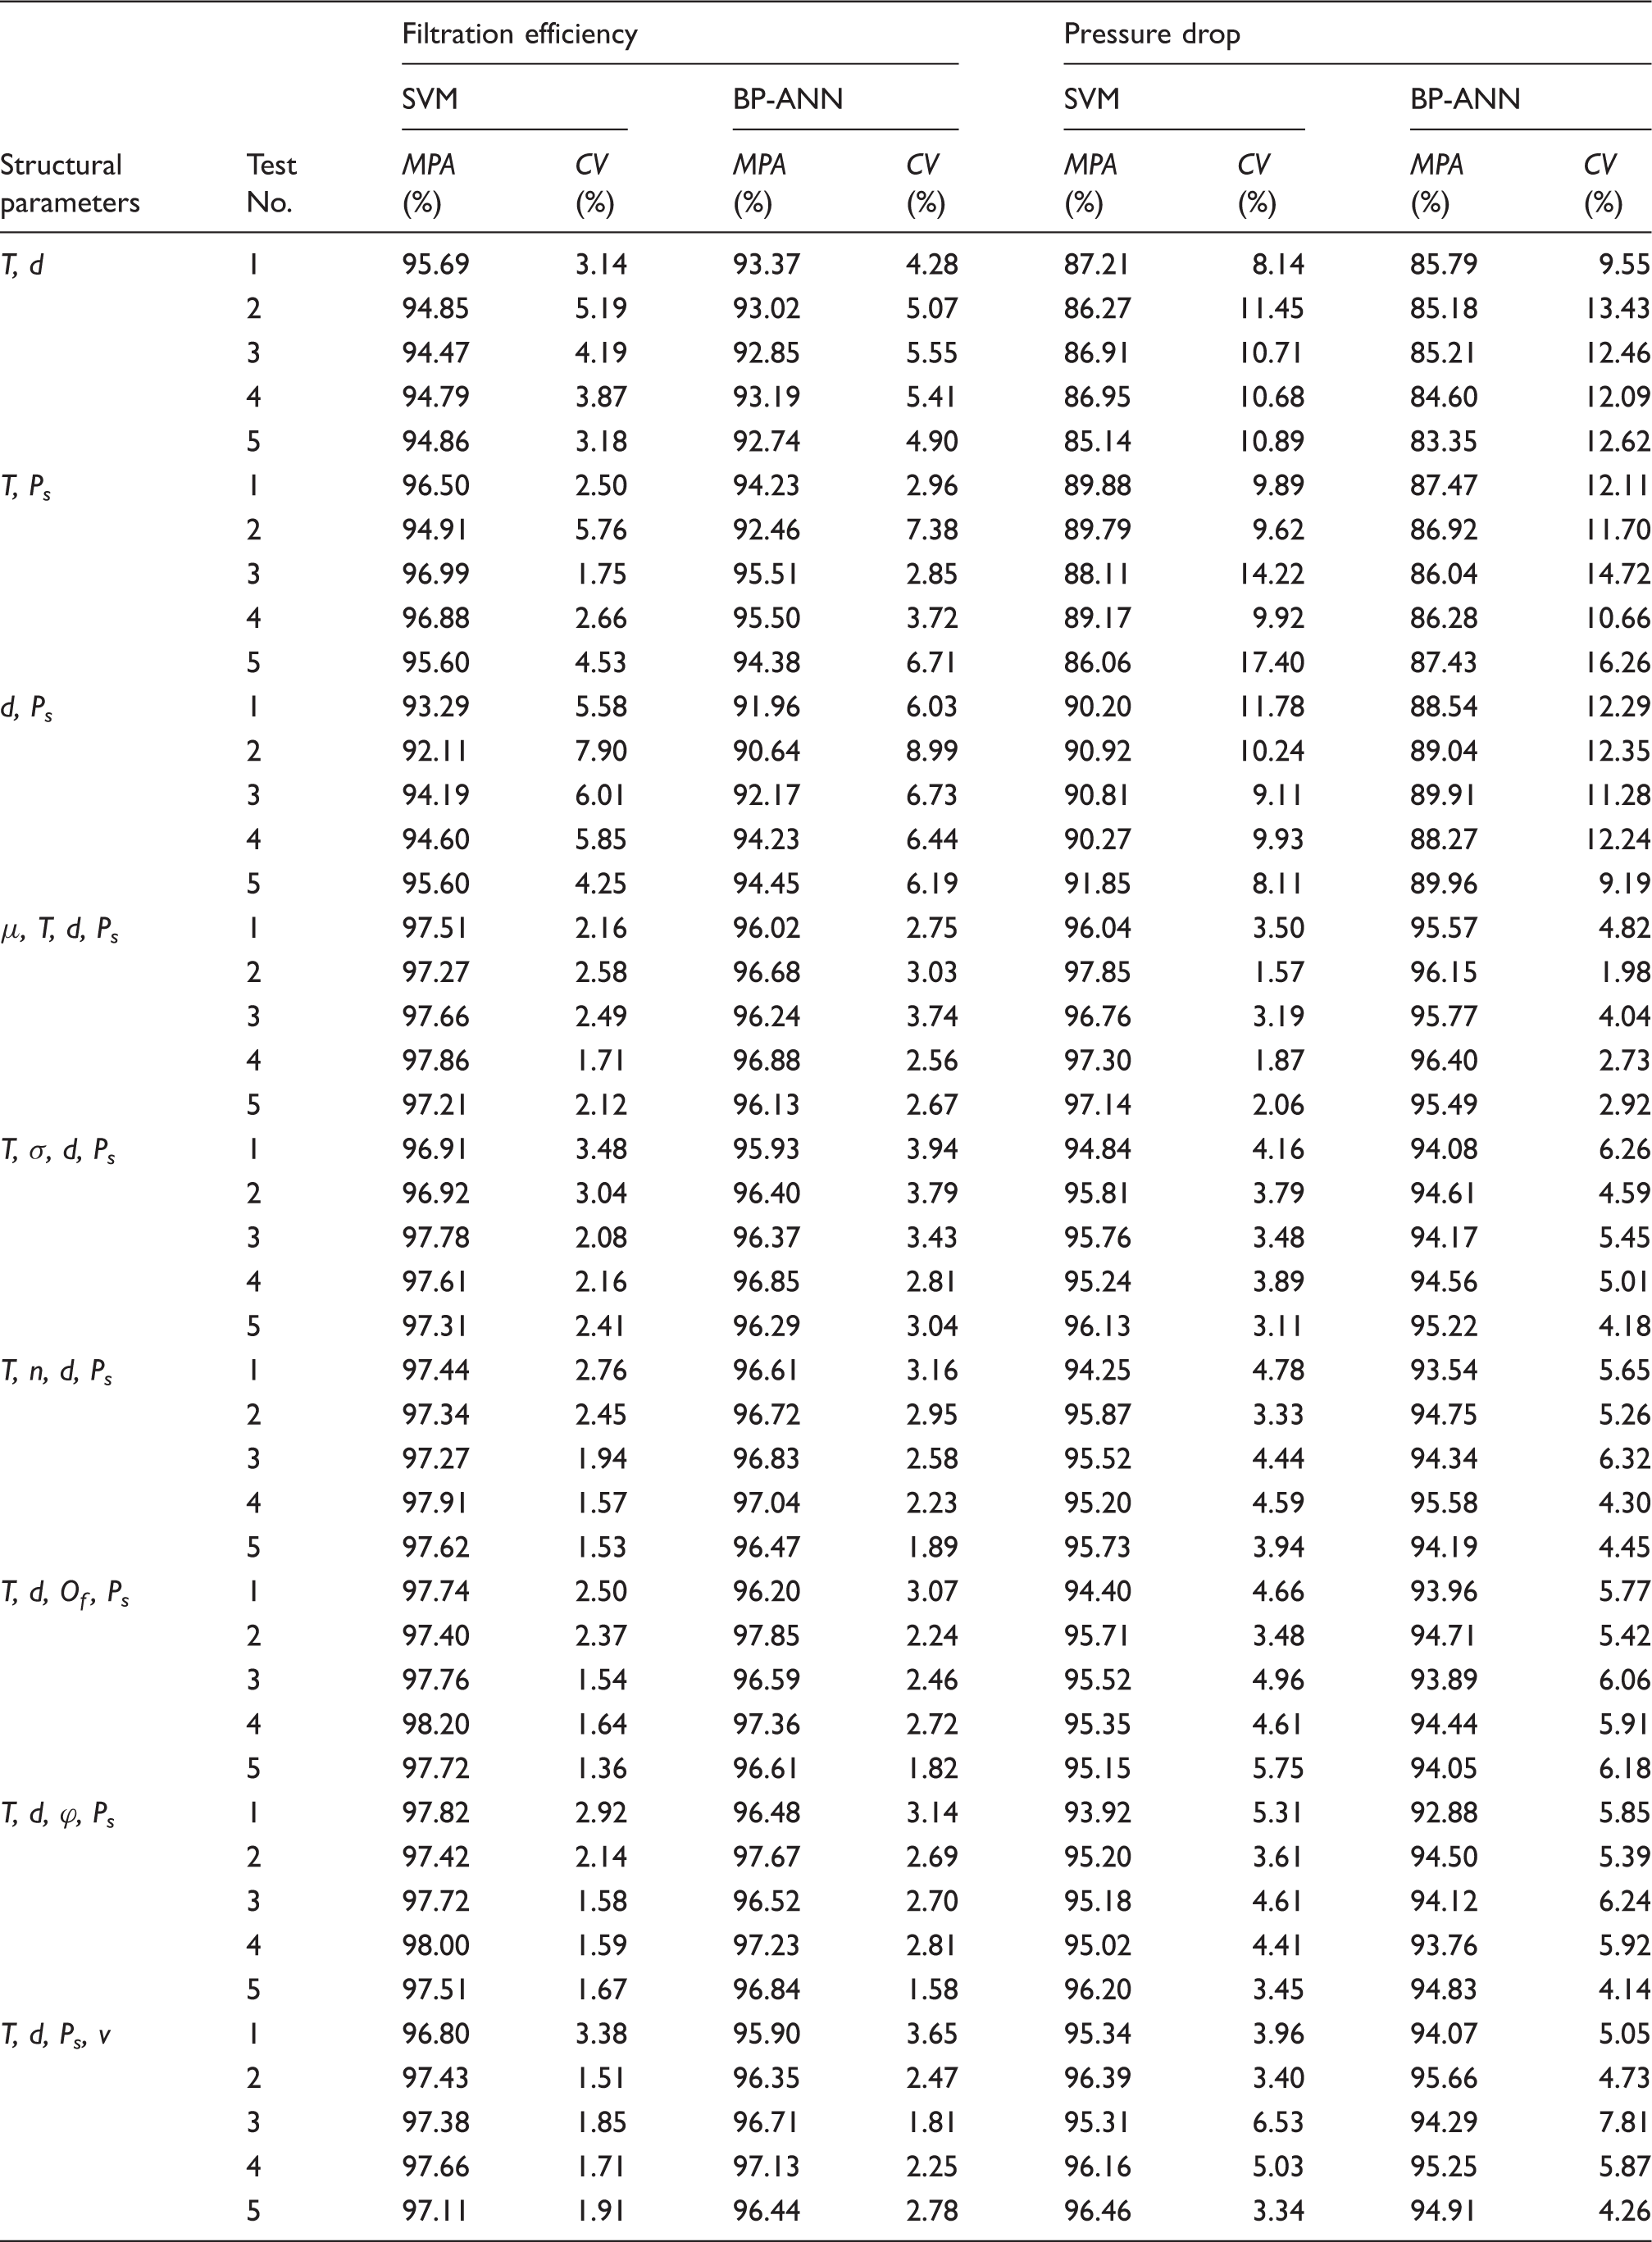
It can be observed from Table 11 that irrespective of the type of model (SVM-based or BP-ANN-based) or the test parameters (filtration velocity and particle size), the prediction accuracy (MPA and CV) of all the models taking either “r1 − 1” or “r1 + 1” as their inputs are worse than that of the models taking r1 as their input. In addition, apart from the models that take T, Ps as inputs to predict the filtration efficiencies in Test No.1 and Test No.3, the prediction accuracy of the models taking “r1 − 1” as their input is worse than that of the models taking Os as their input. Therefore, the absence of any one parameter in r1 will deteriorate the prediction accuracy of the model. Moreover, all models taking “r1 + 1” as their inputs demonstrate a relatively high predictive power because all the MPAs of the predicted values are higher than 92%, and all the CVs of the predicted values are lower than 8%. Furthermore, among all the 240 prediction accuracy values (MPA and CV) of these models, 88.33% of them, that is, 212 values are better than their counterparts in the model taking Os as its input, indicating that a model whose input includes r1 demonstrates good prediction ability. All the above results further prove the conclusion that r1 is the most representative reduct of Os for predicting the filtration performance of spunbonded nonwoven.
Besides, the results in Tables 9 and 11 indicate that the prediction accuracy of the SVM-based models exceeds that of the BP-ANN-based models, because among 280 prediction accuracy values (MPA and CV) predicted by SVM-based models, 94.29% of them, that is, 264 values were better than their counterparts predicted by BP-ANN-based models. This can be attributed to the improved generalization capacity and ability of the SVM-based models to handle noisy data as compared to the BP-ANN models. In summary, the SVM-based model that takes thickness, fiber diameter, and pore size as its input parameters is the best fit equation to predict the filtration efficiency or pressure drop of spunbonded nonwoven.
Conclusion
RS theory was applied to simplify the inputs of SVM- and BP-ANN-based models for predicting the filtration performance of spunbonded nonwoven. As a result, the number of input parameters decreased from nine to three after attribute reduction, greatly improving the working efficiency. The most informative reduct, r1, consisted of thickness, fiber diameter, and pore size parameters. The accuracy of prediction models taking r1 as their input was higher than that of the models taking the original structural parameter set of the fiber web as their input. In addition, the predictive power of the SVM model was found to be superior to that of the BP-ANN model. Therefore, it can be concluded that thickness, fiber diameter, and pore size are the key factors influencing the filtration performance of spunbonded nonwoven, and the RS–SVM-based model could be an effective method for predicting the filtration performance of these materials. However, the influence of the other six parameters (μ, σ, n, Of, ϕ, v) on the filtration performance of spunbonded nonwoven should not be considered negligible. They are only of lesser importance in predicting the filtration efficiency and pressure drop of these materials compared with parameters T, d, and Ps.
Footnotes
Declaration of conflicting interests
The authors declared no potential conflicts of interest with respect to the research, authorship, and/or publication of this article.
Funding
The authors disclosed receipt of the following financial support for the research, authorship, and/or publication of this article: The study was supported by the Key Laboratory of Zhejiang Industrial Textile Material and Preparation Technology Research (2012E10010).