




Abstract
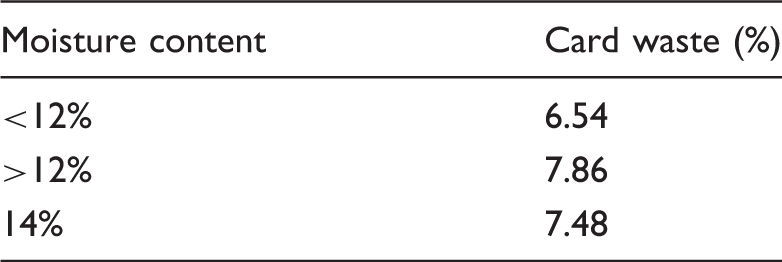
This study examined the fiber quality of saw ginned Upland cotton, harvested from one field using a John Deere (JD) 7760 at three moisture levels, <12%, >12% and 14%, and storing the harvested modules for 12 weeks prior to ginning. There was a significant difference between the three moisture levels for fiber color, with seed cotton harvested at >12% and 14% resulting in fiber that was yellower, with lower reflectance and a color grade of 52, as compared to a 51 grade for seed cotton harvested at <12% moisture. The seed cotton harvested at >12% and 14% contained more trash with a leaf grade of 3, compared to a leaf grade of 2 for the seed cotton harvested at <12%. There was no significant difference between the three moisture levels in terms of fiber length and strength, but fiber micronaire was higher for the seed cotton harvested at >12% and 14% moisture content. There was no significant difference between the moisture levels for total nep count, but the seed cotton harvested at >12% had larger neps and more seed coat neps than the seed cotton harvested at <12% and 14%. In the second part of this study the fiber was spun into fine count yarns on a miniature spinning system to assess the impact on textile processing in terms of yarn and fabric quality and processing performance. The study found that the card waste for the lower moisture content harvested fiber was less than the card waste for higher moisture content harvested fiber. In terms of yarn and fabric quality, the statistically significant differences observed in fiber quality did not translate into statistically significant differences in yarn or fabric quality at any moisture content level. Surprisingly, the statistically significant differences in fiber color did not affect the color and appearance of the knitted dyed fabrics.
The aim of this study was to investigate the effect of moisture content of seed cotton during harvesting on fiber, yarn and fabric quality and processing performance. All fiber was harvested using a John Deere (JD) 7760 spindle harvester.
Part 11 of this study found that there were no significant differences between the fiber quality in terms of fiber length, uniformity, strength, fibrous neps and trash size produced from harvesting seed cotton at moisture contents of <12% and >12%. There were, however, significant differences between the two moisture levels in terms of micronaire, short fiber content, color, trash, dust, seed coat neps and nep size. In terms of processing performance of the gin was forced to reduce production by 20% to alleviate blockages while processing the >12% moisture content fiber. The lint turn out achieved with the seed cotton harvested at <12% was on average 0.5% higher than that achieved by the seed cotton harvested at >12%, with no difference in the residual lint results for the two moisture levels. The seeds from the >12% fiber were extremely wet, moldy, emitted a strong unpleasant odor and were very soft, resulting in a significant difference in germination.
In Part 2 of this study the fiber produced during the trial, as well as fiber samples from seed cotton harvested at 14%, from a separate study conducted at the same time on the same field and ginned at the same gin, was spun into fine count yarns on a miniature spinning system to assess the impact on textile processing in terms of yarn and fabric quality and processing performance. Miniature spinning, which is usually thought of as the processing of ≤1 kg lots, is not a new concept and was mainly developed to evaluate cotton varieties and new strains in breeding programs and to enable commercial mills to evaluate spinning performance.2,3 The development and commercialization of the High Volume Instrument (HVI™) to better describe cotton fiber quality in the 1970s resulted in the diminishing use of miniature spinning systems. It is, however, understood that whilst the fiber quality properties reported by the HVI™ can predict a large proportion of yarn quality variation, there remains a reasonable proportion of unattributed variation, due to fiber properties that are not typically measured by the HVI™, which has resulted in a renewed interest in miniature spinning. Yarns for this study were processed on a modified miniature spinning system (which combines both miniature and conventional machines, as per Figure 1) as it has been shown that the quality and processing behavior of yarns using the modified miniature spinning system is comparable to commercial processing.
2
Textile processing for the production of fiber to fabric.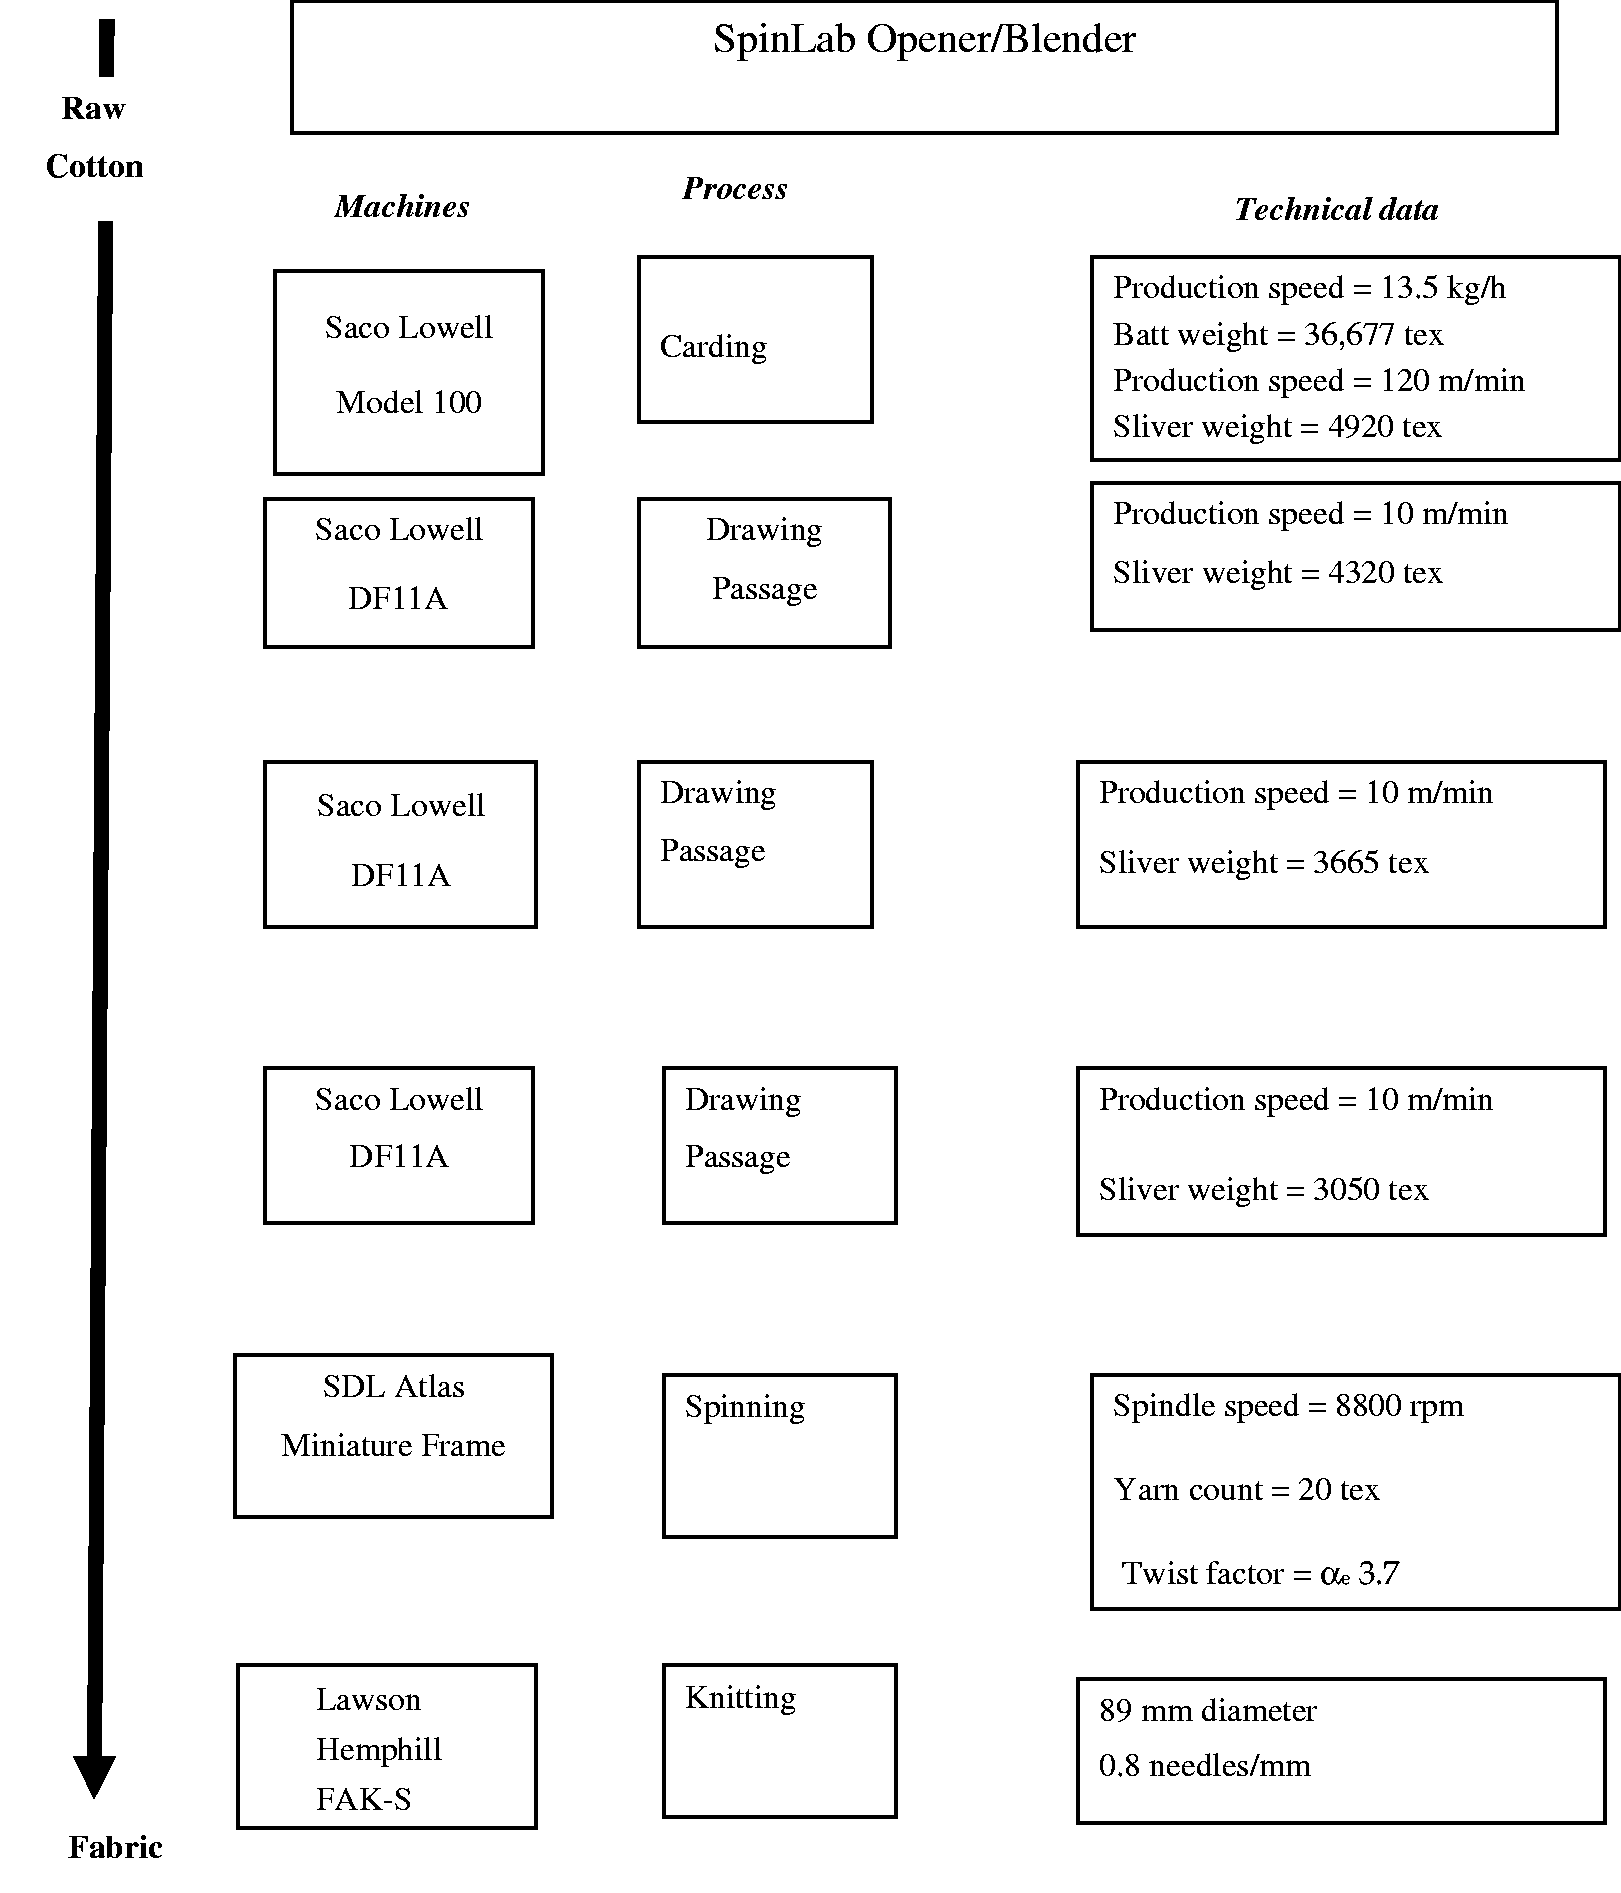
Materials and methods
Eight samples were randomly selected from each of the three moisture levels and processed into yarn and fabric. A total of 24 samples were processed into yarn and fabric at the United States Department of Agriculture (USDA) Cotton Structure and Quality Research Unit in New Orleans, Louisiana. The USDA miniature-scale processing plant was used to convert the fiber into 20/1 tex (30 Ne) carded ring spun yarns with a twist factor of αe 3.7. Sub-samples of 60 g each were opened using a SpinLab Opener/Blender Model 338 (Knoxville, TN) prior to being carded on a Saco Lowell Model 100 (Easley, SC) that was modified to collect carded web on a drum (1500 mm circumference and 215 mm width). The carded web was weighed to determine mass loss. The carded web was converted to sliver and subjected to three drawing passes using a modified Saco Lowell DF11A (Easley, SC) drawframe to produce 3 ktex (42 grain/yd) sliver. Yarn was produced directly from the resultant sliver on a SDL Atlas (Rock Hill, SC) miniature ring frame, with two bobbins of yarn produced for each sample. Single jersey knitted fabrics, of approximately 160 g/m2, were produced on a Lawson Hemphill FAK-S (Swansea, MA) sample knitter. Figure 1 provides specific material flow and processing parameters from fiber to fabric.
Two knitted fabrics were prepared for each sample. They were scoured and bleached together, with one sample being dyed separately. All wet processing was performed using a Mathis Lab Jumbo Jet JFO (Oberhasli, Switzerland) overflow dye jig. Scouring was performed using Triton X-100 wetting agent at 0.25 and 2.5 g/l sodium hydroxide at 100℃ for 30 minutes and then neutralized with 0.5 g/l acetic acid at 50℃ for 15 minutes. Bleaching was performed using 50% peroxide bleach at 5 g/l. The dyed fabrics were produced using Triton X-100 wetting agent at 0.25 g/l and a reactive dye – Novacron Blue LS-3R (Hunstman International, The Woodlands, TX) – at 1% concentration heated from 30℃ to 90℃ at 1℃/min and then held for 30 minutes at 90℃. The dyed fabrics were rinsed and neutralized using 1.0 g/l of acetic acid. All ancillary chemicals were obtained from Sigma-Aldrich (St. Louis, MO) and used as provided without alteration.
Classing samples were collected at the gin after bale formation and tested by HVI™, AFIS PRO and Cottonscope, as described in Part 1. 1 Yarn strength and elongation was tested utilizing an Uster® Technologies Tensorapid 4 (Uster, Switzerland) with 20 breaks per package as per ASTM D2256-10. 4 Yarn uniformity, imperfections (thin/thick/neps) and hairiness index were tested on an Uster® Technologies Tester 4 (Uster, Switzerland) as per ASTM D1425-14. 5 Fabrics were characterized after bleaching and after dyeing. Fabric color was measured in five locations per fabric with a Gretag Macbeth ColorEye 7000a (X-Rite Corporation, Grand Rapids, MI). Knitted fabric bursting strength was measured on a James H. Heal Co, Truburst Model 611 (Halifax, UK) with two replications as per ASTM D3786-13. 6 Air permeability of the fabrics was measured per ASTM D737-047 on a Frazier Precision Instruments Model 5400 (Hagerstown, MD) with five replications per sample.
Average yarn and fabric quality were calculated from the results of the three different seed cotton moisture levels. To test for statistical differences between the three moisture levels, an analysis of variance (ANOVA) on experimental data was conducted using Genstat 16.0 (Lawes Agricultural Trust, IACR Rothamsted, UK). Where significant statistical difference at the 0.05 and lower levels were identified, the least significant differences were calculated from which the mean differences were derived.
Results and discussion
The average moisture content for the seed cotton harvested at <12% was 11%, the average moisture content for the seed cotton harvested at >12% was 12.6% and the average moisture content for the seed cotton harvested at 14% was 13.8%.
Fiber quality
Mean and standard deviation (s.d.) results for High Volume Instrument measured fiber reflectance (Rd), yellowness (+b), color grade, upper half mean length, length uniformity, short fiber index (SFI), bundle strength, bundle elongation, and micronaire. Relevant probability values from analysis of variation testing indicate the degree of significance between the three moisture levels (n.s.: not significant). Means with the same letter are not significantly different

Mean and standard deviation (s.d.) values for High Volume Instrument (HVI™) measured trash count, area and leaf grade and AFIS PRO measured total trash, total trash size, trash, dust, and percent visible foreign matter (VFM). Relevant probability values from analysis of variance testing indicate the degree of significance between the three moisture levels (n.s.: not significant). Means with the same letter are not significantly different

There was no significant difference between the three moisture levels in terms of total neps, although the type and size of neps were significantly different (Table 3). The fiber from the seed cotton harvested at >12% had more seed coat neps which can be attributed to the higher moisture storage degrading the seed and weakening the seed coat and thus allowing more pieces of seed coat to pull away and entangle with fibers to form neps. This could explain why the average nep size and seed coat nep size was larger for the fiber from the seed cotton harvested at >12%.
Card waste
Mean and standard deviation (s.d.) values for AFIS PRO measured total neps, fiber neps, seed coat neps (SCN), average total nep size, and average SCN size. Relevant probability values from analysis of variance testing indicate the degree of significance between the three moisture treatments (n.s.: not significant). Means with the same letter are not significantly different

Card waste per moisture content level
Yarn quality
Mean and standard deviation (s.d.) values for yarn count (tex), strength, evenness, imperfections/1000 m and hairiness index for yarns produced from the three moisture levels. Relevant probability values from analysis of variance testing indicate the degree of significance between the three moisture levels (n.s.: not significant)

Although the average yarn results in terms of strength, elongation, evenness and hairiness for the yarns produced from the seed cotton harvested at <12% were better than those for the yarns produced from seed cotton harvested at >12% and 14%, the differences were not significant. The yarn results were not unexpected if one takes into account that there were no significant differences between the fiber strength and length of the lint produced from the seed cotton harvested at the three different moisture levels. The significant differences in micronaire values, which are in all likelihood due to the higher amount of trash and dust in the >12 and 14% harvested seed cotton, were nullified after carding.
Fabric quality
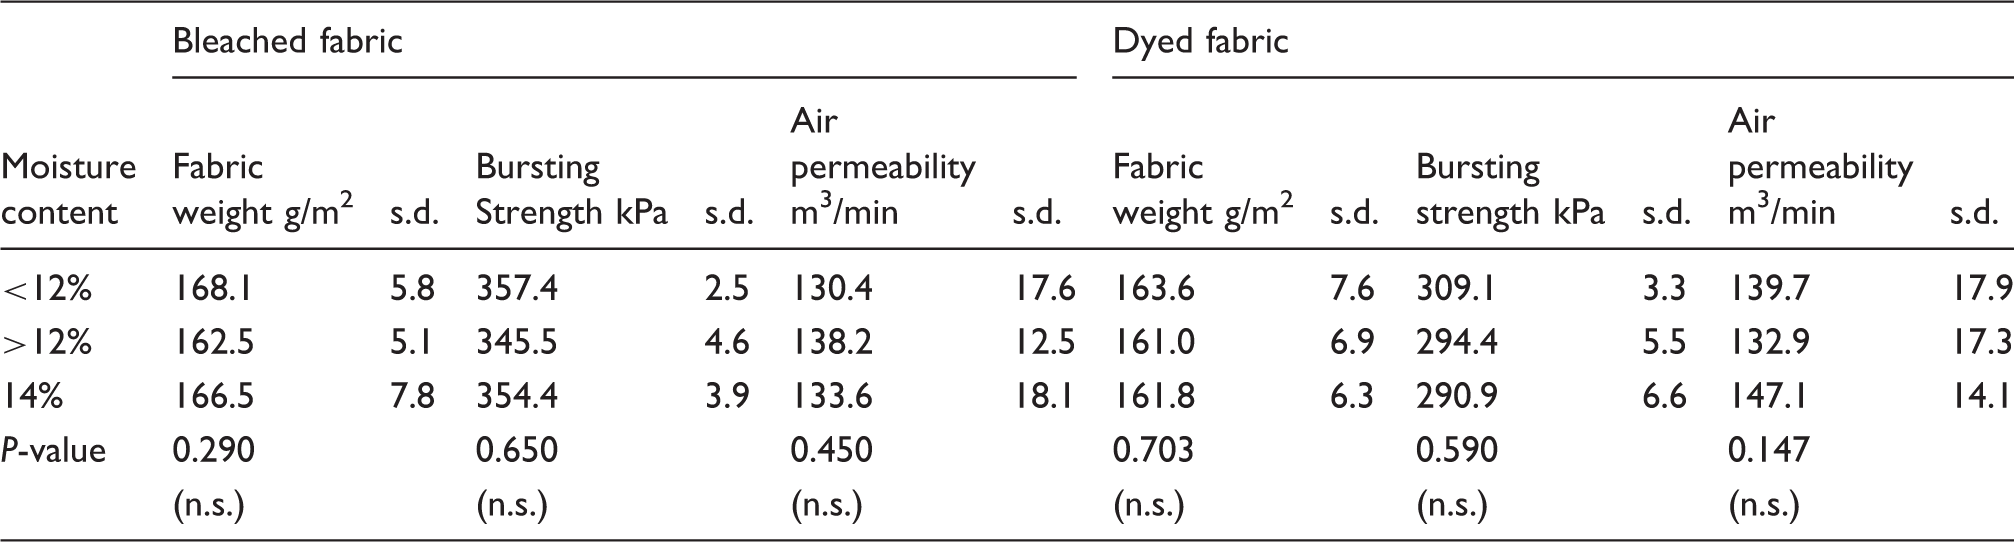
The bleached fabric weight ranged from 152 to 181 g/m2, while the dyed weight ranged from 151 to 172 g/m2. The bursting strength of the bleached fabric ranged from 305 to 393 kPa and the average air permeability ranged from 113 to 154 m3/min. There were no statistically significant differences in fabric appearance and handle between the bleached fabrics produced from yarns produced by the three different moisture levels. The bursting strength of the dyed fabric ranged from 217 to 360 kPa and the air permeability ranged from 118 to 163 m3/min. As was the case with the bleached fabrics, there were no statistically significant differences in fabric appearance and handle between the dyed fabrics produced from yarns produced from the three different moisture levels.
Mean and standard deviation (s.d.) values for fabric weight, bursting strength and air permeability for bleached and dyed fabrics produced from the three moisture levels. Relevant probability values from analysis of variance testing indicate the degree of significance between the three moisture levels (n.s.: not significant)
Mean and standard deviation (s.d.) values for CIELab L*, a* and b* for bleached and dyed fabrics produced from the three moisture levels. Relevant probability values from analysis of variance testing indicate the degree of significance between the three moisture levels (n.s.: not significant). Means with the same letter are not significantly different

For the bleached fabrics there were no statistically significant differences in color, with the exception of L*. There was a small but statistically significant difference in the L* values of the bleached fabric from the yarns produced from the three different moisture levels, with the bleached fabric produced from the <12% moisture content fiber slightly brighter than the fabrics produced from the seed cotton harvested at higher moisture levels. The average color difference, designated as Delta E, was calculated for the three bleached fabrics to determine the color differences between the three fabrics. The average Delta E values for the fabrics produced from the <12% and >12% was 0.82, for the >12% and 14% was 1.22 and for the <12% and 14% was 1.38. It is universally 9 accepted that a Delta E value between 1 and 2 is considered a small difference that is only noticeable to the trained eye.
For the dyed fabrics there were no statistically significant differences in terms of color. The average Delta E values for the dyed fabrics produced from the <12% and >12% was 0.20, for the >12% and 14% was 0.09 and for the <12% and14% was 0.51. It is universally 9 accepted that a Delta E value between 0 and 1 is considered to be not visible to the human eye.
Conclusion
This study was conducted as no published research has been undertaken to determine the effect of fiber moisture content during harvesting seed cotton in a high-production system using a JD 7760 spindle harvester on yarn and fabric quality and textile processing performance. Part 1 of this study, as well as fiber harvested at 14%, found that there were significant differences in terms of fiber quality and processing performance of seed cotton harvested at three moisture levels, <12%, >12% and 14%, and after storing the harvested modules for 12 weeks prior to ginning. Fiber from these studies was spun into fine count yarns on a miniature spinning system to assess the impact on textile processing in terms of yarn and fabric quality and processing performance. The study found that the card waste for the fiber from the seed cotton harvested at <12% moisture content was lower than that obtained from the fiber produced from the seed cotton harvested at >12% and 14%. In terms of yarn and fabric quality, the significant differences in fiber quality did not translate into any significant differences in yarn or fabric quality. Surprisingly, the significant differences in fiber color did not affect the color and appearance of the dyed knitted fabrics.
Disclaimer
Mention of any trade names or commercial products in the publication is solely for the purpose of providing specific information and does not imply recommendation or endorsement by the authors.
Footnotes
Acknowledgement
The authors would like to extend their thanks and gratitude to the various technicians that have processed the fiber into yarn and fabric and conducted the various tests as required.
Declaration of conflicting interests
The authors declared no potential conflicts of interest with respect to the research, authorship and/or publication of this article.
Funding
The authors received no financial support for the research, authorship and/or publication of this article.