
Abstract
A new method combining the characteristics of macro-scale texture repeat patterns and micro-scale interwoven yarns of fabric images was proposed for yarn-dyed fabric density detection. The method was formulated in a research framework of multi-scale image processing and analysis. Firstly, a structure–texture decomposition approach was used to extract texture information and woven pattern details from the macro-scale fabric image. Secondly, a texture unit detection model was proposed to extract the texture units and to detect the yarn skewness in these texture units. Thirdly, a simple yet effective image registration method and a lightness gradient projection method were adopted to analyze the micro-scale fabric image and obtain the yarn locations in a texture unit. Finally, the average fabric density was calculated by coupling the near-regular features of texture units and yarn locations. The experiments showed that the proposed method was effective in detecting hundreds of yarns in the fabric samples and the computation time was very reasonable.
Fabric products have already become necessities for everyone. 1 Yarn-dyed fabric is an important type of woven fabric highly valued for its distinctive color and texture. With the higher demands for clothing appearance, yarn-dyed fabric plays a more important role in the textile market. 2 Yarn-dyed fabrics with repeat patterns have high economic merits in manufacturing because only using yarns of different colors will result in the fabrics having a variety of design styles.3,4 In the building of modern textile mills, computer-aided structure analysis for yarn-dyed fabrics has been an active research topic in recent decades.2,5–8
There are several important structure parameters in yarn-dyed fabrics, and the most important parameter is fabric density.9,10 In production practice, the sample size for fabric density analysis must be chosen properly to reduce the manual measurement error and the influence of irregular geometrical structures upon the test regions, such as yarn deformation, interstices between the neighboring yarns, and thickness variance of yarns. In order to achieve accurate analysis results, the most common sample size used in fabric density tests is (5–10) cm × (5–10) cm, and there are hundreds of yarns in the fabric. The current density analysis in textile mills is very time-consuming and tedious work that requires using a textile magnifying glass to count the yarns manually. To avoid mistakes, the warp and weft yarns must be counted twice. In addition, a minor mistake in counting will restart this process, making it challenging for mass operation. Thus, the manual density detection method damages eyesight and analysis errors are likely to be caused by eyestrain.
Although the research and development of intelligent systems has made considerable progress, the yarn-dyed fabric production enterprises still use the manual method for density inspection. One reason is that the current detection systems apply only to a very small sample whose physical size is less than
This study aims to provide a multi-scale analysis method to achieve efficient density detection for large-scale fabric samples whose dimensional size meets the practical requirements of textile mills. The analysis method requires two images of a fabric sample: the macro- and micro-scale images. These two images are defined as the images that contain hundreds of yarns and dozens of yarns, respectively. Figure 1 shows a fabric sample and its own two images.
Illustration of the macro-and micro-scale fabric images: (a) the macro-scale image of a fabric sample with 443 warp yarns and 393 weft yarns, where the actual sample size is 13.63 cm (width) by 13.31 cm (height); (b) the micro-scale image of the sample with 24 warp yarns and 21 weft yarns, where the actual sample size is 0.70 cm (width) by 0.70 cm (height).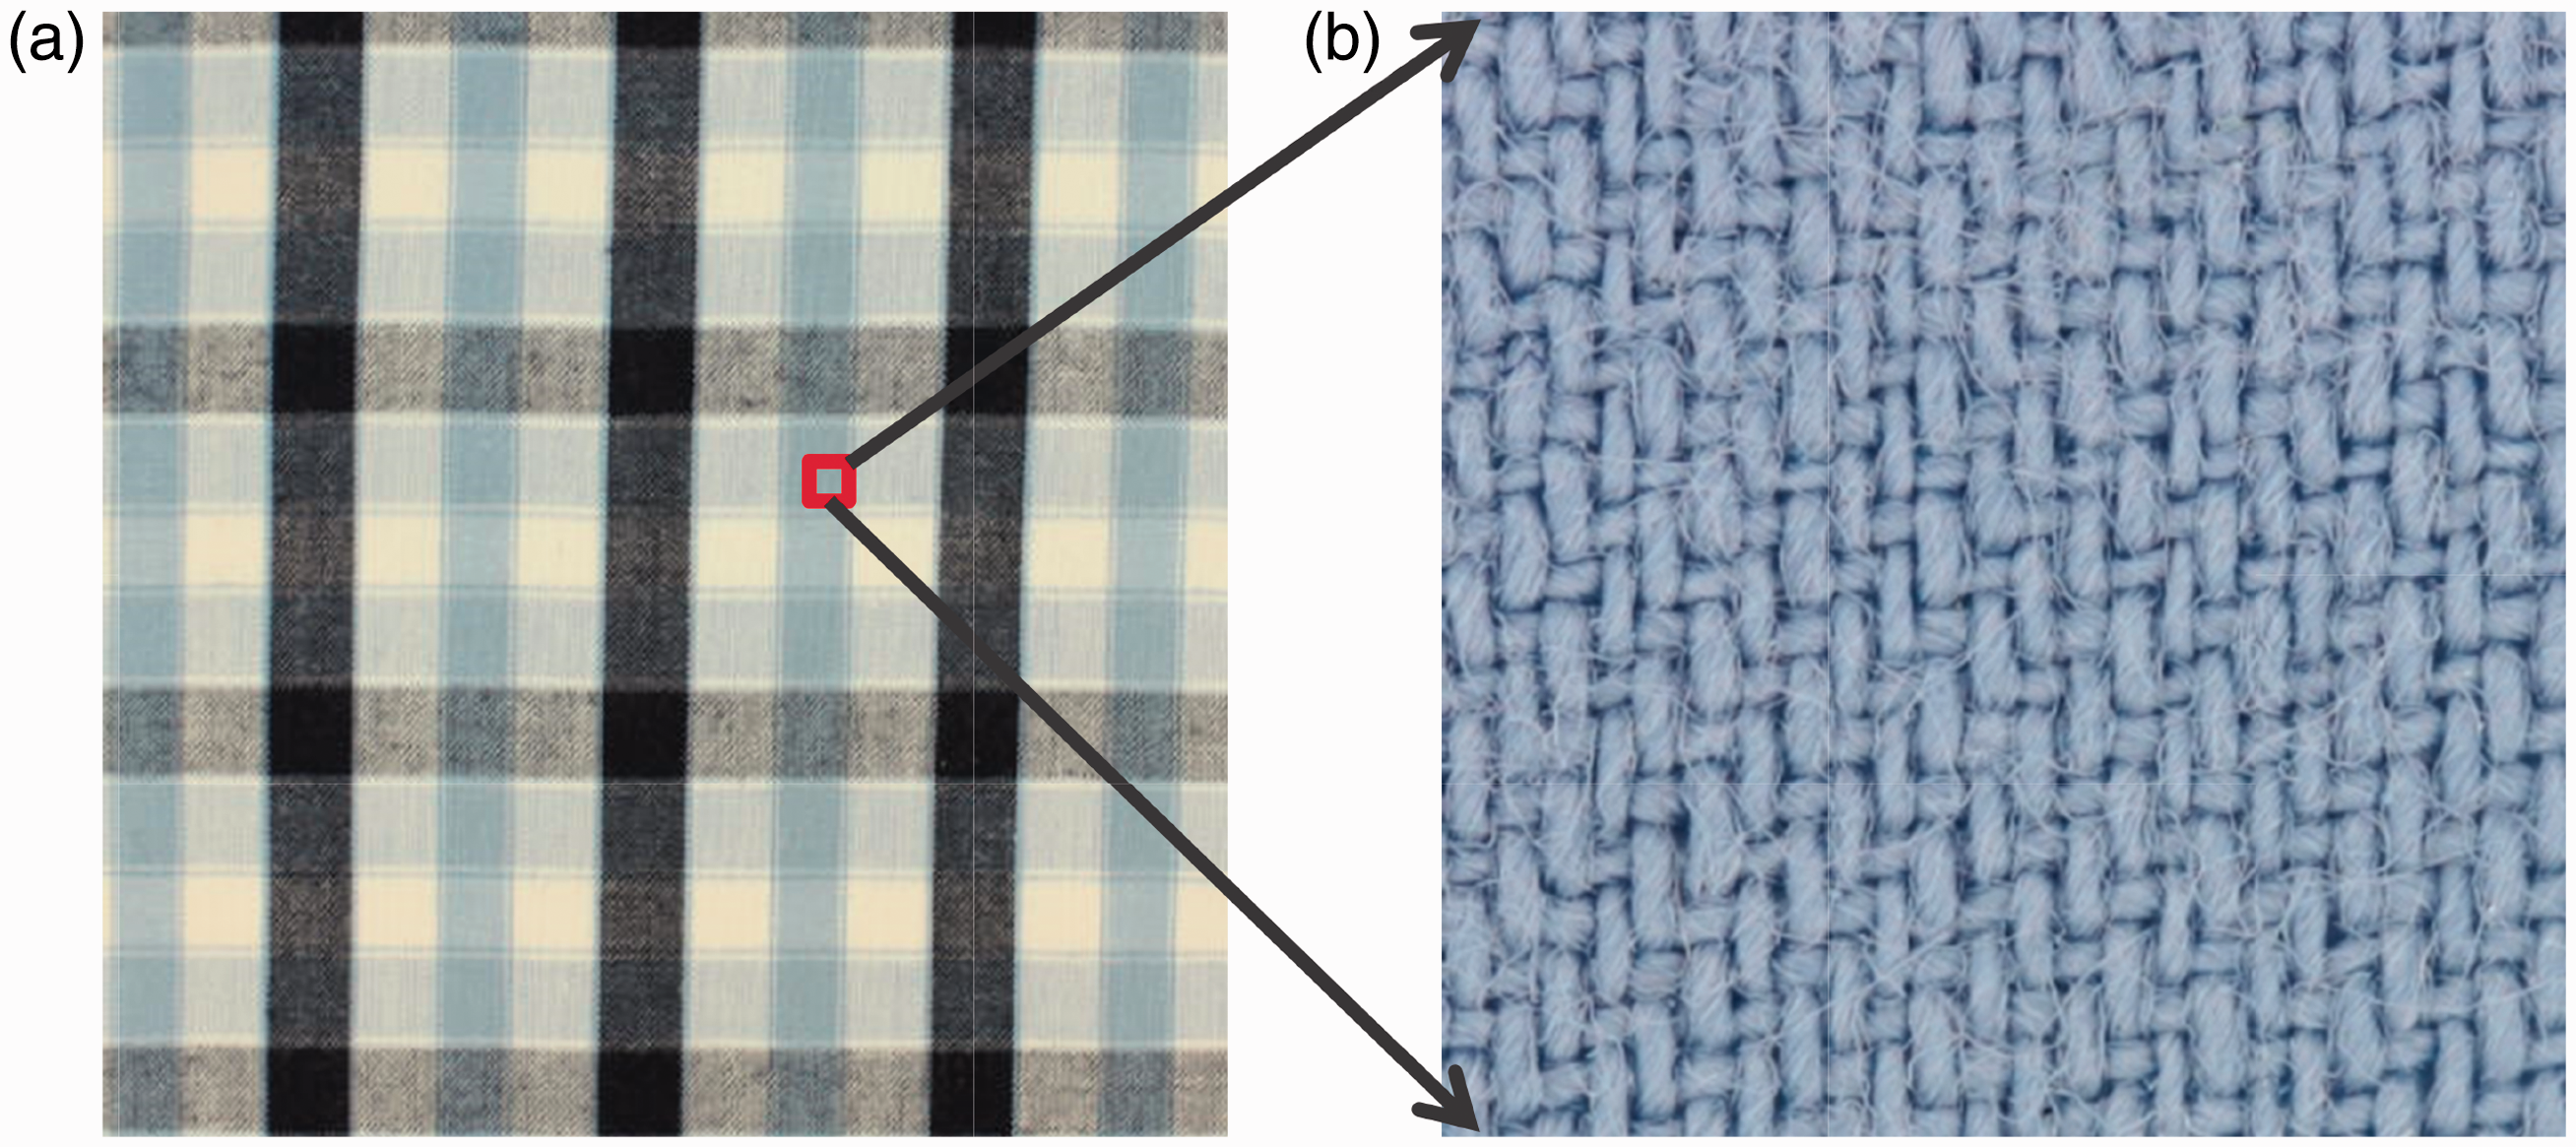
There is little research about how to detect fabric density for macro-scale yarn-dyed fabric images. The existing studies focus on micro-scale fabric images, and the research methods can be divided into two categories: (1) the frequency domain method; and (2) the spatial domain method. In the first method, Fourier transform techniques11–15 have been widely used to extract the periodic yarn components from the fabric image. The peaks in the related power spectrum image were identified by peak detection techniques to calculate the fabric density. In actual application, this method applies only to white or homochromatic fabrics. 2
In order to analyze yarn-dyed fabrics with color effects, the spatial domain method was developed. Based on the assumption that a yarn-dyed fabric is composed of vertical yarns (warp yarns) and horizontal yarns (weft yarns), the projection method was proposed to detect the yarn locations.7,9,16,17 This method has proven to be a simple yet very efficient means of detecting yarns in the micro-scale fabric images, and it has still been widely used in recent studies.2,5,8,10,18–24 However, it is impossible to address the problem of nonlinear deformation of yarns by the projection method and the peak or valley detection process in the projection curves is problematic for different fabric colors and textures.25–28 For these reasons, this method is not suitable for detecting macro-scale fabric images in practice.
Research framework
The framework of the proposed detection method is as shown in Figure 2. The technological design process for fabric density detection consists of four main steps. Firstly, a fabric image at the macroscopic scale is split into two components, the structure and texture components. Secondly, a near-regular texture modeling approach is applied to the texture component to extract the texture units. During the image registration process, the micro-scale image is captured using information of the macro-scale image in the texture domain. Thirdly, the micro-scale fabric image is converted to a lightness gradient image and the projection curves are used to detect the yarn locations. Finally, according to the detected yarns in the micro-scale image and the detected texture units in the macro-scale image, the fabric density of the macro-scale image is calculated.
Research framework of the fabric density detection method.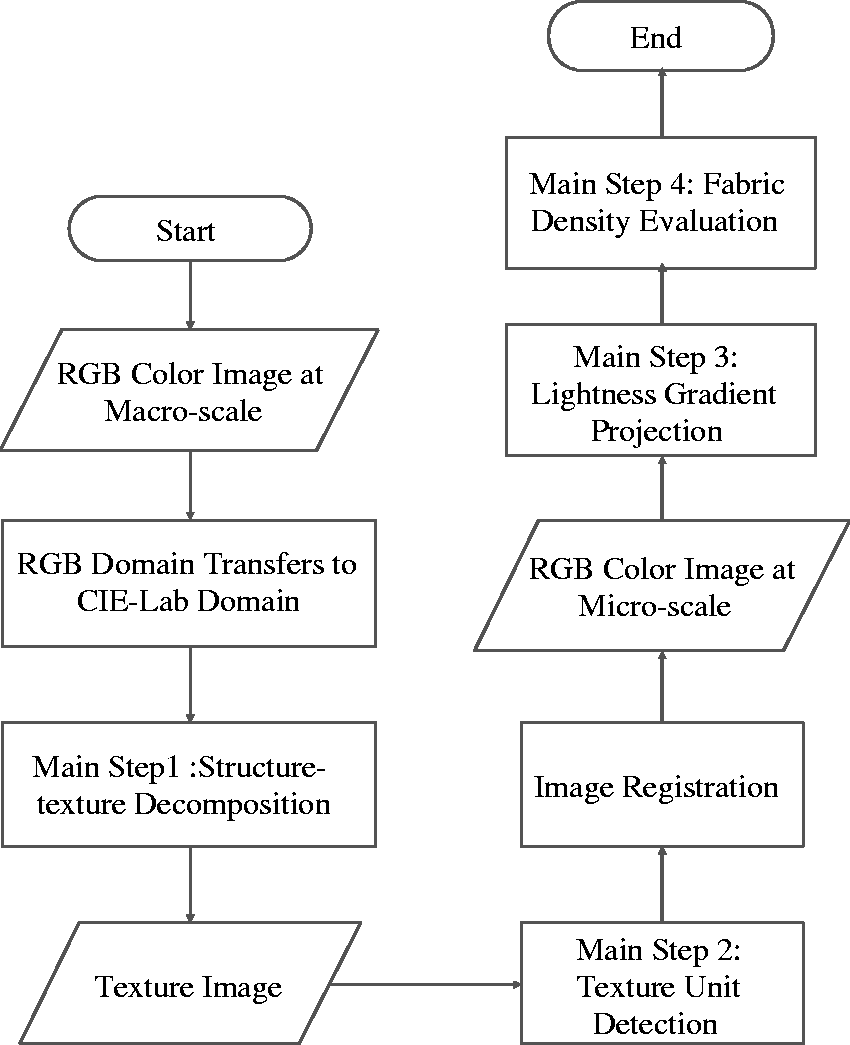
Image acquisition method
The micro- and macro-scale images of the fabric sample should be captured in this study. In order to capture these two scales of images, two sets of imaging acquisition stations with the same hardware were used. As shown in Figure 3, each imaging station consists of three components: a CCD (charge-coupled device) camera, a D65 (CIE Standard Illuminant) ring lamp and a sample platform. The camera model is Canon EOS 450D. The reason for choosing this camera is that it is inexpensive and readily available on the market, and this model can acquire good-quality photos for fabric image analysis.
29
The image acquisition system.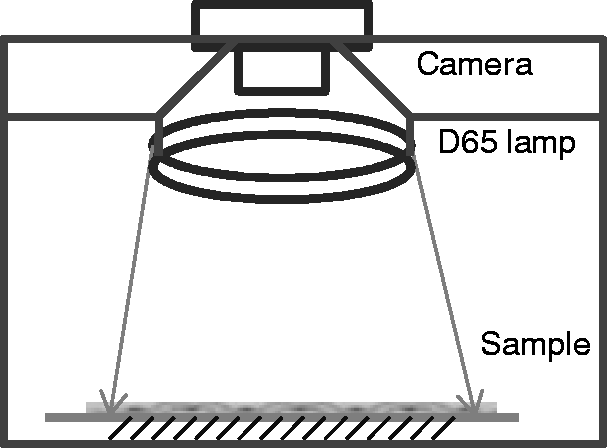
In order to perform multi-scale image acquisition, the lens model Canon EF-S 18-200 mm was applied to the camera. For each imaging station, the parameters of the optical sensor were fixed. The micro-scale imaging parameters were set as follows: the distance between the sample and the camera, 450 mm; F-stop f/5; exposure time 1/80 s; focal length 100 mm; and ISO speed 400. The macro-scale imaging parameters were as follows: the distance between the sample and the camera, 450 mm; F-stop f/5; exposure time 1/125 s; focal length 18 mm; and ISO speed 200. In macro-scale image acquisition a wide angle lens was used and the camera calibration method of Zhang 30 was used to calibrate radial distortion of the camera lens. As demonstrated later on in the experiments, this method was able to deal with radial distortion of the camera lens and the average error rate of density calculation was completely acceptable.
The micro-scale image resolution is 5535 pixels per inch. In other words, one inch length of the real fabric corresponds to 5535 pixels in the fabric image. The macro-scale image resolution is 3377 pixels per inch. We used a high-resolution camera to obtain the images of the fabric yarn details. The main reason to use the high-resolution images is that some fabrics may include fuzzy surfaces and fine yarns and the corresponding yarn segmentation results might need manual judgment, so it would be very helpful for manual judgment when magnifying the images of these samples. The number of pixels of the macro-scale image and the micro-scale image is 19,046 pixels × 16,431 pixels and 3613 pixels × 3512 pixels, respectively.
Image processing methods
Structure–texture decomposition
The fabric image contains meaningful structural and textural features on the surface of the material, and decomposing the image into meaningful components is an important and challenging inverse problem in fabric image processing. 31 Traditional filters, such as Median filter,16,32,33 steerable filter,2,34 and bilateral filter, 35 cannot provide any structure description of the fabric, nor can they give any description of yarn details. Rudin et al. 36 proposed a method for image decomposition, the constrained minimization of the total variation (TV). Following the studies of Rudin et al. 36 and Meyer, 37 decomposing models into a geometrical component and a textured component had been discussed.38–40
A fabric image can be regarded as being composed of a structural part, corresponding to the main large objects in the image, such as color layouts and lighting variations,
41
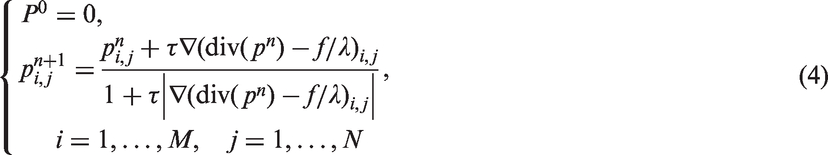
and a textural part, containing fine yarn-scale details, with some periodicity and oscillatory character. An original fabric image can be split into two components, u and v, with u containing the structural information and v the textural information. The decomposition approach can be described as a minimization problem as follows


Texture unit detection
The deformation of yarns is unavoidable in yarn-dyed fabrics due to the accumulation of viscoelastic deformation of fibers. Theoretically, if there is no damage on the fabric structure and there are no wrinkles or occlusion on the fabric surface, the extent of the deformation of the yarns should be detected. The repeat patterns in the macro-scale fabric image can be considered deformed texture units. In the present study a near-regular texture modeling approach was proposed to detect the texture units in the fabric image. In order to improve the image quality for computer analysis, two preprocessing steps were carried out. Firstly, the RGB image was converted into a CIE-Lab image, and the conversion process was done following Kuo and Kao.
47
Secondly, the texture component was extracted from the L* channel image by using the structure–texture decomposition method mentioned in the previous section. For near-regular texture modeling, a MRF (Markov Random Field) model was used for inferring the texture unit locations. The MRF model includes two constrained functions.31,48 The first is the joint compatibility function, given by

The second constrained function for the MRF is the pairwise compatibility function. The spatial constraints between the neighboring pairs of the texture elements are defined as follows


The region of dominance 48 was introduced to determine whether an estimated texture unit location can be trusted. The texture element unit was described by the quadrilateral in Equation (7). The current estimated location with a local maxima dominant peak was chosen as a peak location to determine the location of the trusted texture units. The trusted texture units were then considered as the best texture units in the fabric image. For each texture unit, a Spline Warping algorithm 50 was used to rectify the distortion of the texture unit into a regular texture unit. Once the distortion of a texture unit had been detected, the yarn distortion extent in the texture unit was estimated by the lateral sides of the quadrilateral.
Lightness gradient projection
Researchers have adopted the gray projection method to detect yarn locations.2,5,7 Based on the observation that lightness variations on yarn surfaces are the key clue to detect yarn locations, in the present study only the L* channel image was used and a lightness gradient projection method was proposed. Different color models of an image will have an influence on the computer analysis results. 51 The CIE-Lab color model approximates human vision and aspires to perceptual uniformity. 17 In addition, the L*, a*, b* metric facilitates representing texture variation in image segmentation models.51,52 As long as yarn edges and their shadows are visible in the fabric image, two kinds of neighboring yarns that have different colors but with same L values still can be processed by the proposed method.
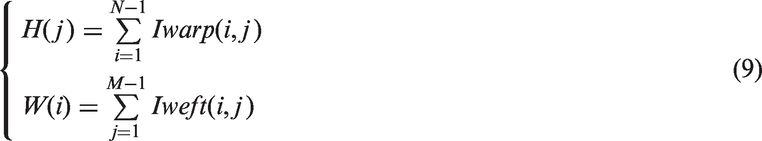
The proposed method begins with color space conversion from RGB to CIE-Lab, and the gradient values of the L* channel image are as follows

Experimental details and discussion
This study discussed the performance of the image processing steps and made comparison with other methods. We used MATLAB R2009a for integrated design of operational image display and C++ language for the core algorithm programming. The multi-scale imaging system (see the Image acquisition method section) was designed to capture the macro- and micro-scale fabric images.
Decomposition of fabric images
The structure–texture decomposition technique was used to decompose the image into the structure and texture components. The experimental results are as shown in Figure 4. Figure 4(a) is the macro-scale fabric image, and the real size of the sample is The structure–texture decomposition results for a fabric image: (a) the original fabric image; (b) the texture component; (c) the structure component.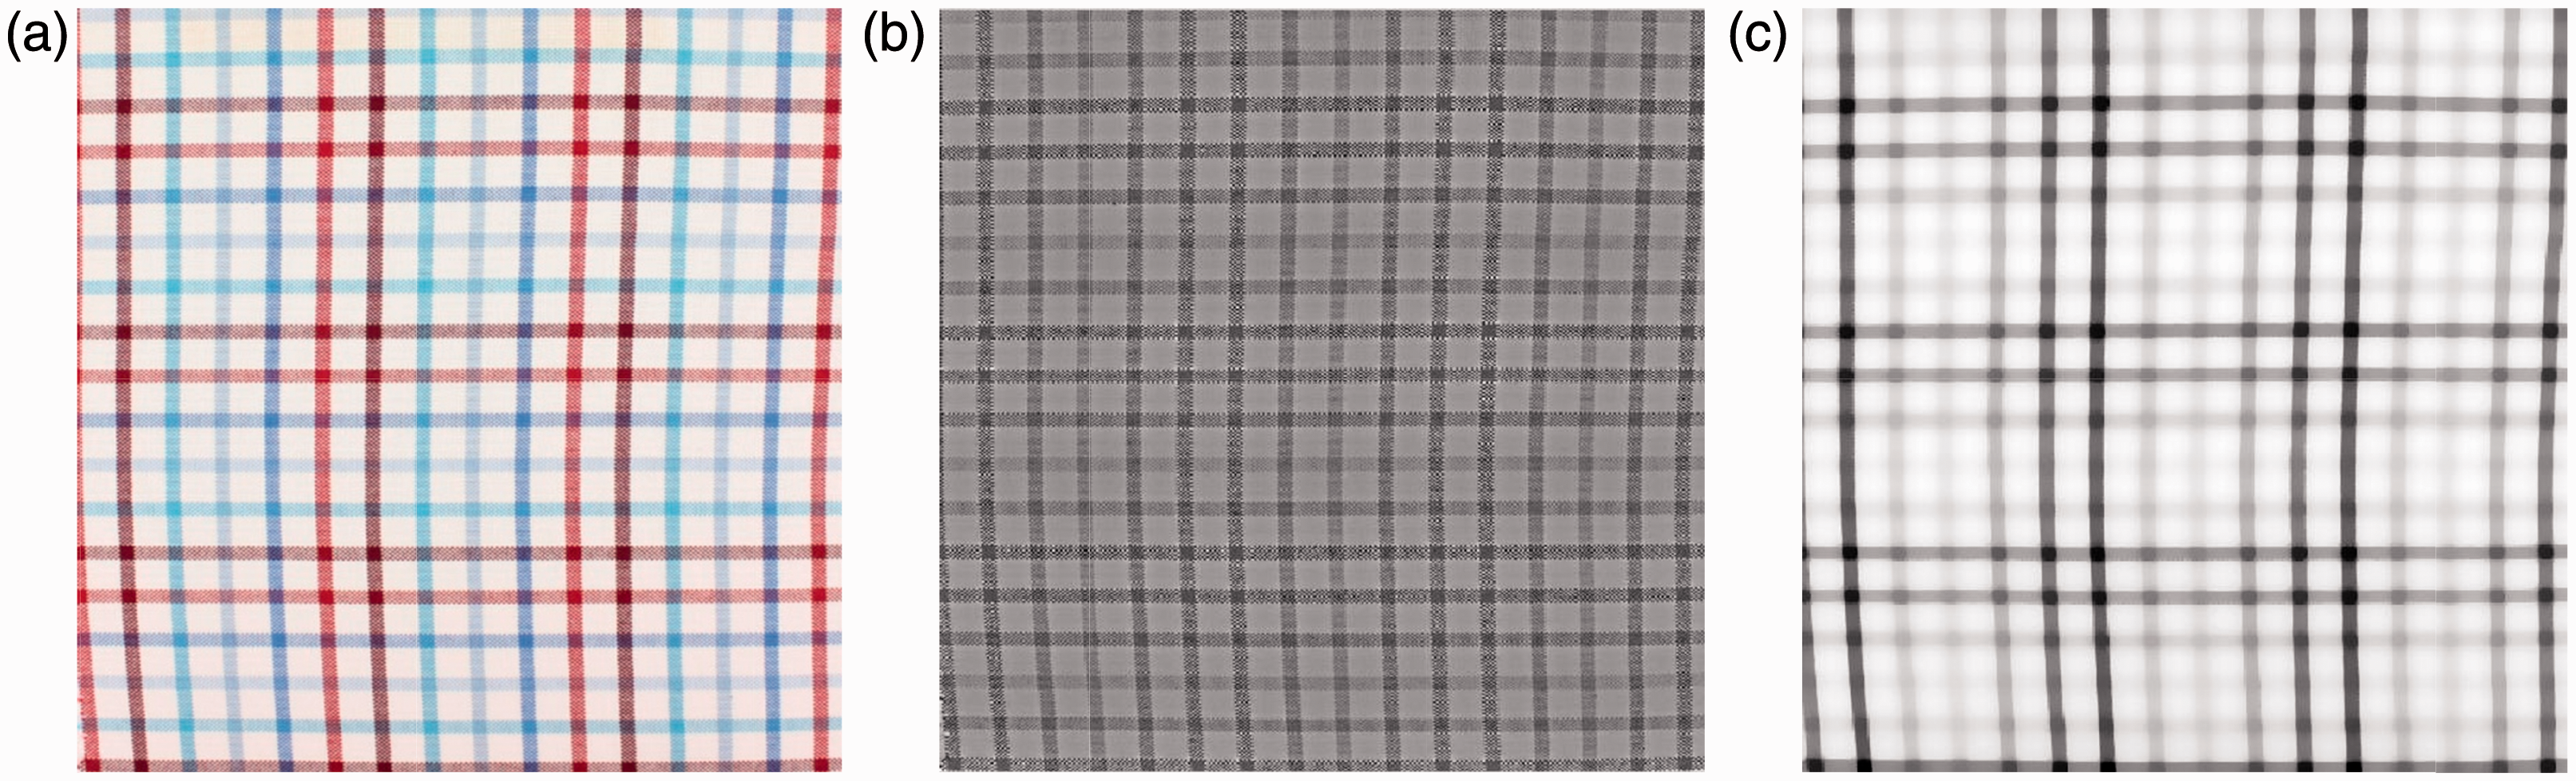
Detection of the texture unit
The intermediate results of the texture unit detection process are as shown in Figure 5. Our detection process was implemented as three main steps. Firstly, corner detection was conducted to extract enough feature points to expose the repeated structure of the texture patterns. Figure 5(a) shows the corner detection result by using the Kanade–Lucas–Tomasi (KLT) feature tracker.
54
Since KLT points tend to be clustered in high-contrast regions of the whole image, the simple alternative of applying KLT in a blockwise fashion causes it to adapt locally, thus revealing almost all repeating points. In fact, any interest corner detector can be used in this step. The key trade-off is to extract enough feature points to expose some repeated structure of the deformed patterns reliably.
48
Secondly, clustering techniques were adopted to identify points of interest. Since the repeat pattern is shown in the texture domain in our experiments, the interest points must be clustered in a local fashion.
Illustration of the texture unit detection process: (a) the corner extraction result; (b) the clustering result of the corner points; (c) the feature points computed through the grid structure mapping; (d) the best grid proposal for texture unit inference. Note that the small dark-blue points are the corner extraction result, the light-blue points are the clustering result, the red-yellow points are the feature points for the grid structure, and the bold yellow lines illustrate the best proposal of the grid unit. (Color online only.)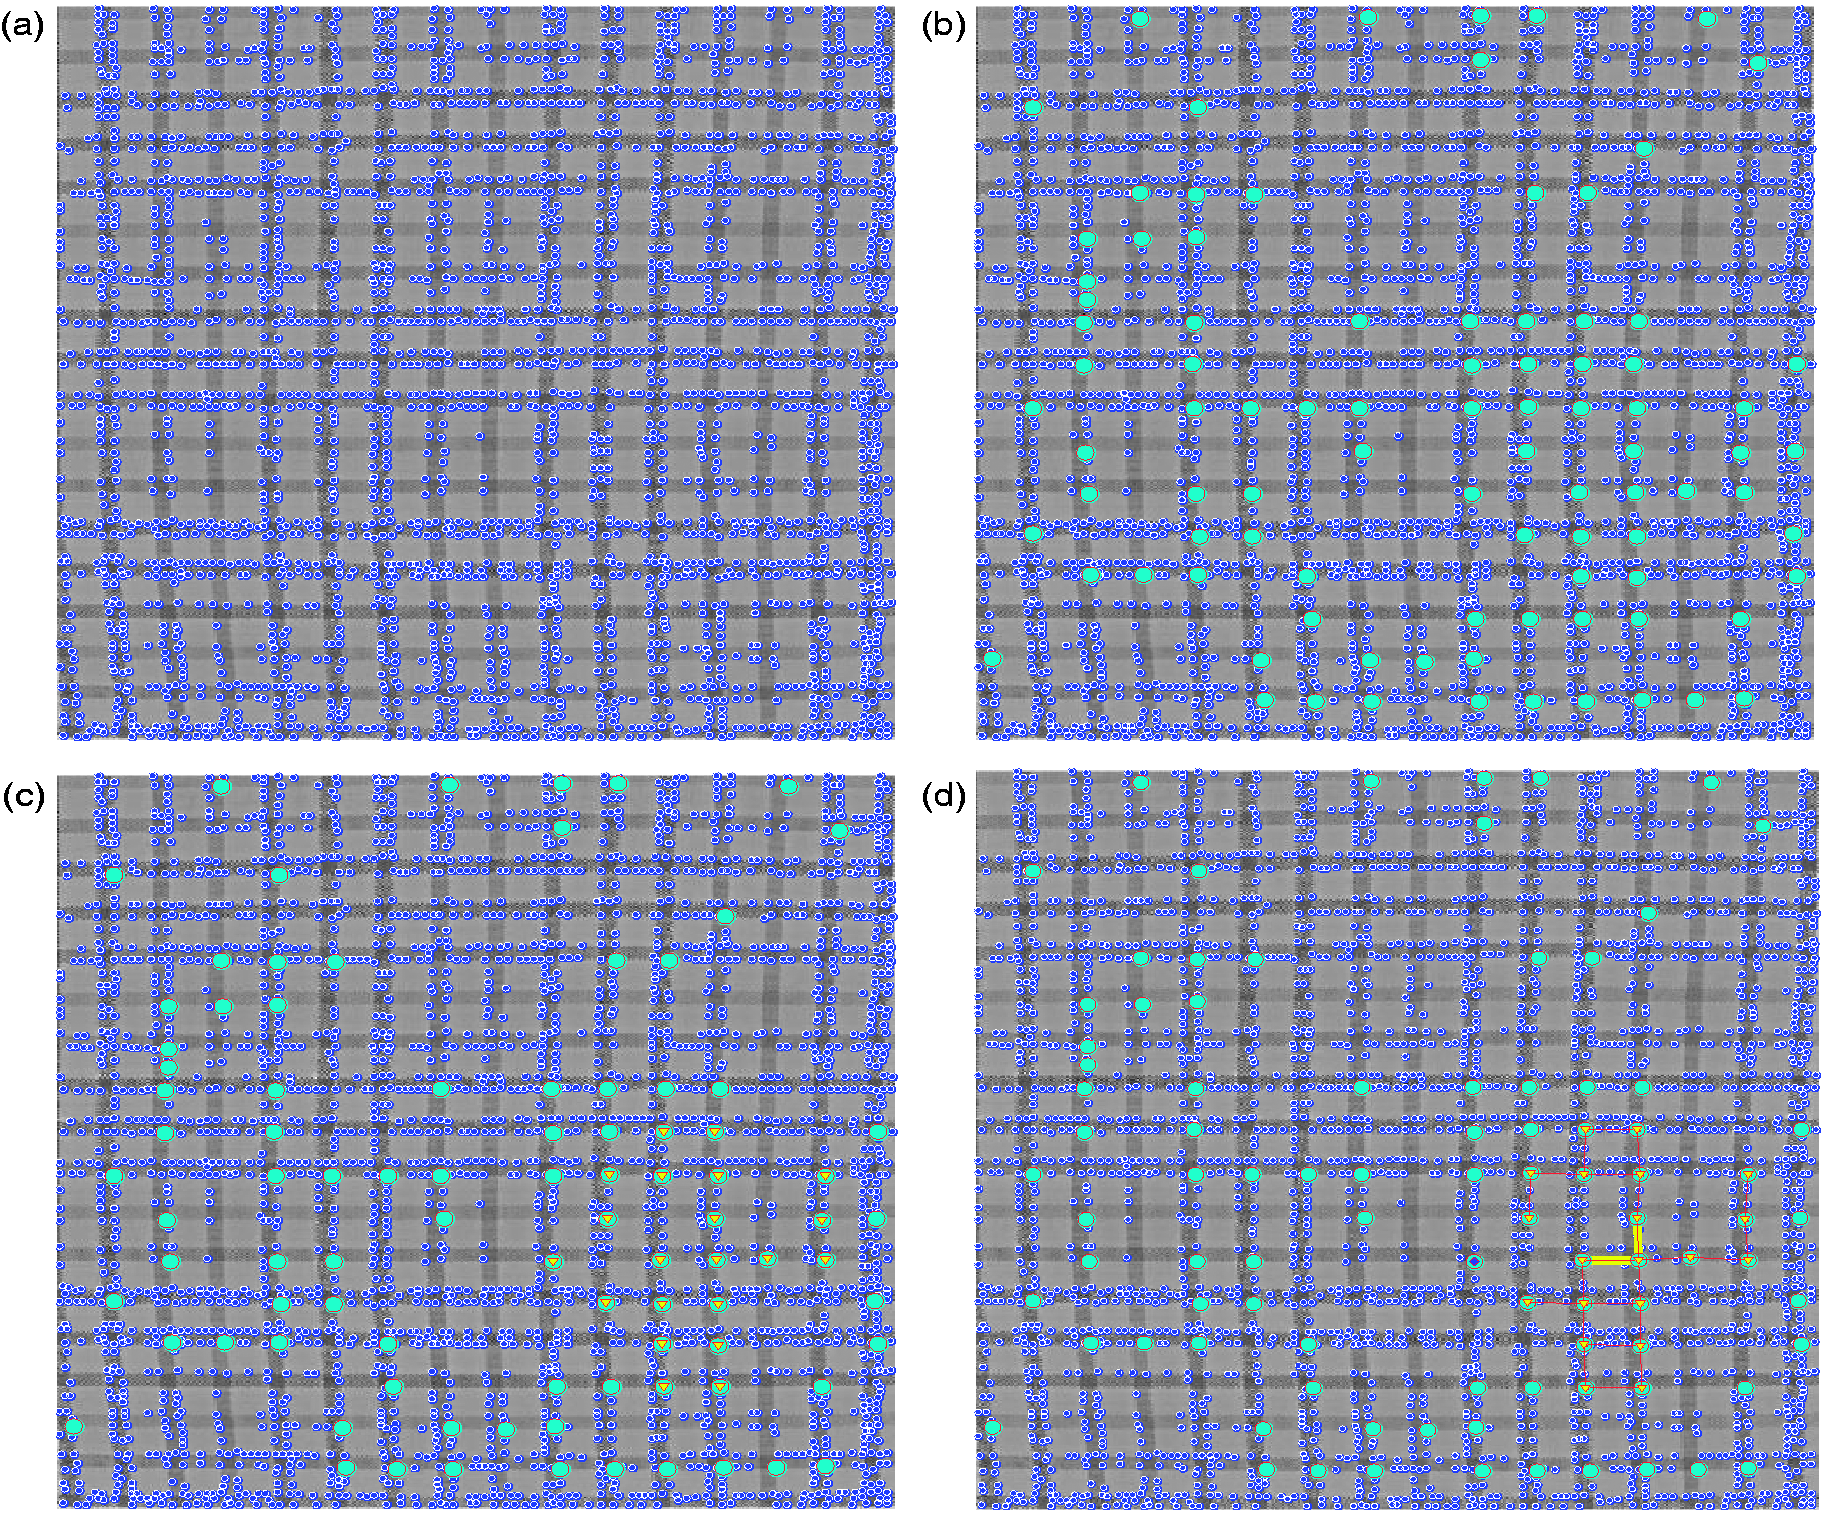
For each feature point, a centered
Next, three feature points in the clustering result were randomly selected and used to map a grid structure [(0,0), (0,1), (1,0)] by affine transform. 56 All remaining points were then computed via the same affine transform. If the three chosen points define a vector pair corresponding to the grid structure, many remaining points should form similar spatial structures. Intuitively, the best proposal for the repetition structure comes from the largest number of votes on the grid structure. Multiple random selections of the red-yellow points were used to decide a proper repetition basis (the bold yellow lines in Figure 5(d)).
The best repetition basis is useful for inferring the locations of other texture units. Since we assume that the basic structure of the fabric texture is a grid structure, the detection of the best repetition basis also can be considered as finding a grid structure that is most similar to the standard grid structure [(0,0), (0,1), (1,0)]. The corresponding feature points in a grid structure are as shown in Figure 5(c) and the grid unit is considered to be the texture unit (see Figure 5(d)) for further processing.
Based on the location of a texture unit detected in Figure 5(d), a MRF model was used for inferring locations of other texture units in the texture domain, and the experimental results are as shown in Figure 6. The experiments showed that in the texture domain the texture unit detection result was excellent (see Figure 6(a)) when compared to those in the structure and gray domains (see Figures 6(b) and (c)). The proposed texture unit detection approach detected the texture unit locations correctly. Note that the red circles in Figure 6(b) were added to illustrate the texture units that could not be detected.
Detection results of the texture units in different spatial domains: (a) the result in the texture domain (see Figure 4(b)); (b) the result in the gray domain; (c) the result in the structure domain (see Figure 4(c)). (Color online only.)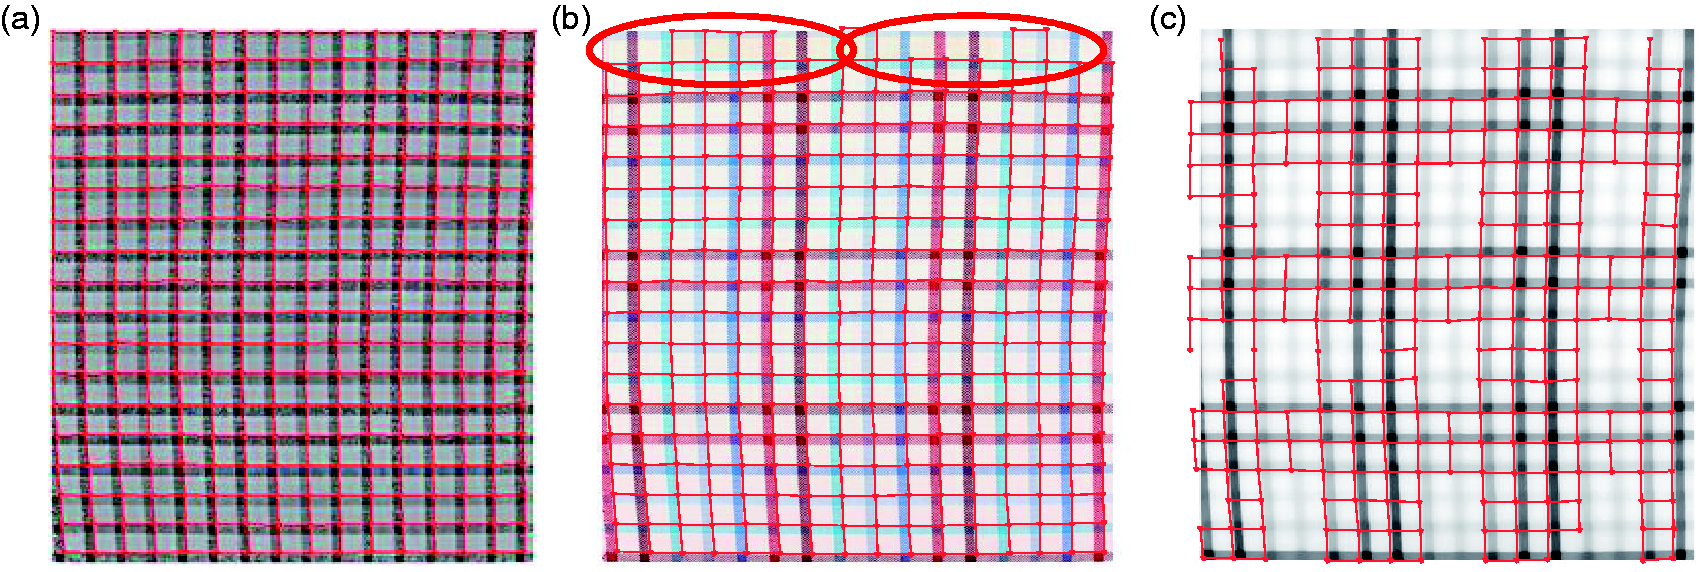
Detection of yarns
The micro-scale fabric image was used to detect the number of yarns in a texture unit. The user had to choose a texture unit from Figure 7(a) as a target region. Figure 8(a) shows the micro-scale fabric image, where the real size of the sample is Rotation of the texture unit for the projection algorithm: (a) the texture unit chosen by the user from the macro-scale fabric image; (b) the micro-scale fabric image before rotation; (c) the image after rotation. After rotation the weft yarns were aligned horizontally and they could be processed by the projection algorithm. Feature extraction results for the projection method: (a) the fabric image after rotation for warp yarn detection; (b) the lightness gradient image of (a); (c) the fabric image after rotation for weft yarn detection; (d) the lightness gradient image of (c).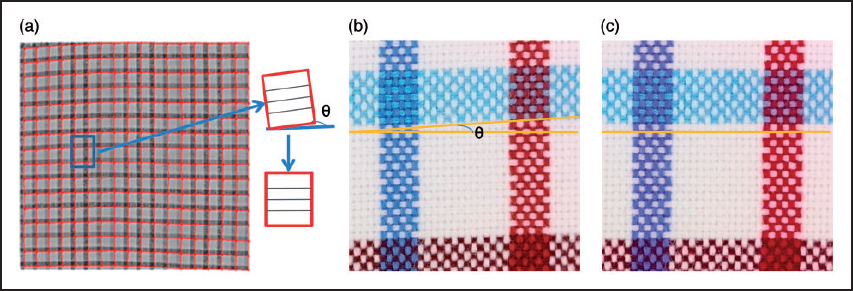
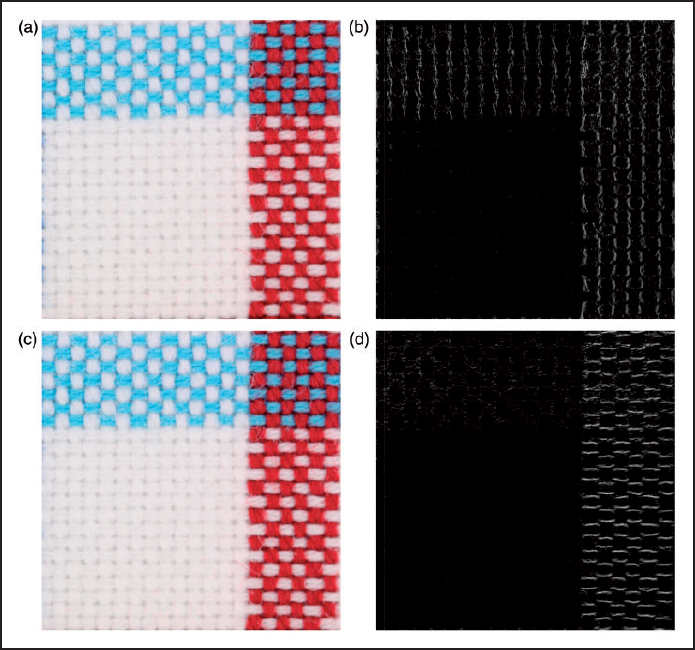
Based on the texture unit detection result, the skewness of the yarns was rectified. As shown in Figure 7, the texture unit was rotated (clockwise rotation of 1.4 degrees) so that the weft yarns were aligned horizontally for the projection algorithm. The warp yarns could be aligned vertically by using the same method. In Figure 8, the lightness gradient images were shown. Figures 8(c) and (d) suggest that the warp and weft gradient images contain the yarn boundary information, which is the key feature for yarn location detection. 5
A global maxima detection method had been used for detecting the peaks in the projection curves. A point is considered a maximum peak when it has the maximal value preceded (to the left) by a value lower by the threshold value.5,57 As shown in Figure 9, the stars on the projection curves are the peak values detected by the peak detection method, as given by Sezan.
57
The threshold values are empirical values between [0.05 and 0.45]. The threshold values for Figures 9(a) and (b) were set as 0.05 and 0.15, respectively. Figure 10 shows the fabric image with the detected yarn locations, which agree with human observation.
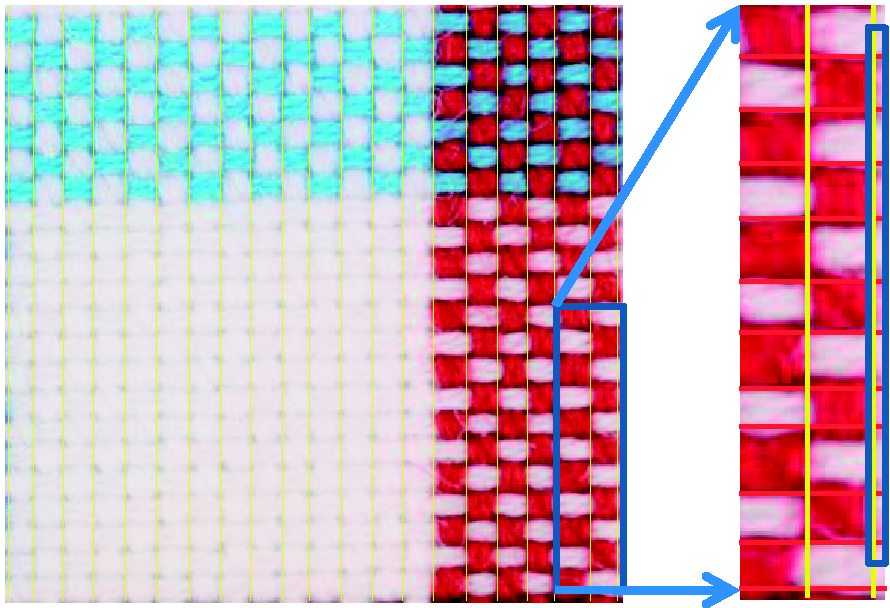
The projection curves for yarn location detection and the detected yarn locations: (a) the warp gradient projection curve; (b) the weft gradient projection curve. The warp yarn detection result for the micro-scale fabric image: (a) the grid shows the detected warp yarn locations; (b) the rectangle shows the boundary area of the warp yarn.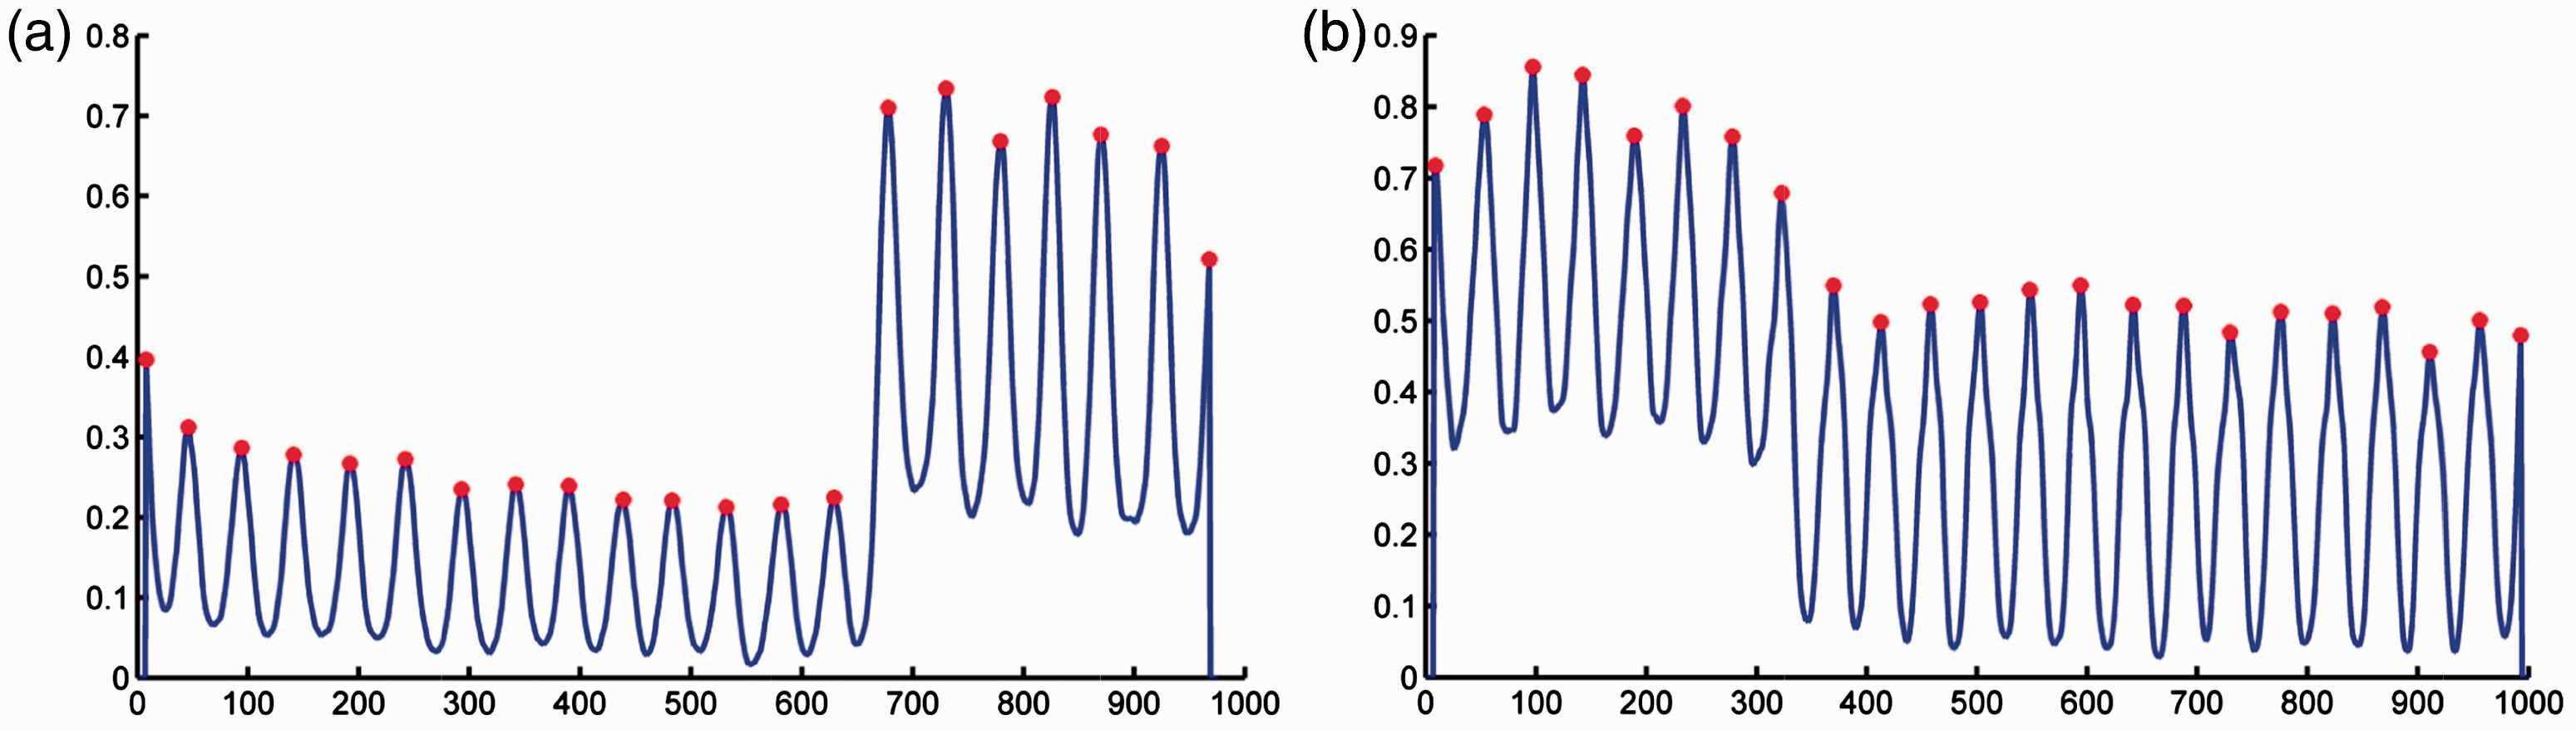
Average density calculation

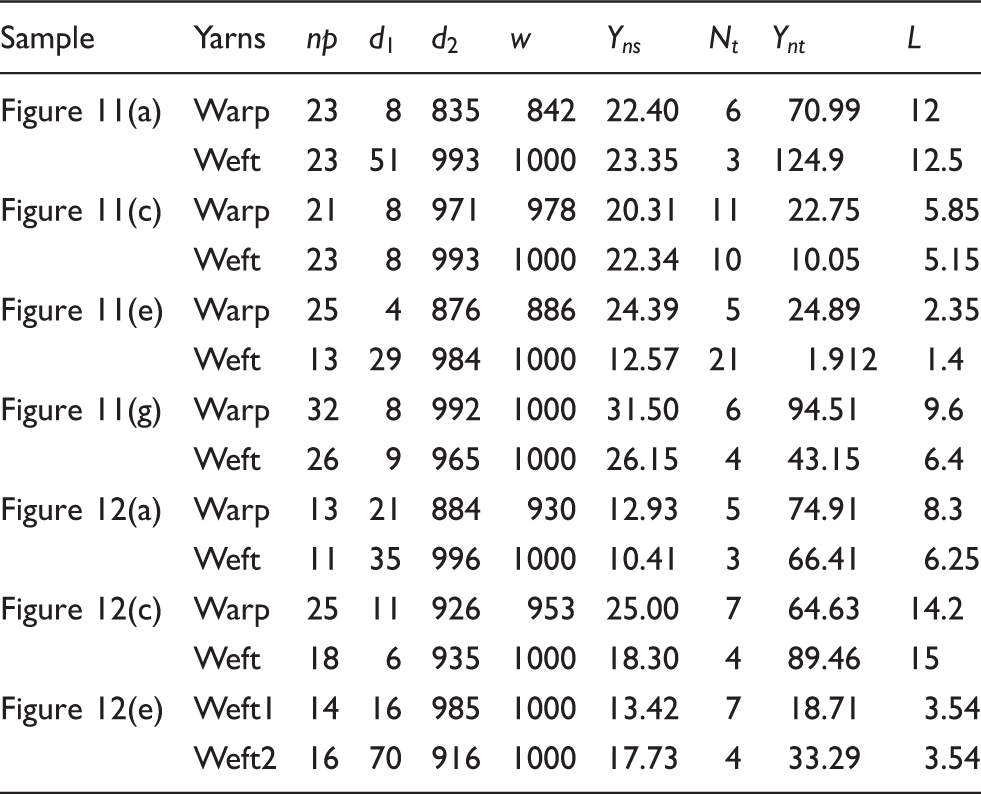
The parameter values for average density calculation
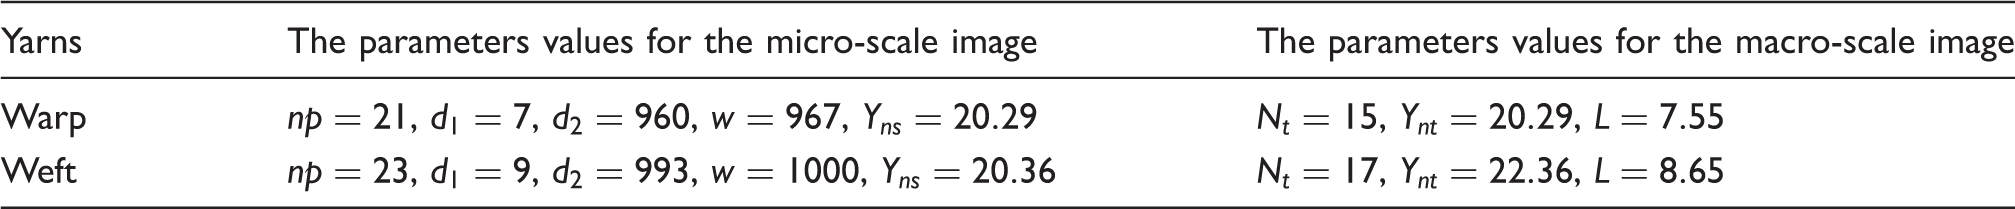
Multiple texture units in the macro-scale fabric image were used for average density calculation

Comparison with other methods
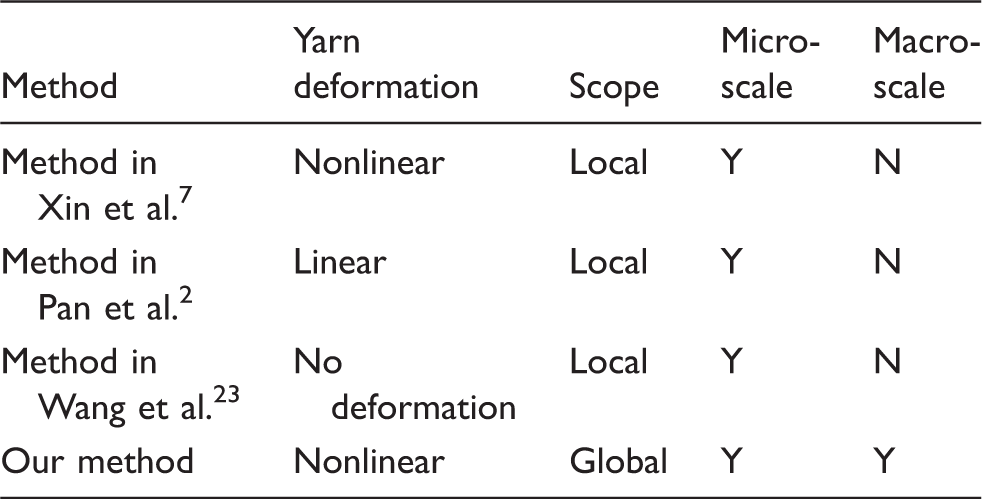
Three other methods given by Xin et al., 7 Pan et al., 2 and Wang et al. 23 were considered. In Xin et al., 7 an Active Grid Model (AGM) was developed for yarn segmentation. Essentially, this method was a local detection method and the computation cost was high. Since it used the projection method as the only resort for grid pattern initialization, the algorithm is sensitive to the locations of the initial grids and the hairiness of the yarns. In Pan et al., 2 Hough transform was used to detect the skew angles of yarns and the gray projection method was applied to the fabric image after the skewness correction. However, the nonlinear deformation of the yarns was not considered.
Different fabric density detection methods
Experimental results
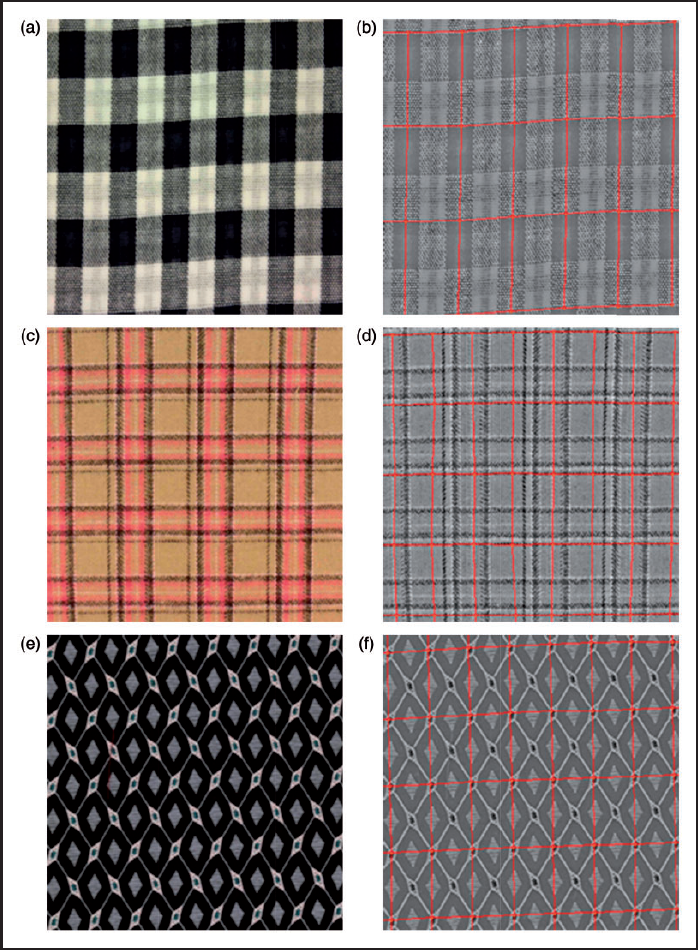
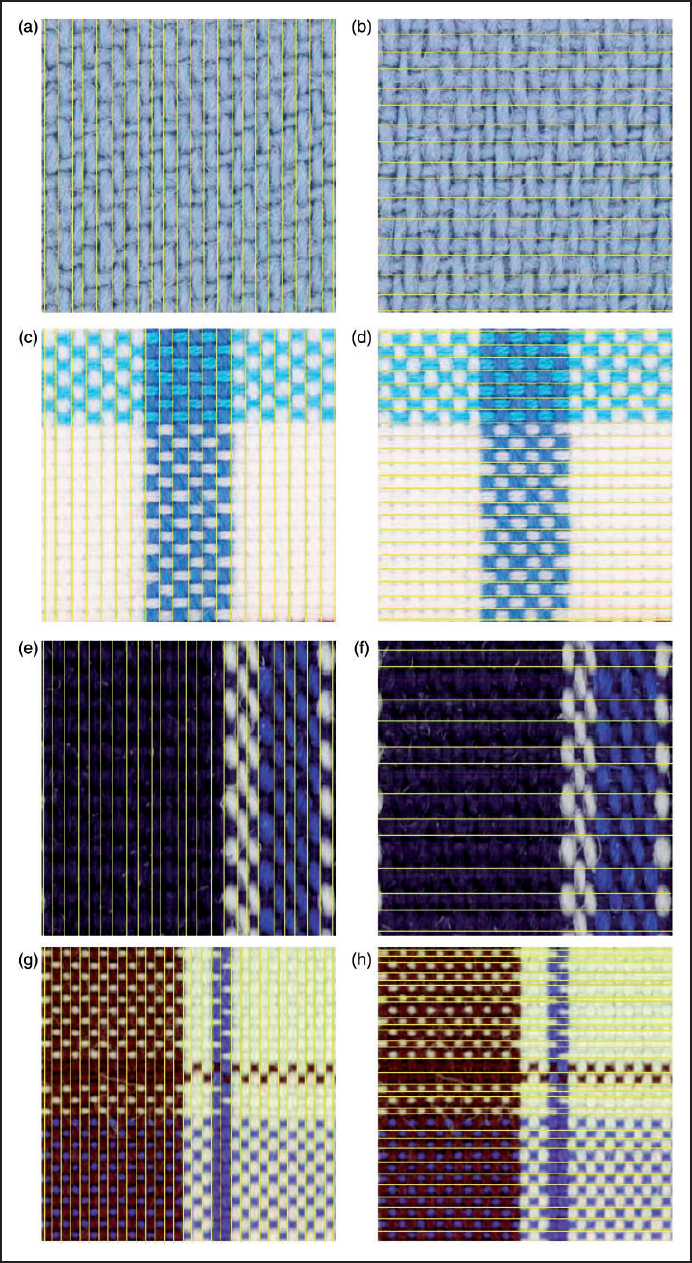
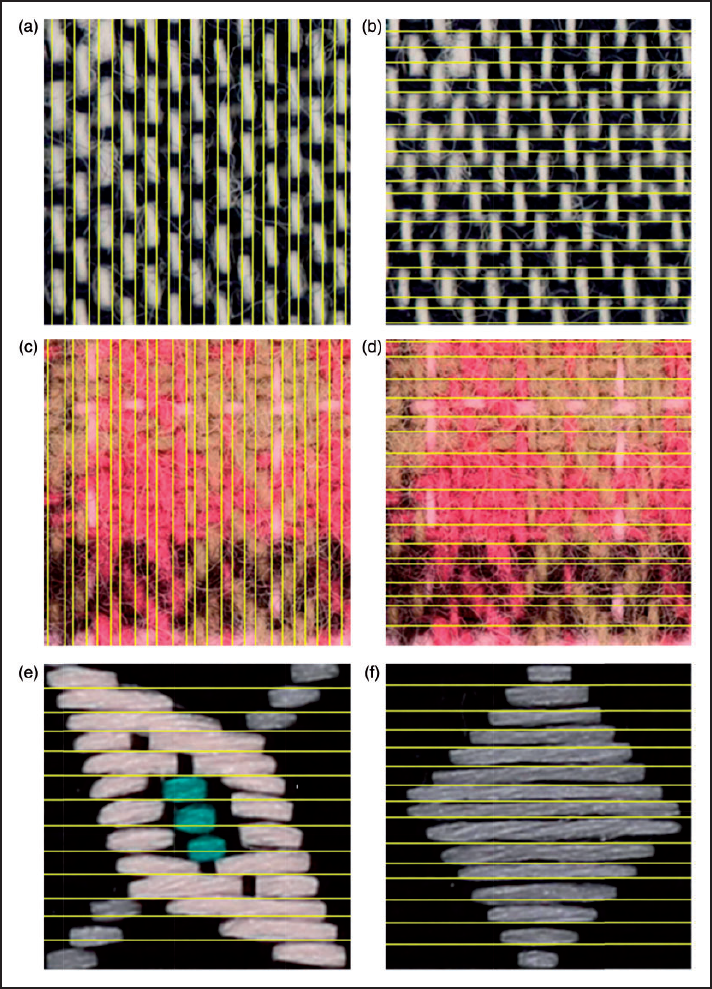
We used different materials, including cotton (samples shown in Figures 11, 12(a), and 12(c)) and silk (Figure 12(e)) fabrics. The fabrics have different structures, color layout effects, and textures. In particular, the fabric sample shown in Figure 12(c) is a brushed cotton fabric (wool-like cotton fabric) with very long hairiness on the fabric surface, and the fabric samples in Figures 12(a) and (e) are multi-layer fabrics with and without yarn interstices, respectively. As shown in the second column of Figures 11 and 12, our method detected the texture units correctly for all samples although the fabric weft yarns had not been aligned properly along the horizontal axis (see Figure 11(c)). In all experiments, the texture unit detection process was fully automated for the macro-scale images. As shown in Figures 13 and 14, the number of yarns detected in the samples shown in Figures 13(a), 13(c), 13(e), and 14(e) equal Detection results for cotton fabrics with different color layout effects. The first column shows the original fabric images at the macro-scale level. The second column shows the texture unit detection results in the texture domain of the fabric images in the first column. Detection results for cotton and silk fabrics. From top to bottom, the materials are cotton, cotton, and silk, respectively. The first column shows the original fabric images at the macro-scale level. The second column shows the texture unit detection results in the texture domain of the fabric images in the first column. Segmentation results of color yarns in the micro-scale images of cotton fabrics. From top to bottom, the micro-scale images correspond to the macro-scale images in Figures 11(a), (c), (e), and (g), respectively. The vertical and horizontal yellow lines represent the detected warp and weft yarn boundaries, respectively. Note that the images may not coincide with the texture unit in Figure 11. (Color online only.) Segmentation results of color yarns in the micro-scale images of cotton and silk fabrics. From top to bottom, the materials are cotton, cotton, and silk, respectively, and the micro-scale images correspond to the macro-scale images in Figures 12(a), (c), and (e), respectively. The vertical and horizontal yellow lines represent the detected warp and weft yarn boundaries, respectively. Note that the images may not coincide with the texture unit in Figure 12. (Color online only.)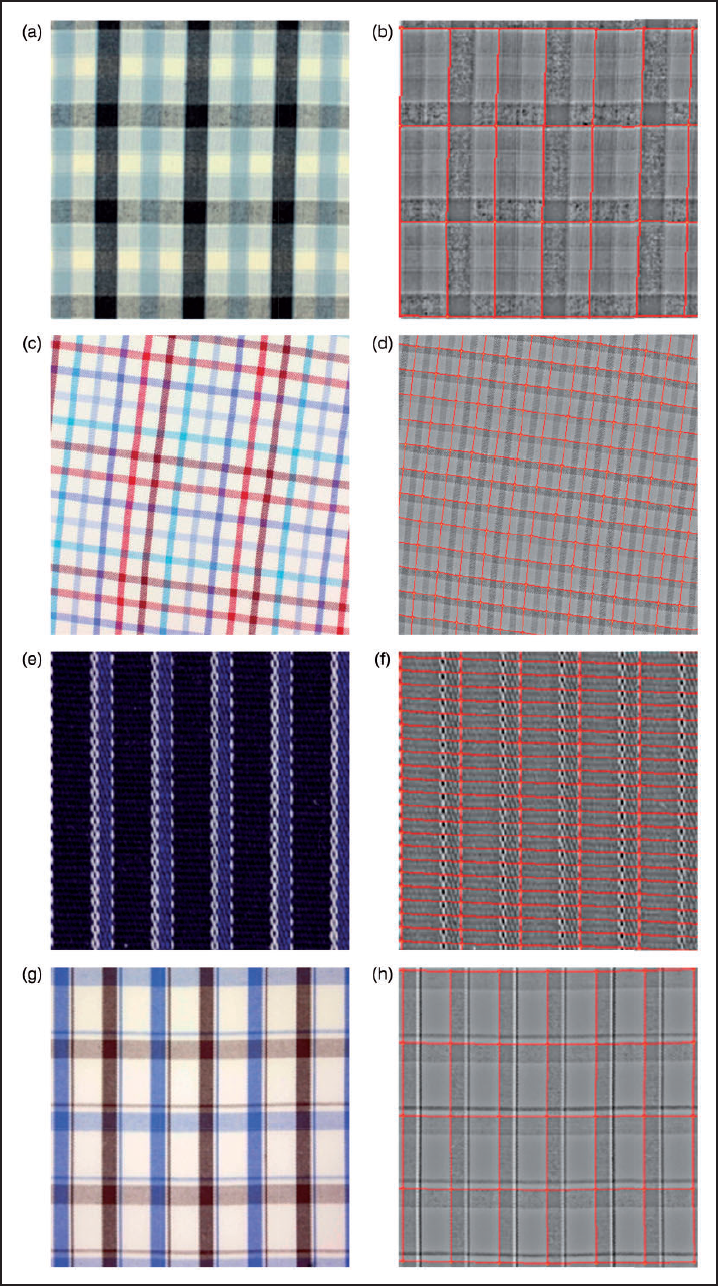
On the other hand, the experiments show that the number of detected yarns may not equal
Nevertheless, in our experiments, the manual judgment method on the micro-scale fabric images is rapid and convenient. This is because the image quality generated from our image acquisition system is much higher than those in previous studies, which typically used a flat scanner. Therefore, we adopted the manual judgment method to deal with this kind of sample so that the interstices should not be identified as the yarns. In Figure 15, the number of yarns equals The number of detected yarns by manual judgment. From left to right, the images correspond to the samples in Figures 13(h), 14(a), and 14(b), respectively. The parameter values for the fabric images in Figures 11 and 12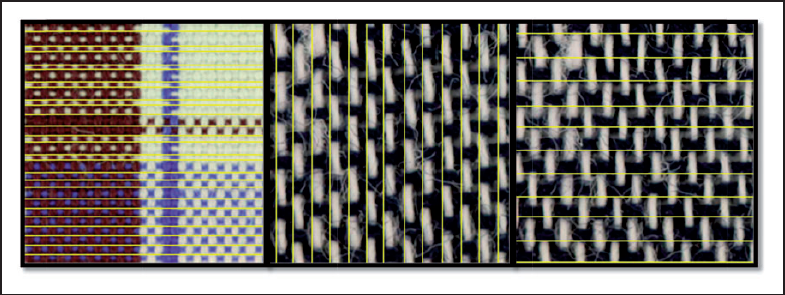
Fifty fabric samples, including 100 fabric images (50 macro-scale images and 50 micro-scale images) were tested to demonstrate the stability of the proposed method. There were 90 cotton samples and 10 silk samples. The fabric textures included 60 plain weaves, 20 twill weaves, and 20 satin weaves. All kinds of yarn counts were included in the testing samples. The loom warp and weft densities ranged from 80 to 144 ends/inch and 80 to 110 picks/inch, respectively. The average relative error between the measured density and the calculated density of warp and weft is 0.53% and 0.64%, respectively. The maximum relative error between the measured density and the calculated density of the warp and weft is 1.79% and 1.90%, respectively, which are completely acceptable in textile production scenarios. The relative error for each test sample was calculated as follows

The efficiency of our method was also evaluated. Our method consists of three main steps: (1) structure–texture decomposition; (2) texture unit detection; and (3) yarn location detection. The first two steps are fully automated for all experiments and the computation time for each sample was around 100 seconds (the fabric image had been resized 29 to 512 pixels × 512 pixels). In the third step, the computation time, including the manual correction time, was less than 10 seconds (the height of the image had been resized to 1000 pixels). Thus, the total computation time of our method was less than 2 minutes. In contrast, in order to count the warp and weft yarns in the length of 5–10 cm, the manual detection time was more than 4 minutes. The core algorithm of the research method was implemented in C++ code without optimization processing, and the central processing unit (CPU) of the machine was an Intel Core2 Duo T9400, 2.53 GHz.
Conclusions
In this paper a new method for yarn-dyed fabric density detection was proposed. The proposed method offered an efficient analysis method for detecting the fabric density of a macro-scale fabric image that contains hundreds of yarns. The experimentation on different color effects and materials of yarn-dyed fabrics demonstrated the superior performance of our proposed method over the previous algorithms, as well as the manual method. The practical significance of our method is to satisfy the demand for testing efficiency as well as reduce labor intensity in actual sample analysis in textile mills. Our main contributions include the following:
proposing an efficient structure–texture decomposition approach for further analysis of fabric structure parameters; discovering nonlinear deformation of fabric yarns at the macro-scale level to evaluate the skewness of the fabric yarns; identifying the periodical patterns for fabric structure detection in an efficient way; and providing a lightness gradient projection method for yarn segmentation in the micro-scale fabric image.
There is a rich set of current and future applications for such a multi-scale analysis method in fabric structure detection.20,21,58–60 Our future research will further investigate the problem of fully automatic yarn segmentation at the micro-scale level and its use for macro-scale color effects analysis and weave pattern reconstruction.
Footnotes
Declaration of Conflicting Interests
The authors declared no potential conflicts of interest with respect to the research, authorship, and/or publication of this article.
Funding
The authors disclosed receipt of the following financial support for the research, authorship, and/or publication of this article: This work was supported by the National Natural Science Foundation of China (61502425), the Shaoxing 330 Talent Plan Foundation (ACX201423), the Natural Science Foundation of Zhejiang University of Technology (2014XY019), and the Research Foundation of Zhijiang College of Zhejiang University of Technology (107010120).