
Abstract
The damage evolution of C/SiC ceramic-matrix composites with different fiber preforms, that is, unidirectional, cross-ply and 2.5D woven, under cyclic fatigue loading at room and elevated temperatures in air and inert atmosphere has been investigated. The experimental fatigue hysteresis modulus and hysteresis loop area versus cycle numbers have been analyzed. The relationships between the fatigue hysteresis loop area, interface slip and interface shear stress have been established. The evolution of the fatigue hysteresis loop area and interface shear stress as a function of applied cycles has been analyzed for different peak stresses, fiber preforms and test conditions. For different fiber preforms and test conditions, the fatigue hysteresis loop area degrades the fastest for unidirectional C/SiC at 800℃ in air, and the slowest for 2.5D C/SiC at 600℃ in an inert atmosphere, due to the different degradation rates of interface shear stress.
Ceramic materials possess high strength and modulus at elevated temperatures. However, their use as structural components is severely limited because of their brittleness. Continuous fiber-reinforced ceramic-matrix composites (CMCs), by incorporating fibers in the ceramic matrix to improve the toughness, however, not only exploit their attractive high-temperature strength but also reduce the propensity for catastrophic failure. Carbon fiber-reinforced silicon carbide ceramic-matrix composites (C/SiC CMCs) are one of the most promising candidates for many high-temperature applications, particularly as aerospace and aircraft thermostructural components. 1
Upon unloading and subsequent reloading, the hysteresis loops develop due to frictional slip along any interface debonded region. 2 Li 3 investigated the cyclic fatigue behavior of unidirectional and cross-ply C/SiC composites at room temperature and 800℃ in air. The fatigue hysteresis loops were used to analyze the damage evolution inside the composite, that is, matrix cracking, interface debonding and fiber failure. Shuler et al. 4 investigated the effect of loading frequencies ranging from 1 to 85 Hz on the tension–tension fatigue behavior of two-dimensional (2D) C/SiC composite at room temperature. With increasing loading frequency, the extent of frictional heating increases. Under a long duration of cyclic fatigue loading, the surface temperature rises first, and gradually decreases; the fatigue hysteresis loop area decreases gradually, which supports the gradual wear of the fiber/matrix interface. Zhu et al. 5 investigated the tension–tension fatigue behavior of a 2D SiC/SiC composite at 1000℃ in argon. The fatigue hysteresis loops, moving to the right along the strain axis with increasing cycle numbers, prove that the fatigue and creep damage mechanisms are operating simultaneously, which decreases the fatigue life of the 2D SiC/SiC composite at an elevated temperature. Dalmaz et al. 6 investigated the cyclic fatigue behavior of a 2.5D C/SiC composite at 600℃, 1000℃ and 1500℃ in an inert atmosphere. For temperatures below 1000℃, the cyclic fatigue behavior is governed by interfacial friction and residual thermal stress; at temperatures above 1000℃, the creep in the fibers and matrix affects the fatigue behavior. Yang 7 investigated the cyclic fatigue behavior of a 2.5D C/SiC composite at room temperature and 800℃ in air. The fatigue life of C/SiC at 800℃ in air is greatly reduced compared with that at room temperature due to fiber oxidation. Fantozzi and Reynaud 8 investigated the fatigue hysteresis loops evolution of 2.5D SiC/[Si−B−C] and 2.5D C/[Si−B−C] composites at 1200℃ in air under tension–compression and static fatigue loading. The fatigue hysteresis loops area of the 2.5D SiC/[Si−B−C] composite decreases with increasing cycle numbers due to interface wear; the hysteresis loops area of the 2.5D C/[Si−B−C] composite decreases significantly after 144 hours of static fatigue loading, attributed to pyrocarbon interface recession by oxidation or by the beginning of carbon fiber recession. There exists an intermediate temperature (800–1000℃) regime where significant, time-dependent, strength degradation or fatigue life decrease of non-oxide CMCs can occur. 9 The carbon interphase is easy to oxidize at intermediate temperatures, which is called the “pest” phenomenon since fatigue life is markedly reduced. 10 The oxidation kinetics at intermediate temperature is controlled by gas-phase diffusion through matrix cracking. 11
In the present analysis, the damage evolution of unidirectional, cross-ply and 2.5D C/SiC at room and elevated temperatures in air and inert atmosphere have been investigated. The fatigue hysteresis modulus and hysteresis loop area versus cycle numbers have been analyzed. The evolution of the fatigue hysteresis modulus, hysteresis loop area and interface shear stress as a function of applied cycles have been analyzed for different peak stresses, fiber preforms and test conditions.
Materials and experimental procedures
Unidirectional and cross-ply C/SiC composites
The T−700™ carbon (Toray Institute Inc., Tokyo, Japan) fiber-reinforced silicon carbide matrix composites (C/SiC, CMCs) were provided by Li. 3 . The fibers have an average diameter of 7 µm and come on a spool as a tow of 12 k fibers. The unidirectional and cross-ply C/SiC were manufactured by the hot-pressing method at approximately 1000℃, which offered the ability to fabricate dense composites via a liquid phase sintering method at a low temperature. The fibers volume fraction was about 40%. Low pressure chemical vapor infiltration (CVI) was employed to deposit approximately 5–20 layers of pyrocarbon/SiC on individual fibers. The dog bone-shaped specimens, with 120 mm length, 3.2 mm thickness and 4.5 mm width in the gage section of unidirectional C/SiC, and 123 mm length, 3.8 mm thickness and 10 mm width in the gage section of cross-ply C/SiC, were cut from 150 mm × 150 mm panels by water cutting. The specimens were further coated with SiC of ∼20 µm thick by chemical vapor deposition (CVD) to prevent oxidation at elevated temperatures. These processing steps resulted in a material having bulk density of about 2 g/cm3, and an open porosity below 5%. The material properties of unidirectional and cross-ply C/SiC composites are given as follows 3 : Ef = 230 GPa (Ef is the fiber elastic modulus), Em = 350 GPa (Em is the matrix elastic modulus), αf = −0.38 × 10⁻⁶/℃ (αf is the fiber thermal expansion coefficient), αm = 2.8 × 10⁻⁶/℃ (αm is the matrix thermal expansion coefficient) and ΔT = −1000℃ (ΔT is the temperature difference between fabricated temperature T0 and testing temperature T1).
The tension–tension fatigue experiments at room temperature and 800℃ in air were conducted on an MTS Model 809 servo hydraulic load-frame (MTS Systems Corp., Minneapolis MN, USA) equipped with edge-loaded grips. The fatigue experiments used a sinusoidal wave form and a loading frequency of 10 Hz. The fatigue load ratio was 0.1, and the maximum number of applied cycles was defined to be 1,000,000. Under cyclic fatigue loading, the gage-section strains were measured using a clip-on extensometer (Model No. 634.12F-24 at room temperature and Model No. 632.53F-11 at 800℃ in air, MTS systems Corp.; modified for a 25 mm gage-length). The tension–tension fatigue tests were conducted under load control in accordance with the procedure in ASTM standard C 1360
12
at room temperature and 800℃ in air. During the process of fatigue loading, the displacement, strain and load were recorded for each cycle. The hysteresis modulus E is calculated by
13

The tensile strength of unidirectional C/SiC is 270 MPa at room temperature. The tensile fatigue peak stresses were 260 MPa (96% tensile strength), 240 MPa (88% tensile strength), 200 MPa (74% tensile strength), 180 MPa (66% tensile strength) and 140 MPa (51% tensile strength). At each peak stress level, two specimens were used to conduct the fatigue test. The tensile strength of unidirectional C/SiC is 320 MPa at 800℃ in air. The tensile fatigue peak stresses were 250 MPa (78% tensile strength), 210 MPa (65.6% tensile strength), 180 MPa (56% tensile strength), 140 MPa (43.7% tensile strength) and 120 MPa (37.5% tensile strength). At each peak stress level, two specimens were used to conduct the fatigue test.
The tensile strength of cross-ply C/SiC is 124 MPa at room temperature. The tensile fatigue peak stresses were 112 MPa (90% tensile strength), 105 MPa (85% tensile strength), 99.2 MPa (80% tensile strength) and 87 MPa (70% tensile strength). At each peak stress level, two specimens were used to conduct the fatigue test. The tensile strength of cross-ply C/SiC is 150 MPa at 800℃ in air. The tensile fatigue peak stresses were 105 MPa (70% tensile strength), 97.5 MPa (65% tensile strength) and 90 MPa (60% tensile strength), respectively. At each peak stress level, two specimens were used to conduct the fatigue test.
5D C/SiC composite
The T−300™ carbon (Toray Institute Inc., Tokyo, Japan) fiber-reinforced silicon carbide matrix composites (C/SiC, CMCs) were provided by Yang. 7 The fibers have an average diameter of 7 µm and come on a spool as a tow of 3k fibers. The pyrocarbon interphase was deposited on carbon fibers through CVD at 880℃. The SiC matrix was then deposited on fibers through CVI at 1000℃. The fibers volume fraction is about 45%, the interphase thickness is about 0.2 µm and the composite density is about 1.95–2.1 g/cm3. The dog bone-shaped specimens, with dimensions of 138 mm length, 3 mm thickness and 6 mm width in the gage section, were cut from composite panels using diamond cutting. The specimens were further coated with SiC of ∼20 µm thick by CVD to prevent oxidation at elevated temperatures. The material properties of 2.5D C/SiC composite are given as follows 7 : Ef = 230 GPa, Em = 350 GPa, αf = −0.38 ×10⁻⁶/℃, αm = 2.8 × 10⁻⁶/℃ and ΔT = −1000℃. The tension–tension fatigue experiments at room temperature and 800℃ in air were conducted on an MTS Model 809 servo hydraulic load-frame (MTS Systems Corp., Minneapolis MN, USA). The fatigue experiments were in a sinusoidal wave form and at a loading frequency of 10 Hz. The fatigue load ratio was 0.1, and the maximum number of applied cycles was defined to be 1,000,000.
The T−300™ carbon (Toray Institute Inc., Tokyo, Japan) fiber-reinforced silicon carbide matrix composites (C/SiC, CMCs) were provided by Dalmaz et al. 6 The composite is made from long woven yarns, which is infiltrated by a pyrocarbon interphase through CVD. The SiC is deposited by CVI. The fabrication temperature of the pyrocarbon interphase and deposited SiC matrix is approximately 1000℃. The fiber volume fraction is about 42%, and the composite exhibits a density of 2.2 g/cm3. The tension–tension fatigue tests at 600℃ in an inert atmosphere were conducted in an INSTRON 8502 servo-hydraulic load-frame (INSTRON System Corp., Norwood, Massachusetts, USA) and an AET furnace system (AET Technologies Corp., Meylan, France). The fatigue experiments were in a sinusoidal wave form at loading frequencies of 1 and 10 Hz and the fatigue load ratio was zero. The material properties of the 2.5D C/SiC composite are given as follows 6 : Ef = 230 GPa, Em = 430 GPa, αf = 1 × 10⁻⁶/℃, αm = 4.8 × 10⁻⁶/℃ and ΔT = −1000℃.
Theoretical analysis
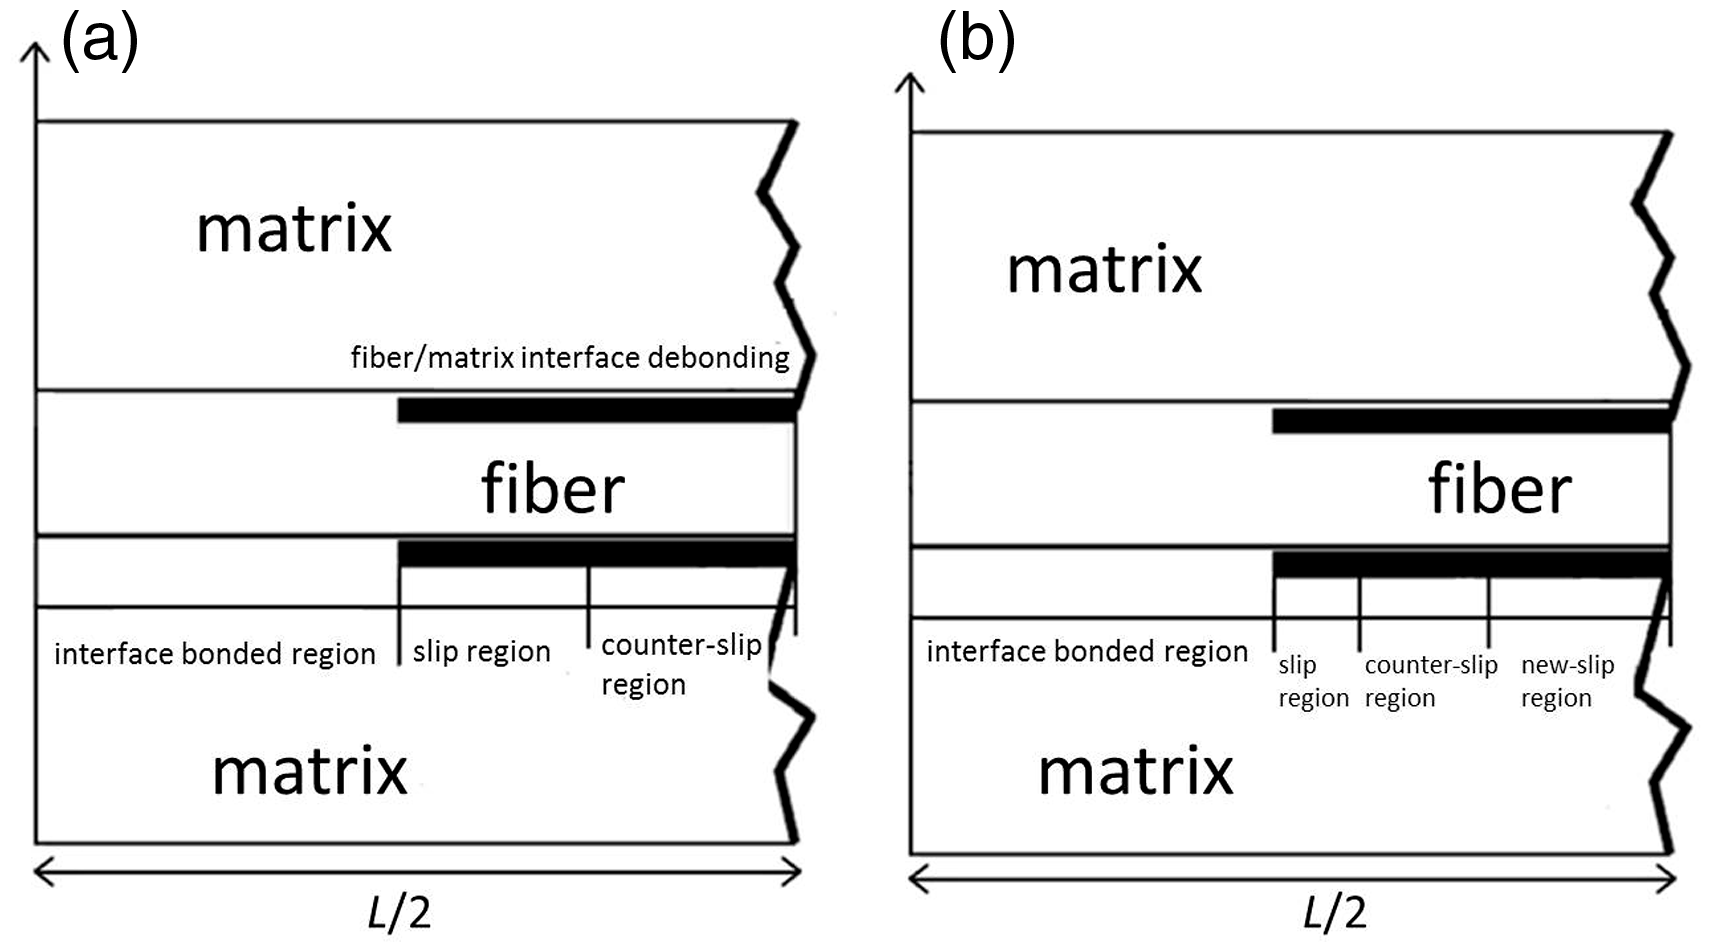
If matrix cracking and interface debonding are present upon first loading, the hysteresis loops develop as a result of energy dissipation through frictional slip between fibers and the matrix upon unloading/reloading.2,8,14,15 Upon unloading, counter-slip occurs in the interface debonded region. The interface debonded region can be divided into the interface counter-slip region and the interface slip region, as shown in Figure 1(a). The interface counter-slip length is denoted to be y. Upon reloading, new slip occurs in the interface debonded region. The interface debonded region can be divided into the interface new-slip region, interface counter-slip region and interface slip region, as shown in Figure 1(b). The interface new-slip region is denoted to be z. Based on the damage mechanism of interface frictional slip, the hysteresis loops can be classified into four interface slip cases, as follows:
Case 1: the interface partially debonds, and the fiber completely slides relative to the matrix; Case 2: the interface partially debonds, and the fiber partially slides relative to the matrix; Case 3: the interface completely debonds, and the fiber partially slides relative to the matrix; Case 4: the interface completely debonds, and the fiber completely slides relative to the matrix. The schematic figure for fiber slipping relative to matrix upon (a) unloading and (b) reloading.
When damage forms within the composite, the composite strain is determined by equation (2), which assumes that the composite strain is equivalent to the average strain in an undamaged fiber

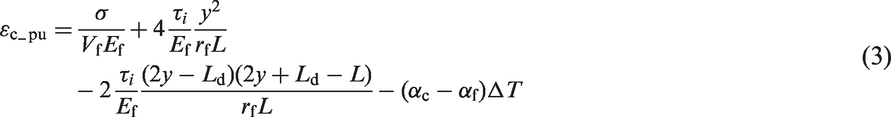
When the interface partially debonds, the unloading strain ɛc_pu and reloading strain ɛc_pr for interface slip for Cases 1 and 2 are determined by equations (3) and (4)
16
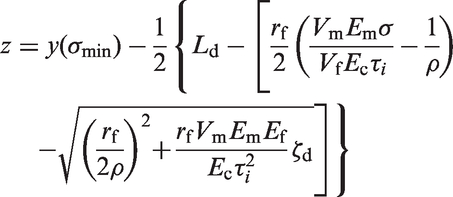
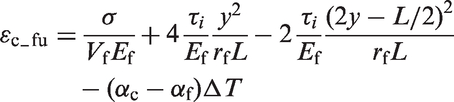
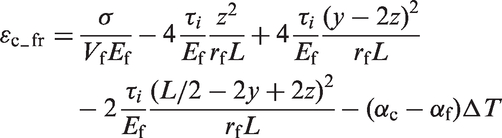
When the interface completely debonds, the unloading strain ɛc_fu and reloading strain ɛc_fr for interface slip Cases 3 and 4 are determined by equations (7) and (8)
16


Under cyclic fatigue loading, the area associated with the hysteresis loops is defined by equation (11)

The fatigue hysteresis loops, hysteresis loop area and interface slip of unidirectional the SiC/CAS composite under σmax = 240 MPa are shown in Figure 2. The hysteresis loops of the first, second, third and fourth interface slip cases are shown in Figure 2(a). When τ
i
= 27–50 MPa, that is, the A−B part in Figure 2(b), the hysteresis loop area increases with decreasing interface shear stress. The hysteresis loops correspond to the interface slip Case 1, that is, the interface partially debonds (Ld < L/2 in Figure 2(c)), and the fiber completely slides relative to the matrix in the interface debonded region (y(σmin) = Ld in Figure 2(d)). When τ
i
= 8.8–27 MPa, that is, the B−C part in Figure 2(b), the hysteresis loop area increases with decreasing interface shear stress. The hysteresis loops correspond to the interface slip Case 2, that is, the interface partially debonds (Ld < L/2 in Figure 2(c)), and the fiber partially slides relative to the matrix in the interface debonded region (y(σmin) < Ld in Figure 2(d)). When τ
i
= 8.3–8.8 MPa, that is, the C−D part in Figure 2(b), the hysteresis loop area increases with decreasing interface shear stress. The hysteresis loops correspond to the interface slip Case 3, that is, the interface completely debonds (Ld = L/2 in Figure 2(c)), and the fiber partially slides relative to the matrix in the interface debonded region (y(σmin) < L/2 in Figure 2(d)). When τ
i
= 1–8.3 MPa, that is, the D−E part in Figure 2(b), the hysteresis loop area increases to the maximum value, and then decreases with decreasing interface shear stress. The hysteresis loops correspond to the interface slip Case 4, that is, the interface completely debonds (Ld = L/2 in Figure 2(c)), and the fiber completely slides relative to the matrix in the interface debonded region (y(σmin) = L/2 in Figure 2(d)). By comparing the experimental hysteresis loop area with theoretical computational values, the interface shear stress corresponding to different applied cycles can be obtained.
(a) The fatigue hysteresis loops of four different interface slip cases. (b) The fatigue hysteresis loop area versus interface shear stress. (c) The interface debonded length (2Ld/L) versus interface shear stress. (d) The interface counter-slip length (y/Ld) versus interface shear stress of the unidirectional SiC/CAS composite under σmax = 240 MPa.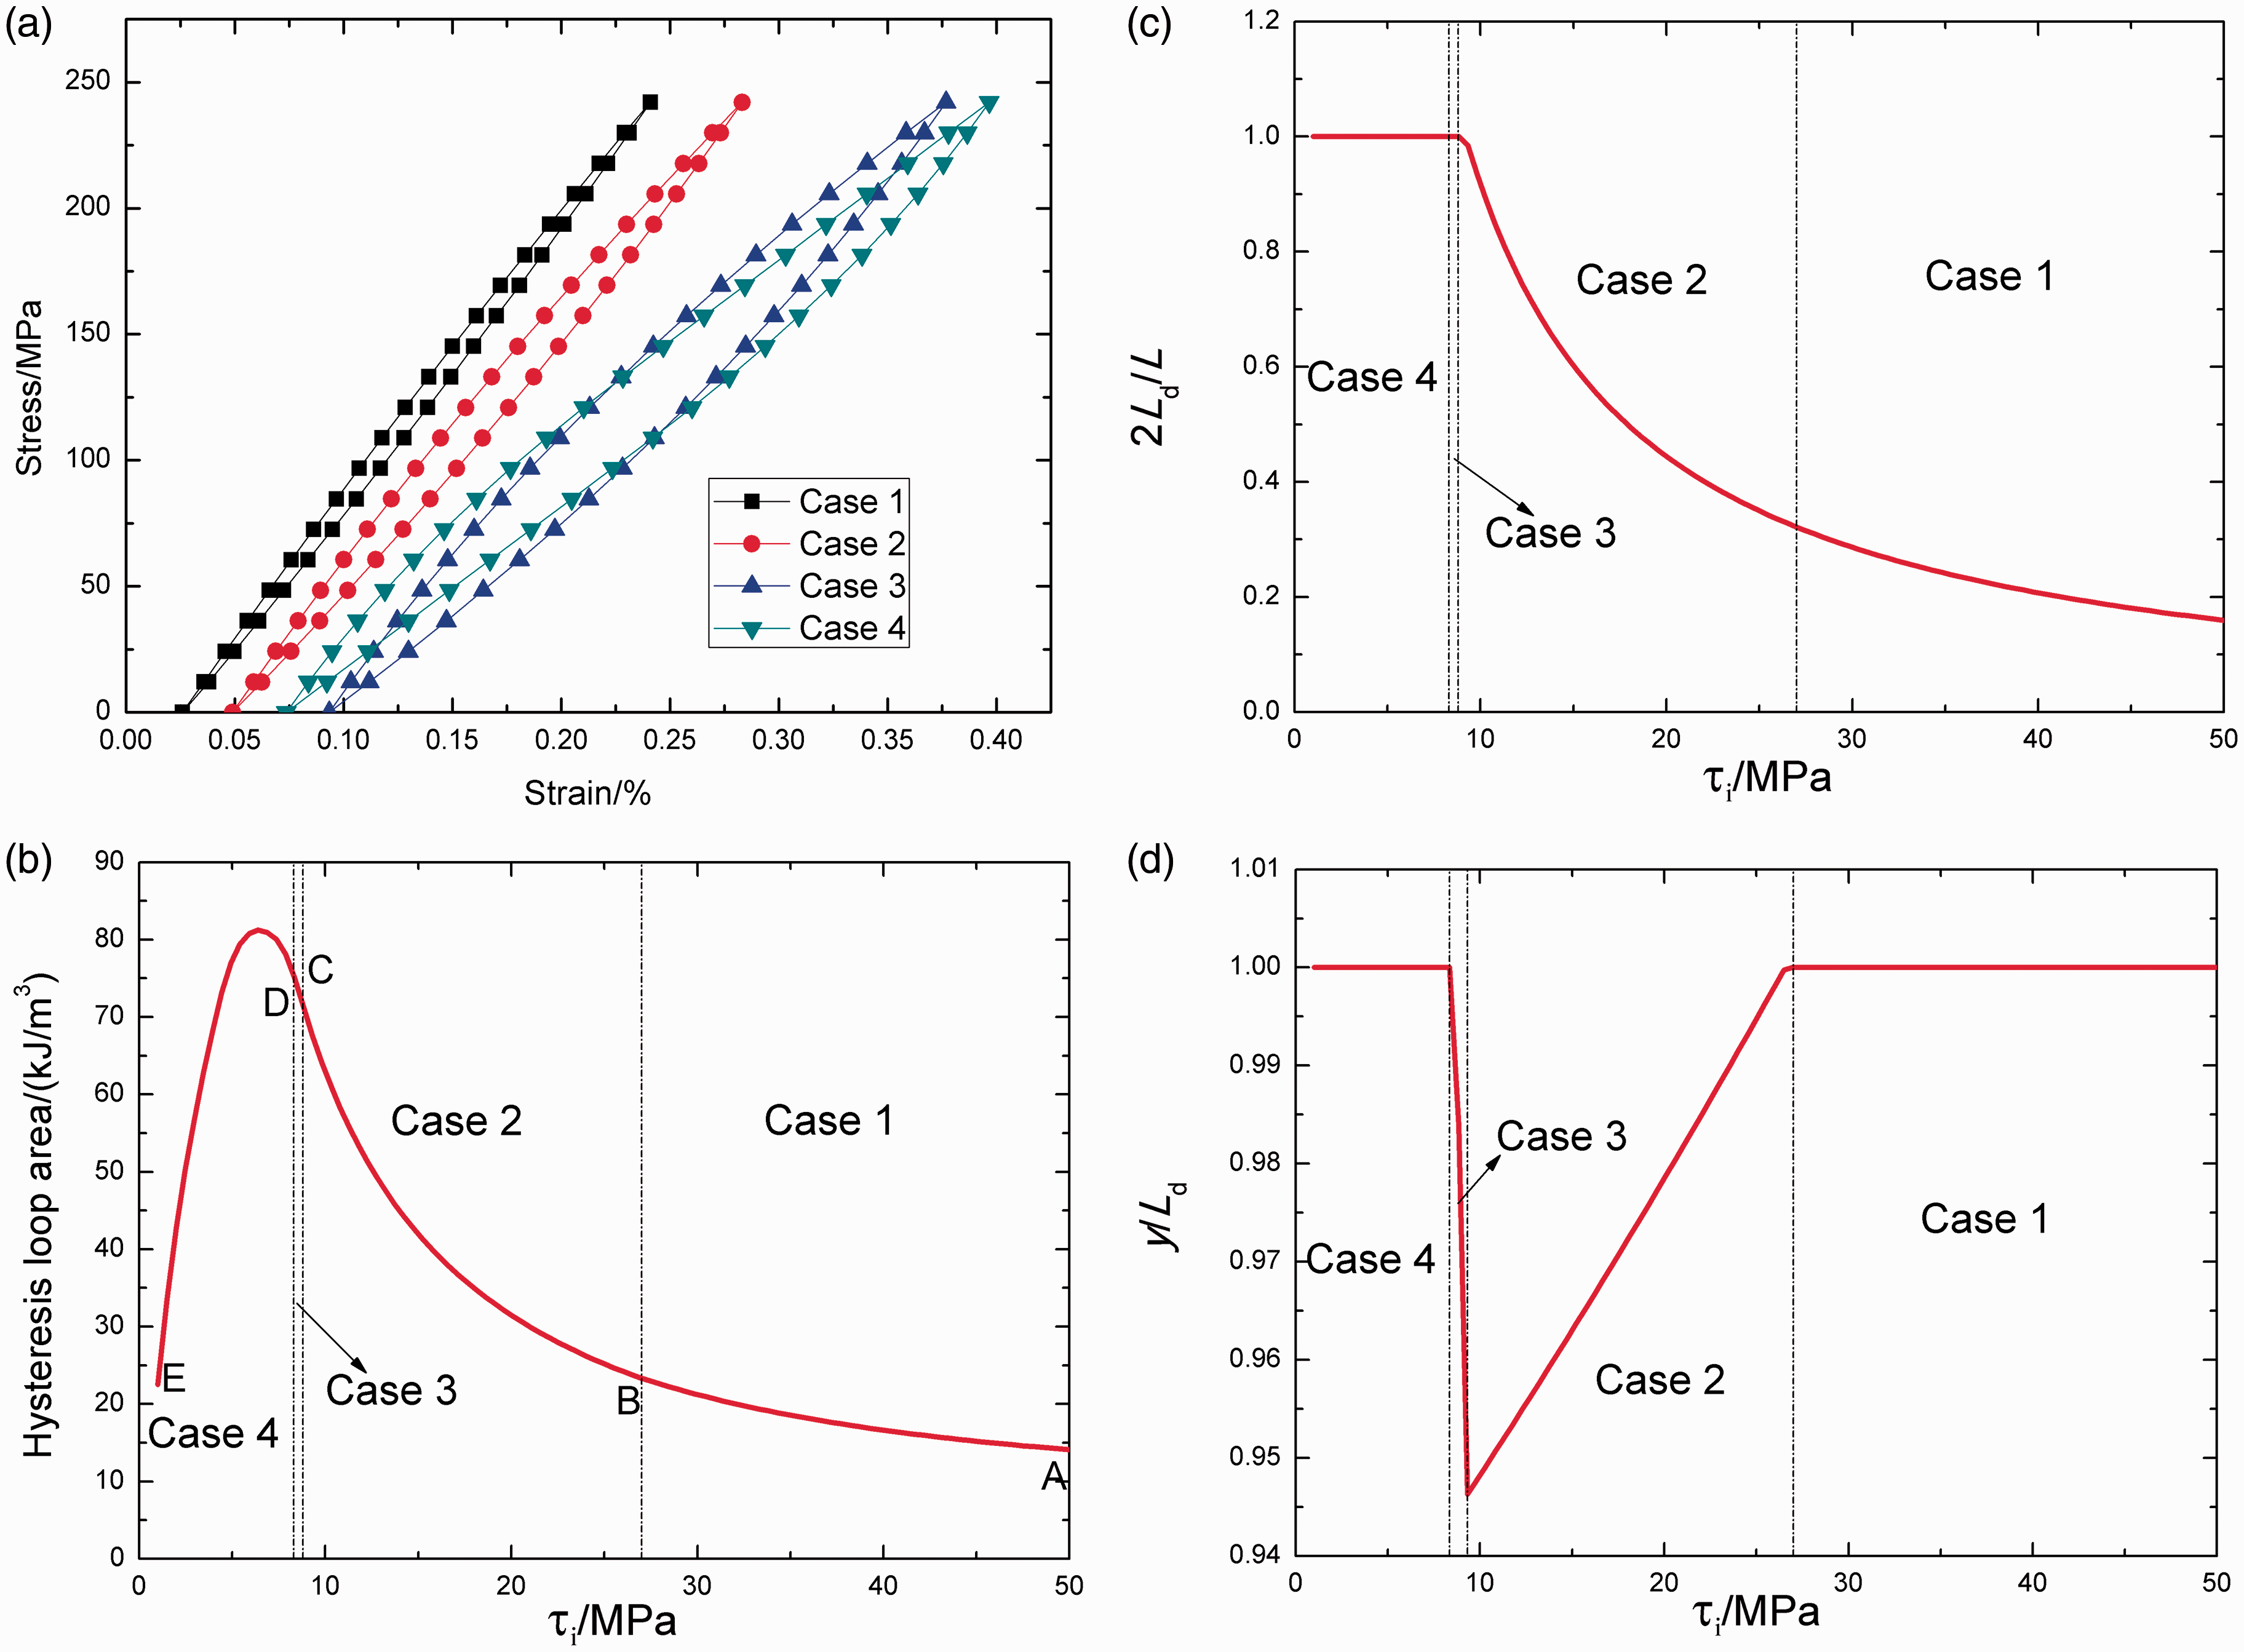
Experimental results
Unidirectional C/SiC composite
Room temperature
Under cyclic fatigue loading, the Multiple Purpose Testware (MPT) was used to program the tensile fatigue tests and to acquire data throughout the duration of fatigue tests. After the start of fatigue testing, there needs to be a transition process to go through for the hydraulic machine to let the specimen’s actual stress amplitudes achieve the desired levels. The length of the transition process is relevant with the proportional–integral–derivative (PID) parameter setting.
17
However, the PID parameters are difficult to set for tensile fatigue tests of unidirectional C/SiC, due to their sensitivity to materials and test environments. For the tensile fatigue experiments conducted at room temperature, there needs a period of approximately 2000 applied cycles for the specimen to achieve the desired peak and valley stresses. Under σmax = 180 MPa, the fatigue peak and valley stresses versus cycle number curves are as shown in Figure 3(a), in which the fatigue peak and valley stresses approach the desired levels after experiencing 2000 applied cycles. The peak displacement increases with increasing cycle numbers, and the valley displacement decreases from 1000 to 10,000 applied cycles, due to the variation of fatigue valley stress to the desired level, as shown in Figure 3(b). The fatigue hysteresis modulus versus cycle number curve can be divided into two regions, that is, (1) at the initial stage of fatigue loading, the hysteresis modulus decreases from 175 GPa at the first applied cycle to 155 GPa at the 10th applied cycle, due to matrix cracking and interface debonding
2
; and (2) the hysteresis modulus decreases slowly with increasing cycle numbers to 150 GPa at the 1,071,870th cycle due to interface wear,
6
as shown in Figure 3(c). The fatigue hysteresis loop area degrades from 32 kJ/m3 at the first cycle to 5.4 kJ/m3 at the 1,039,332th cycle, as shown in Figure 3(d).
(a) The peak and valley stresses versus cycle number. (b) The peak and valley displacements versus cycle number. (c) The fatigue hysteresis modulus versus cycle number. (d) The fatigue hysteresis loop area versus cycle number of the unidirectional C/SiC composite under σmax = 180 MPa at room temperature.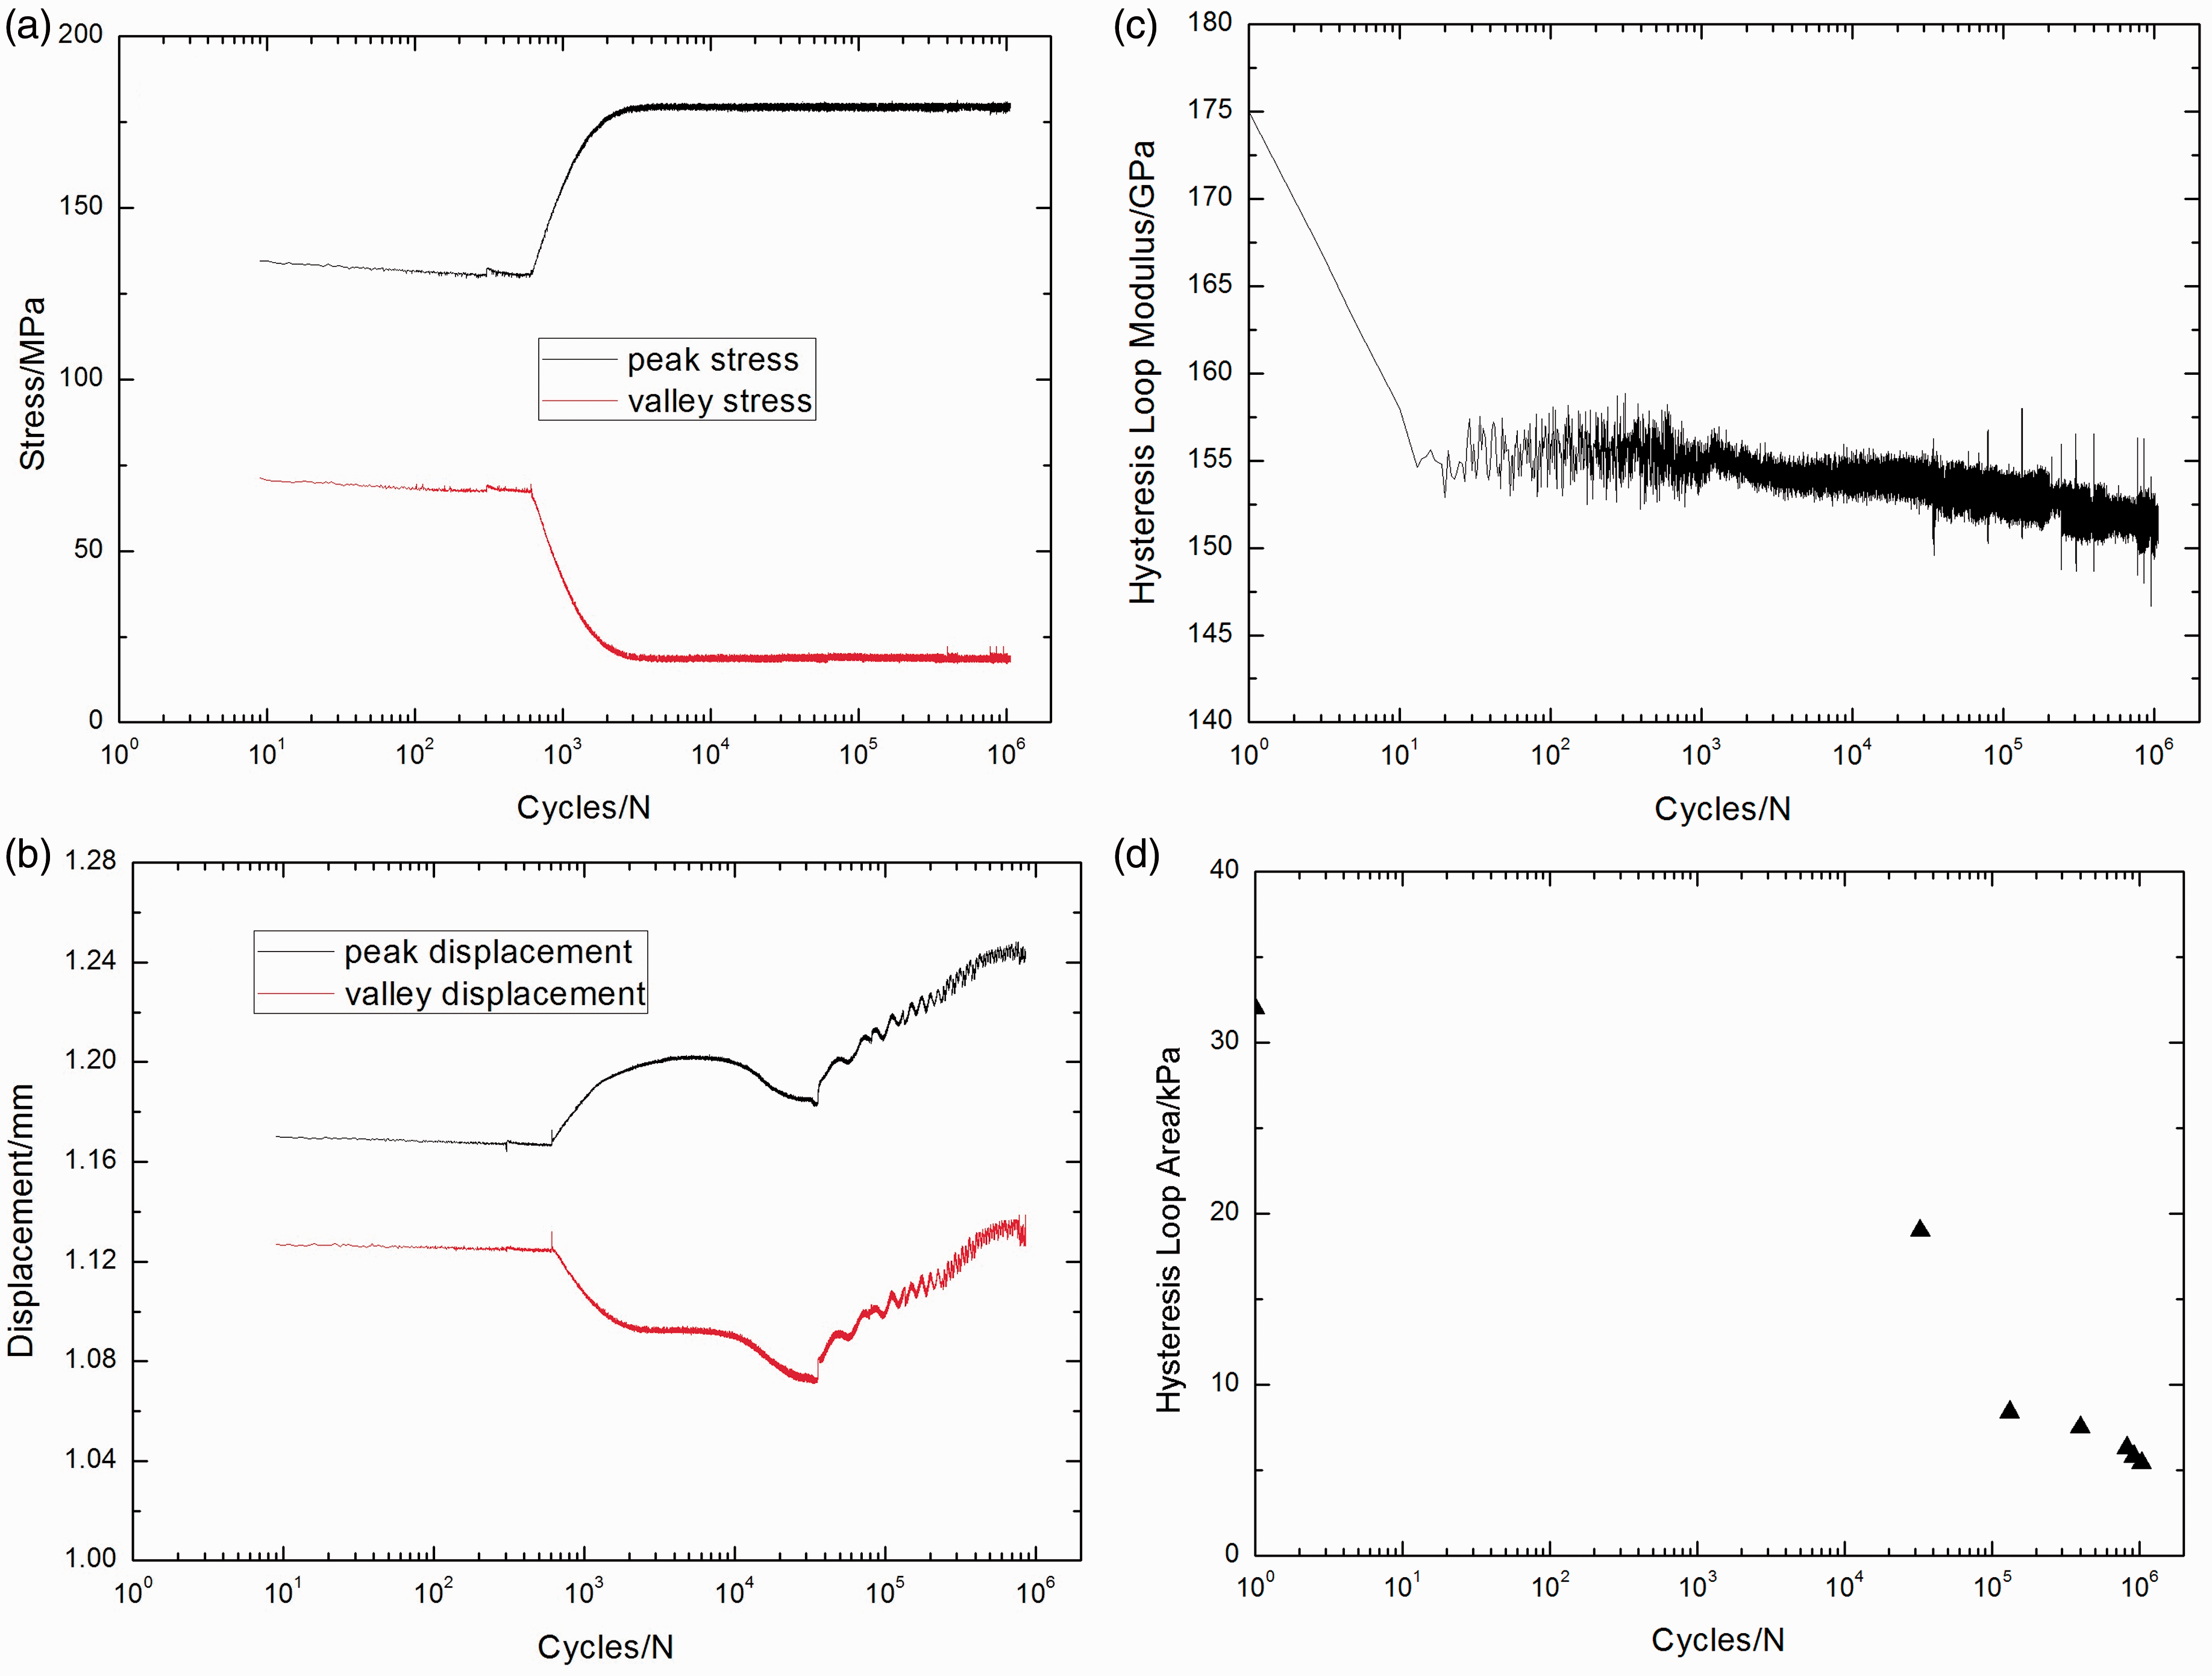
Under σmax = 240 MPa, the fatigue peak and valley stresses versus cycle number curves are as shown in Figure 4(a), in which the fatigue peak and valley stresses approach the desired levels immediately due to the high peak stress level. The peak and valley displacements increase with increasing cycle numbers, as shown in Figure 4(b), due to matrix cracking and interface debonding. The fatigue hysteresis modulus degrades rapidly at the initial stage of fatigue loading, as shown in Figure 4(c), which shows degradation from 169 to 128 GPa at the first 10 cycles, due to matrix cracking and interface debonding.
2
With the number of applied cycles increasing, the fatigue hysteresis modulus degrades slowly due to interface wear.
6
The fatigue hysteresis loop area degrades from 56 kJ/m3 at the first cycle to 8 kJ/m3 at the 1,000,000th cycle, as shown in Figure 4(d).
(a) The fatigue peak and valley stresses versus cycle number. (b) The fatigue peak and valley displacements versus cycle number. (c) The fatigue hysteresis modulus versus cycle number. (d) The fatigue hysteresis loop area versus cycle number of the unidirectional C/SiC composite under σmax = 240 MPa at room temperature.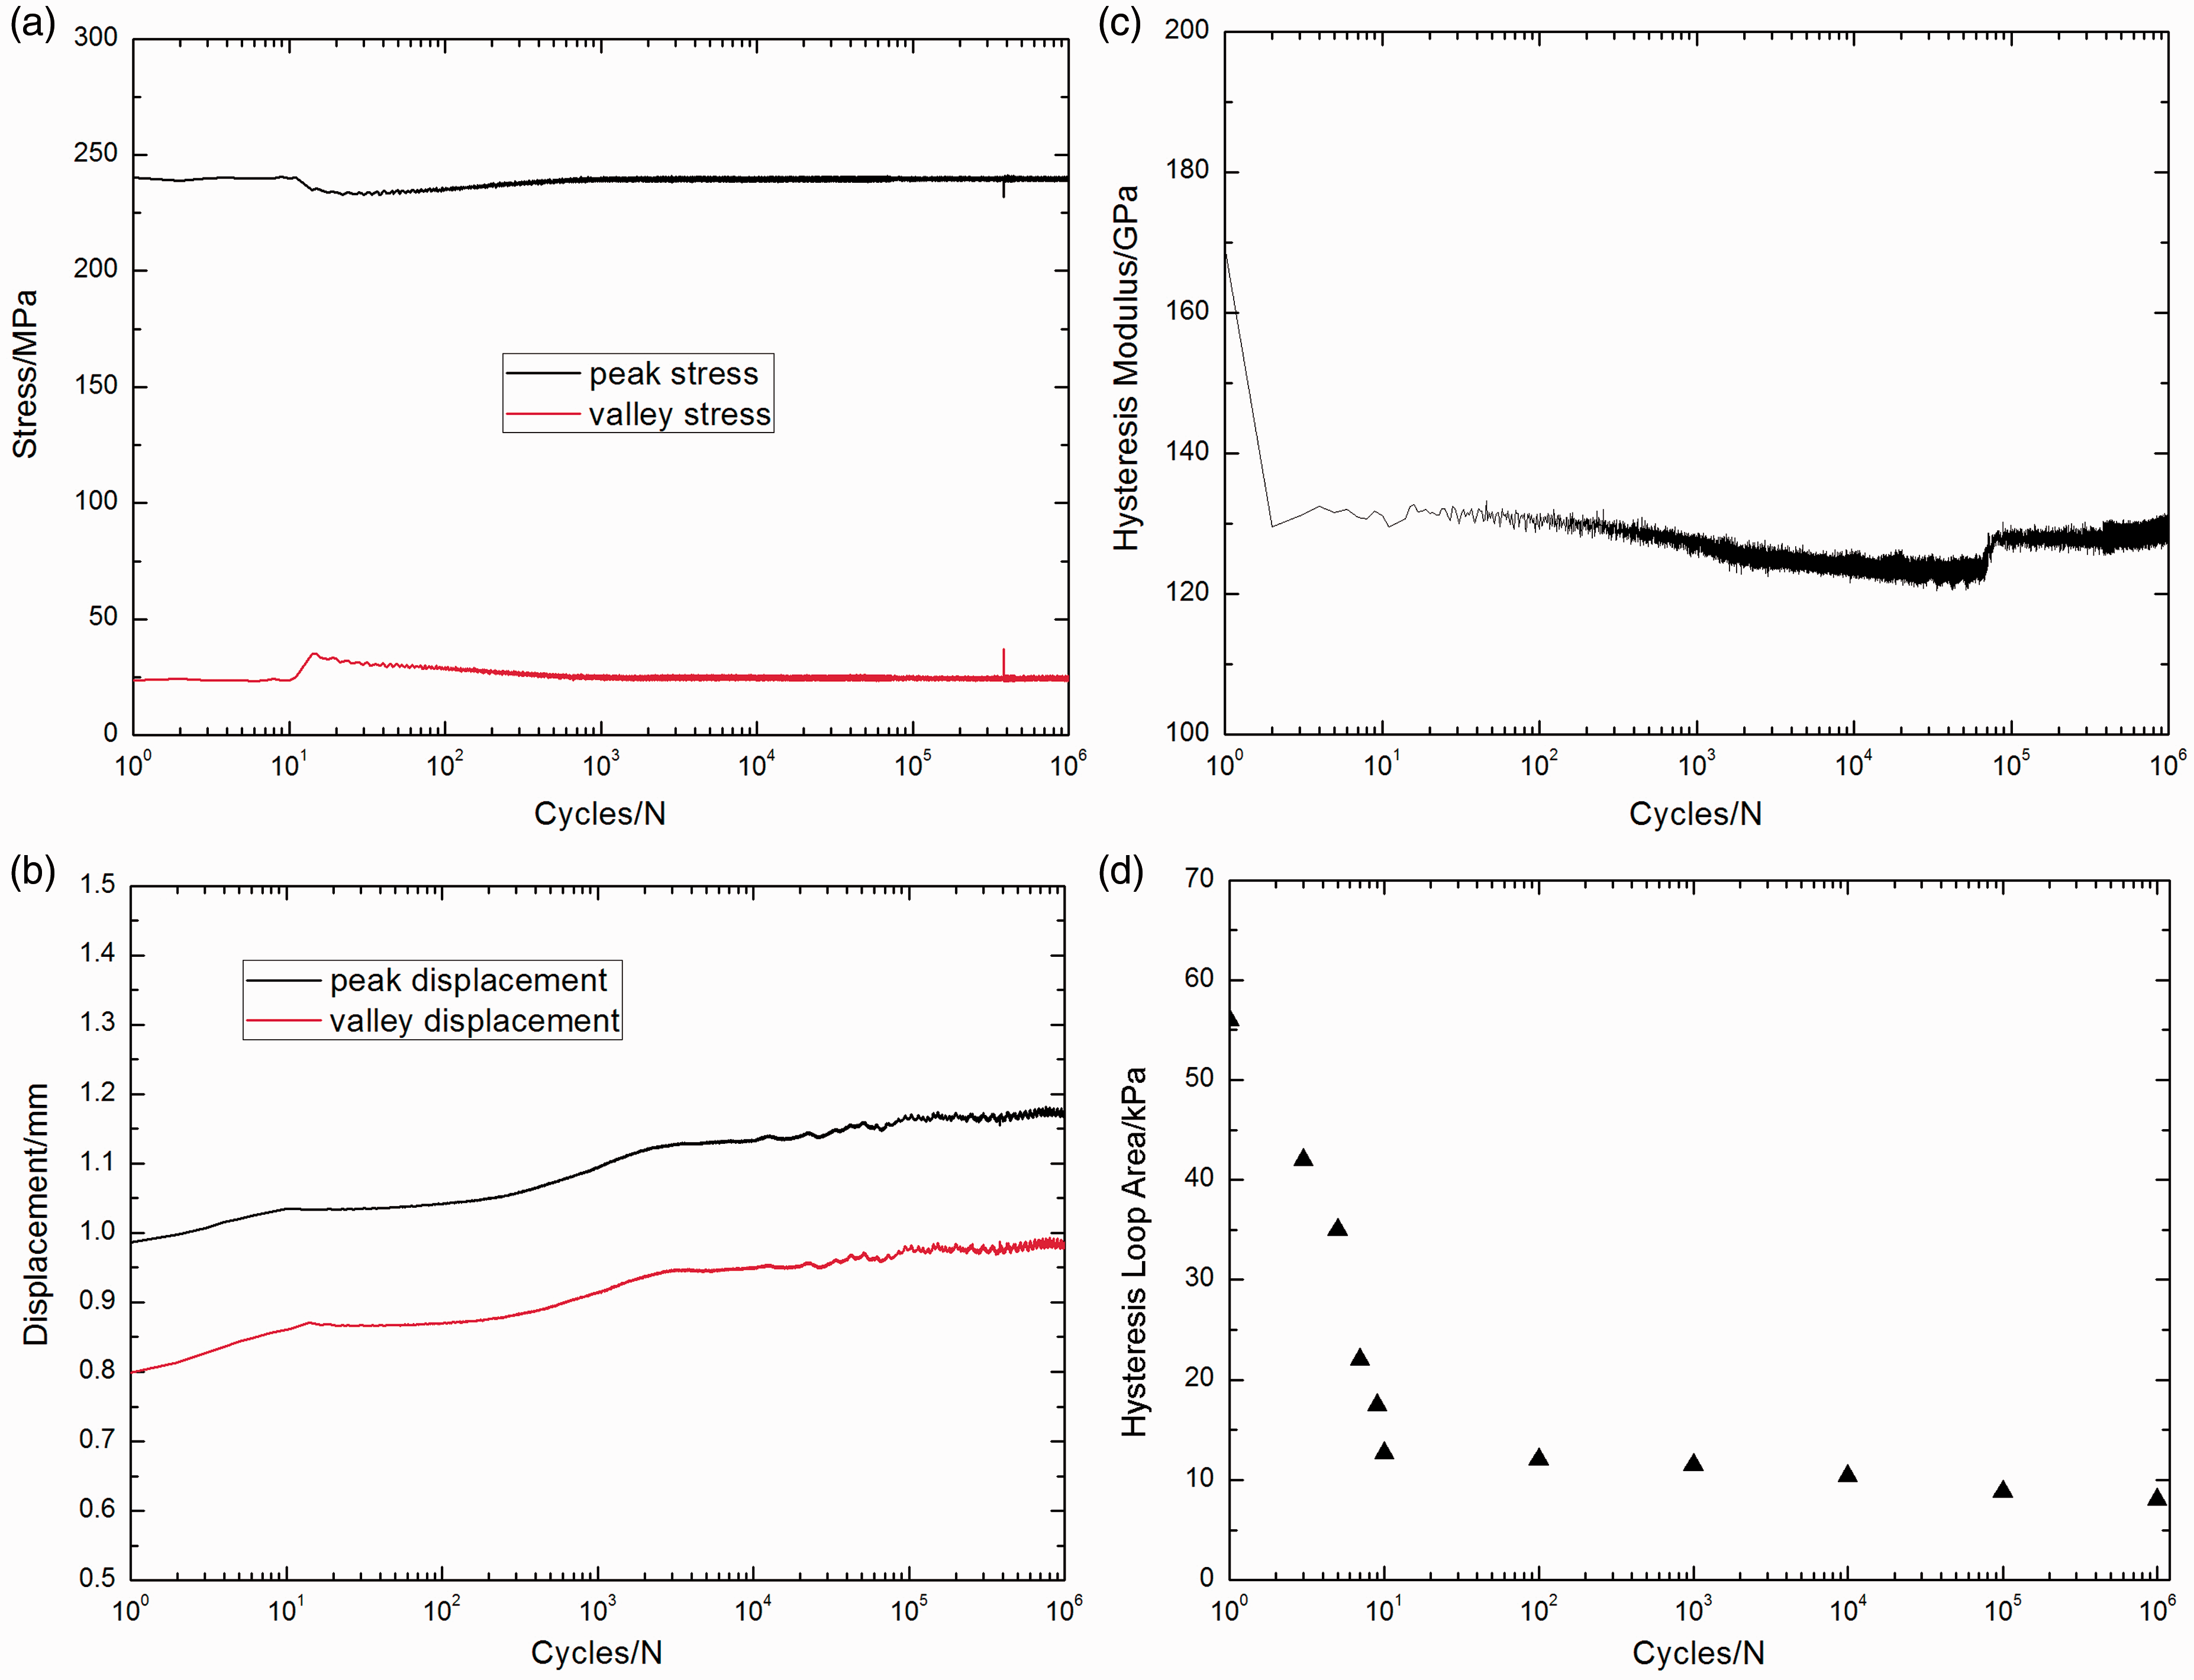
Elevated temperature
Under σmax = 250 MPa, the fatigue peak and valley stresses versus cycle number curves are as shown in Figure 5(a), in which the fatigue peak and valley stresses approach the desired levels immediately due to the high peak stress level. The peak and valley displacements increase with increasing cycle number, as shown in Figure 5(b), due to matrix cracking and interface debonding. The fatigue hysteresis modulus versus cycle number curve can be divided into three regions, that is, (1) at the initial stage of cyclic loading, the fatigue hysteresis modulus degrades rapidly from 210 GPa at the first applied cycle to 188 GPa at the 10th applied cycle, due to matrix cracking and interface debonding
2
; (2) when matrix cracks approach saturation, the fatigue hysteresis modulus degrades slowly from 184 GPa at the 50th cycle to 174 GPa at the 5000th cycle due to interface oxidation
8
; and (3) at the final 1000 cycles, the fatigue hysteresis modulus degrades rapidly from 168 GPa at the 23,000th cycle to 83 GPa at the 24,541th cycle due to fiber fracture,
3
as shown in Figure 5(c). The fatigue hysteresis loop area degrades from 62 kJ/m3 at the first cycle to 7.2 kJ/m3 at the 24,000th cycle, as shown in Figure 5(d).
(a) The fatigue peak and valley stresses versus cycle number. (b) The fatigue peak and valley displacements versus cycle number. (c) The fatigue hysteresis modulus versus cycle number. (d) The fatigue hysteresis loop area versus cycle number of the unidirectional C/SiC composite under σmax = 250 MPa at 800℃ in air atmosphere.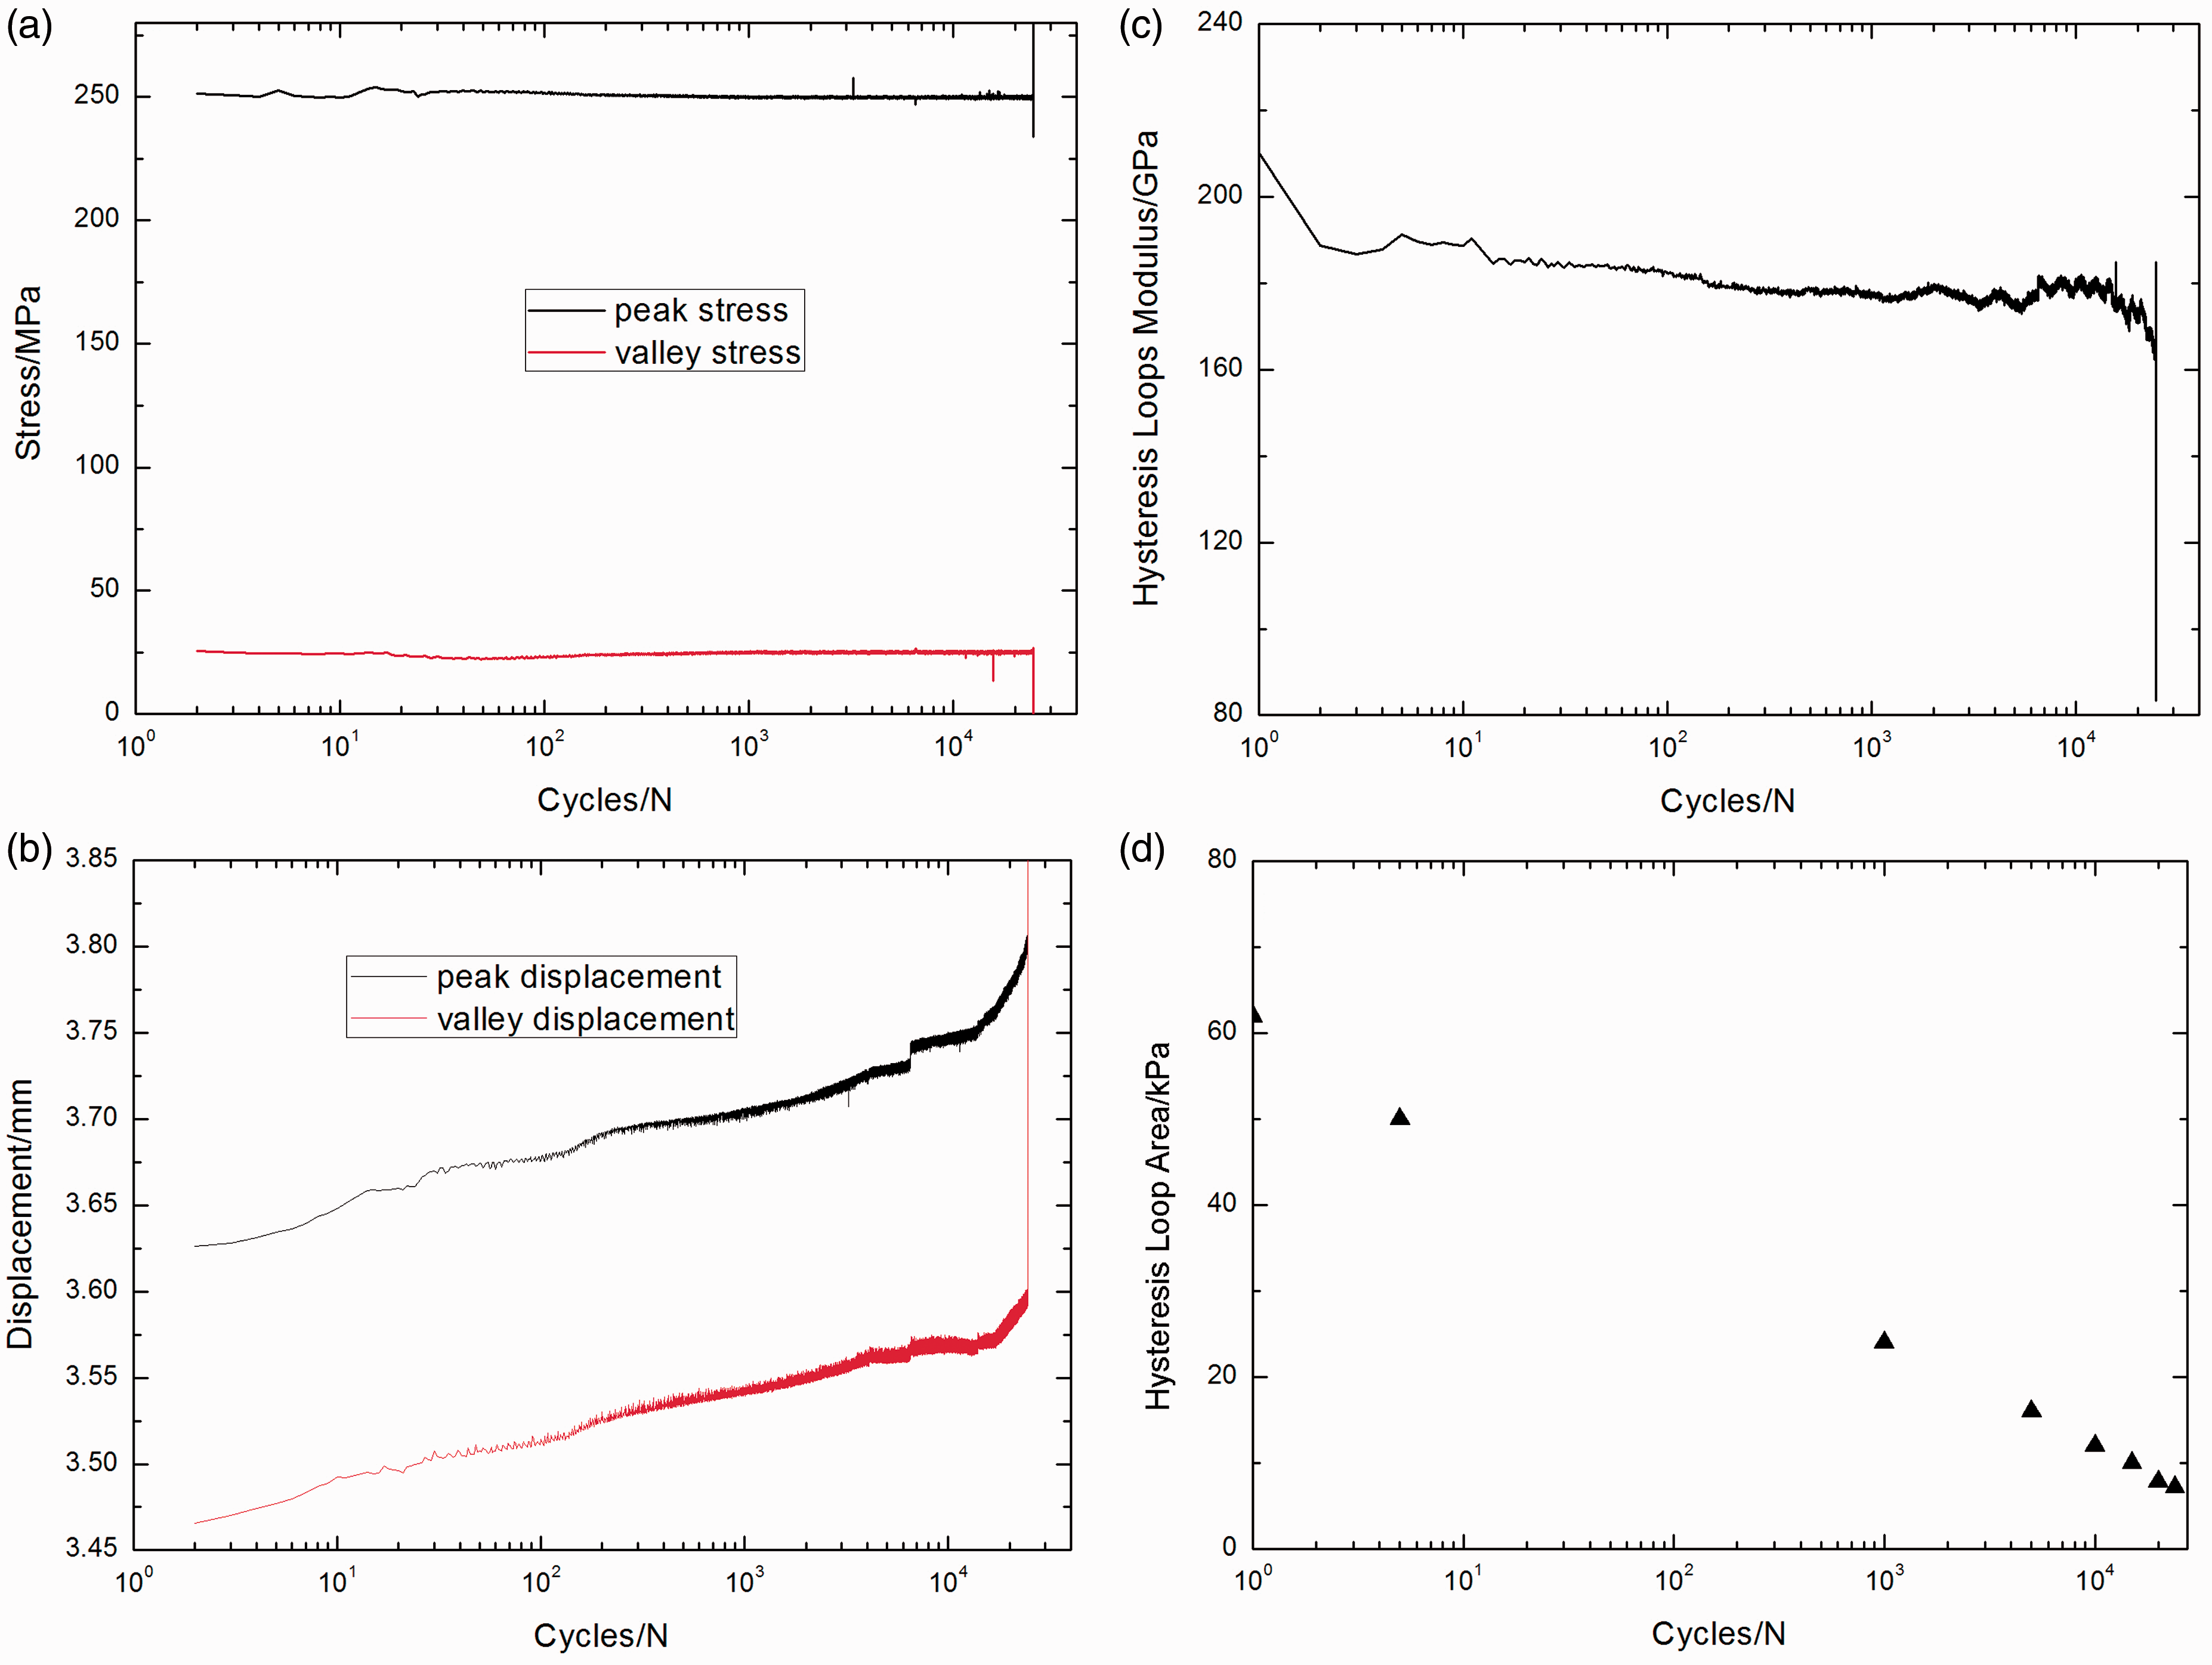
Cross-ply C/SiC composite
Room temperature
Under σmax = 105 MPa, the fatigue peak and valley stresses versus cycle number curves are as shown in Figure 6(a), in which the fatigue peak and valley stresses approach the desired levels after experiencing 1000 applied cycles. The peak displacement increases with increasing cycle numbers, and the valley displacement continually decreases from the initial cycle to 2000 applied cycles and increases, due to the variation of fatigue valley stress to the desired level, as shown in Figure 6(b). The fatigue hysteresis modulus degrades from 60 GPa at the first cycle to 48 GPa at the 10th cycle, due to matrix cracking and interface debonding,
2
as shown in Figure 6(c). With the number of applied cycles increasing, the fatigue hysteresis modulus degrades slowly from 48 GPa at the 10th cycle to 46 GPa at the 1,000,000th cycle due to interface wear.
6
The fatigue hysteresis loop area degrades from 35 kJ/m3 at the first cycle to 10.7 kJ/m3 at the 1,000,000th cycle, as shown in Figure 6(d).
(a) The fatigue peak and valley stresses versus cycle number. (b) The fatigue peak and valley displacements versus cycle number. (c) The fatigue hysteresis modulus versus cycle number. (d) The fatigue hysteresis loop area versus cycle number of the cross-ply C/SiC composite under σmax = 105 MPa at room temperature.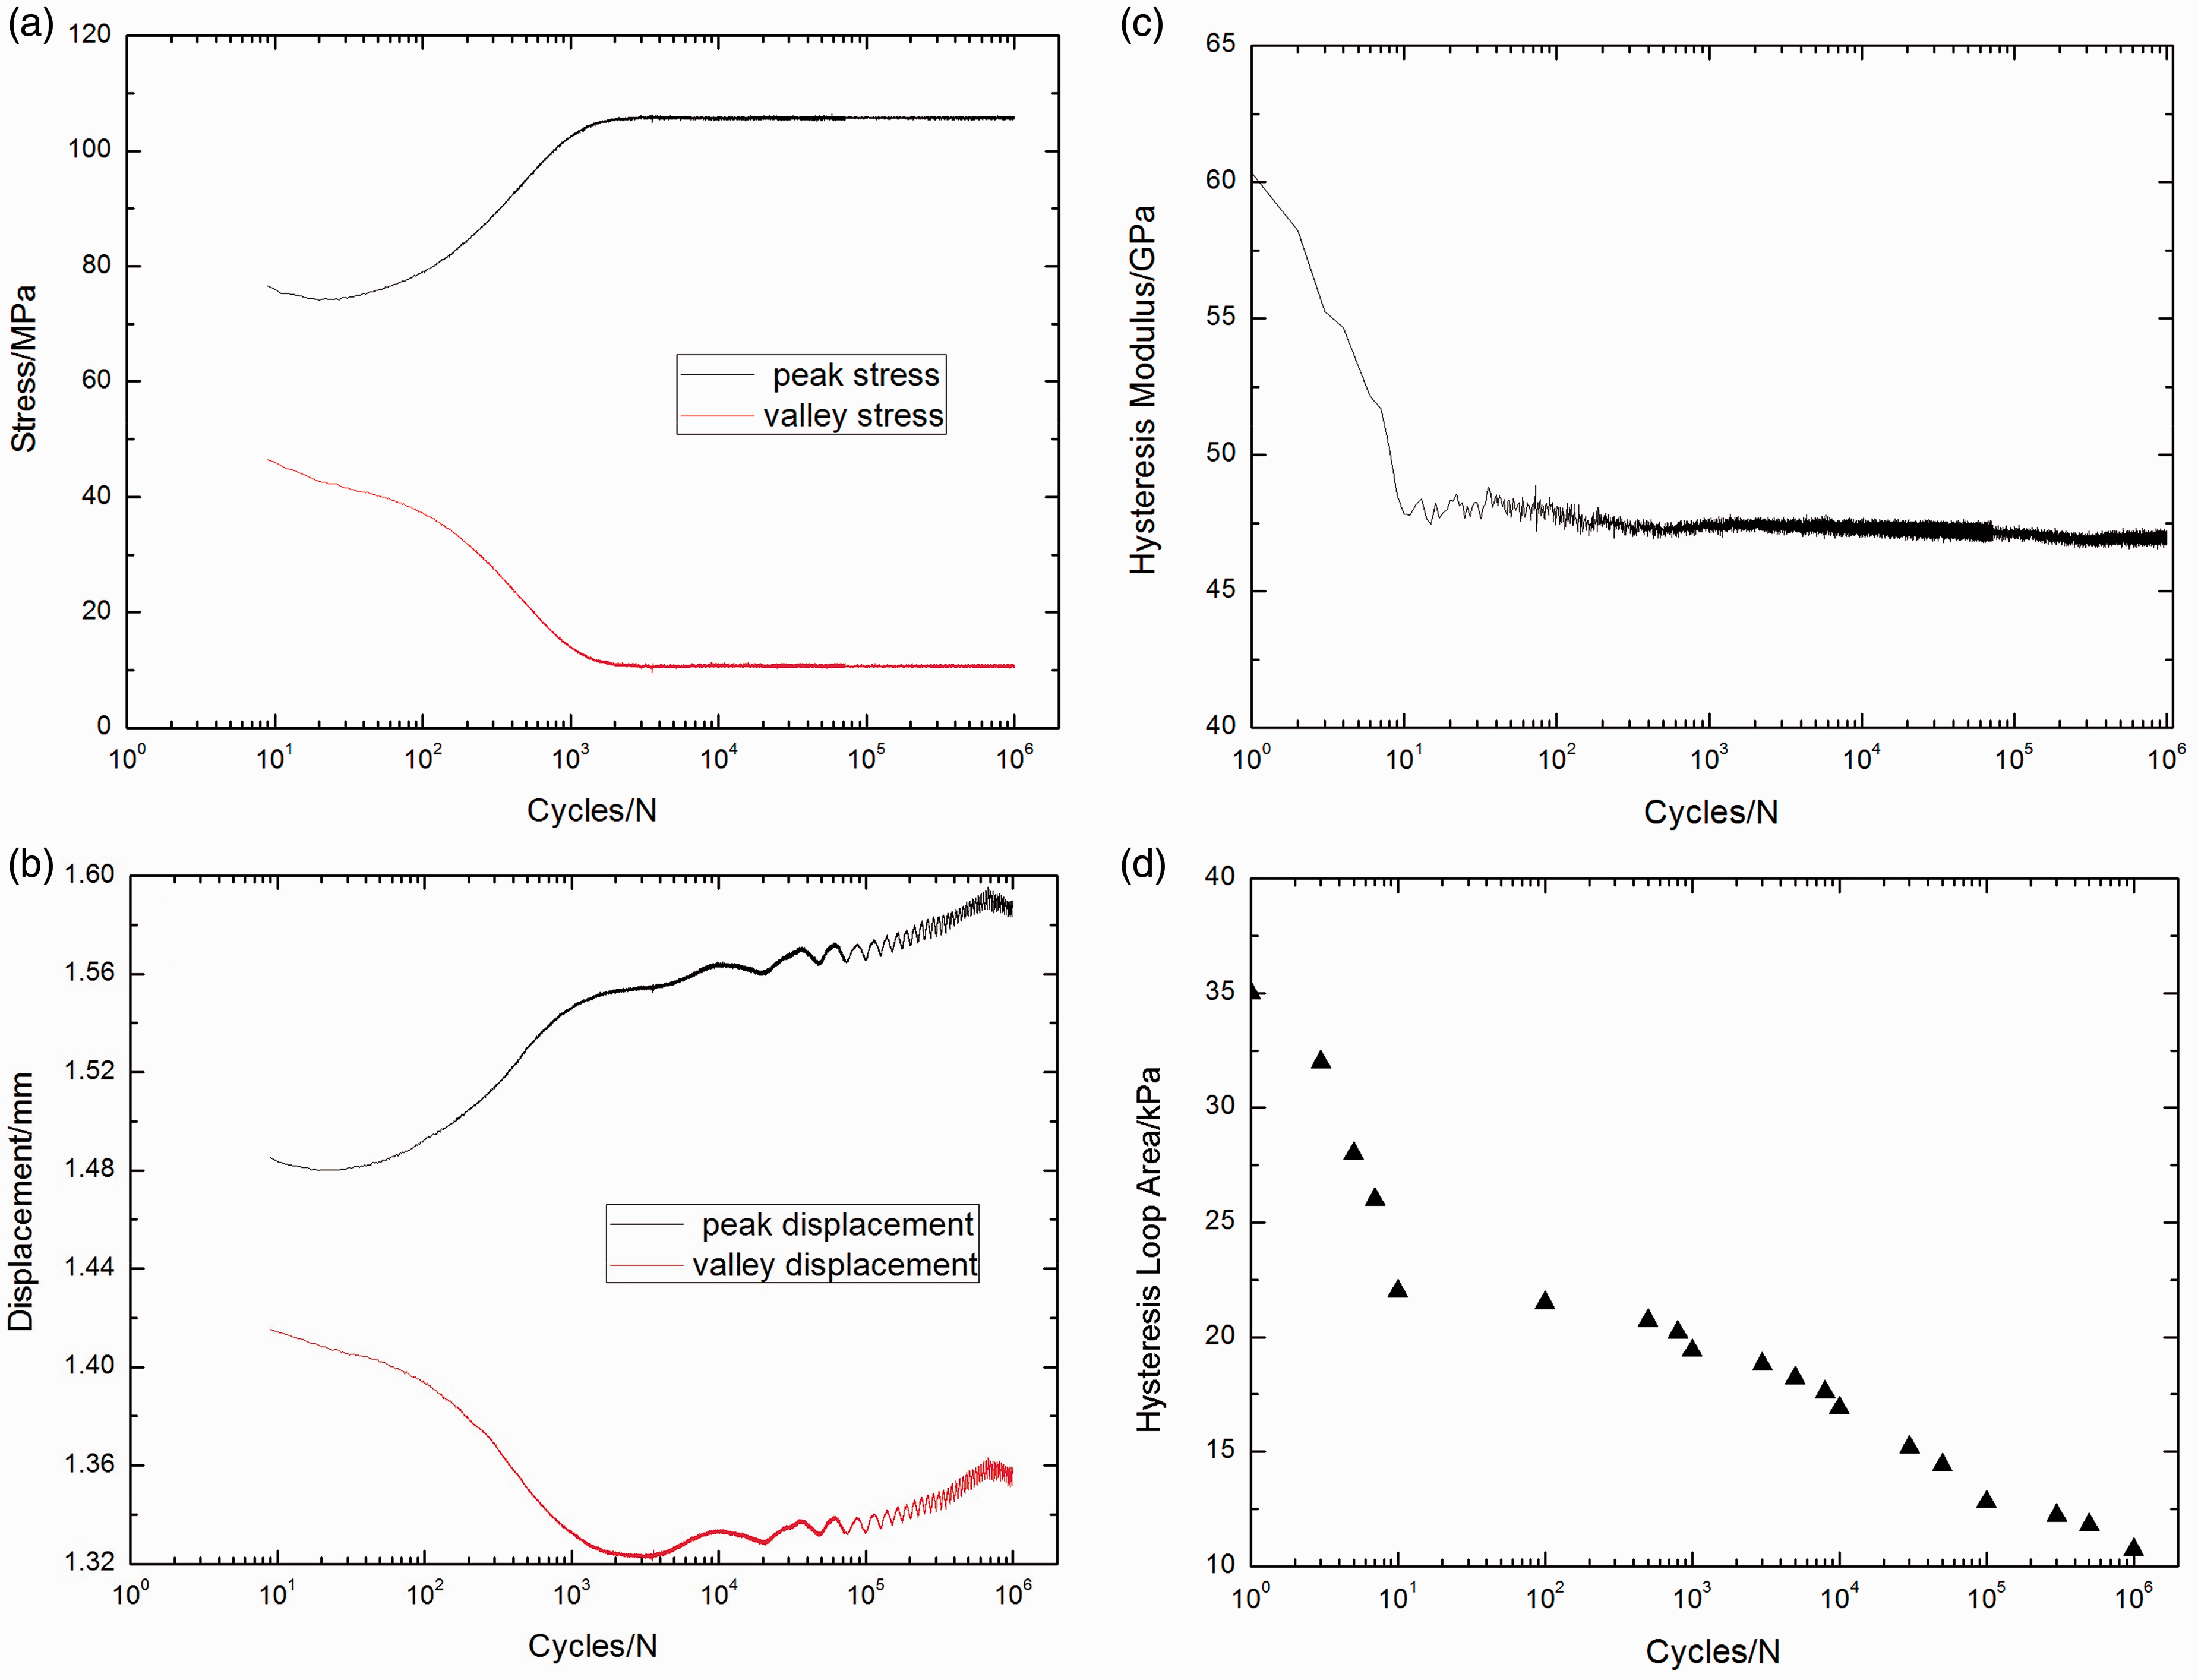
Elevated temperature
Under σmax = 105 MPa, the fatigue peak and valley stresses versus cycle number curves are as shown in Figure 7(a), in which the fatigue peak and valley stresses approach the desired levels immediately. The peak and valley displacements increase with increasing cycle numbers, as shown in Figure 7(b). The fatigue hysteresis modulus versus the number of applied cycles curve can be divided into three regions, that is, (1) at the initial stage of cyclic loading, the fatigue hysteresis modulus degrades rapidly due to transverse cracking in the 90° plies, matrix cracking and interface debonding in the 0° plies
4
; (2) when matrix cracks approach saturation, the fatigue hysteresis modulus degrades slowly due to the decay of interface shear stress
2
; (3) during the process of final cyclic loading, the fatigue hysteresis modulus decreases rapidly due to fiber fracture,
3
as shown in Figure 7(c). The fatigue hysteresis loop area degrades from 24.3 kJ/m3 at the first cycle to 5.1 kJ/m3 at the 6600th cycle, as shown in Figure 7(d).
(a) The fatigue peak and valley stresses versus cycle number. (b) The fatigue peak and valley displacements versus cycle number. (c) The fatigue hysteresis modulus versus cycle number. (d) The fatigue hysteresis loop area versus cycle number of the cross-ply C/SiC composite under σmax = 105 MPa at 800℃ in air atmosphere.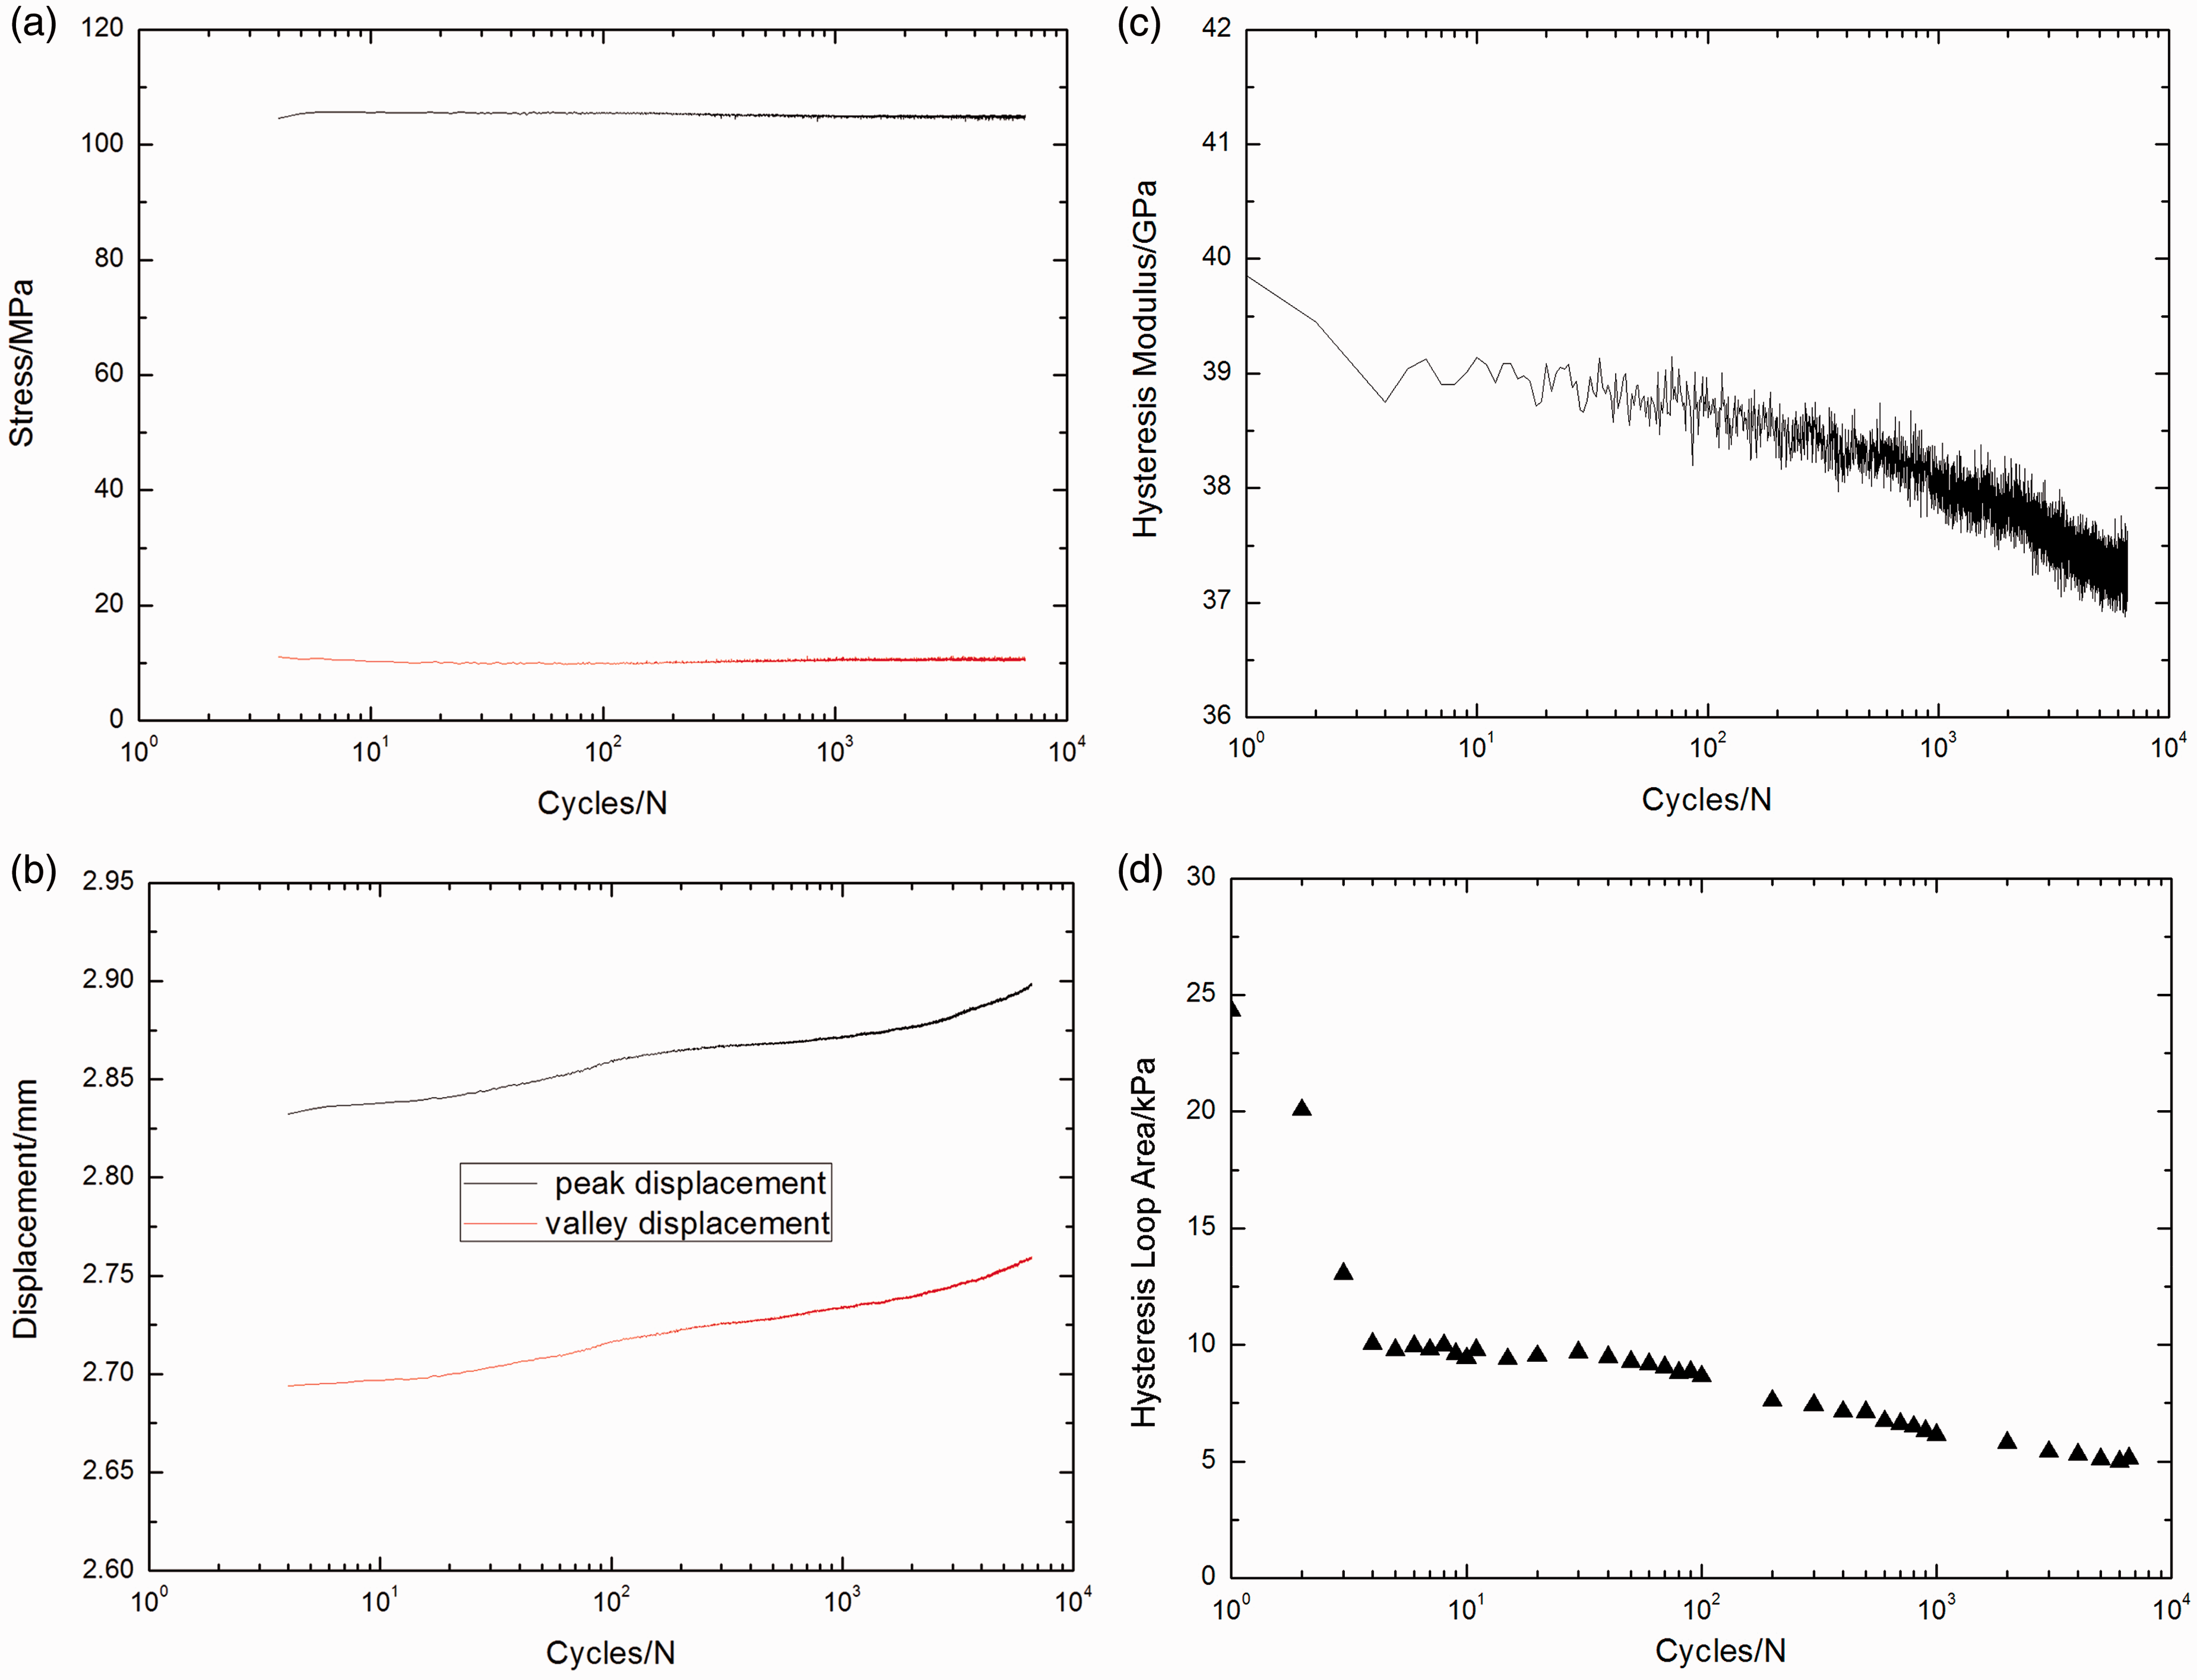
Experimental comparisons
Using the developed micromechanics fatigue hysteresis loops models, the fatigue hysteresis behavior of the C/SiC composite, that is, the fatigue hysteresis loop area versus cycle numbers, can be investigated. The effects of fatigue peak stresses, test conditions and fiber preforms on the evolution of the fatigue hysteresis loop area versus cycle number curves were analyzed. The fatigue hysteresis loops corresponding to different fatigue peak stresses, cycle numbers and test conditions have been predicted.
Unidirectional C/SiC composite
Room temperature
Under σmax = 180 MPa, the theoretical fatigue hysteresis loop area as a function of interface shear stress is as illustrated in Figure 8, in which the fatigue hysteresis loop area first increases with decreasing interface shear stress to the peak value of 39.3 kJ/m3 with τ
i
= 4.6 MPa, and decreases with decreasing interface shear stress to 0 kJ/m3 with τ
i
= 0 MPa. By comparing the experimental fatigue hysteresis loop area with theoretical computational values, the interface shear stress corresponding to different cycle numbers can be obtained, as shown in Table 1. The hysteresis loop area of the first cycle lies in the right-hand part of the theoretical fatigue hysteresis loop area versus interface shear stress curve, which corresponds to interface slip Case 2. When the interface completely debonds, the hysteresis loop of the 32,495th cycle corresponds to interface slip Case 4.
The theoretical fatigue hysteresis loop area as a function of interface shear stress of the unidirectional C/SiC composite under σmax = 180 MPa at room temperature. The interface shear stress of the unidirectional C/SiC composite corresponding to different cycle numbers under σmax = 180 MPa at room temperature

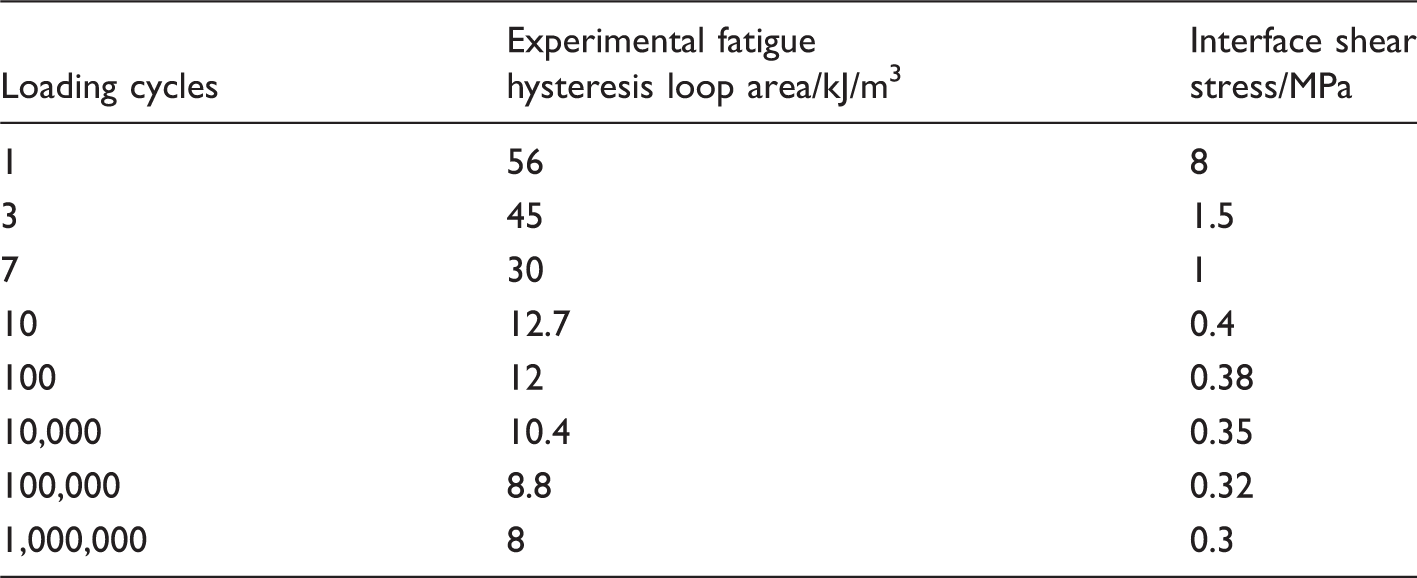
Under σmax = 240 MPa, the experimental fatigue hysteresis loops and hysteresis loop area corresponding to different cycle numbers are as illustrated in Figure 9(a). The theoretical fatigue hysteresis loop area as a function of interface shear stress is given in Figure 9(b), in which the hysteresis loop area first increases with decreasing interface shear stress to the peak value of 79.5 kJ/m3 with τ
i
= 4.7 MPa, and decreases with decreasing interface shear stress to 0 kJ/m3 with τ
i
= 0 MPa. The interface shear stress corresponding to different numbers of applied cycles can be obtained, as shown in Table 2. The hysteresis loop area of the first cycle lies in the right-hand part of the hysteresis loop area versus interface shear stress curve, which corresponds to interface slip Case 2. When the interface completely debonds, the hysteresis loop of the 100th cycle corresponds to interface slip Case 4.
(a) The experimental and predicted fatigue hysteresis loops. (b) The theoretical fatigue hysteresis loop area as a function of interface shear stress of the unidirectional C/SiC composite under σmax = 240 MPa at room temperature. The interface shear stress of unidirectional the C/SiC composite corresponding to different cycle numbers under σmax = 240 MPa at room temperature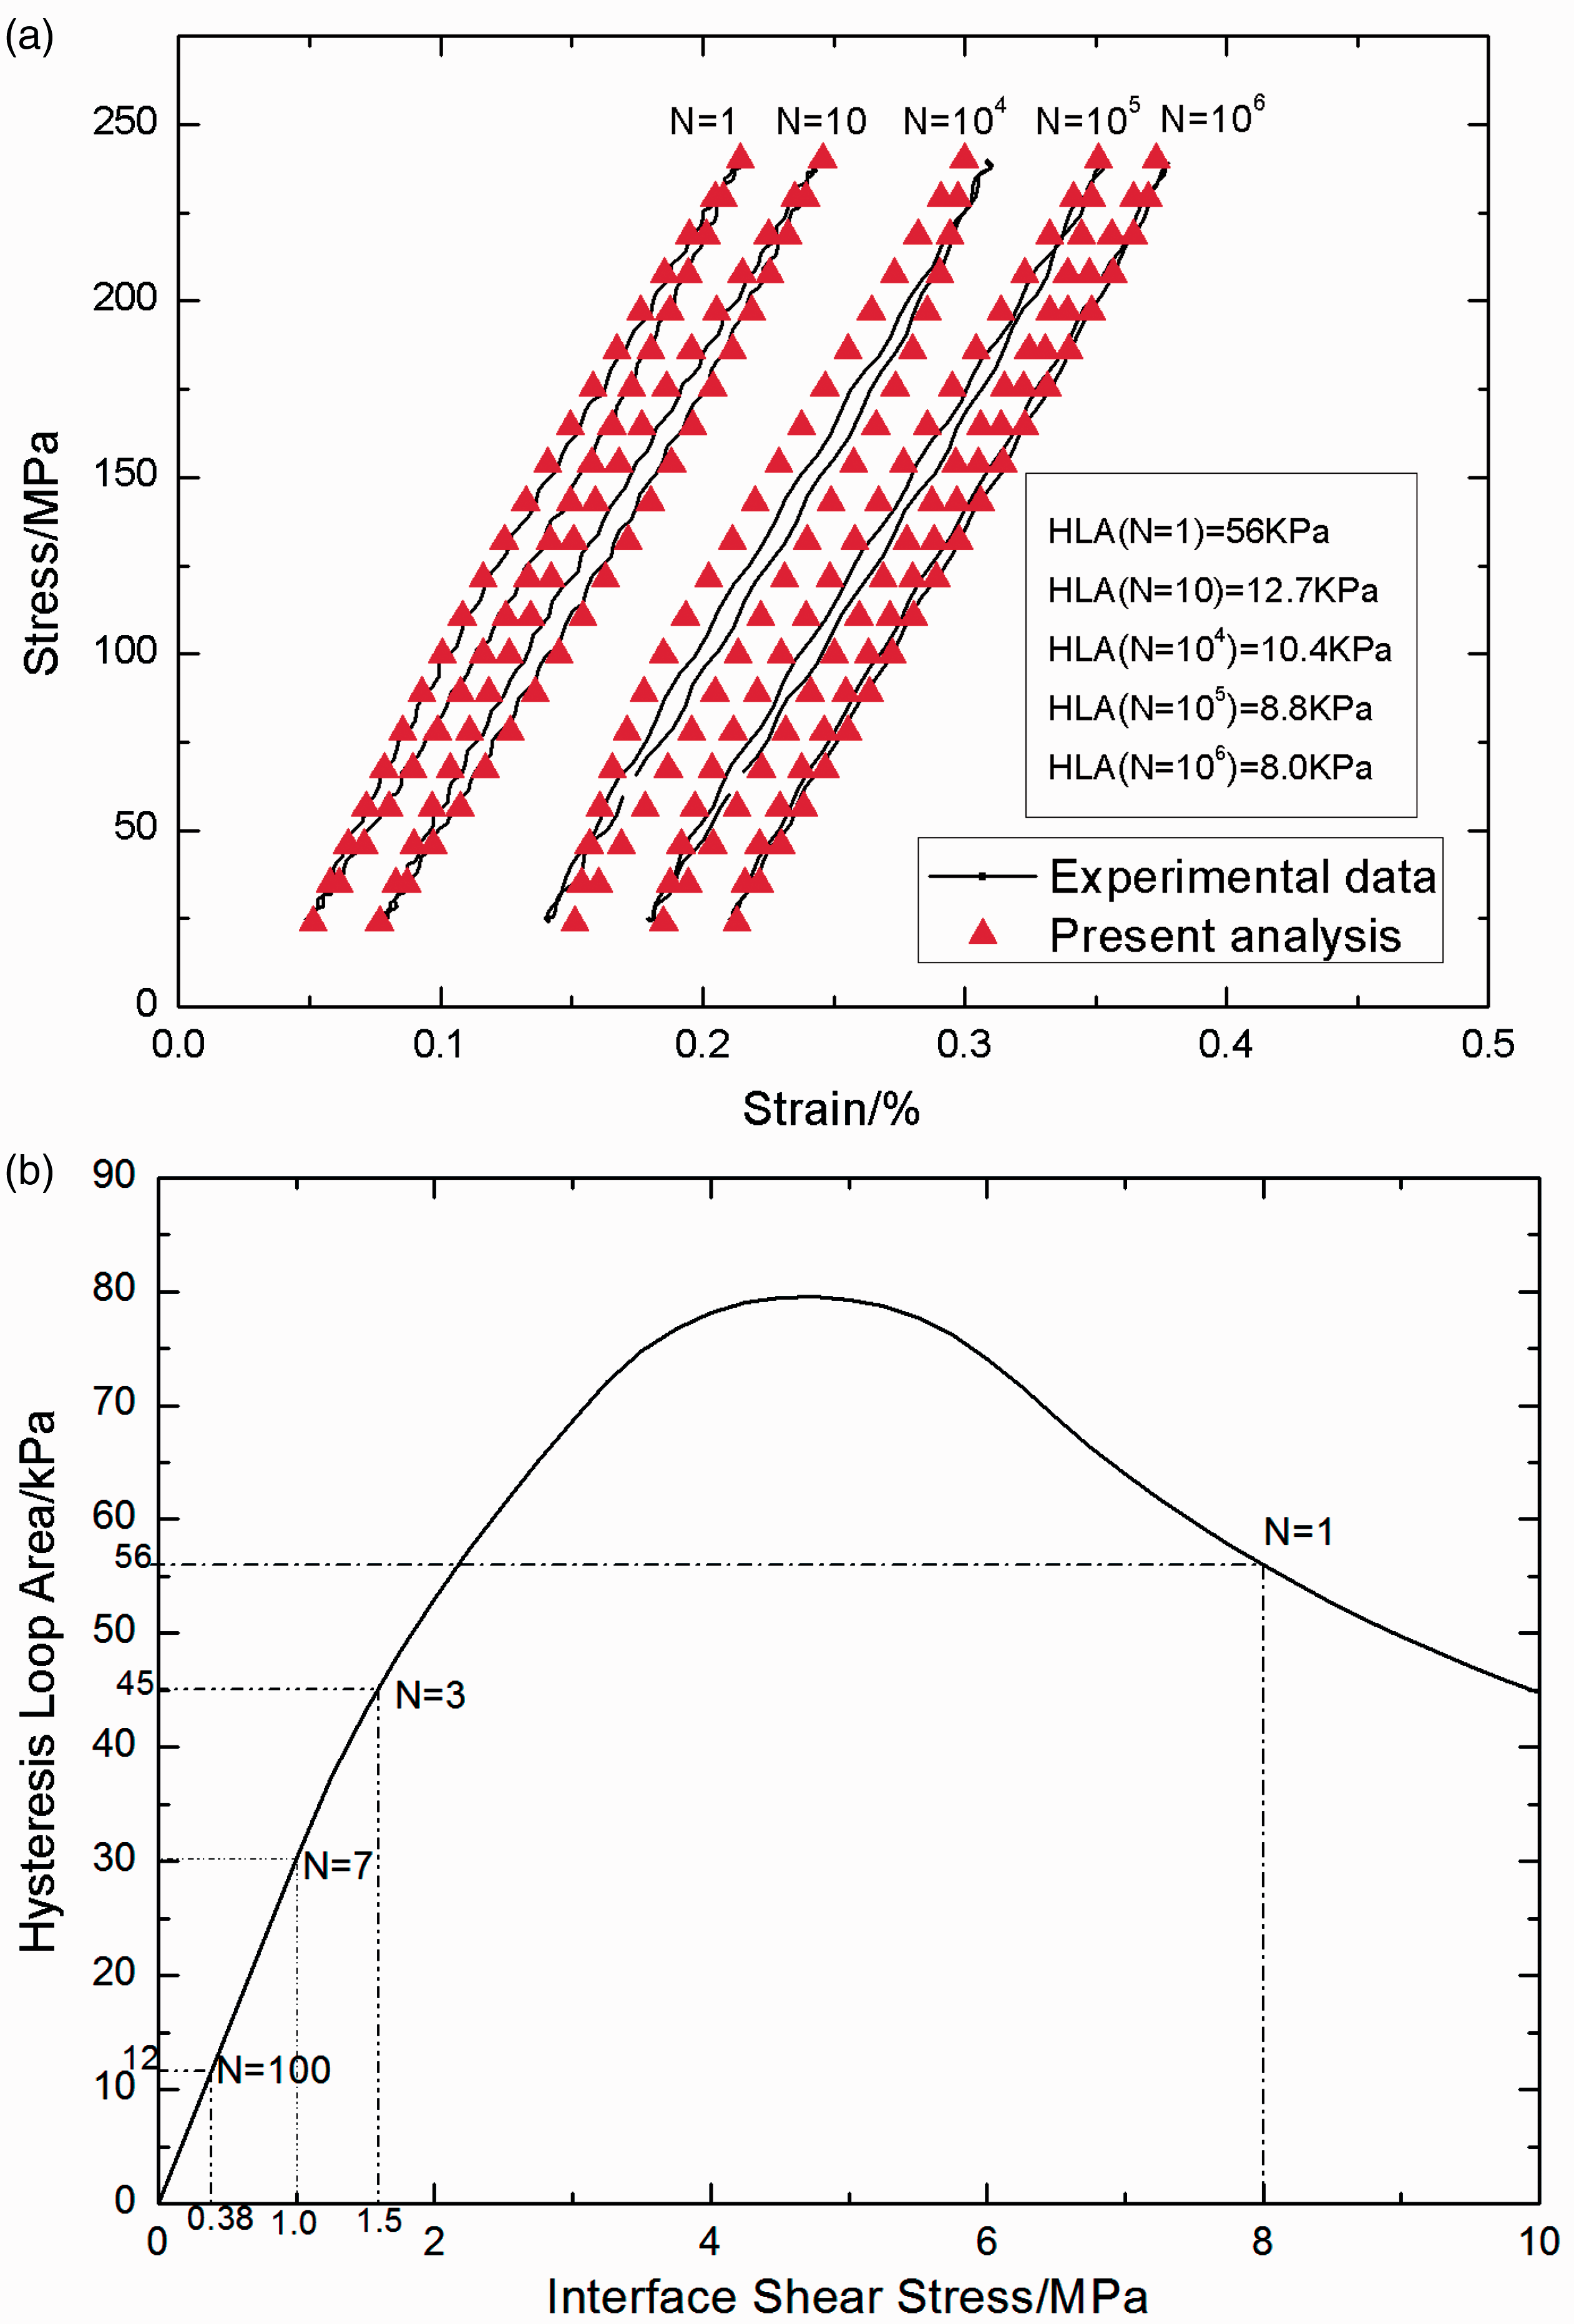
Elevated temperature
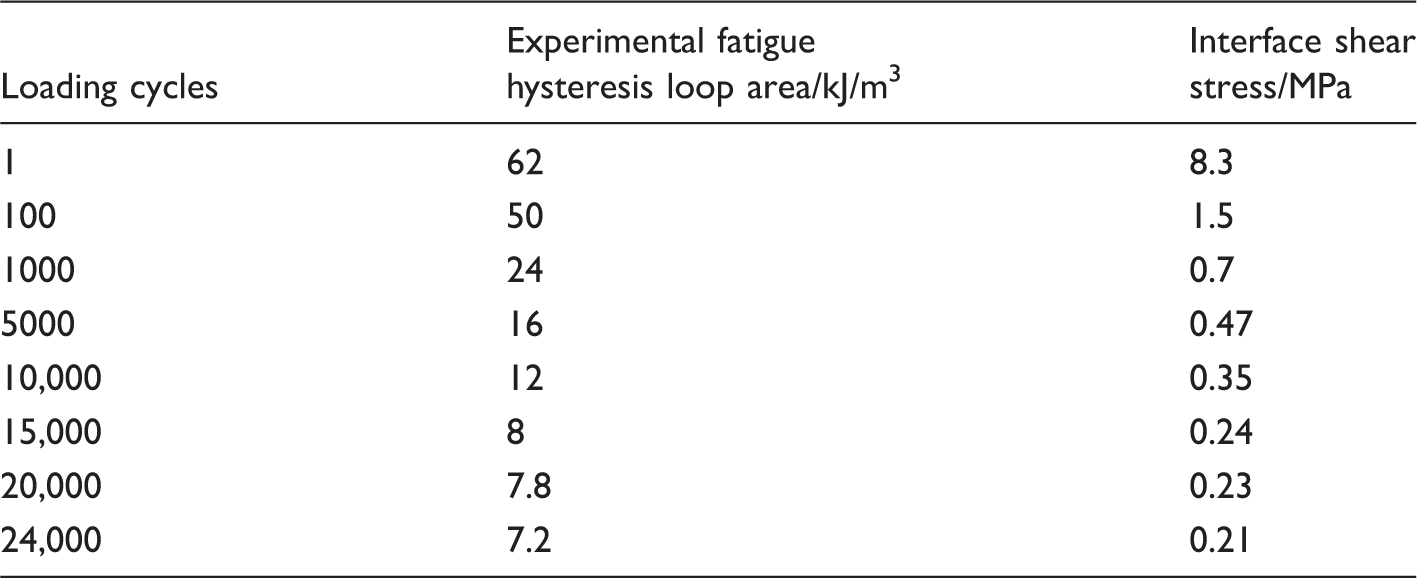
Under σmax = 250 MPa, the experimental fatigue hysteresis loops and hysteresis loop area corresponding to different applied cycles are as illustrated in Figure 10(a). The theoretical fatigue hysteresis loop area as a function of interface shear stress is given in Figure 10(b), in which the hysteresis loop area first increases with decreasing interface shear stress to the peak value of 90 kJ/m3 with τ
i
= 4.8 MPa, and decreases with decreasing interface shear stress to 0 kJ/m3 with τ
i
= 0 MPa. The interface shear stress of different numbers of applied cycles can be obtained, as shown in Table 3. The hysteresis loop area of the first cycle lies in the right-hand part of the hysteresis loop area versus interface shear stress curve, which corresponds to interface slip Case 2. When the interface completely debonds, the hysteresis loop of the 100th cycle corresponds to interface slip Case 4.
(a) The experimental and predicted fatigue hysteresis loops. (b) The theoretical fatigue hysteresis loop area as a function of interface shear stress of the unidirectional C/SiC composite under σmax = 250 MPa at 800℃ in air atmosphere. The interface shear stress of the unidirectional C/SiC composite corresponding to different cycle numbers under σmax = 250 MPa at 800℃ in air atmosphere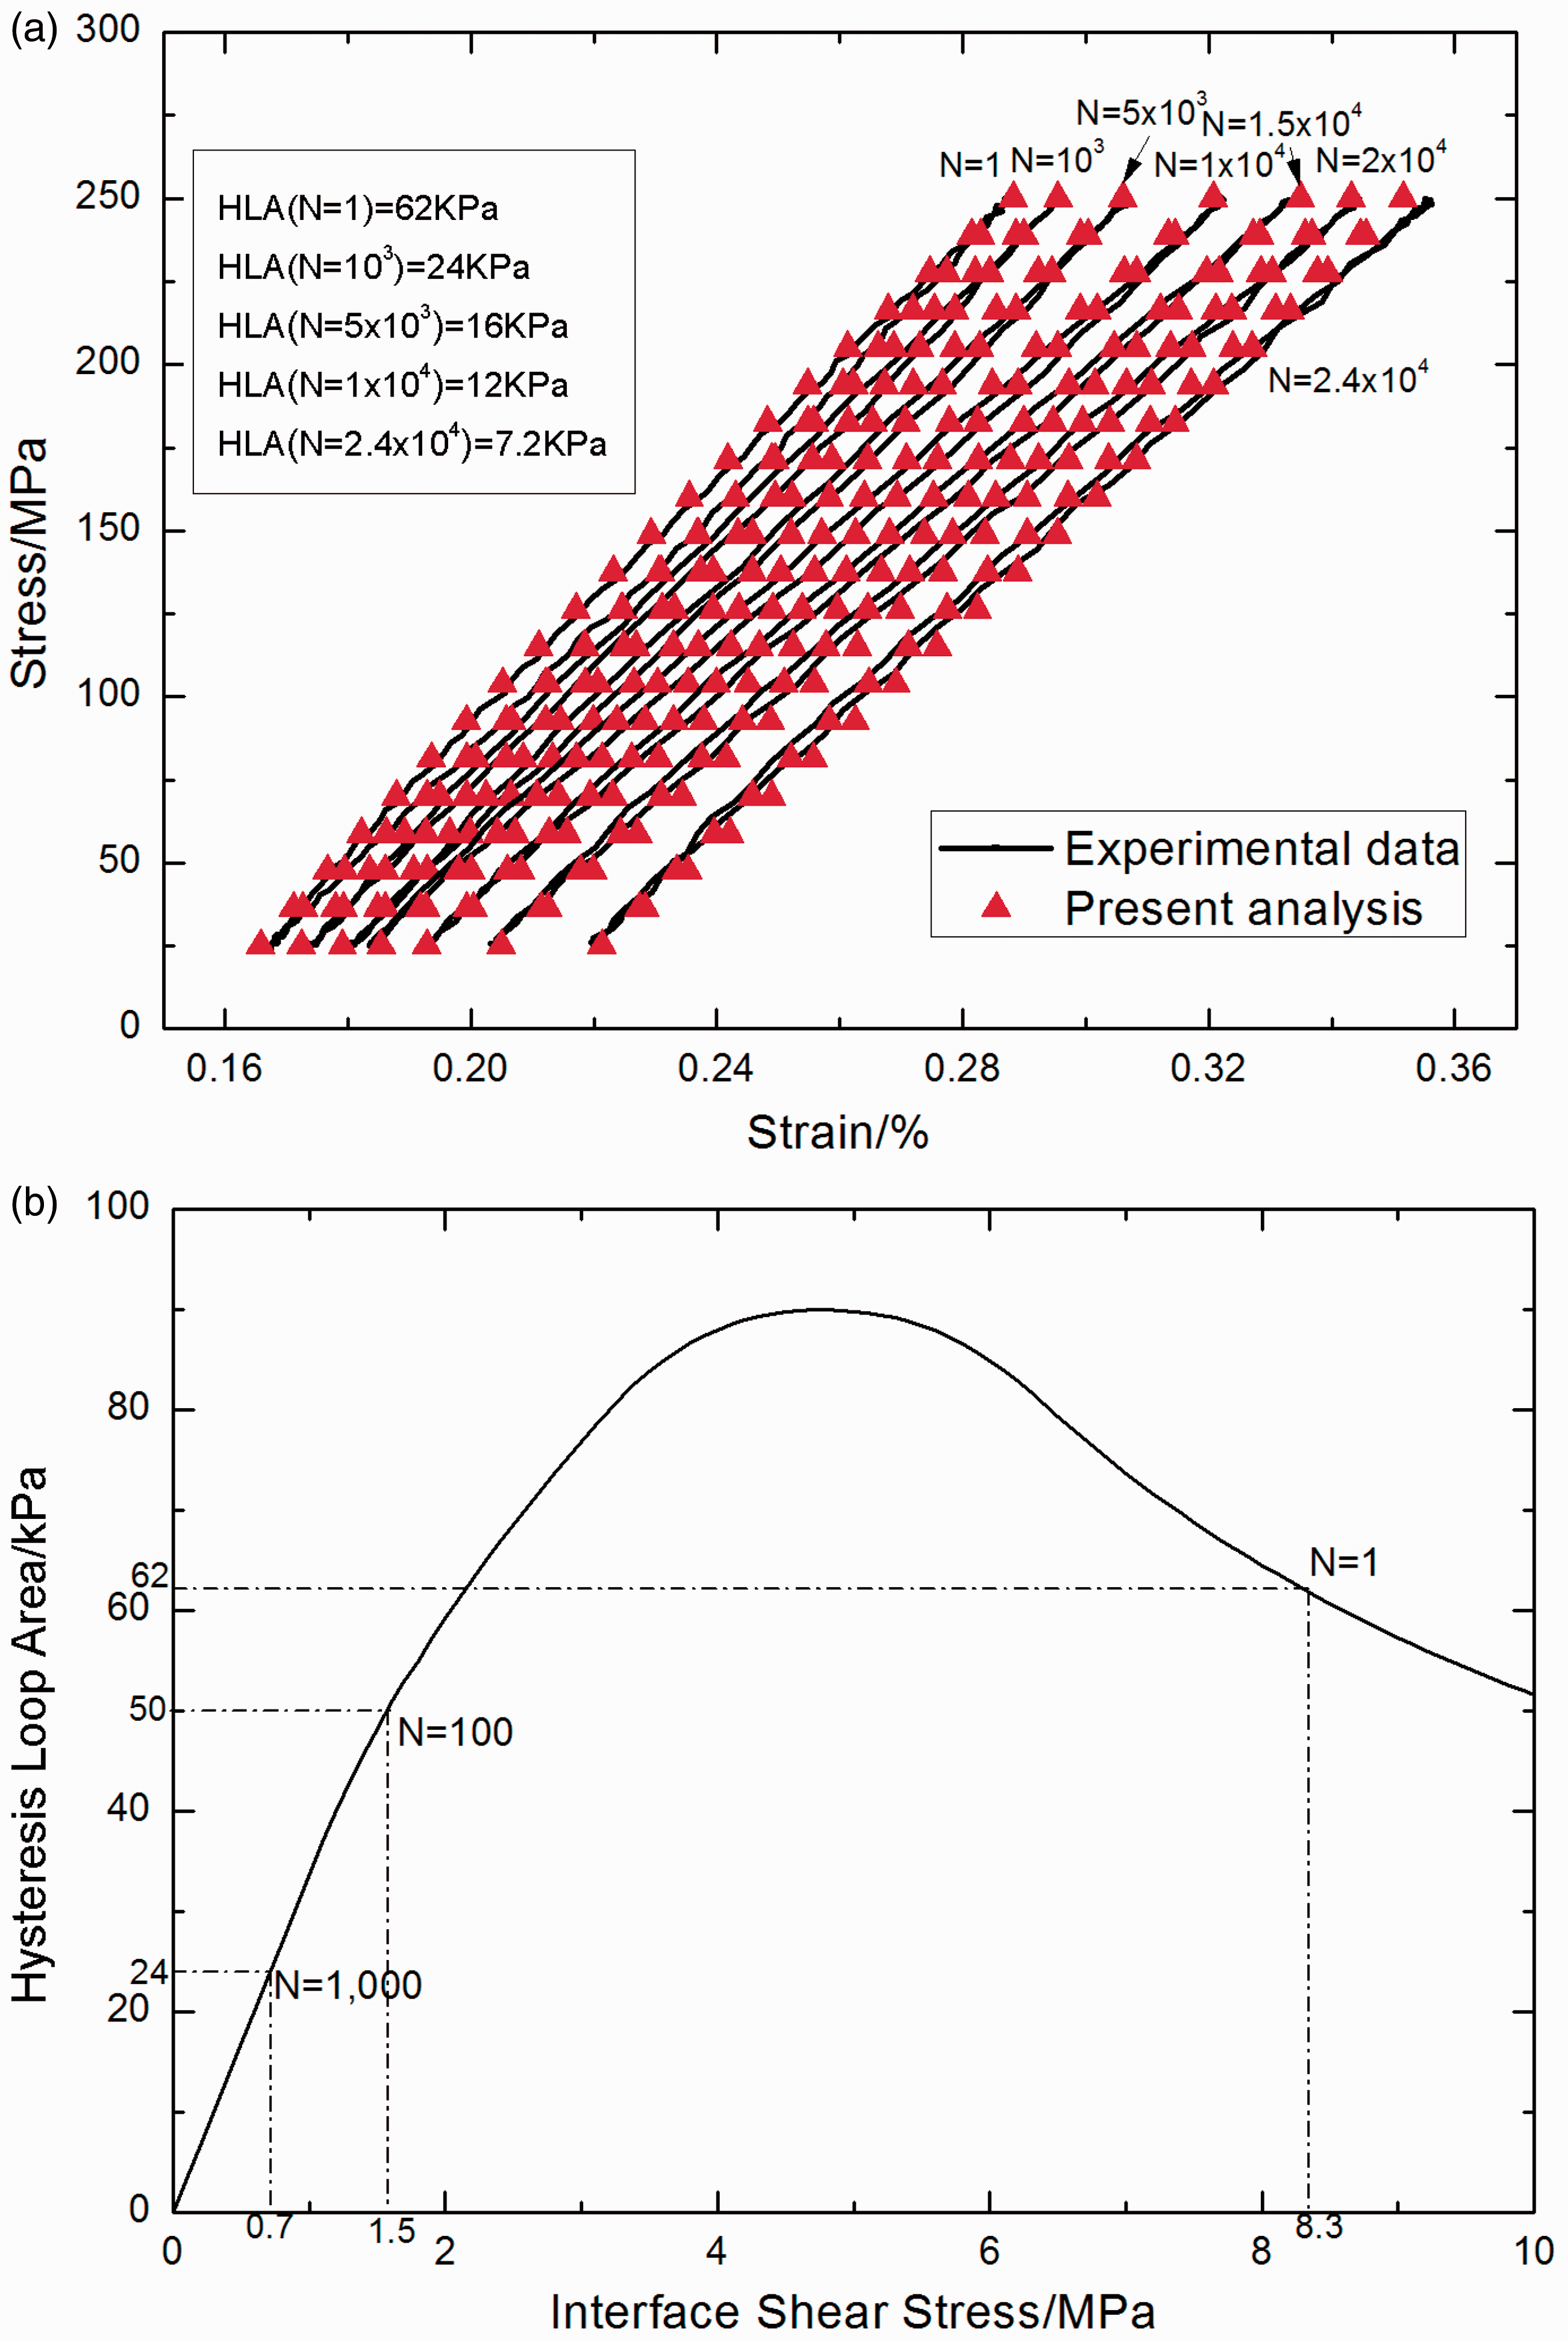
Cross-ply CMCs
Room temperature
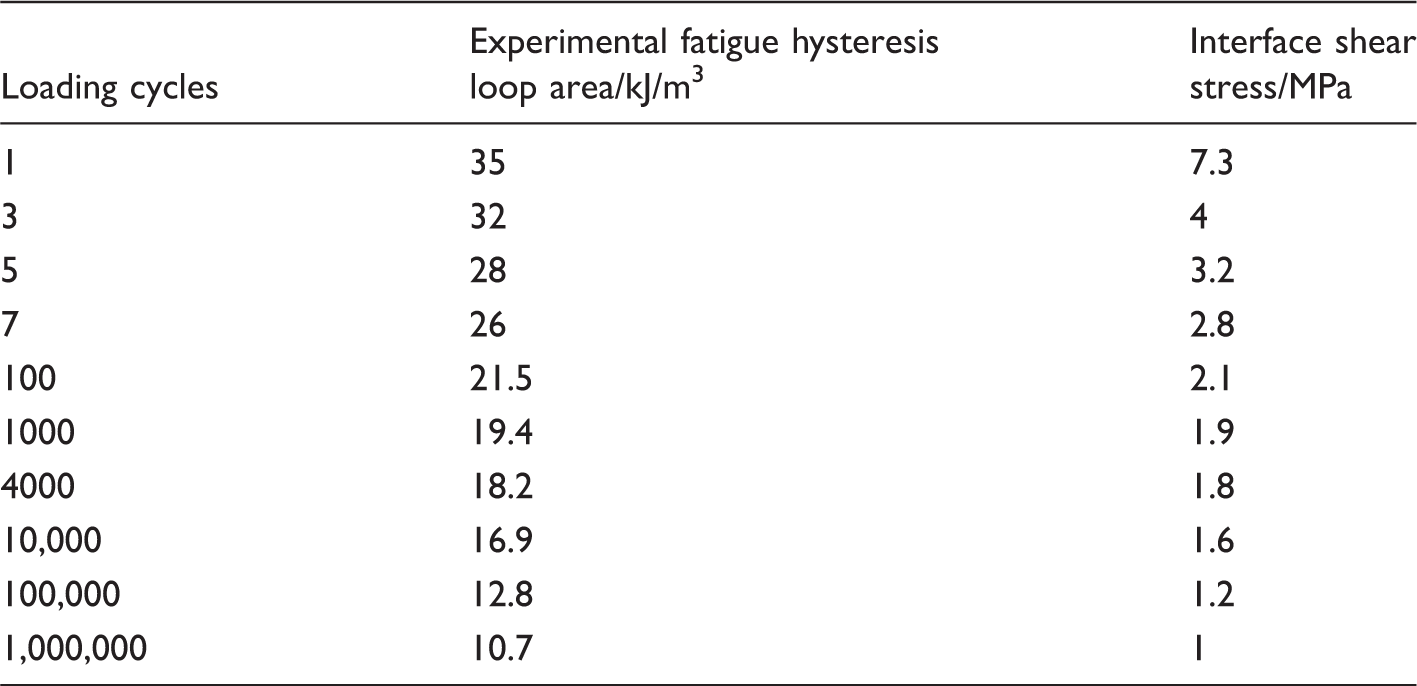
Under σmax = 105 MPa, the experimental fatigue hysteresis loops and hysteresis loop area corresponding to different applied cycles are as shown in Figure 11(a). The theoretical fatigue hysteresis loop area as a function of interface shear stress is given in Figure 11(b), in which the hysteresis loop area first increases with decreasing interface shear stress to the peak value of 36.4 kJ/m3 with τ
i
= 6.1 MPa, and decreases with decreasing interface shear stress to 0 kJ/m3 with τ
i
= 0 MPa. The interface shear stress of different numbers of applied cycles can be obtained, as shown in Table 4. The hysteresis loop area of the first cycle lies in the right-hand part of the fatigue hysteresis loop area versus interface shear stress curve, which corresponds to interface slip Case 2. When the interface completely debonds, the hysteresis loop of the 100th cycle corresponds to interface slip Case 4.
(a) The experimental and predicted fatigue hysteresis loops. (b) The theoretical fatigue hysteresis loop area as a function of interface shear stress in the 0° plies of the cross-ply C/SiC composite under σmax = 105 MPa at room temperature. The interface shear stress in the 0° plies of the cross-ply C/SiC composite corresponding to different cycle numbers under σmax = 105 MPa at room temperature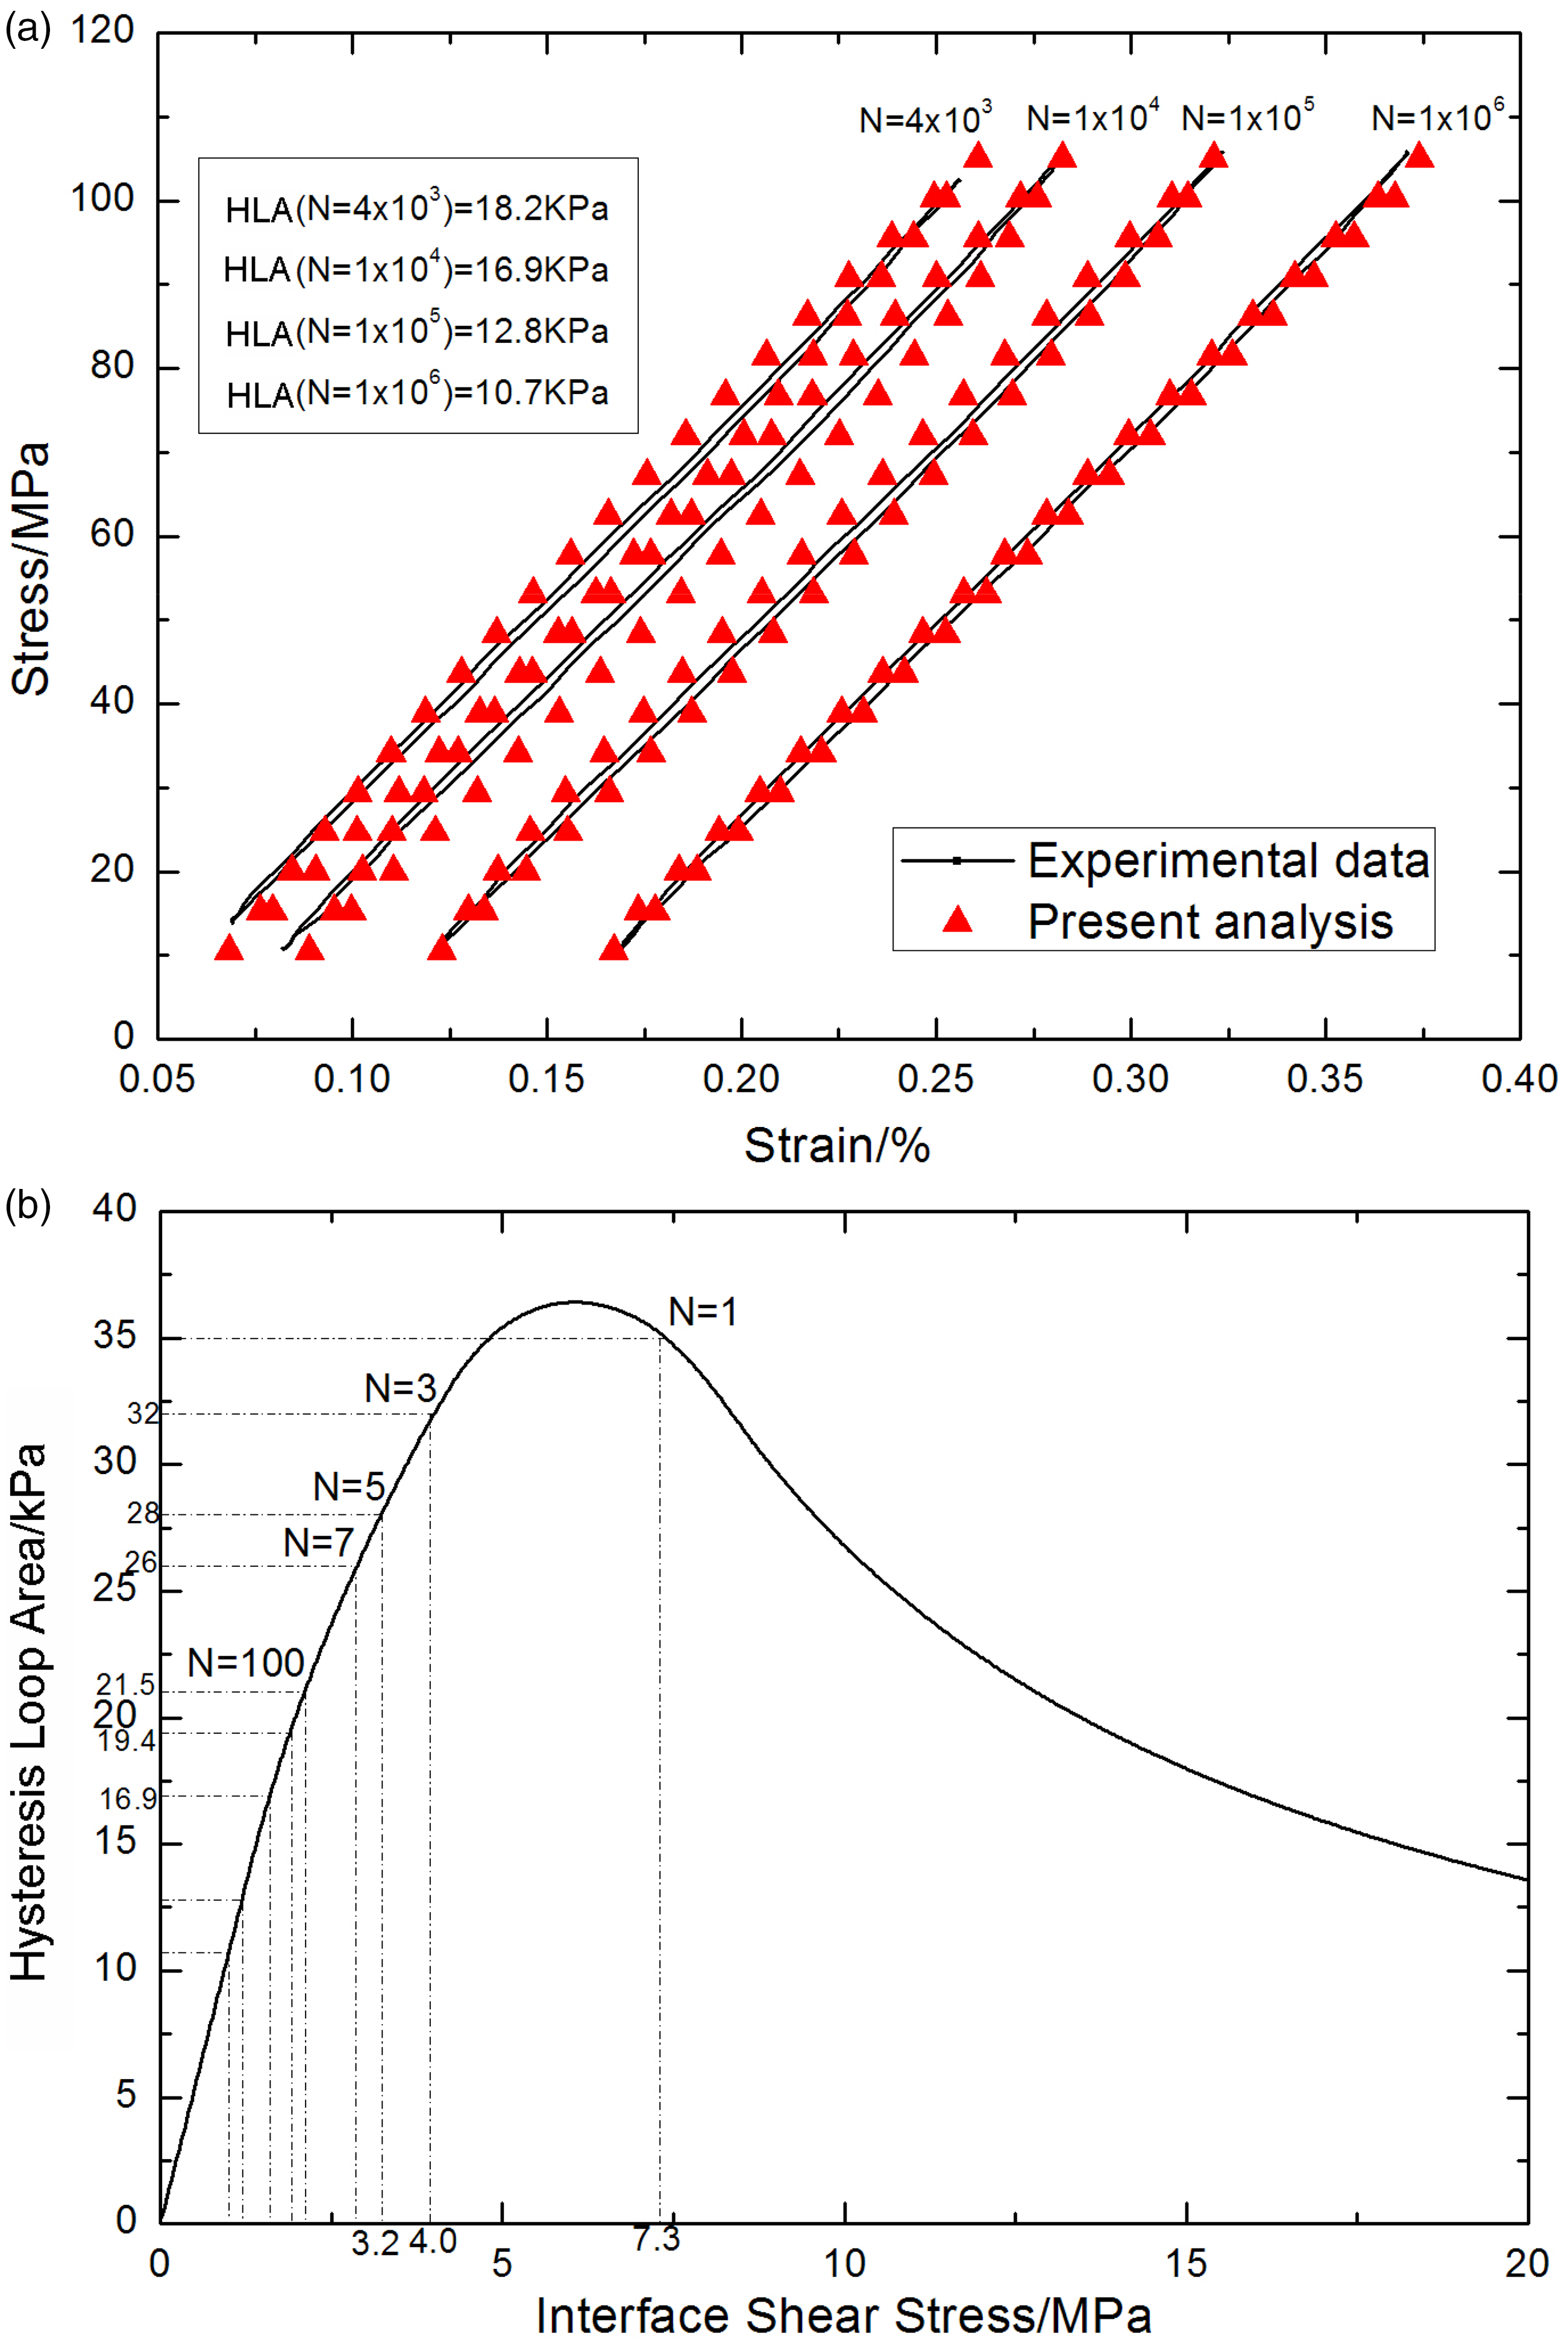
Elevated temperature
Under σmax = 105 MPa at 800℃ in air, the fatigue hysteresis loops and hysteresis loop area corresponding to different applied cycles are as illustrated in Figure 12(a). The theoretical fatigue hysteresis loop area as a function of interface shear stress is illustrated in Figure 12(b), in which the hysteresis loop area first increases with decreasing interface shear stress to the peak value of 25.6 kJ/m3 with τ
i
= 4.4 MPa, and decreases with decreasing interface shear stress to 0 kJ/m3 with τ
i
= 0 MPa. The interface shear stress of different numbers of applied cycles can be obtained, as shown in Table 5. The hysteresis loop area of the first cycle lies in the right-hand part of the fatigue hysteresis loop area versus interface shear stress curve, which corresponds to interface slip Case 2. When the interface completely debonds, the hysteresis loop of the 100th cycle corresponds to interface slip Case 4.
(a) The experimental and predicted fatigue hysteresis loops. (b) The theoretical fatigue hysteresis loop area as a function of interface shear stress in the 0° plies of the cross-ply C/SiC composite under σmax = 105 MPa at 800℃ in air atmosphere. The interface shear stress in the 0° plies of the cross-ply C/SiC composite corresponding to different cycle numbers under σmax = 105 MPa at 800℃ in air atmosphere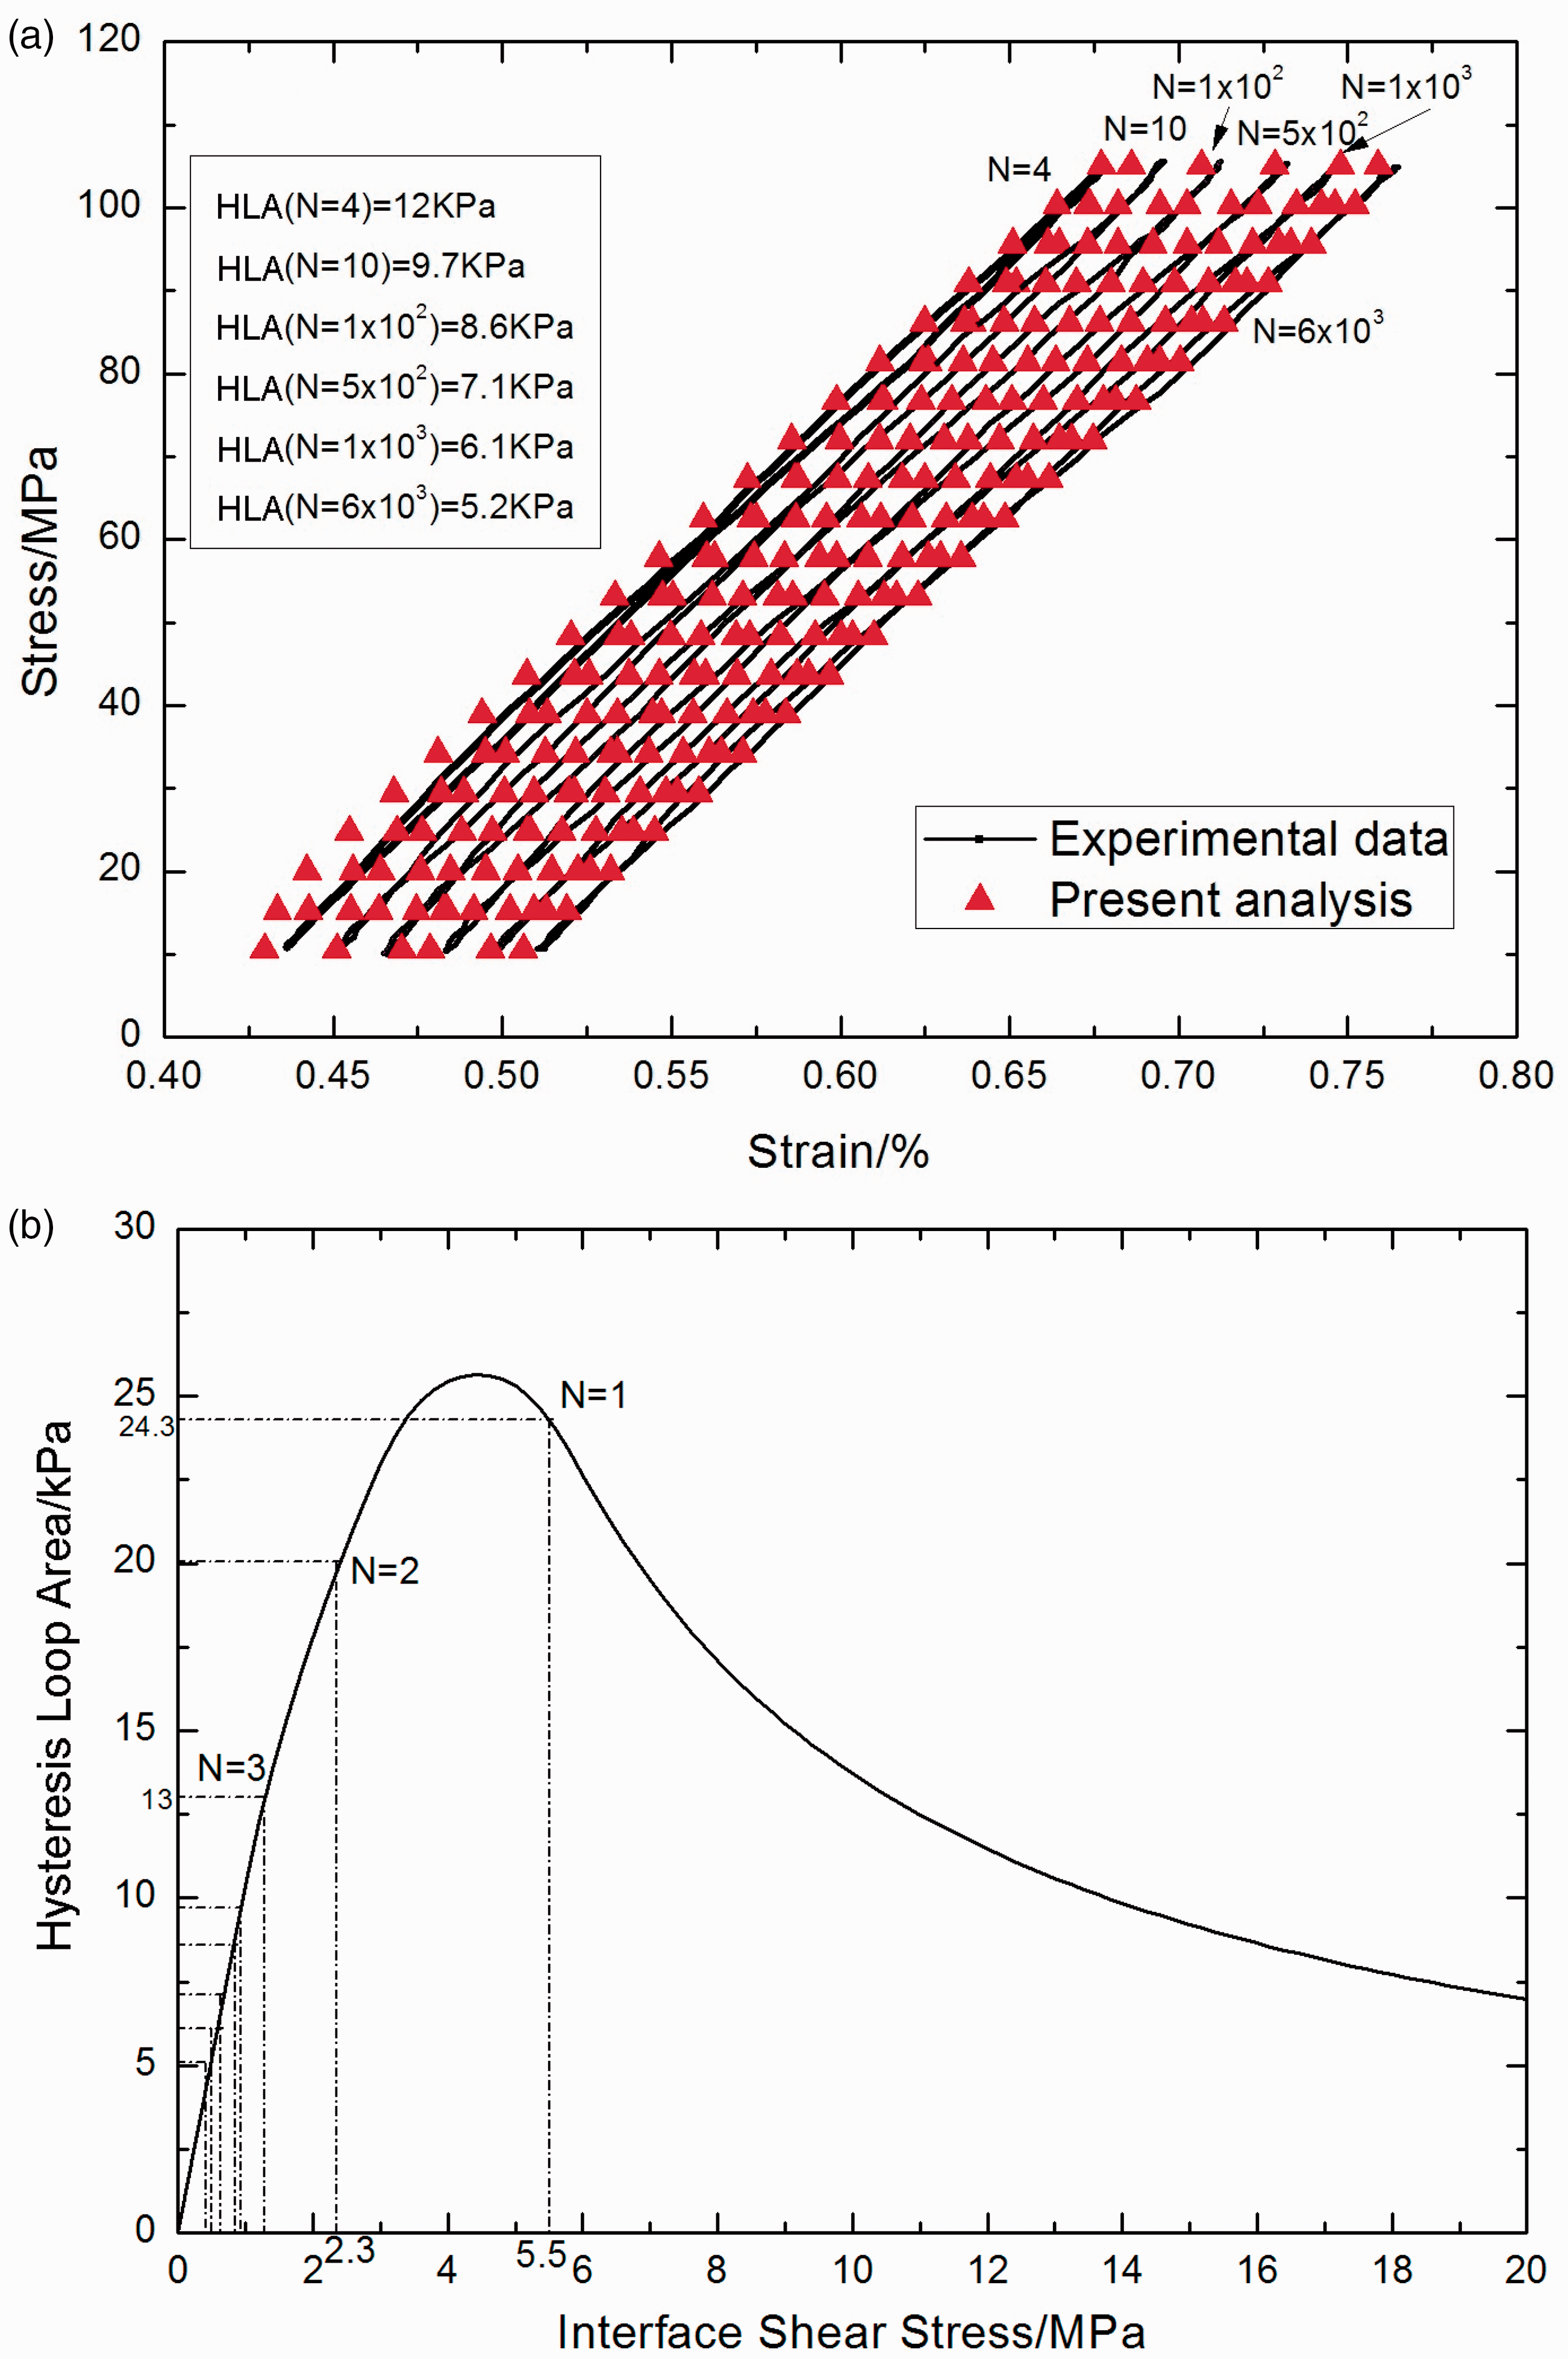

2.5D woven CMCs
Room temperature
Yang
7
investigated the tension–tension fatigue behavior of the 2.5D C/SiC composite at room temperature. Under σmax = 180 MPa, the experimental fatigue hysteresis loops and hysteresis loop area corresponding to different applied cycles are as illustrated in Figure 13(a). The theoretical fatigue hysteresis loop area as a function of interface shear stress is illustrated in Figure 13(b), in which the hysteresis loop area first increases with decreasing interface shear stress to the peak value of 35.8 kJ/m3 with τ
i
= 2.4 MPa, and decreases with decreasing interface shear stress to 0 kJ/m3 with τ
i
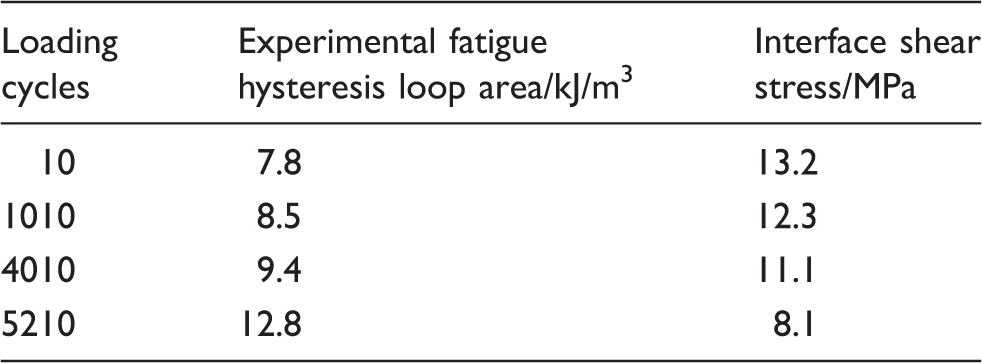
= 0 MPa. The interface shear stress corresponding to different numbers of applied cycles can be obtained, as shown in Table 6. The hysteresis loops from the first cycle to the 5210th cycle all correspond to interface slip Case 2.
(a) The experimental and predicted fatigue hysteresis loops. (b) The theoretical fatigue hysteresis loop area as a function of interface shear stress in the longitudinal yarns of the 2.5D C/SiC composite under σmax = 180 MPa at room temperature. The interface shear stress in the longitudinal yarns of the 2.5D C/SiC composite corresponding to different cycle numbers under σmax = 180 MPa at room temperature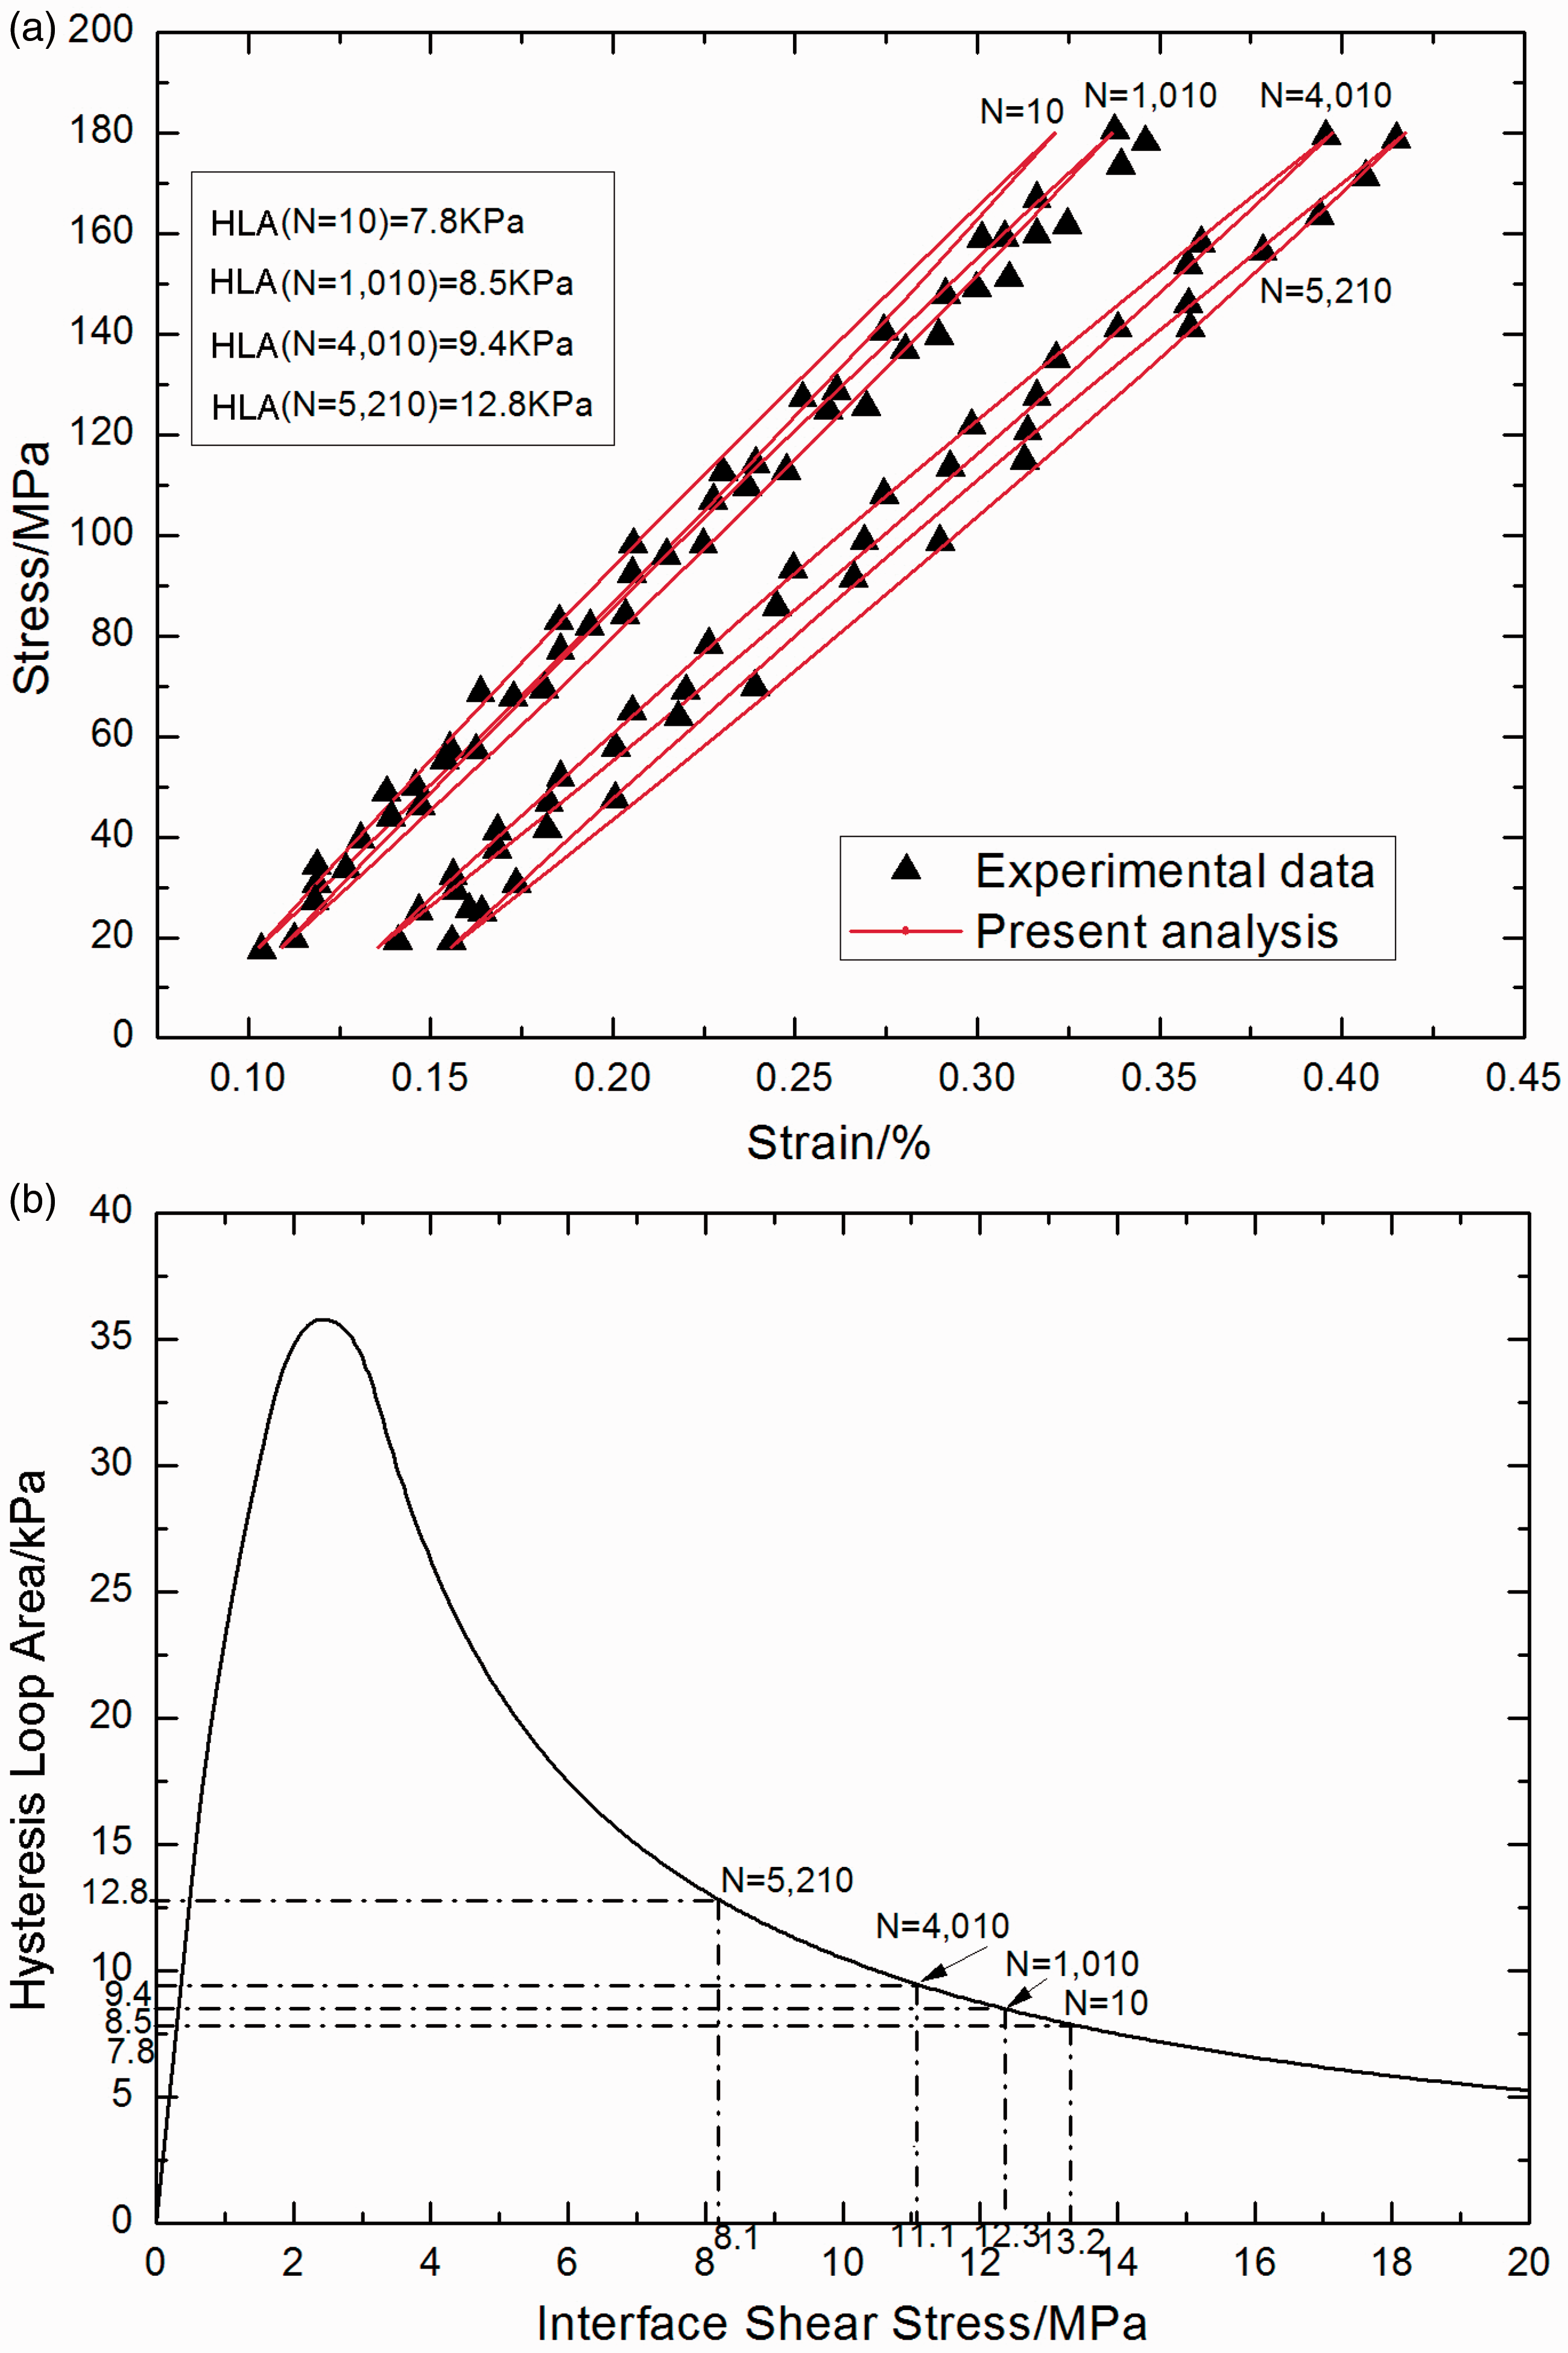
Elevated temperature
Yang
7
investigated the tension–tension fatigue behavior of the 2.5D C/SiC composite at 800℃ in air. Under σmax = 140 MPa, the fatigue hysteresis loops and hysteresis loop area corresponding to different applied cycles are as illustrated in Figure 14(a). The theoretical fatigue hysteresis loop area as a function of interface shear stress is shown in Figure 14(b), in which the fatigue hysteresis loop area first increases with decreasing interface shear stress to the peak value of 21.7 kJ/m3 with τ
i
= 2.25 MPa, and decreases with decreasing interface shear stress to 0 kJ/m3 with τ
i
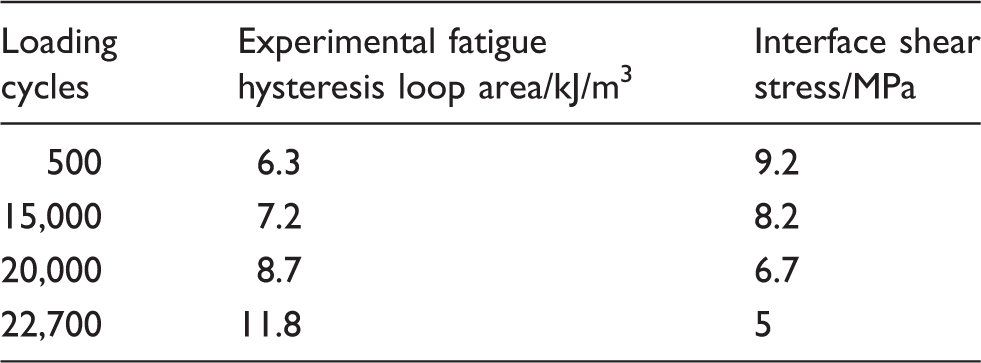
=0 MPa. The interface shear stress of different numbers of applied cycles can be obtained, as shown in Table 7. The fatigue hysteresis loops from the 500th cycle to the 22,700th cycle all correspond to interface slip Case 2.
(a) The experimental and predicted fatigue hysteresis loops. (b) The theoretical fatigue hysteresis loop area as a function of interface shear stress in the longitudinal yarns of the 2.5D C/SiC composite under σmax = 140 MPa at 800℃ in air atmosphere. The interface shear stress in the longitudinal yarns of the 2.5D C/SiC composite corresponding to different cycle numbers under σmax = 140 MPa at 800℃ in air atmosphere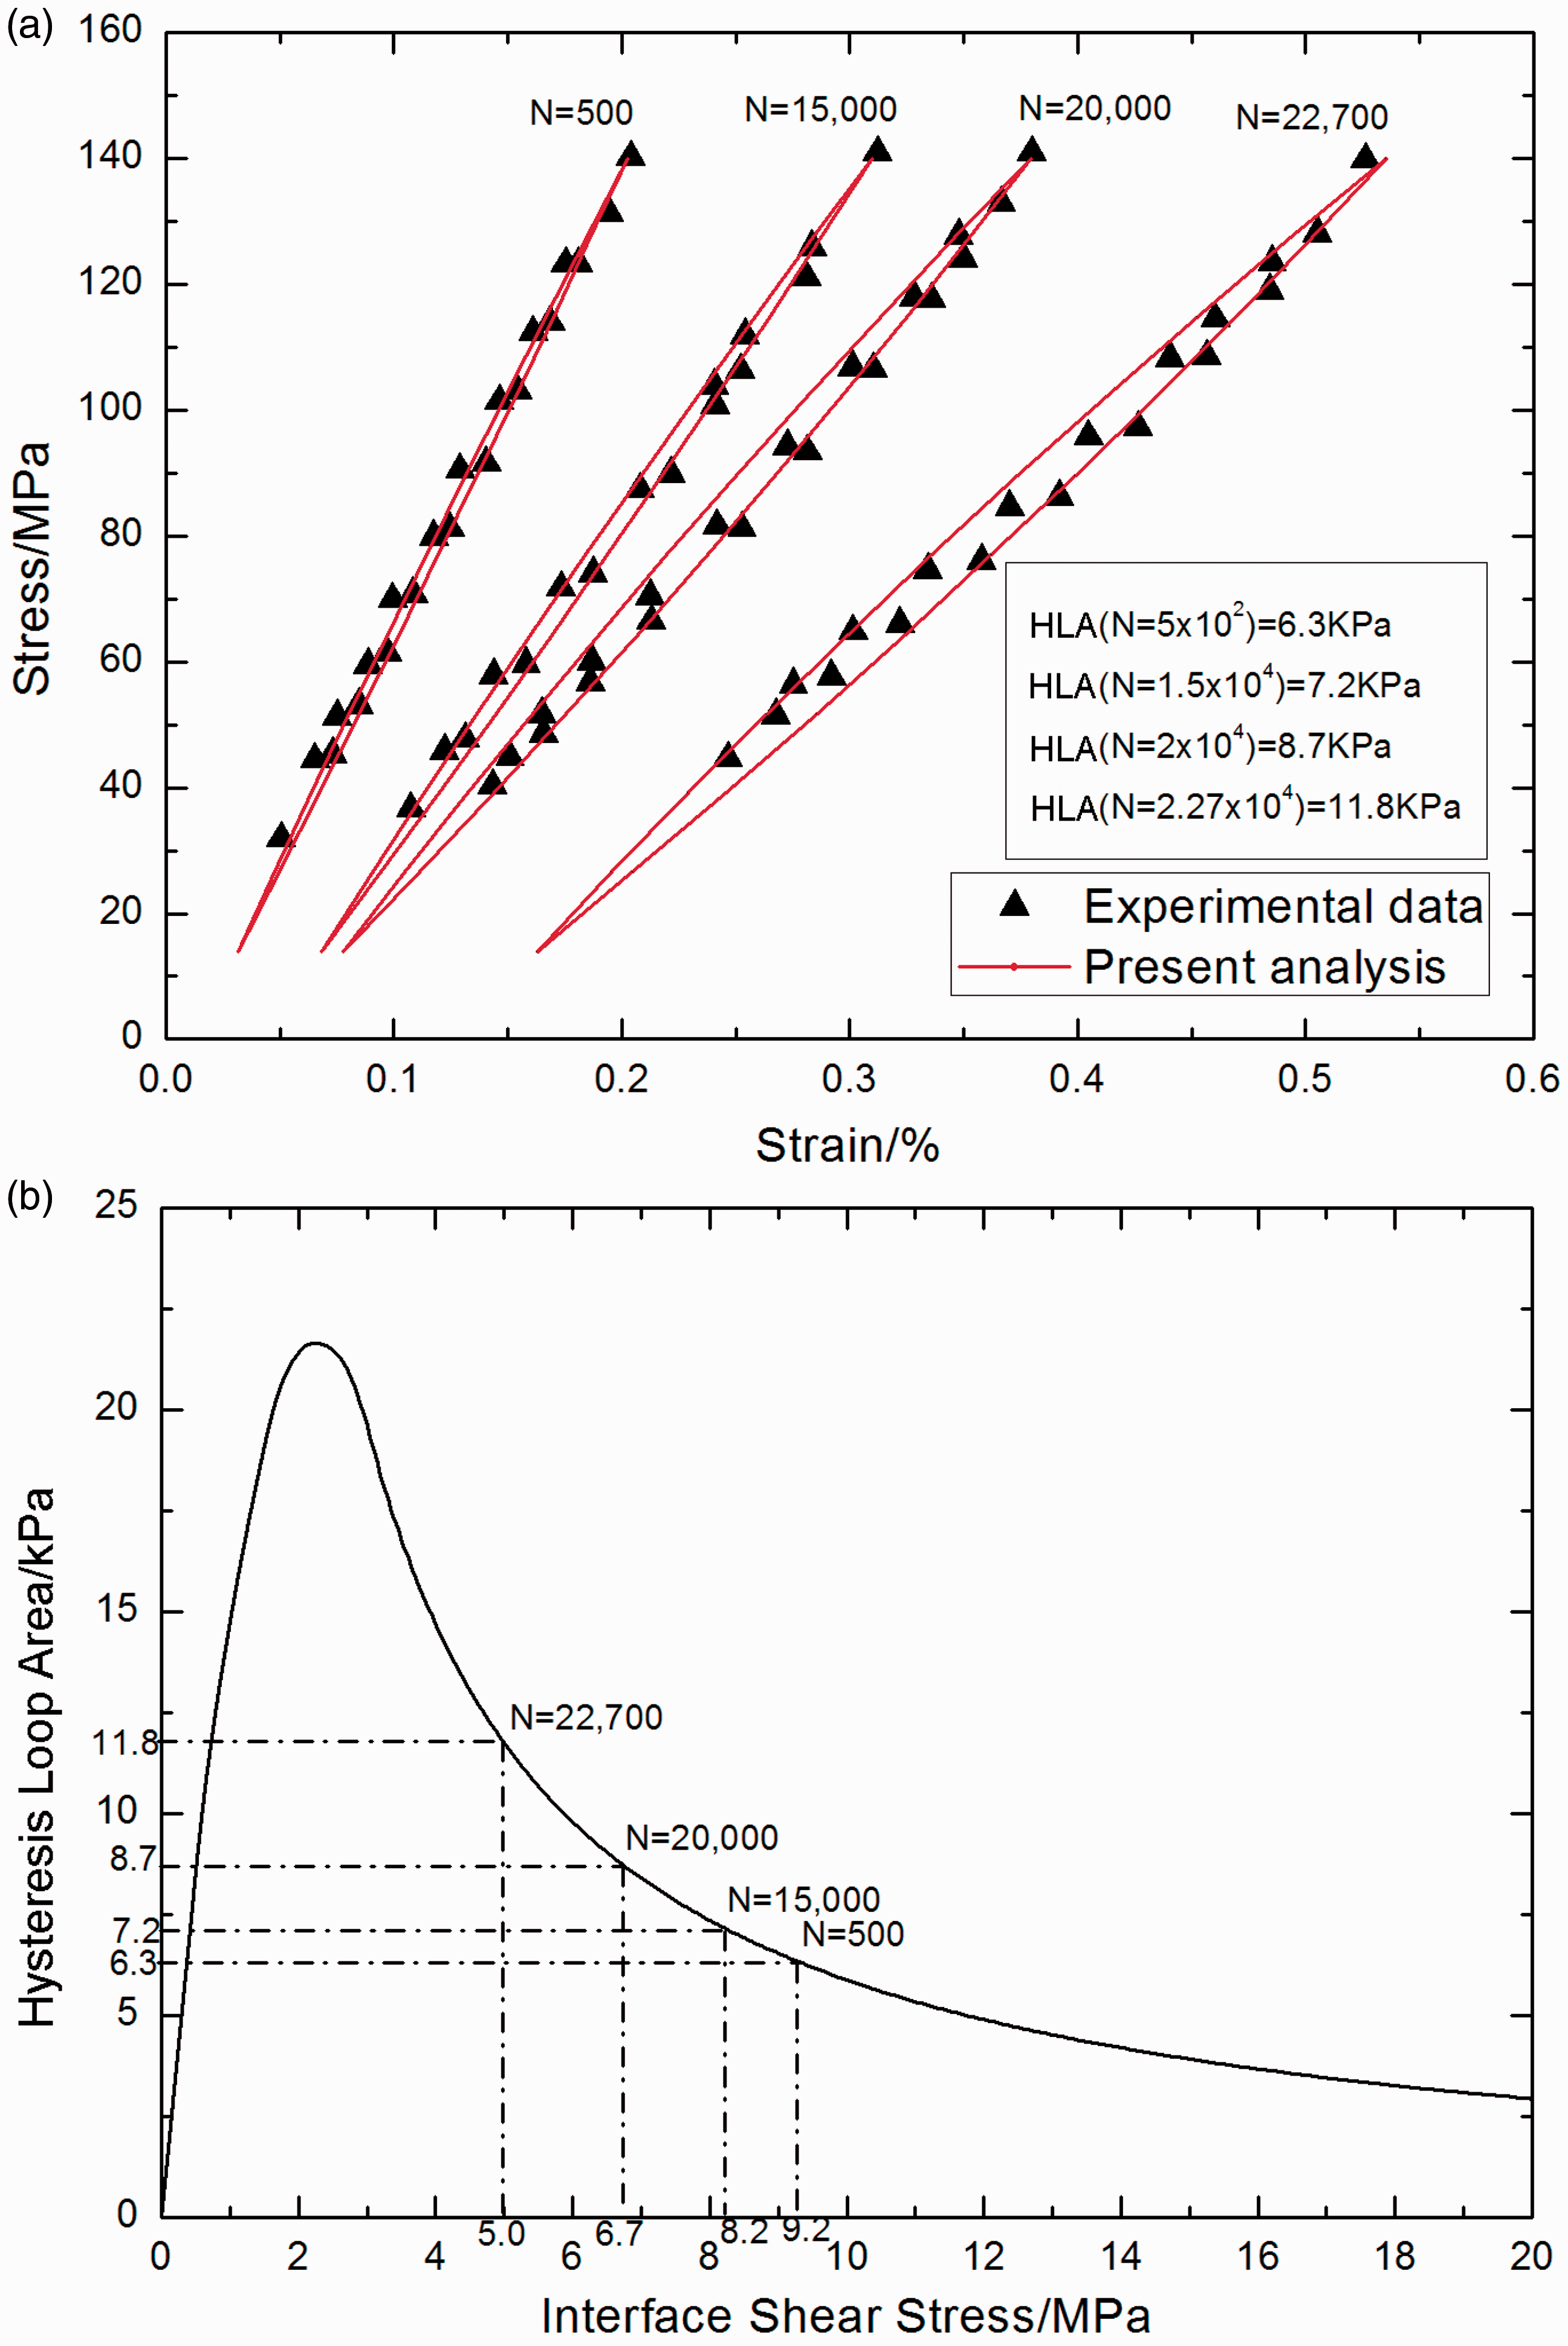
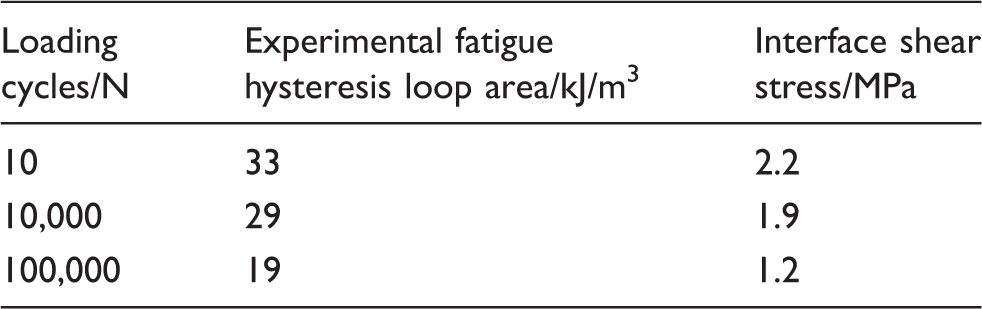
Dalmaz et al.
6
investigated the tension–tension fatigue behavior of the 2.5D C/SiC composite at 600℃ in inert atmosphere. The fatigue peak and valley stress were 230 and 0 MPa, respectively. The experimental fatigue hysteresis loops and hysteresis loop area corresponding to different applied cycles are illustrated in Figure 15(a). The theoretical fatigue hysteresis loop area versus interface shear stress curve is shown in Figure 15(b). As the axial thermal expansion coefficient of carbon fiber is lower than that of the SiC matrix, that is, 1 × 10⁻⁶/℃ versus 4.8 × 10⁻⁶/℃, the axial thermal residual tensile stress exists in the matrix, leading to microcracks in the SiC matrix upon cooling down from high fabricated temperature to room temperature. The radial thermal expansion coefficient of carbon fiber is higher than that of the SiC matrix, that is, 7 × 10⁻⁶/℃ versus 4.8 × 10⁻⁶/℃, the radial thermal residual tensile stress exists in the fiber/matrix interface, leading to interface debonding upon cooling down from high fabrication temperature to room temperature. The interface shear stress corresponding to different numbers of applied cycles can be obtained, as shown in Table 8. The fatigue hysteresis loop area decreases with increasing cycle numbers, corresponding to the left-hand part of the fatigue hysteresis loop area versus the interface shear stress curve. The fatigue hysteresis loops all correspond to interface slip Case 4.
(a) The fatigue hysteresis loops of different cycle number. (b) The fatigue hysteresis loop area versus the interface shear stress in the longitudinal yarns of the 2.5D C/SiC composite under fatigue peak stress of σmax = 230 MPa at 600℃ in an inert atmosphere. The interface shear stress in the longitudinal yarns of the 2.5D C/SiC composite corresponding to different cycle numbers under σmax = 230 MPa at 600℃ in an inert atmosphere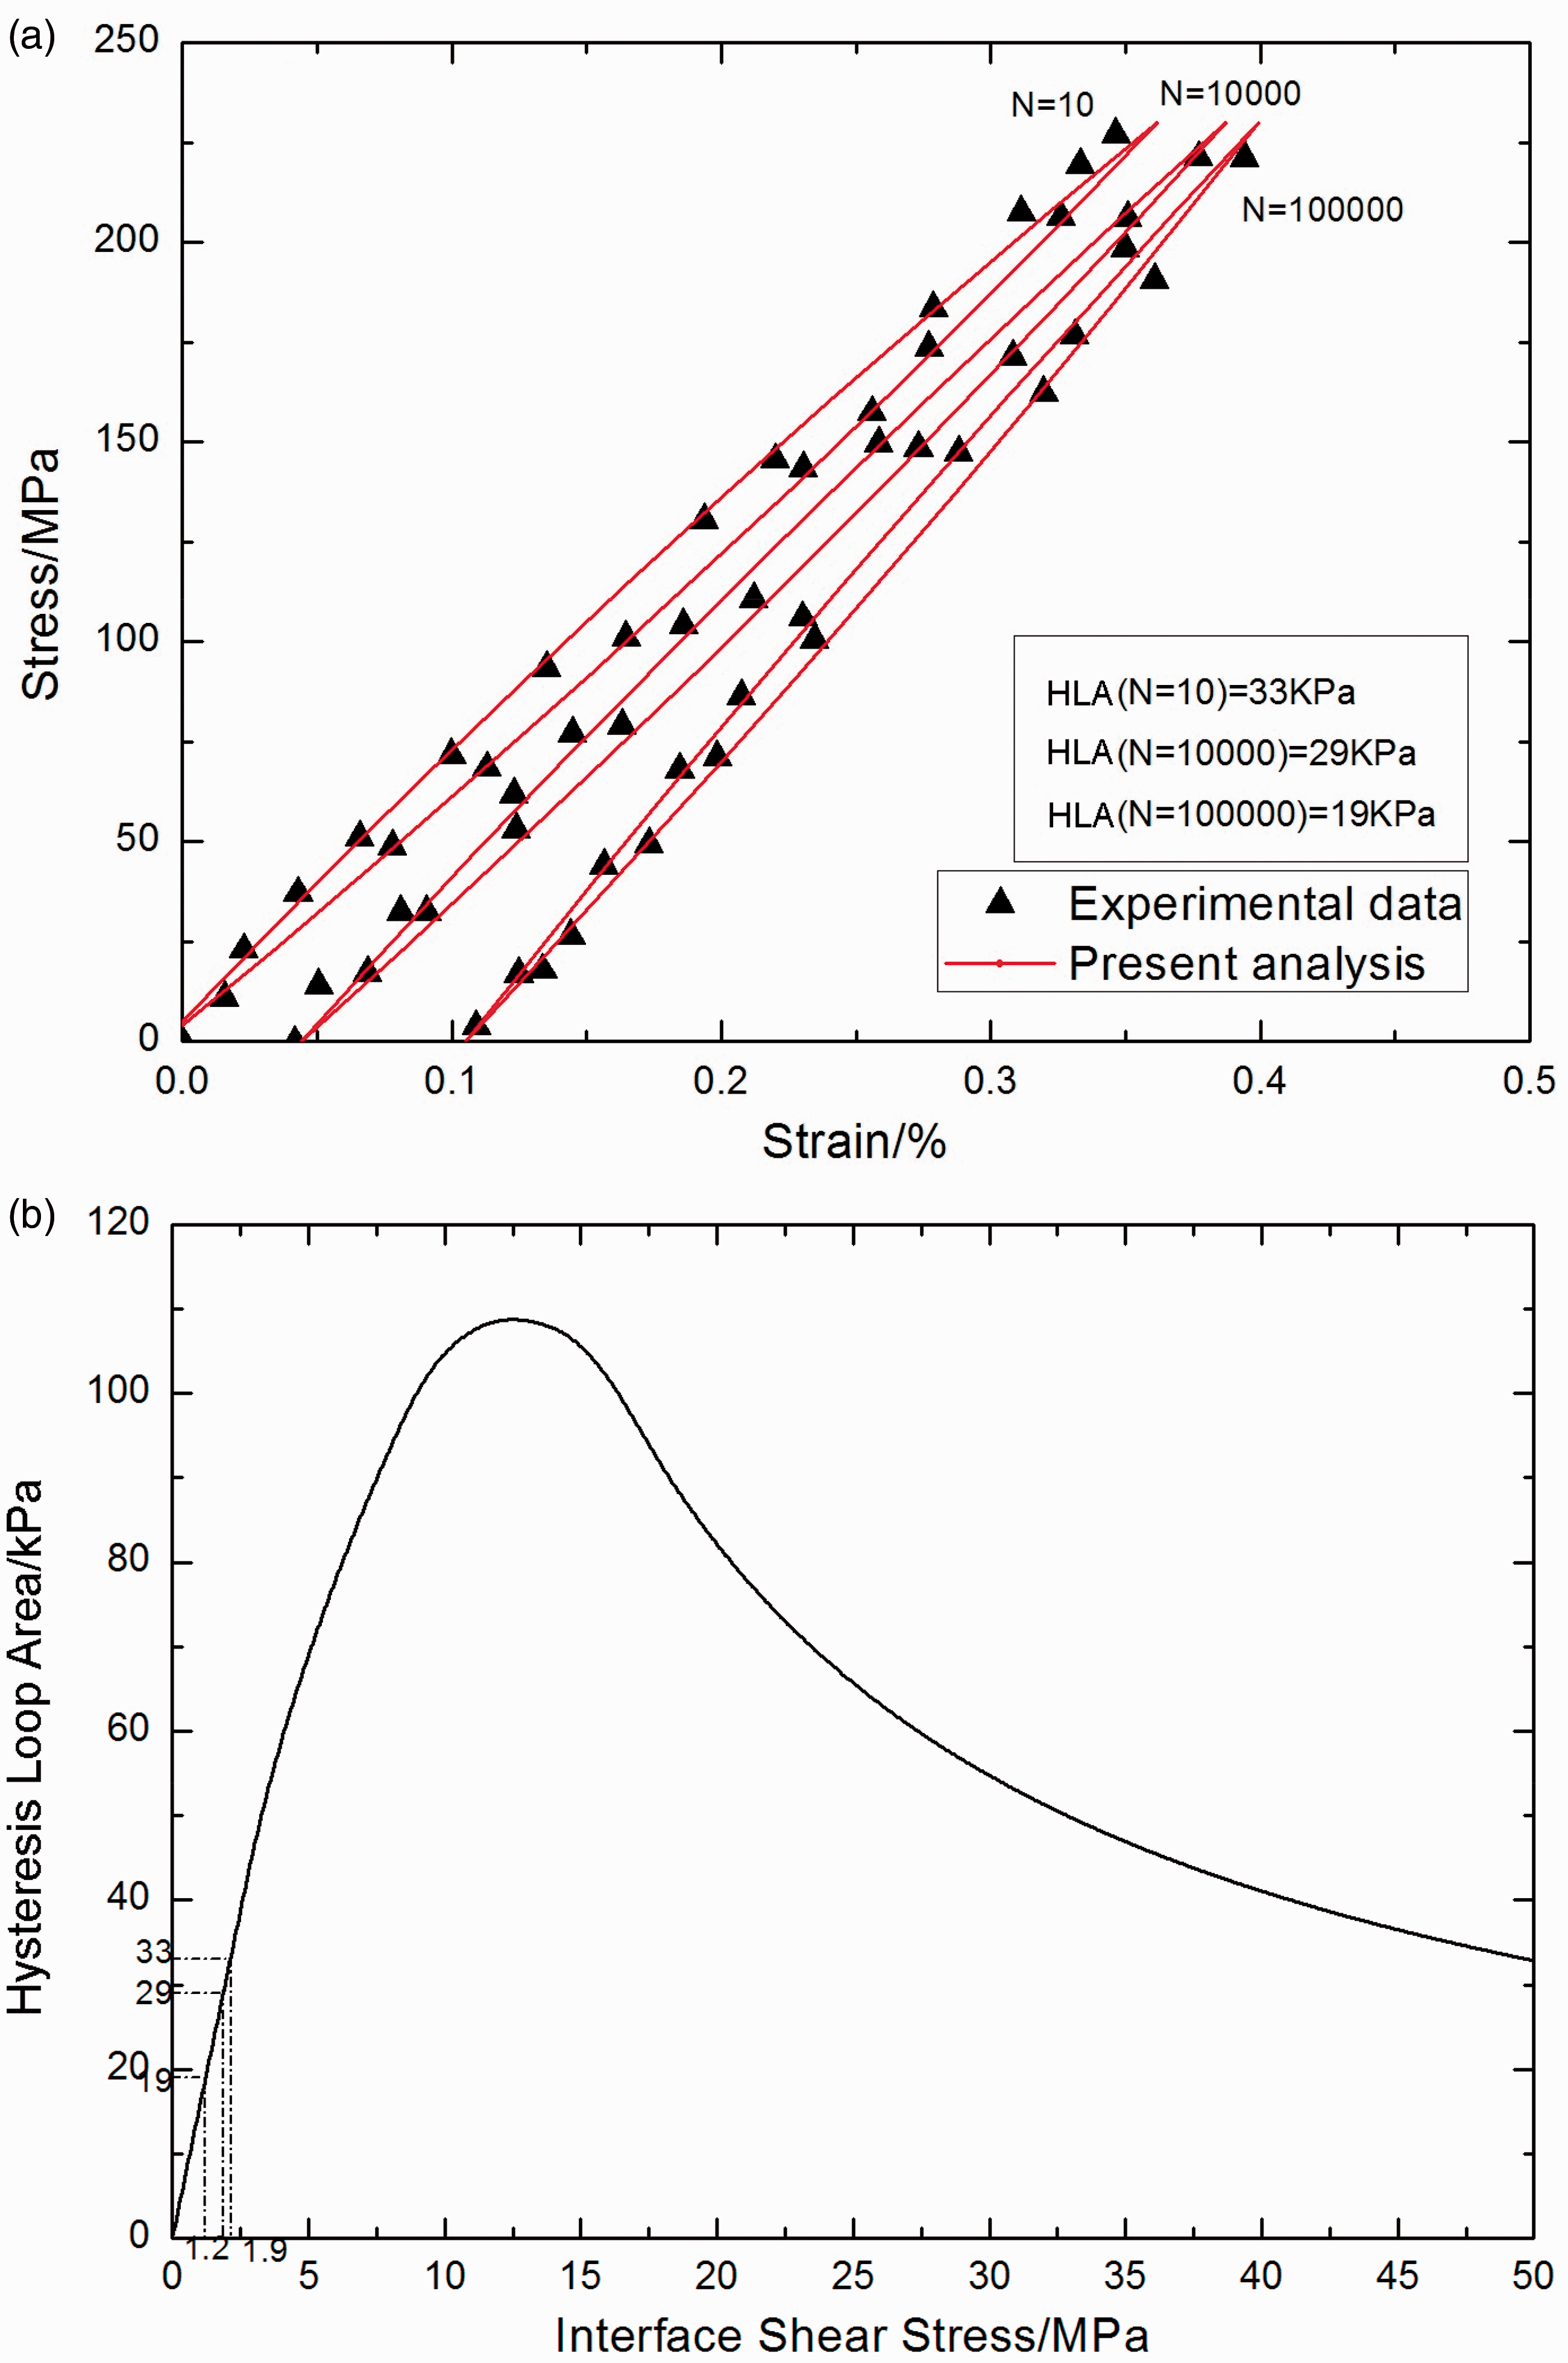
Evolution of the fatigue hysteresis loop area
Under cyclic fatigue loading, the hysteresis loop area and interface shear stress of C/SiC composites change with increasing cycle numbers, due to matrix cracking, interface debonding, interface wear and interface oxidation.
For different fatigue peak stresses at the same test condition, the degradation rate of the fatigue hysteresis loop area increases with increasing peak stress, that is, for unidirectional C/SiC at room temperature, from 32 kJ/m3 at the first cycle to 5.4 kJ/m3 at the 1,039,332th cycle under σmax = 180 MPa; from 56 kJ/m3 at the first cycle to 8 kJ/m3 at the 1,000,000th cycle under σmax = 240 MPa, due to the faster degradation rate of interface shear stress, that is, from 6.8 MPa at the first cycle to 0.35 MPa at the 1,039,332th cycle under σmax = 180 MPa; from 8 MPa at the first cycle to 0.3 MPa at the 1,000,000th cycle under σmax = 240 MPa. When the peak stress increases, the interface slip range or relative slip displacement between fibers and the matrix in the interface debonded region increases, leading to an increase of the degradation rate of interface shear stress and fatigue hysteresis loop area.
For different test conditions at the same fatigue peak stress, the fatigue hysteresis loop area degrades much faster at 800℃ in air than that at room temperature with increasing cycle numbers, that is, for cross-ply C/SiC under σmax = 105 MPa, from 35 kJ/m3 at the first cycle to 10.7 kJ/m3 at the 1,000,000th cycle at room temperature; from 24.3 kJ/m3 at the first cycle to 5.1 kJ/m3 at the 6600th cycle at 800℃ in air, due to the faster degradation rate of interface shear stress at 800℃ in air, that is, from 7.3 MPa at the first cycle to 1 MPa at the 1,000,000th cycle at room temperature; from 5.5 MPa at the first cycle to 0.4 MPa at the 6000th cycle at 800℃ in air.
For different fiber preforms at different test conditions, the fatigue hysteresis loop area of unidirectional C/SiC at 800℃ in air degrades the fastest, that is, from 62 kJ/m3 at the first cycle to 7.2 kJ/m3 at the 24,000th cycle, due to the fastest degradation rate of interface shear stress, that is, from 8.3 MPa at the first cycle to 0.21 MPa at the 24,000th cycle. The fatigue hysteresis loop area of 2.5D C/SiC at 600℃ in inert atmosphere degrades the slowest, that is, from 33 kJ/m3 at the 10th cycle to 19 kJ/m3 at the 100,000th cycle, due to the slowest degradation rate of interface shear stress, that is, from 2.2 MPa at the 10th cycle to 1.2 MPa at the 100,000th cycle. However, for 2.5D C/SiC from Yang’s experimental data, 7 the fatigue hysteresis loop area increases with increasing cycle numbers at room and elevated temperatures, that is, from 7.8 kJ/m3 at the 10th cycle to 12.8 kJ/m3 at the 4010th cycle at room temperature; from 6.3 kJ/m3 at the 500th cycle to 11.8 kJ/m3 at the 20,000th cycle at 800℃ in air. Due to low fatigue peak stress and high initial interface shear stress, the interface partially debonds during the process of entire cyclic loading, and fatigue hysteresis loops correspond to interface slip Case 2. However, for cross-ply C/SiC, the degradation rate of the fatigue hysteresis loop area lies between that of unidirectional and 2.5D woven CMCs, which indicates that the interface wear or interface oxidation is much more serious in the interface debonded region of the unidirectional C/SiC composite, compared with that in the interface debonded region of the 0° plies or longitudinal yarns of cross-ply or 2.5D C/SiC composites.
Conclusions
The damage evolution of the C/SiC composite with different fiber preforms has been investigated. The fatigue hysteresis modulus and fatigue hysteresis loop area decrease rapidly at the initial stage of cyclic loading due to matrix cracking and interface debonding. When matrix cracks approach saturation, the degradation of interface shear stress caused by interface wear at room temperature and interface oxidation at elevated temperature would be the main reason for degradation of the fatigue hysteresis modulus and hysteresis loop area.
The evolution of the fatigue hysteresis loop area versus cycle number depends on interface debonding and frictional slip between fibers and the matrix, fatigue peak stresses, test conditions and fiber preforms. For different fiber preforms at different test conditions, the fatigue hysteresis loop area degrades the fastest for unidirectional C/SiC at 800℃ in air, and the slowest for 2.5D C/SiC at 600℃ in an inert atmosphere, due to the different degradation rates of interface shear stress. For the cross-ply C/SiC composite, the degradation rate of the fatigue hysteresis loop area lies between that of unidirectional and 2.5D woven CMCs, which indicates that the interface wear or interface oxidation is much more serious in the interface debonded region of the unidirectional C/SiC composite, compared with that in the interface debonded region of the 0° plies or longitudinal yarns of cross-ply or 2.5D C/SiC composites.
Footnotes
Acknowledgements
The author would also thank two anonymous reviewers and the editor for their valuable comments on an earlier version of the paper.
Declaration of conflicting interests
The authors declared no potential conflicts of interest with respect to the research, authorship and/or publication of this article.
Funding
The authors disclosed receipt of the following financial support for the research, authorship, and/or publication of this article: This work was supported by the Natural Science Fund of Jiangsu Province (grant number BK20140813) and the Fundamental Research Funds for the Central Universities (grant number NS2016070).