
Abstract
Planar frequency selective fabrics (FSFs) with Jerusalem-shaped units were proposed in this paper. In accordance with the previous work, the design process was specifically for 10 GHz. Through simulation and optimization procedures, the ideal structure parameters were obtained, and the proposed FSFs with optimized parameters showed good stability to differential and integral algorithms, transmission modes and incidence angles of electromagnetic (EM) waves. To further explore the internal EM transmission mechanism of FSFs, the surface currents at 4, 10 and 14 GHz were analyzed comparatively. Based on the simulated results, 10 samples with the polyester fabric substrate were fabricated through the computer-based carving method and the transmission characteristics were tested using the Shielding Room Method. The fabricated FSFs indeed showed good frequency response characteristics, as expected, and the comparison of measured and simulated results verified the validity of the design procedures. The influence rules of structure parameters (p, a, b, c) were further studied in detail by changing their values properly, and the simplified equivalent circuit model was proposed to explore the corresponding physical mechanism, which could provide physical insight into the performance of the FSFs.
Keywords
As one kind of periodic structure, the frequency selective surface (FSS) has been studied for years, mainly focusing on the design and characterization of new structures.1–5 Based on traditional FSSs, the research idea of frequency selective fabrics (FSFs) was proposed and some research progress has been made recently.6–11 FSFs possess the flexible properties of fabrics and the electromagnetic (EM) effect of FSSs, and therefore they have advantages over the traditional FSSs and would be certainly irreplaceable in particular fields.12–16
In fact, the previous study on FSFs mainly involved the fabrication process as well as characteristics testing and some FSFs with specific units were designed, such as cross-shaped, square-loop and circular-ring-shaped FSFs.8–11 Although the research results were relatively ideal and some basic conclusions were obtained, they might not apply to FSFs with other units. Compared with the cross-shaped unit, the added end parts in the Jerusalem-shaped unit would provide additional inductive reactance or capacitive susceptance, which can enhance the frequency selective characteristics.17–20 In fact, relevant researchers have carried out some work and made certain research progress. Jazi et al. 17 investigated the application of polarization-insensitive Jerusalem-shaped FSSs for transmitarray antennas (TAs) and the involved materials were mainly RT/Duroid 5880 and Rohacell foam. Geeta and Kanaujia 18 explored the parameter influences of the Jerusalem cross used for circular patch antenna and the equivalent circuit model was proposed to predict the transmission characteristics, but the calculation equations were very puzzling and more details should be studied. Hosseinipanah and Wu 19 proposed and compared three novel FSS slots based on the Jerusalem cross slot. The modification was made through the change of the ending capacitor, but the paper did not deeply explore the internal mechanism. Costa et al. 20 proposed the efficient analysis method of FSSs using a simple equivalent-circuit model and the transmission characteristics of FSSs with several unit cells could be predicted, including the Jerusalem-shaped units. However, the complex computation formulas of lumped elements are not easily understood and a simpler method is much needed. The similar problems also exist in other related research work21–24 and, in short, the existing research on Jerusalem-shaped FSSs was not systematic and it mainly focused on the complicated theoretical calculation, and the involved materials were rigid plates and composites, rarely involving the soft fabrics and, therefore, the corresponding FSFs would be worth studying.
Based on the research findings of cross-shaped FSFs, the systematic study of Jerusalem-shaped FSFs could verify the applicability of design procedures and serve as the important component of comprehensive FSFs. Two different simulation software programs were used in the paper to investigate the differences, and the stability of the frequency response characteristics to EM waves was explored. Through the actual sample fabrication and test analysis, the validity of design procedures was proved and the influences of structure parameters could be further explored by adjusting the values effectively. The qualitative and quantitative analysis of the internal EM transmission mechanism could be performed using surface current distribution and the equivalent circuit model, respectively.
Design process
Two complementary Jerusalem-shaped FSSs were selected to design FSFs, and the design process of aperture FSFs was illustrated, which could also apply to patch FSFs. Figure 1 shows the schematic of the proposed aperture FSFs, which comprise aperture FSSs on a woven fabric substrate. Figure 1(a) is the 4 × 4 finite array, showing the arrangement situation of periodic units, and Figure 1(b) shows the unit cell structure, in which the colored area is covered with conductive material, while the left blank area represents fabric with nothing on the surface.
Schematic of aperture frequency selective fabric with Jerusalem-shaped units: (a) 4 × 4 finite array; (b) unit cell structure.
As shown in Figure 1, the proposed Jerusalem-shaped array is orthogonal and the unit cell itself is center symmetric. Each structure parameter has its corresponding meaning: p refers to the lateral as well as the longitudinal size of the unit cell; a is the width of the inside cross; b and c represent the length and width of the end rectangle; and d stands for the half spacing between two adjacent units. Through the rational adjustment of structure parameters, various FSFs with different transmission characteristics could be obtained.
Simulation and optimization
Actually, many different algorithms could be used to calculate the transmission properties of periodic structures. High Frequency Structure Simulator (HFSS) which is based on the FEM (Finite Element Method), was used in our previous work to simulate and optimize the cross-shaped FSFs and the experiment results verified the validity. In this paper, CST Studio Suite software, which is based on FIT (Finite Integral Technology), was also used to simulate the results and make comparisons. Periodic boundary conditions as well as the Floquet port were employed in both simulation procedures, and other settings were also identical. Figure 2 shows the schematic of the CST simulation process, in which relevant settings are marked and the EM wave is perpendicular to the surface of the proposed FSFs. Considering the actual fabrics used in the experiment, the thickness was fixed as 0.2 mm and the relative permittivity was roughly set as 1.2. The conductive layer was assumed to be aluminum (the conductivity is about 3.8 × 10⁷ S/m). The schematic of HFSS simulation was shown in a previous study
8
and it need not be repeated here.
Schematic of the CST simulation process.
The expected resonance frequency was 10 GHz in accordance with the previous study, and the method could apply to any frequency in theory. After the optimization calculation, the values of various parameters were approximately obtained as follows: p = 15 mm, a = 2.5 mm, b = 6 mm, c = 2 mm, d = 1.5 mm. To evaluate the characteristics of proposed FSFs, the stability of the proposed FSFs to EM waves was analyzed in depth and the structure parameters were set as the above optimized values.
Analysis of the simulation results
Figures 3(a)–(d) show the simulated results of the proposed FSFs using two algorithms, with two complementary structures, under two transmission modes, under different incidence angles separately, from which the stability of frequency response characteristics can be seen.
Simulation results of the proposed FSFs: (a) using two algorithms; (b) with two complementary structures; (c) under two transmission modes; (d) under different incidence angles.
As shown in Figure 3(a), the frequency response characteristics are roughly the same, with slight changes. As expected, all the resonance frequencies appear at around 10 GHz, peaking at 0 dB or over –30 dB, which demonstrates that two algorithms could authenticate each other and both are effective in predicting the transmission characteristics of FSFs. From Figure 3(b), we can see that the two complementary structures show ideal contrary characteristics, as expected, which means that the researchers could only design one kind of FSF to obtain the structure parameters, which could also apply to the complementary FSFs. Figure 3(c) shows that S21 and S11 curves overlap each other basically on the whole, and the partial enlarged drawing reveals clearly the minor differences between the results. In Figure 3(d), the S21 and S11 curves present the small fluctuation as the incidence angle increases, especially the resonance peaks, as shown in the corresponding enlarged detail. However, the shape of the curves does not vary dramatically on the whole, and the frequency resonance characteristics are still obvious even as the incidence angle reaches 45°.
To further illustrate the reason why the transmission characteristics remain unchanged under two different modes, the schematics of the TE and TM modes are compared and shown in Figures 4(a) and (b), respectively. As the EM wave interacts with the FSFs, transmission and reflection effects are produced at the same time. As the θi is 0°, the transmission direction of the EM wave is perpendicular to the surface of the FSFs and the electric as well as magnetic fields are both parallel to the FSFs. For the TE mode, the electric field is along the X-axis direction and the magnetic field is along the Y-axis direction, while the opposite is true for the TM mode. In the simulation process, the warp and weft yarns of the base fabric were identical, and the upper aluminum layer was assumed to be isotropic, which made the proposed FSFs insensitive to the transmission modes.
Two transmission modes of the electromagnetic (EM) wave: (a) TE mode; (b) TM mode.
From the above discussion, we know that the proposed FSFs with optimized parameters showed obvious frequency response characteristics, which were stable to the simulation algorithms, transmission modes and incidence angles of the EM wave. Therefore, the proposed FSFs were ideal and could be good candidates to satisfy the stringent requirements in use.
EM transmission mechanism
To further explore the internal EM transmission mechanism of FSFs, the surface currents at three different frequencies (4, 10 and 14 GHz) were extracted and are shown in Figures 5(a)–(c), respectively. In the figure, the left-hand part shows the electrons motion and the right-hand part depicts the distribution of the current absolute value.
Surface current at different frequencies: (a) f = 4 GHz; (b) f = 10 GHz; (c) f = 14 GHz (left: motion of electrons; right: absolute value of current).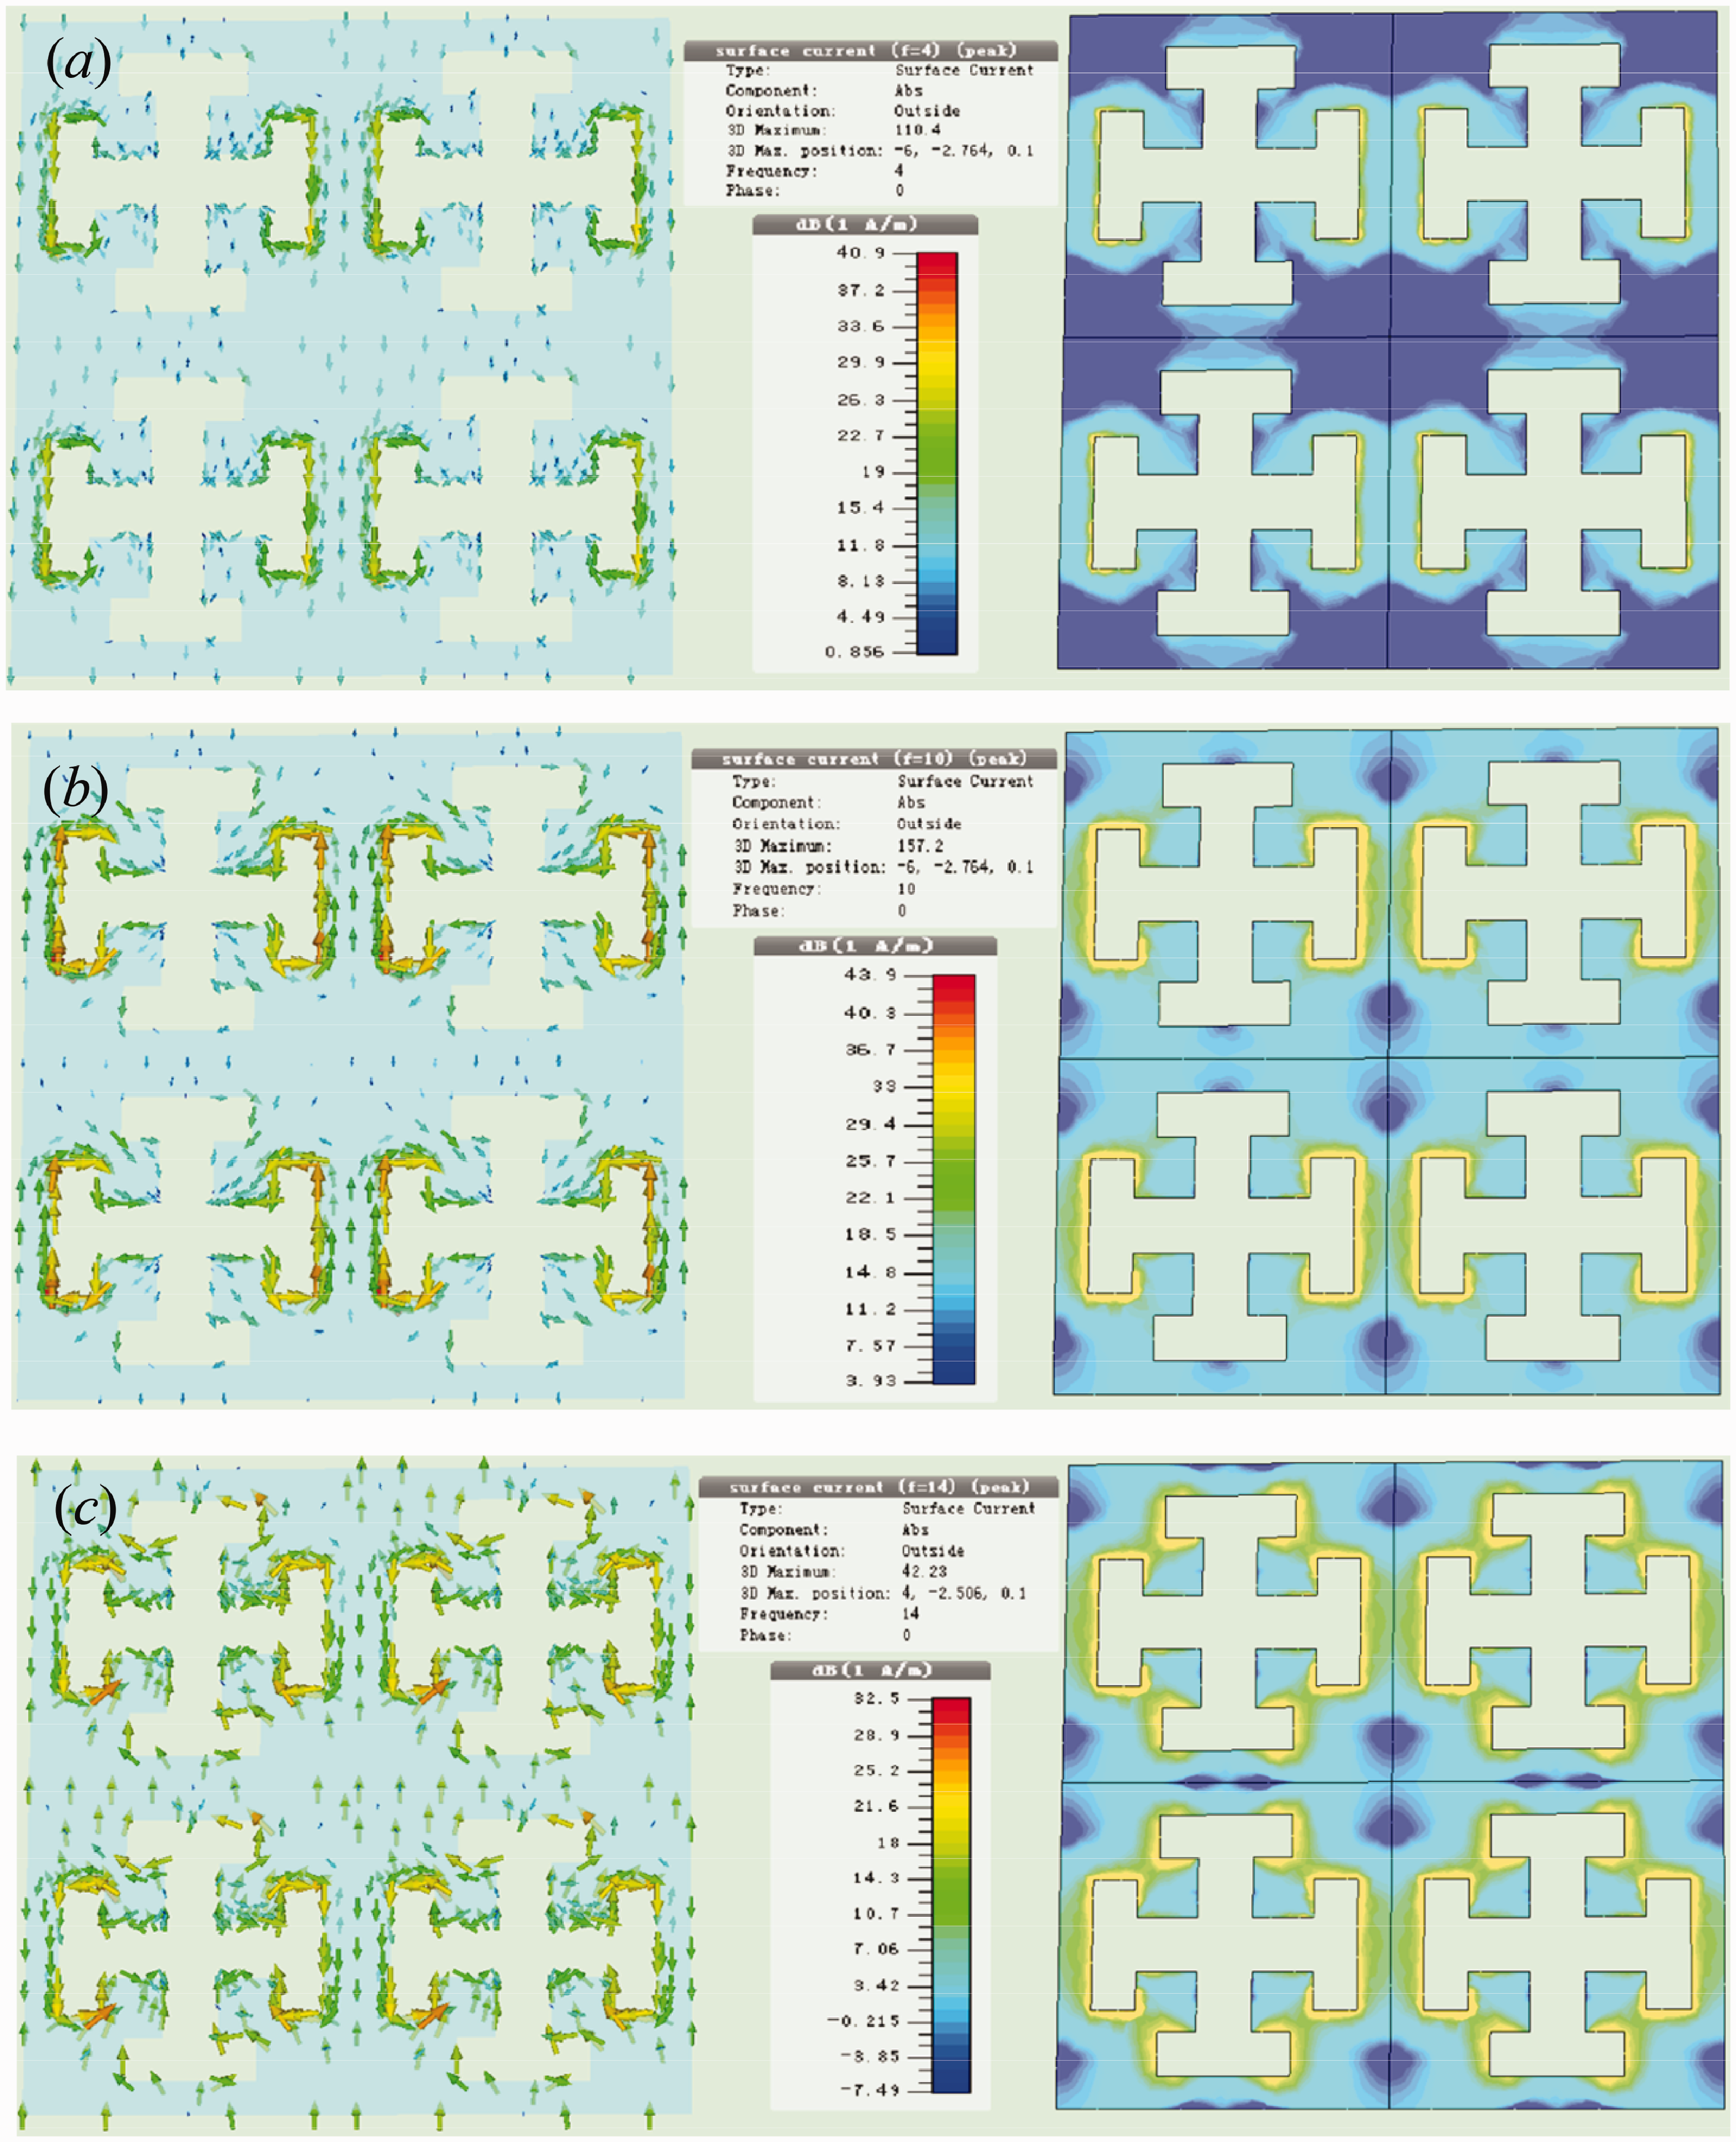
As the EM wave interacts with the FSFs, the electrons in the metal layer are excited to motion in phase or reverse phase. When the frequency is relatively low (4 GHz), the time of electrons moving in a single direction is long and therefore the scope of electron motion is large. At this moment, the inspired electrons could absorb most of the energy, while the induced current along the aperture is very small, producing the corresponding small S21, as shown in Figure 5(a). With the increase of EM wave frequency, the scope of electron motion decreases gradually and the current along the aperture increases accordingly. As the frequency reaches the resonance region, the electrons are driven by the electric vector to oscillate in phase on either side of the aperture and then the induced current reaches the peak, as shown in Figure 5(b). At this moment, the inspired electrons could absorb most of the energy and also emit energy towards the transmission direction, producing the resonance phenomenon. As the EM wave frequency further increases, the distance of the electron moving reverse phase is even shorter, and therefore the induced current around the aperture would be broken into pieces, weakening the transmission field, as shown in Figure 5(c).25–30
From the above discussion, we can see the physical mechanism of aperture FSFs clearly, and the analysis method could also apply to patch FSFs. Actually, the dielectric layer could adjust the position of the resonance frequency, but the role of base fabrics is not discussed here considering the small dielectric properties. The internal electron motion and induced current could offer a theoretical basis for relevant analysis, and the filtering mechanism would help researchers easily understand the influences of structure and material parameters.
Experimental details
Sample fabrication and testing
The samples were fabricated through a computer-based carving process, and relevant machine type and process parameters were introduced. 9 Also, similar instruments, such as the Exploit Thickness Tester and AT510x DC Resistance Tester, were selected to characterize the physical as well as geometric material parameters.
In the experiment, aluminum foil adhesive materials, which are composed of an upper conductive layer (with the thickness of 0.08 mm) and lower release paper layer, were selected to make the FSS samples. Plain polyester fabric was selected as the substrate: the yarn count was 16.8 tex; the density of arrangement was 408 × 274 in 10 cm; the weight of the fabric was 124 g/m2; and the equivalent thickness was 0.2 mm. The dielectric constant was roughly fixed to be 1.2 as the frequency reached 1 GHz.
The testing of transmission characteristics was performed using the Transmission Method; the principle and system are illustrated at length in our previous work. 8
Experiment arrangement
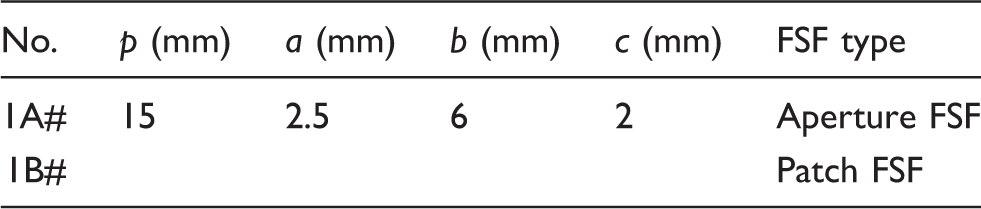
Samples with different frequency selective fabric (FSF) types
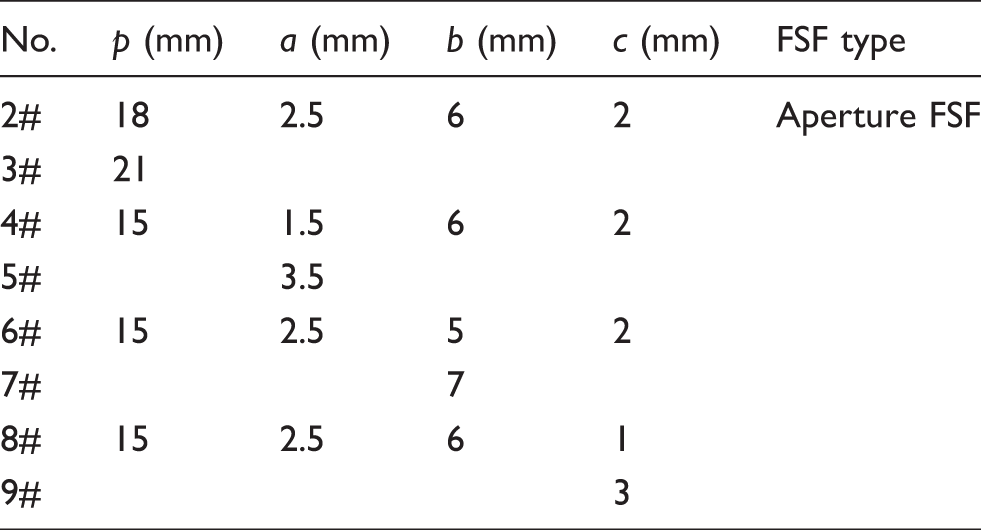
Samples with different structure parameters
FSF: frequency selective fabric.
In the two tables, the structure parameters (p, a, b, c) correspond with Figure 1(b), and the value of d remained unchanged for all the samples, equivalent to 1.5 mm. Considering that the influence rules of the base fabric and the conductive layer were explored in our previous work, 9 they were no longer investigated in this paper. The substrate of all the samples was plain polyester fabric and the conductive layer was aluminum foil adhesive material, as mentioned above.
Analysis and discussion
Comparison of measured and simulated results
The measured results of samples 1A# and 1B# were compared with the simulated results to verify the validity of the design procedures, as shown in Figure 6. From this figure, we can see that S21 curves of the two samples indeed show obvious resonance peaks. The measured and corresponding simulated curves are similar, with small curve shifts.
Comparison of measured and simulated results.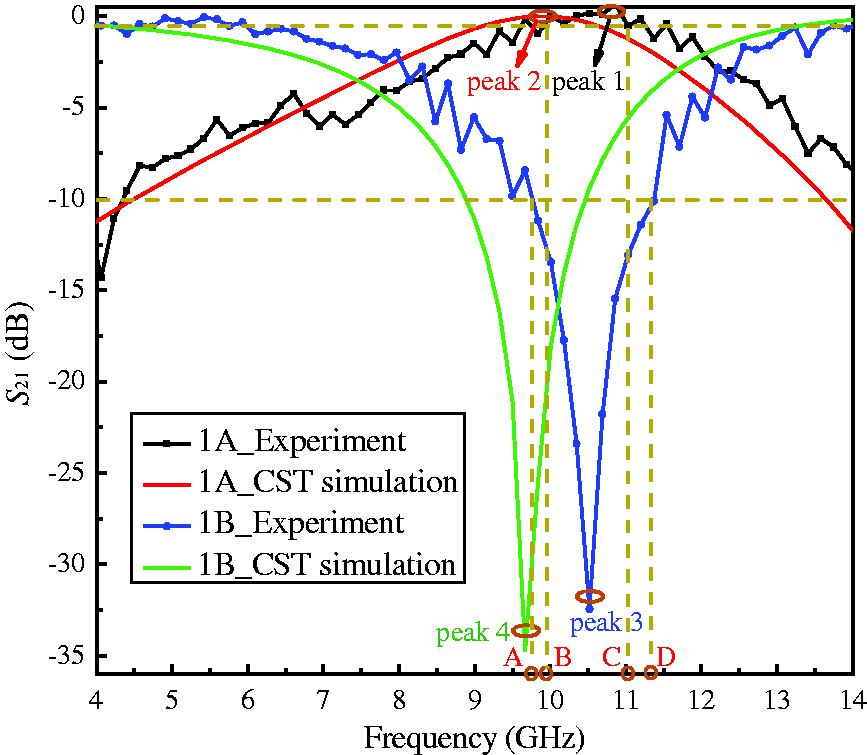
As for sample 1A#, the resonance frequencies of measured and simulated S21 curves are 10.86 and 9.84 GHz, respectively, both peaking at 0 dB (peak 1 and peak 2). The measured curve shows that the bandwidth of –0.5 dB (approximately more than 90% of EM waves could traverse the FSF) is roughly from 9.95 GHz (point B) to 11.03 GHz (point C). For sample 1B#, two S21 curves show a similar difference with sample 1A#. The resonance frequencies of measured and simulated curves are 10.52 and 9.67 GHz, peaking at –32.46 and –34.73 dB respectively. The measured curve shows that the bandwidth of –10 dB is predicted approximately from 9.84 GHz (point A) to 11.37 GHz (point D). Compared with the simulated curves, the measured curves move to the higher frequency region on the whole. The deviations could be attributed to the fabrication precision, the finiteness of the sample size, the imperfection of the conductive metal, the unevenness of fabric surface due to yarn crimp and many other factors, which were not considered in the simulation process.
Influence of structure parameters
To further study the influences of structure parameters, different samples listed in Table 2 were fabricated and tested, and the results are shown in Figure 7. The typical indexes of the S21 curves are extracted and listed in the corresponding sub-figures.
S21 curves of samples with different structure parameters.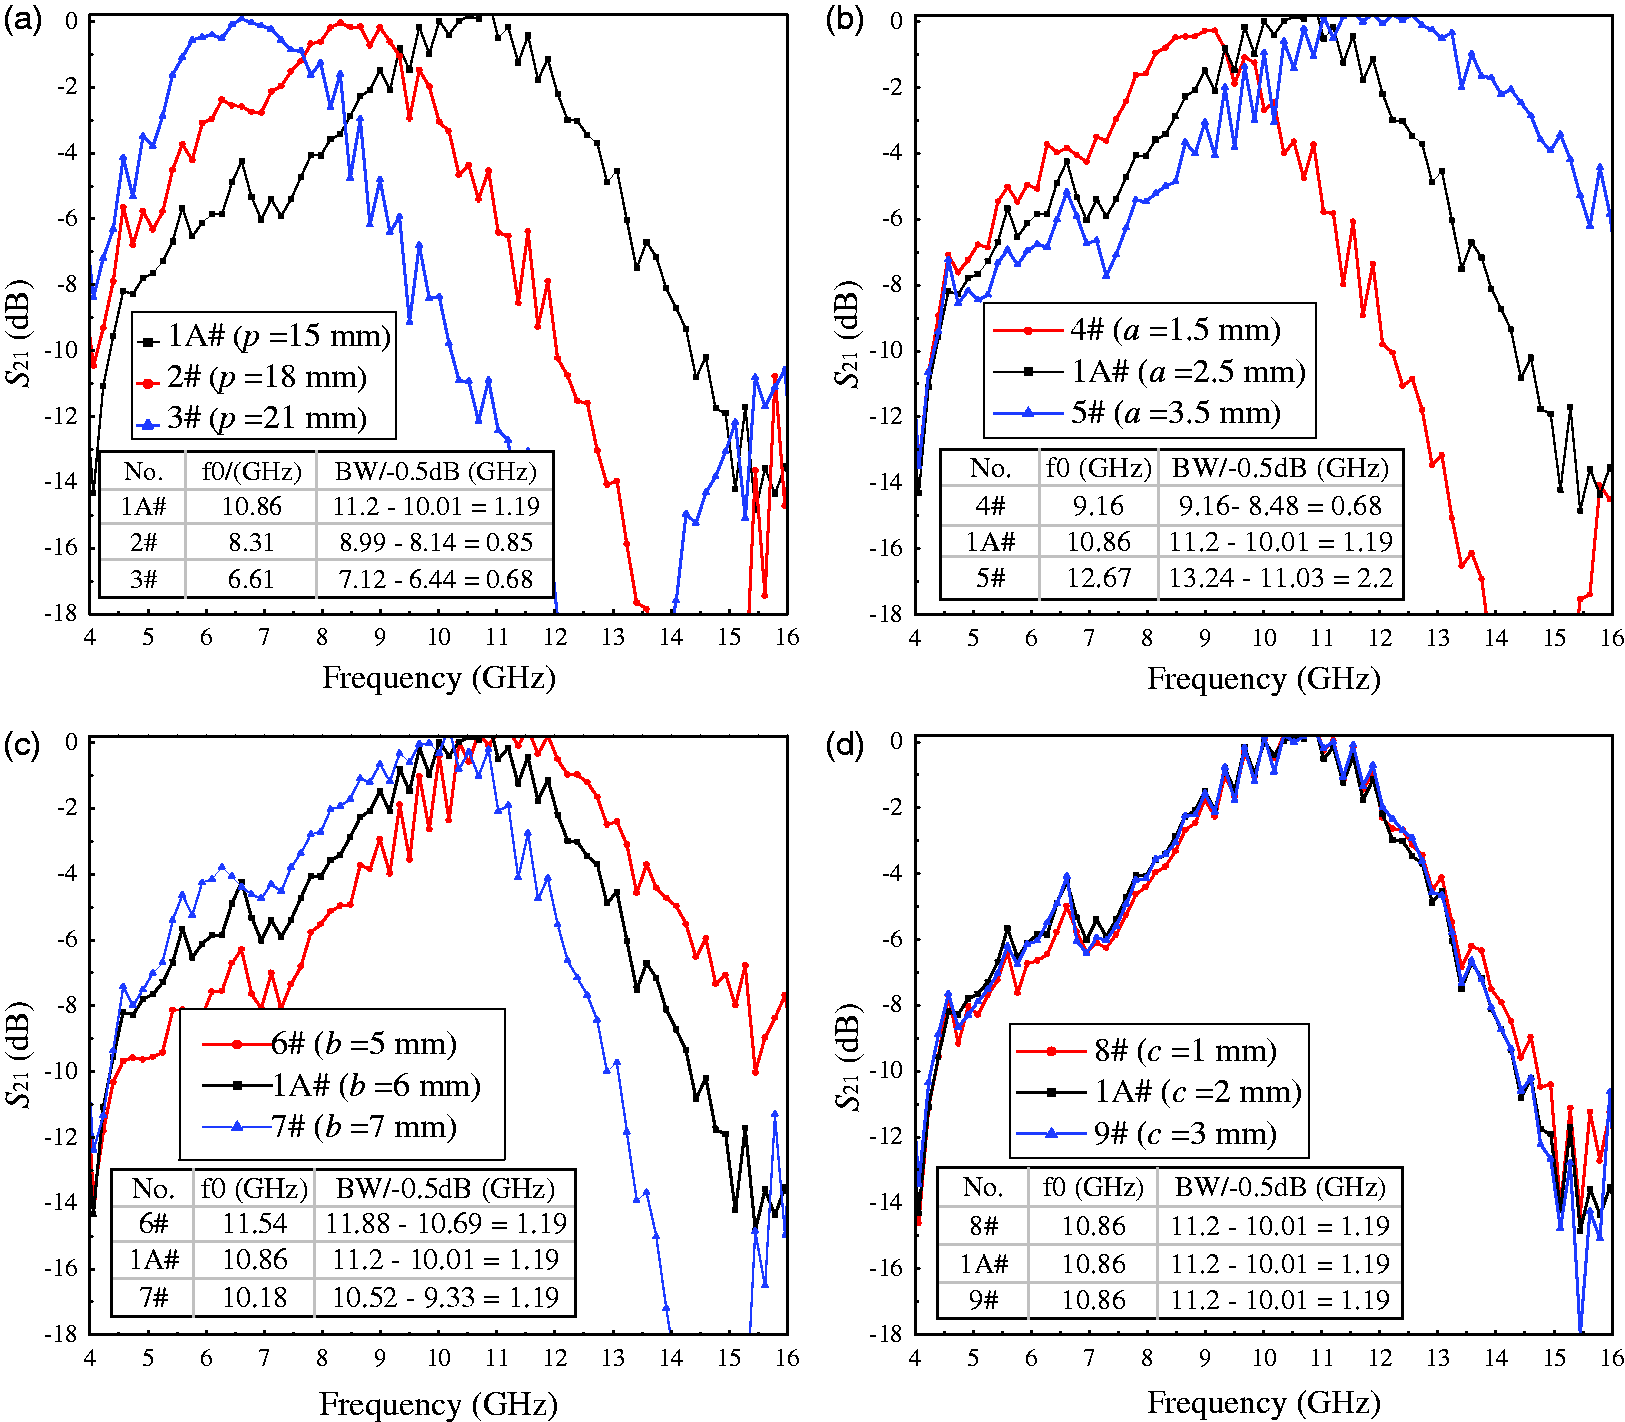
In Figure 7(a), as the unit cell size p increases from 15to 18 mm, and then to 21 mm, the resonance frequency f0 moves to lower positions, from the original 10.86 to 8.31 GHz, and then to 6.61 GHz. Also, the bandwidth of –0.5 dB becomes distinctly narrower, predicted to be 1.19, 0.85 and 0.68 GHz, respectively. In Figure 7(b), as the value of a increases from 1.5 to 2.5 mm and to 3.5 mm, the S21 curve moves to the higher frequency region overall. Specifically, the resonance frequency gets higher, from 9.16 to 10.86 GHz and to 12.67 GHz, and the curve shape becomes fatter dramatically, with the bandwidth of –0.5 dB reaching 0.68, 1.19 and 2.21 GHz, respectively. In Figure 7(c), with the value of c increasing from 5 to 6 mm and to 7 mm, the S21 curve moves to the lower frequency domain slightly, while the curve shape shows less change. Specifically, the resonance frequency appears in 11.54 to 10.86 GHz and to 10.18 GHz, and the three bandwidths of –0.5 dB are all predicted to be roughly 1.19 GHz, nearly the same. In Figure 7(d), the three curves overlap almost completely in the given frequency range, which means the change of c within a certain range would not affect the frequency response characteristics of FSFs.
Further, the influence rules of structure parameters on f0 and bandwidth are compared and shown in Figures 8(a) and (b). In this figure, the horizontal axis represents the variation of structure parameters (Δp, Δa, Δb, Δc) and vertical axis represents the variation of typical indexes (Δf0, ΔBW). From the figure, we can see intuitively the variation tendency of typical indexes as well as the influence degree of structure parameters.
Influence rules of parameters on f0 and bandwidth: (a) influence rule of p; (b) influence rules of a, b and c.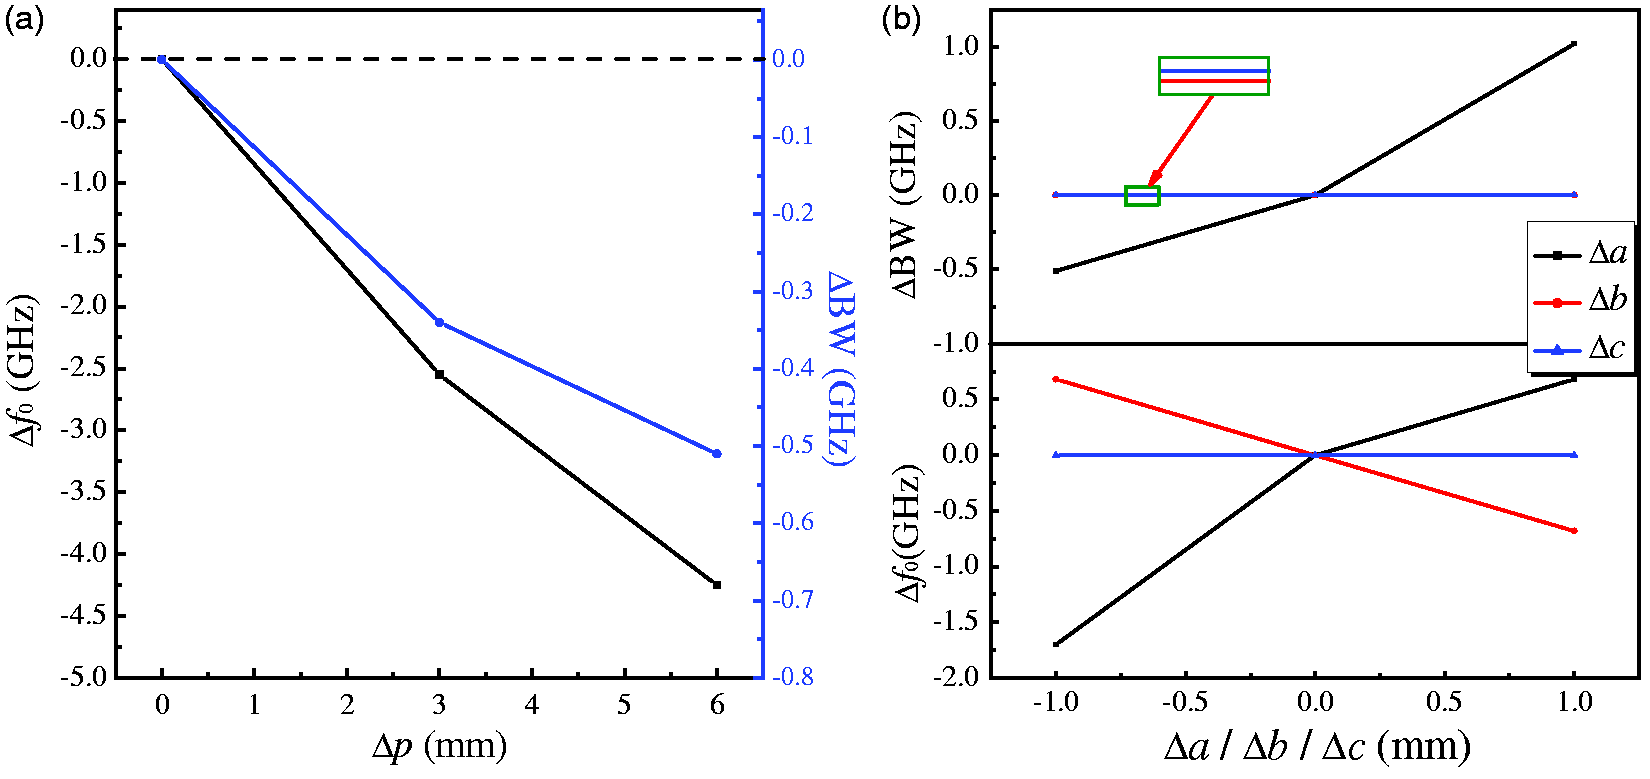
In Figure 8(a), when the value of p increases, the value of f0 and bandwidth decrease to different extents, which is consistent with Figure 7(a). From Figure 8(b), we know that the width of end rectangle c has the most important influence on the two typical indexes in the given variation range of parameters. The above results and corresponding discussion could help designers adjust the parameters effectively to better satisfy the use requirement.
Equivalent circuit model analysis
To understand the physical mechanism of structure parameter influences, the equivalent circuit could be used to perform the analysis. In fact, structure parameters influence the transmission characteristics of patch and aperture FSSs in the same way, and therefore the specific formulas and corresponding analysis of patch FSSs could also apply to aperture FSSs. Due to the fact that the EC parameters of patch FSS are easier to extract, its corresponding model is built and is shown in Figure 9.18–20,31 Also, the polarization mode would not have any influences on the final frequency response characteristics considering the high symmetry of the unit cells, and the TE mode is taken as an example here to explore the internal mechanism.
Equivalent circuit model of patch frequency selective surface with Jerusalem-shaped units.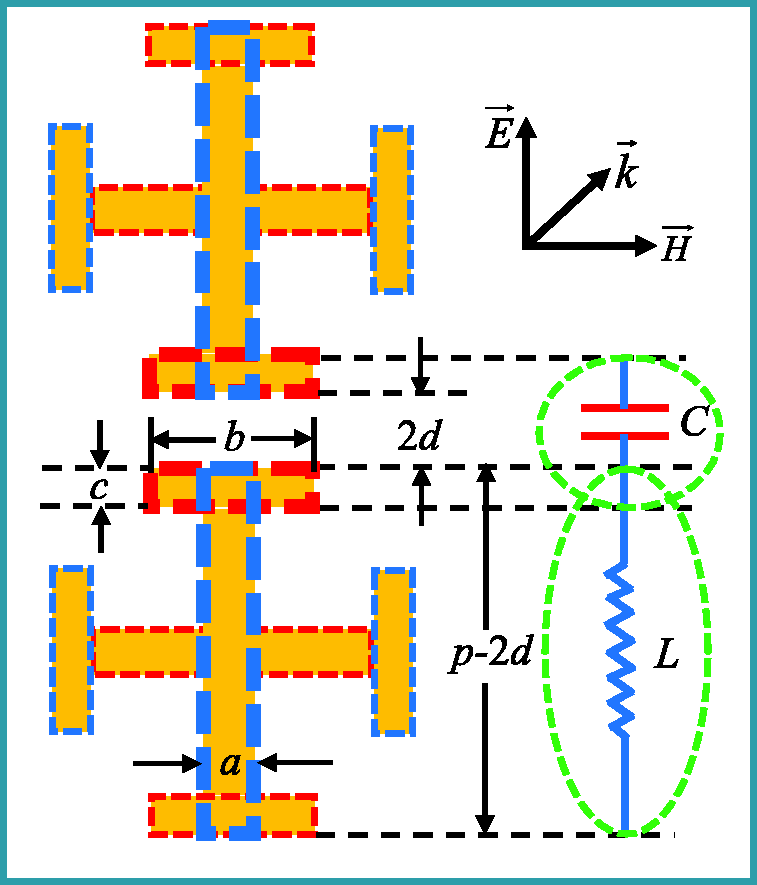
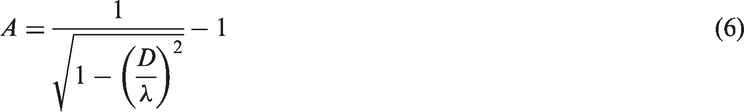
Figure 9 shows that the role of Jerusalem-shaped units could be divided into two parts: wire inductors and gap capacitors. The value of inductive reactance (XL) and capacitive susceptance (BC) mainly depend on the inside rectangle and the end rectangles, which could be approximatively calculated from formulas (1) and (2) respectively, where Z0 represents the characteristic impedance of free space (=377 Ω) and Y0 is the admittance (=1/Z0); f and λ are the frequency and corresponding wavelength of EM waves; ɛr is the dielectric constant of the base fabrics; βL and βC can be calculated from formulas (3) and (4), respectively. G is a compensate factor given in formula (5), where GW could be GL or GC, and βW is the corresponding βL or βC. The value of A in formula (5) can be obtained from formula (6). When the resonance phenomena is produced, the relationship of f, L and C could be easily obtained, as shown in formula (7)32,33


Calculated L, C and f0 _C values of proposed frequency selective fabrics (FSFs)
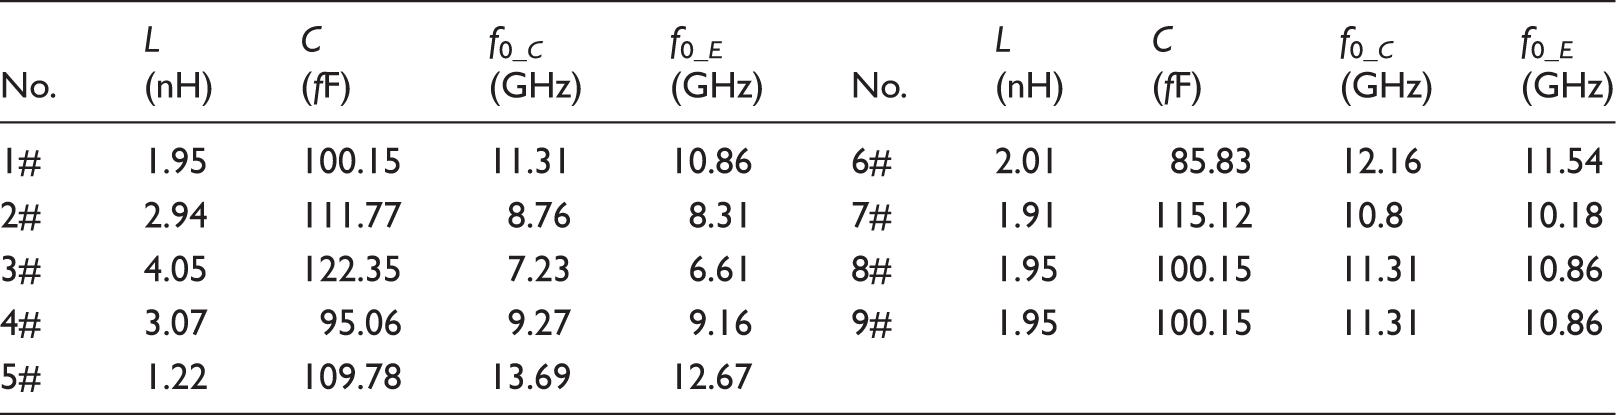
In Table 3, the values of f0 _C are a little larger than f0 _E on the whole, which could be attributed to the approximate estimation of lumped parameters in the proposed EC model. In fact, besides the main parts involved in the formulas, the values of L and C include many other non-significant parts and coupling effects, which are marked using corresponding dashed boxes in Figure 9. Although the two frequencies are not completely same, they show an identical variation trend which proves that EC model could predict the frequency response characteristics quickly and effectively. Also, the variation of L and C under the influence of structure parameters could provide physical insight into the performance of the FSFs.
Conclusions
Based on the research status of EM transmission characteristics of soft materials and FSSs with Jerusalem-shaped units, the planar FSFs with Jerusalem-shaped units were proposed and the stable frequency response characteristics of proposed FSFs were analyzed based on the simulation results. Ten samples with the polyester fabric substrate were fabricated and tested and they indeed showed good frequency response characteristics as expected. The influence rules of structure parameters were studied in detail and the conclusion that p and a are the most influential parameters within the variation range was obtained. The calculated results based on the proposed simplified EC model showed good consistency with the measured results, which verified that surface roughness due to yarn crimp and fabric porosity would not have great influence and the actual results could be predicted through the calculation of the EC model.
The systematic analysis of simulated and measured results could help designers get the full understanding of FSFs in design ideas as well as external characteristics. The surface current distribution and EC model could be severally used to investigate the EM transmission mechanism and physical mechanism of structure parameter influences, and both of them can apply to the two kinds of complementary FSFs. Research on the Jerusalem-shaped FSFs in this paper could verify the applicability of design procedures and serve as the important component of comprehensive FSFs.
Footnotes
Declaration of conflicting interests
The authors declared no potential conflicts of interest with respect to the research, authorship and/or publication of this article.
Funding
The authors disclosed receipt of the following financial support for the research, authorship, and/or publication of this article: This work was supported by the Fundamental Research Funds for the Central Universities (grant number CUSF-DH-D-2015005).