
Abstract
The Comprehensive Handle Evaluation System for Fabrics and Yarns (CHES-FY) is capable of measuring multiple physical and mechanical properties of fabrics, which are related to fabric handle. In this study, ten curve parameters were defined from the pulling-out force–displacement curve of the CHES-FY. Factor analysis was used to remove the co linearity of the curve parameters in order to better characterize the stiffness handle of fabrics. Three principal factors were established using the factor analysis, and the first principal factor was termed the stiffness index based on loadings of the curve parameters to the rotated factors. Comparisons between the evaluation results of the CHES-FY, cantilever test, and newly-developed dual subjective/objective assessments showed that the CHES-FY, together with the stiffness index resulting from the factor analysis, provided a fast and effective method to characterize a fabric’s stiffness handle, and the evaluation process of the CHES-FY appears to closely simulate the tactile response to stiffness when a person touches or pinches a fabric.
The stiffness handle is closely related to the formability, wrinkling, and drape behaviors of fabrics, and is one of the major concerns of textile manufacturers and consumers.1,2 The stiffness handle is traditionally assessed by the subjective feeling when persons touch and pinch fabrics. Since the 1930s, when Peirce 3 proposed various tests, including the cantilever and heart loop methods, a series of measurement instruments and methods used for objectively characterizing the bending stiffness of fabrics has been reported.4–9 The classic devices include the Schiefer Flexometer, 10 the modified Instron tester, 11 and the Shirley Stiffness Tester. 12 Two well-known apparatuses, the Kawabata Evaluation System (KES) bending tester and the Fabric Assurance by Simple Testing (FAST) bending meter, have successfully introduced methods to measure the bending property of fabrics in the low stress state.13,14 However, the apparatuses and methods mentioned above were developed to test the bending property alone in one test, and it is therefore difficult to meet the actual application where fabrics are deformed under multiple mechanical actions simultaneously, covering bending, friction, stretching, and compression properties, as the stiffness handle is based on the human sense response to the comprehensive properties of fabrics.
Attempts have been made to provide effective methods in order to evaluate the comprehensive mechanical performance of fabrics by using simultaneous measurement methods.15–19 As a result, a commercial instrument—the PhabrOmeter Fabric Evaluation System—was configured by NU Cybertek Inc. in the USA based on the research of Pan and coworkers. 20 This system can evaluate a fabric’s stiffness handle by pushing a fabric through an orifice and calculating the corresponding handle index from the testing curve. 21 However, the fabric division protocols and built-in models of the PhabrOmeter are developed based on fabric linear density, 17 and thus they are not always suitable for comparing the stiffness handle of a group of fabrics when the fabric linear density is across multiple fabric divisions.
Recently, the Comprehensive Handle Evaluation System for Fabrics and Yarns (CHES-FY) has been developed. The CHES-FY can simultaneously measure the weight, bending, friction, and tensile/shearing properties for both fabrics and yarns by a pulling-out test. 22 The previous investigations by theoretical modeling and cluster algorithms confirmed the practicability of the CHES-FY for characterizing the bending stiffness of fabrics.23,24 However, they were only focused on studying the bending step of the CHES-FY and the curve parameters that are related to bending segment of the pulling-out force–displacement curve, missing the analysis of the corresponding curve parameters of the weight, friction, and tensile/shearing steps when predicting the stiffness of fabrics. Also, the co linearity of the curve parameters was not removed in the previous study. 20 Therefore, factor analysis was used in this paper to determine the principal factors by analyzing the curve parameters of each step of the CHES-FY, and a stiffness index was extrapolated to characterize the stiffness handle of fabrics. Moreover, a dual subjective/objective assessment method was introduced, and comparisons between the results of the CHES-FY, he cantilever test, and subjective/objective assessments were also studied.
Experimental details
Material preparation
Twenty kinds of commercial fabrics, including knitted, woven, and nonwoven ones, were collected, with thicknesses in the range of 0.16–0.91 mm and mass per square meter in the range of 117–290 g/cm2. Appendix 1 shows the details of the fabrics used for this study. The thickness of the fabrics was determined under a pressure of 1 kPa according to the ISO standard 5084-1996, and mass per square meter was measured by a Mettler balance with a precision scale at ± 0.1 mg. All the fabrics were conditioned at 20 ± 2℃ and 65% ± 3% relative humidity for more than 24 hours before testing.
The CHES-FY and pulling-out test
The schematic structure of the CHES-FY, comprising a pulling pin, bi-U-shaped pins, a pair of jaws, a force sensor, and a digital camera, is illustrated in Figure 1.
25
The basic structure schematic of the CHES-FY system.
The settings of system parameters have been optimized using an orthogonal experiment design and are briefly listed as follows: 26 the diameters of the pulling pin and bi-U-shaped pins are set at 2 mm; the space distance between the bi-U-shaped pins is 5 mm; the vertical distance between the jaws and bi-U-shaped pins is 55 mm; the distance between the jaws is 60 mm; the speed of the pulling pin is 0.4 mm/s. Three samples of 180 mm × 20 mm in warp × weft direction of each fabric were prepared for the CHES-FY testing (the wale direction of the knitted fabrics and the machine direction of the nonwoven fabrics were used as the warp direction for cutting the fabrics), and the average of three test results was reported.
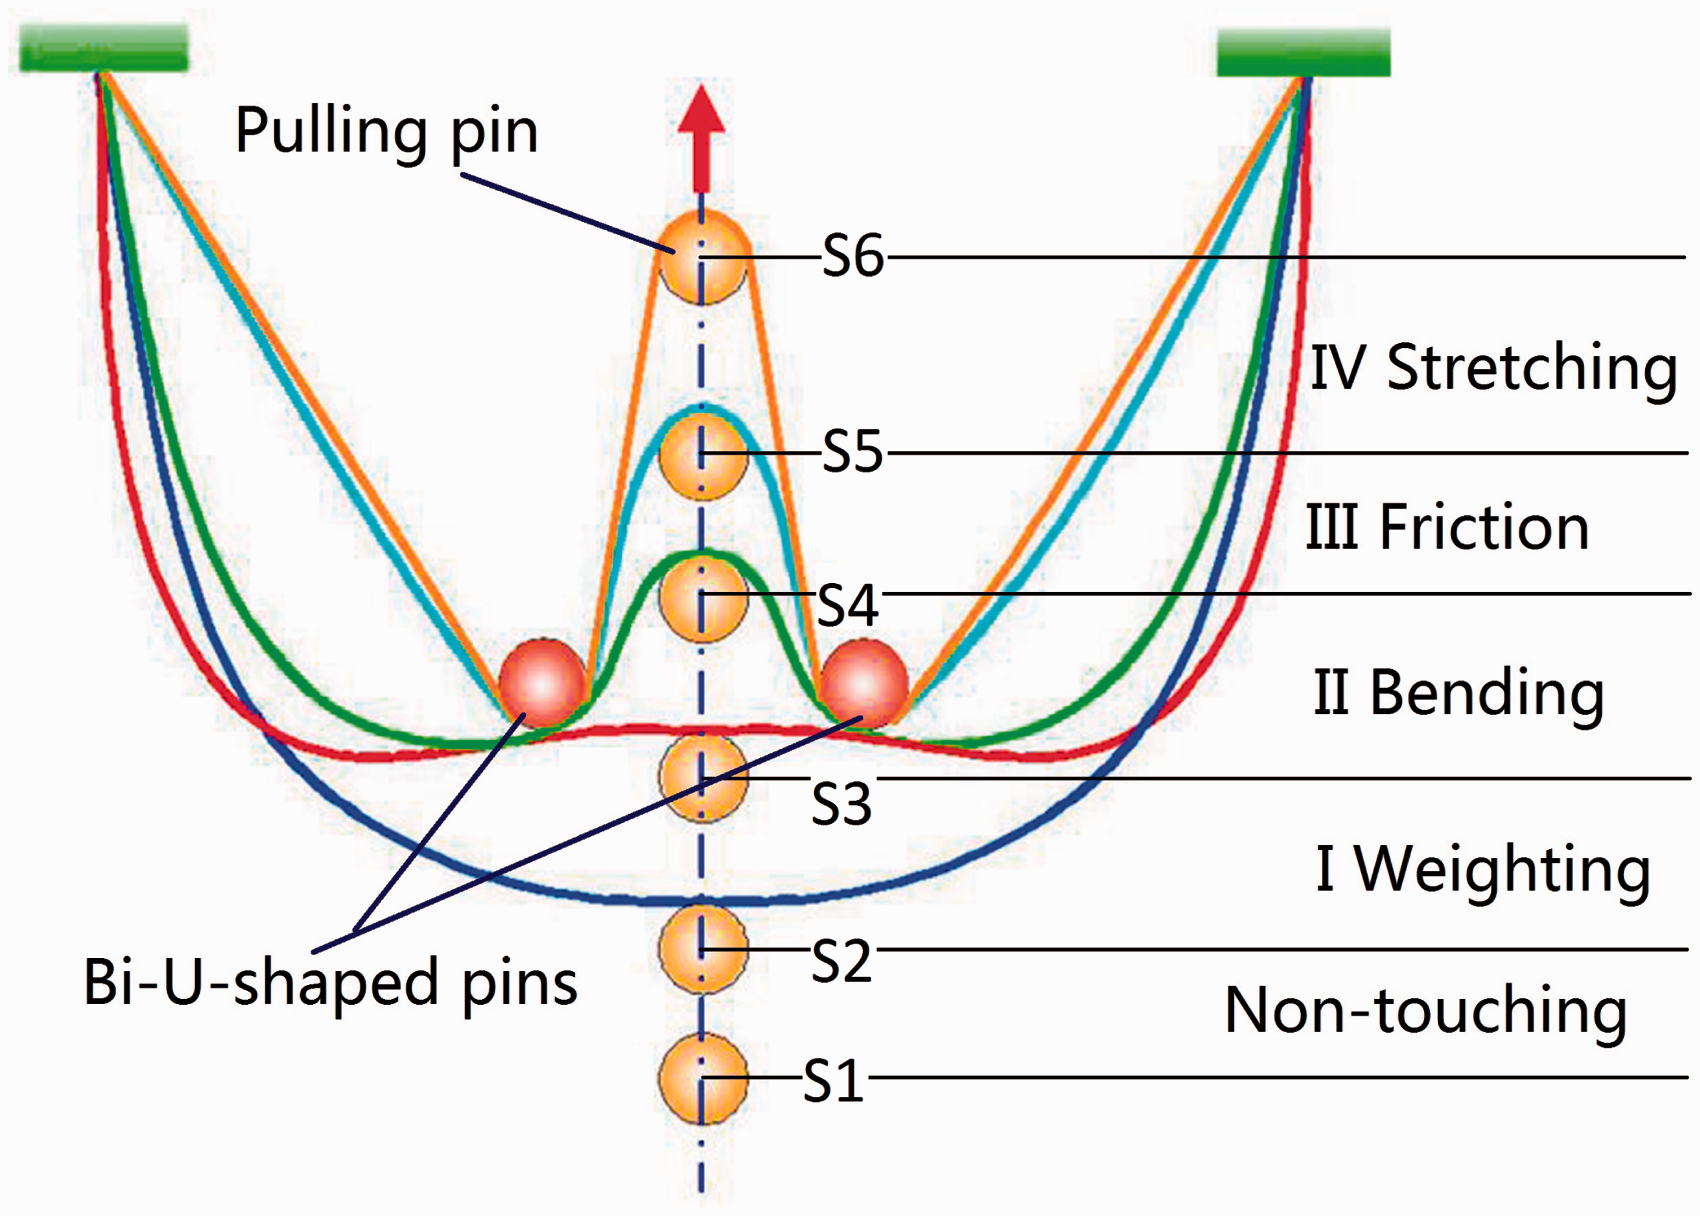
During the testing, the pulling pin is driven by a micro-step motor to move up, pulling a sample through the interval of the bi-U-shaped pins. The whole pulling-out process can be divided into four steps in terms of the deformation features of the sample in order to characterize the weight, bending, friction, and tensile/shearing properties of the sample, respectively (see Figure 2).
Pulling-out process of the CHES-FY system. Non-touching step is from state S1 to state S2; weighting, bending, friction, and stretching steps correspond to state S2 to state S3, state S3 to state S4, state S4 to state S5, and state S5 to state S6, respectively.
25
The pulling-out force during the whole process is recorded by the force sensor connecting to the pulling pin. The pulling-out force–displacement curve of the CHES-FY and corresponding four steps are illustrated in Figure 3. Based on the analysis of the sample deformation and the features of the curve pattern, the following curve parameters are defined (see Figure 3): P: peak value, that is, maximum pulling-out force of the bending step;
Pulling-out force–displacement curve and definition of curve parameters. S1: bending slope, that is, fitting slope of rising curve of the bending step; Wa: average mass value, that is, average value of horizontal curve of weighting step; D: peak position, that is, position deflection of the peak value; S2: friction slope, that is, fitting slope of falling curve of the friction step; Fa: average friction force, that is, average value of horizontal curve of the friction step; A1: bending work, that is, area under rising curve of the bending step; A2: friction work, that is, area under falling curve of the friction step; S3: stretching slope, that is, fitting slope of rising curve of the stretching step; A3: stretching work, that is, area under rising curve of the stretching step.
Factor analysis
Factor analysis was used to feature the principal factors, removing the co linearity of the curve parameters in order to determine the stiffness index for effectively interpreting the stiffness handle of fabrics based on the CHES-FY. The curve parameters extracted from each pulling-out force–displacement curve formed a ten-dimensional row vector, and then twenty ten-dimensional row vectors of the tested samples were arranged to obtain a 20 × 10 matrix used for input variables of factor analysis (each column of the curve parameters in the matrix was standardized to have mean = 0 and variance = 1). Kaiser–Meyer–Olkin (KMO) and Bartlett’s tests of sphericity, as well as the Measures of Sampling Adequacy (MSA), were used to verify the assumptions made by the factor analysis. The principal axis factoring extraction method was used to extract uncorrelated linear combinations of the curve parameters based on an eigenvalue greater than 1, and the Varimax method was selected to rotate the factors. SPSS 22 statistics software was used to conduct the factor analysis.
Cantilever test
Peirce’s cantilever test, as the most classic methodology to measure bending stiffness in fabric materials, was used as an objective test in the present work to compare with the testing results of the CHES-FY. During the test, a fabric sample with size of 200 mm × 25 mm in warp × weft was gradually slid over the edge of the splints until the leading edge of the sample touched the inclined plane (OA) of inclined angle θ = 41.5° according to the ASTM standard D1388-14e1, and the overhanging length L was measured (Figure 4). Thereafter, the bending length c, which was used to characterize the stiffness of fabrics, was obtained using the equation c = 0.51L.
Schematic of cantilever test and relevant parameters.
Dual subjective/objective assessments
A dual subjective/objective assessment method was also used in this paper to evaluate fabric’s stiffness handle and to compare with the measurement results of the CHES-FY.
Five experienced assessors were employed to independently assess the stiffness handle of the fabric samples. Each assessor was asked to pinch the fabric using their thumb and index fingers to feel the tactile resistance force, very similar to the general process that consumers use to assess a fabric’s stiffness when purchasing cloth. Meanwhile, a FlexiForce sensor was attached to the assessor’s thumb and finger to record corresponding resistance force (see Figure 5). The resistance force recorded by the force sensor was transferred to the computer by an AT510 electric resistance tester. In the assessments, the pinching position was determined by setting the center of the FlexiForce sensor 1 cm away from the bending edge of the fabric, that is, d = 1 cm (Figure 5). In each pinching process, the assessors were asked to gently bend a fabric for 2 seconds, and then release the fabric over 2 seconds; so it took about 4 seconds to complete one pinching cycle. The maximum resistance force was recorded during the pinching, and an average of five forces was reported. Also the assessors gave their judgments of the stiffness of the corresponding samples by scoring 1 (very stiff) to 10 (very soft) based on their subjective feelings. Thereafter, the twenty fabrics were ranked in soft-to-stiff order by the scores. The Kendall’s coefficient of concordance was employed to check the agreement among assessors in the subjective assessment. It should be pointed out that the tests by the CHES-FY, cantilever method and dual subjective/objective assessments were conducted by using the same direction of the samples.
Schematic illustration of the setup for testing tactile resistance force.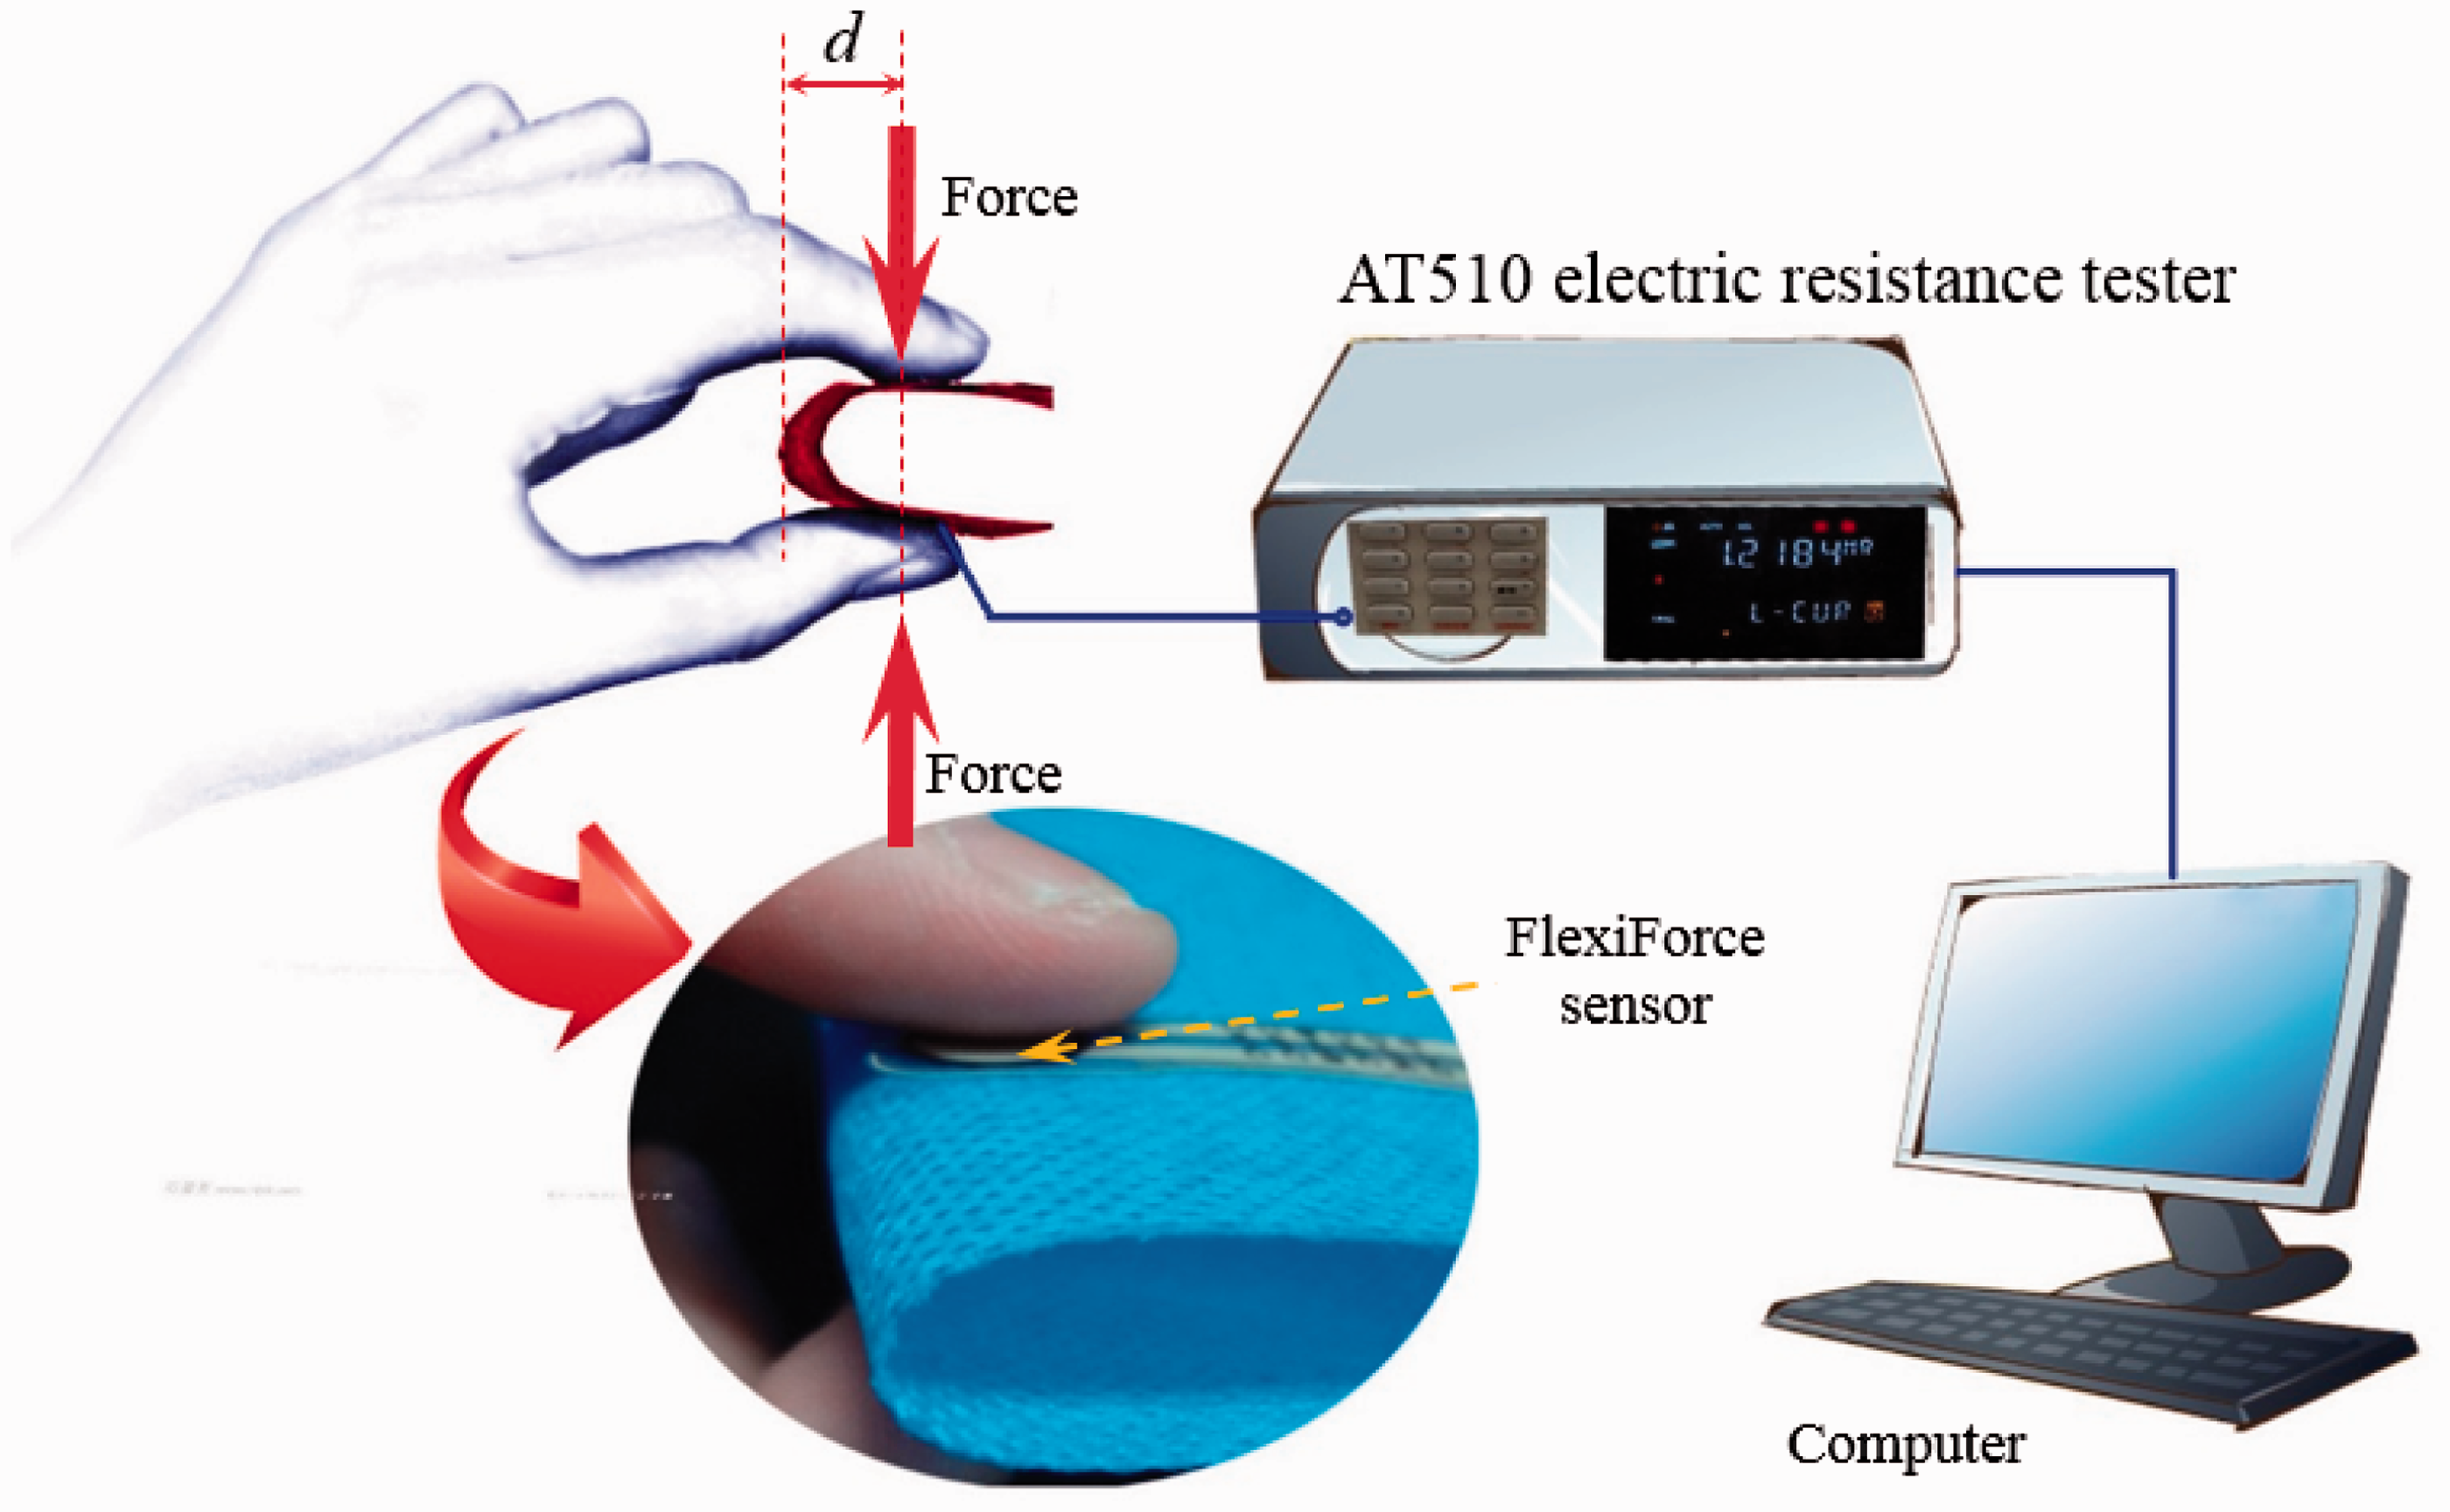
Results and discussion
Determination of principal factor for stiffness handle assessment
Statistics results of the ten curve parameters
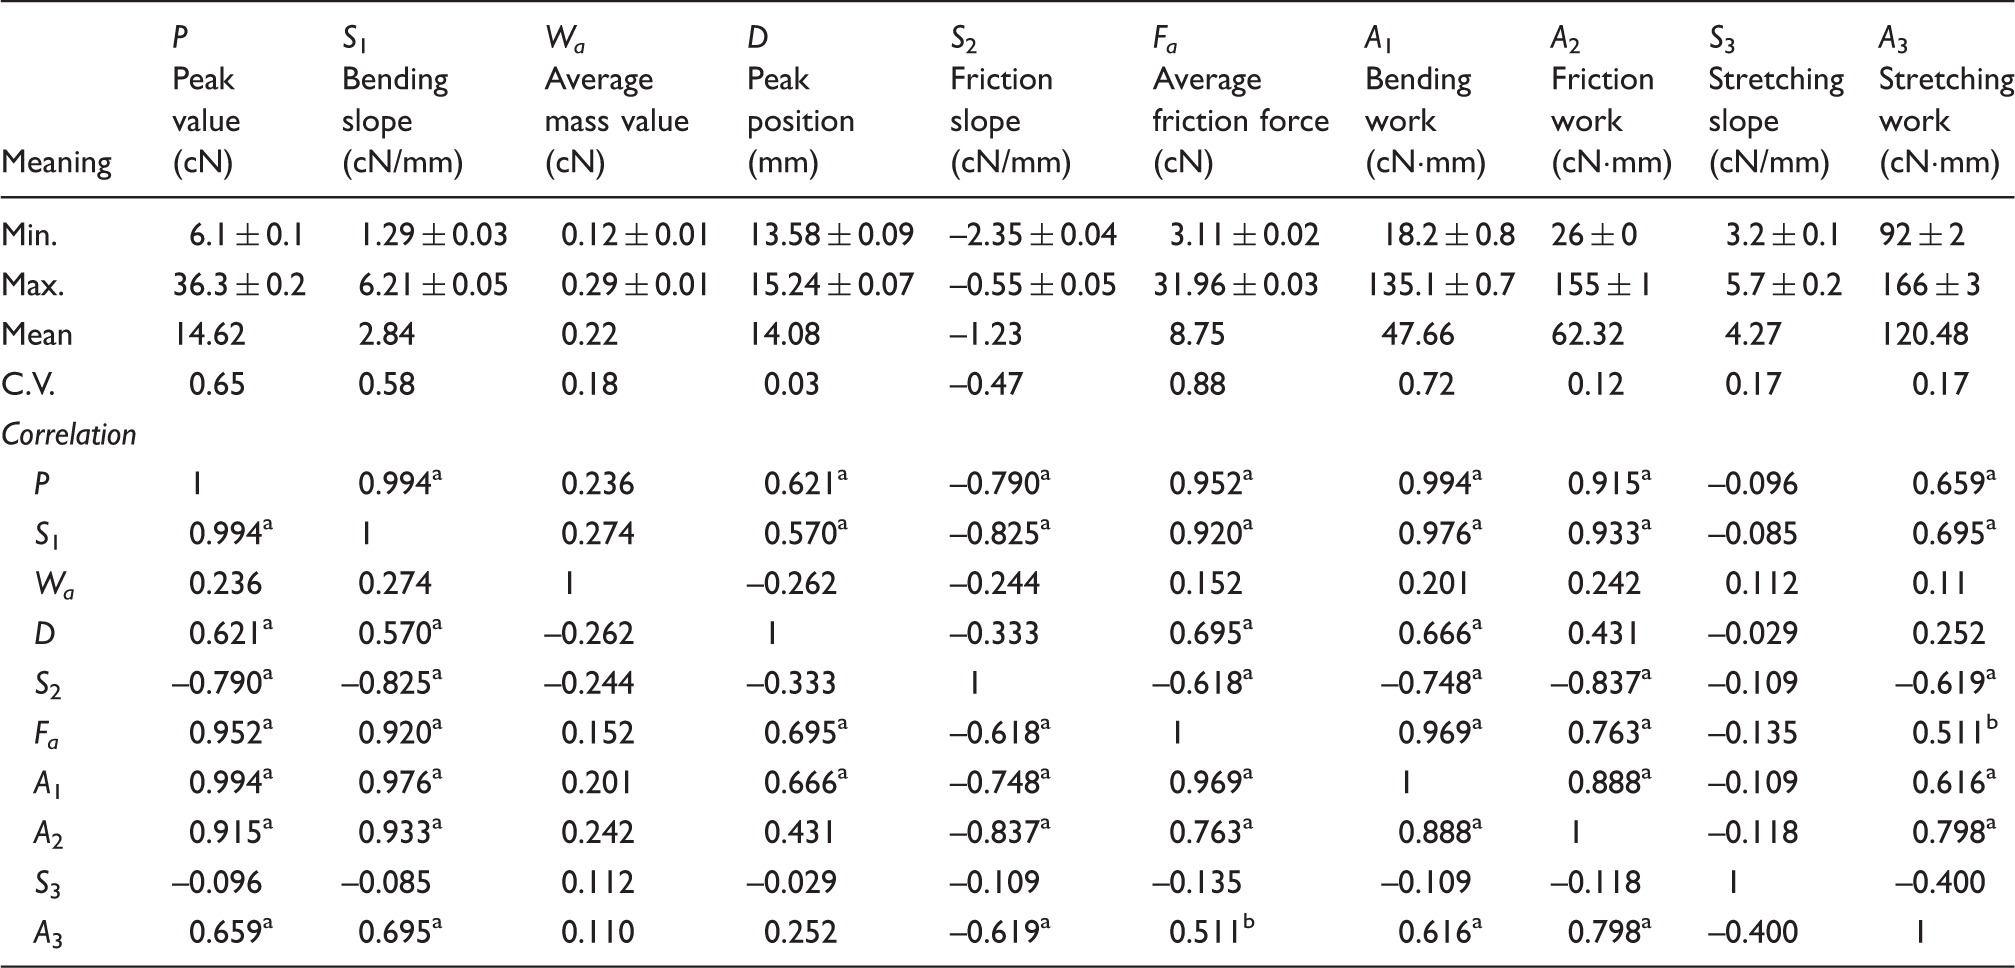
Correlation is significant at the 0.01 level.
Correlation is significant at the 0.05 level.
As expected, some of the curve parameters are highly correlated with each other. Therefore, factor analysis was used to remove the co linearity and to determine the principal factor in order to evaluate the stiffness handle of fabrics with good robustness. Statistics tests for factor analysis were conducted. The MSA values of the curve parameters were higher than 0.7, and the reasonably high KMO measure (0.661) of sampling adequacy and low p-value (<0.001) of Bartlett’s test of sphericity indicated that the factor analysis could be conducted in the data set of the extracted curve parameters. As a result, the first three factors, explaining 87.53% of the total variance of the curve parameters, were selected as the three principal factors (Figure 6), where the first factor explained 61.46%, the second factor 14.04%, and the third factor 12.03%.
Total variance of the curve parameters explained by extracted factors.
Loadings of the curve parameters to the three rotated factors

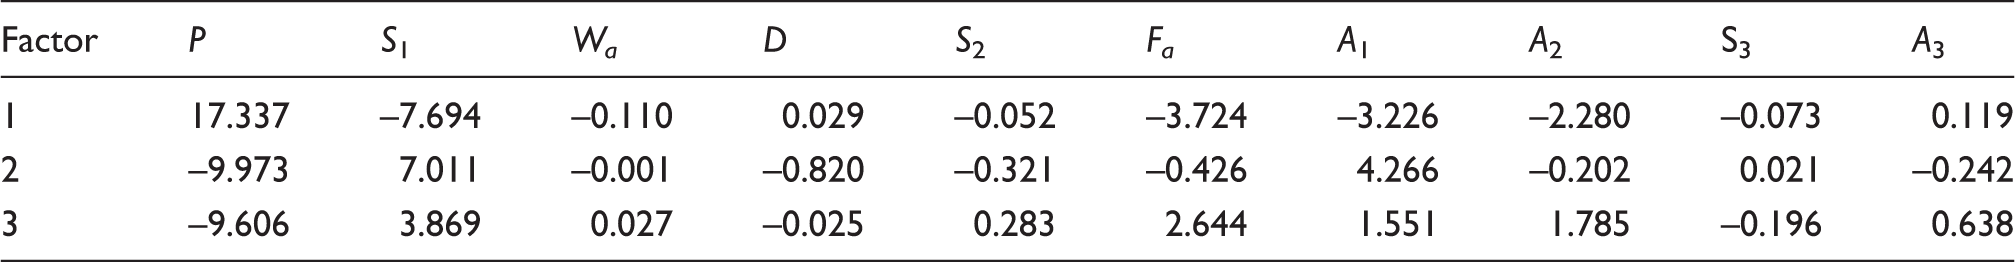
Factor score coefficients with respect to the curve parameters
Comparisons between the CHES-FY test and cantilever test
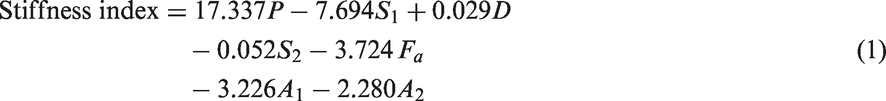
Using the score function of the stiffness index (equation (1)), the scores of the stiffness index of the twenty samples were calculated, and the relationships between the scores and the bending length measured by the cantilever test are shown in Figure 7.
Comparisons between scores of stiffness index and the bending length.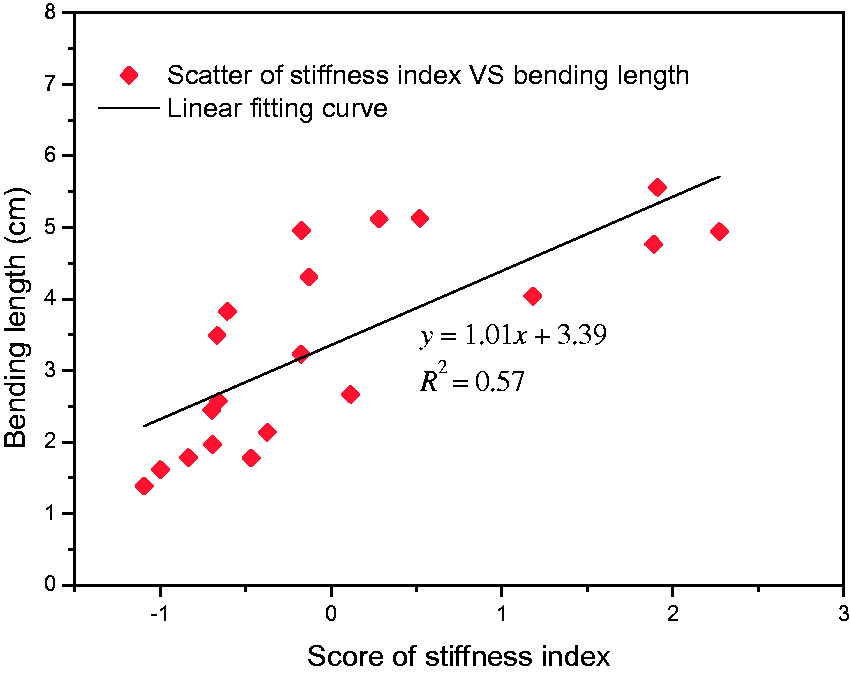
It can be seen that there exists an approximate linear relationship between the stiffness index and the bending length, with determination coefficient (R2) of 0.57. This further states that the stiffness index (i.e. score value of the first factor obtained by factor analysis) is related to the bending property, and can be used to evaluate the bending stiffness of fabrics, although there exist errors for some samples (Figure 7), which may be due to the fact that the stiffness index describes the stiffness handle characteristic that has been proved to be affected by multiple mechanical properties of the fabrics, besides the bending property; however, the bending length mainly reflects the fabric properties associated with bending rigidity.
Comparisons between the CHES-FY test and Dual subjective/objective assessments
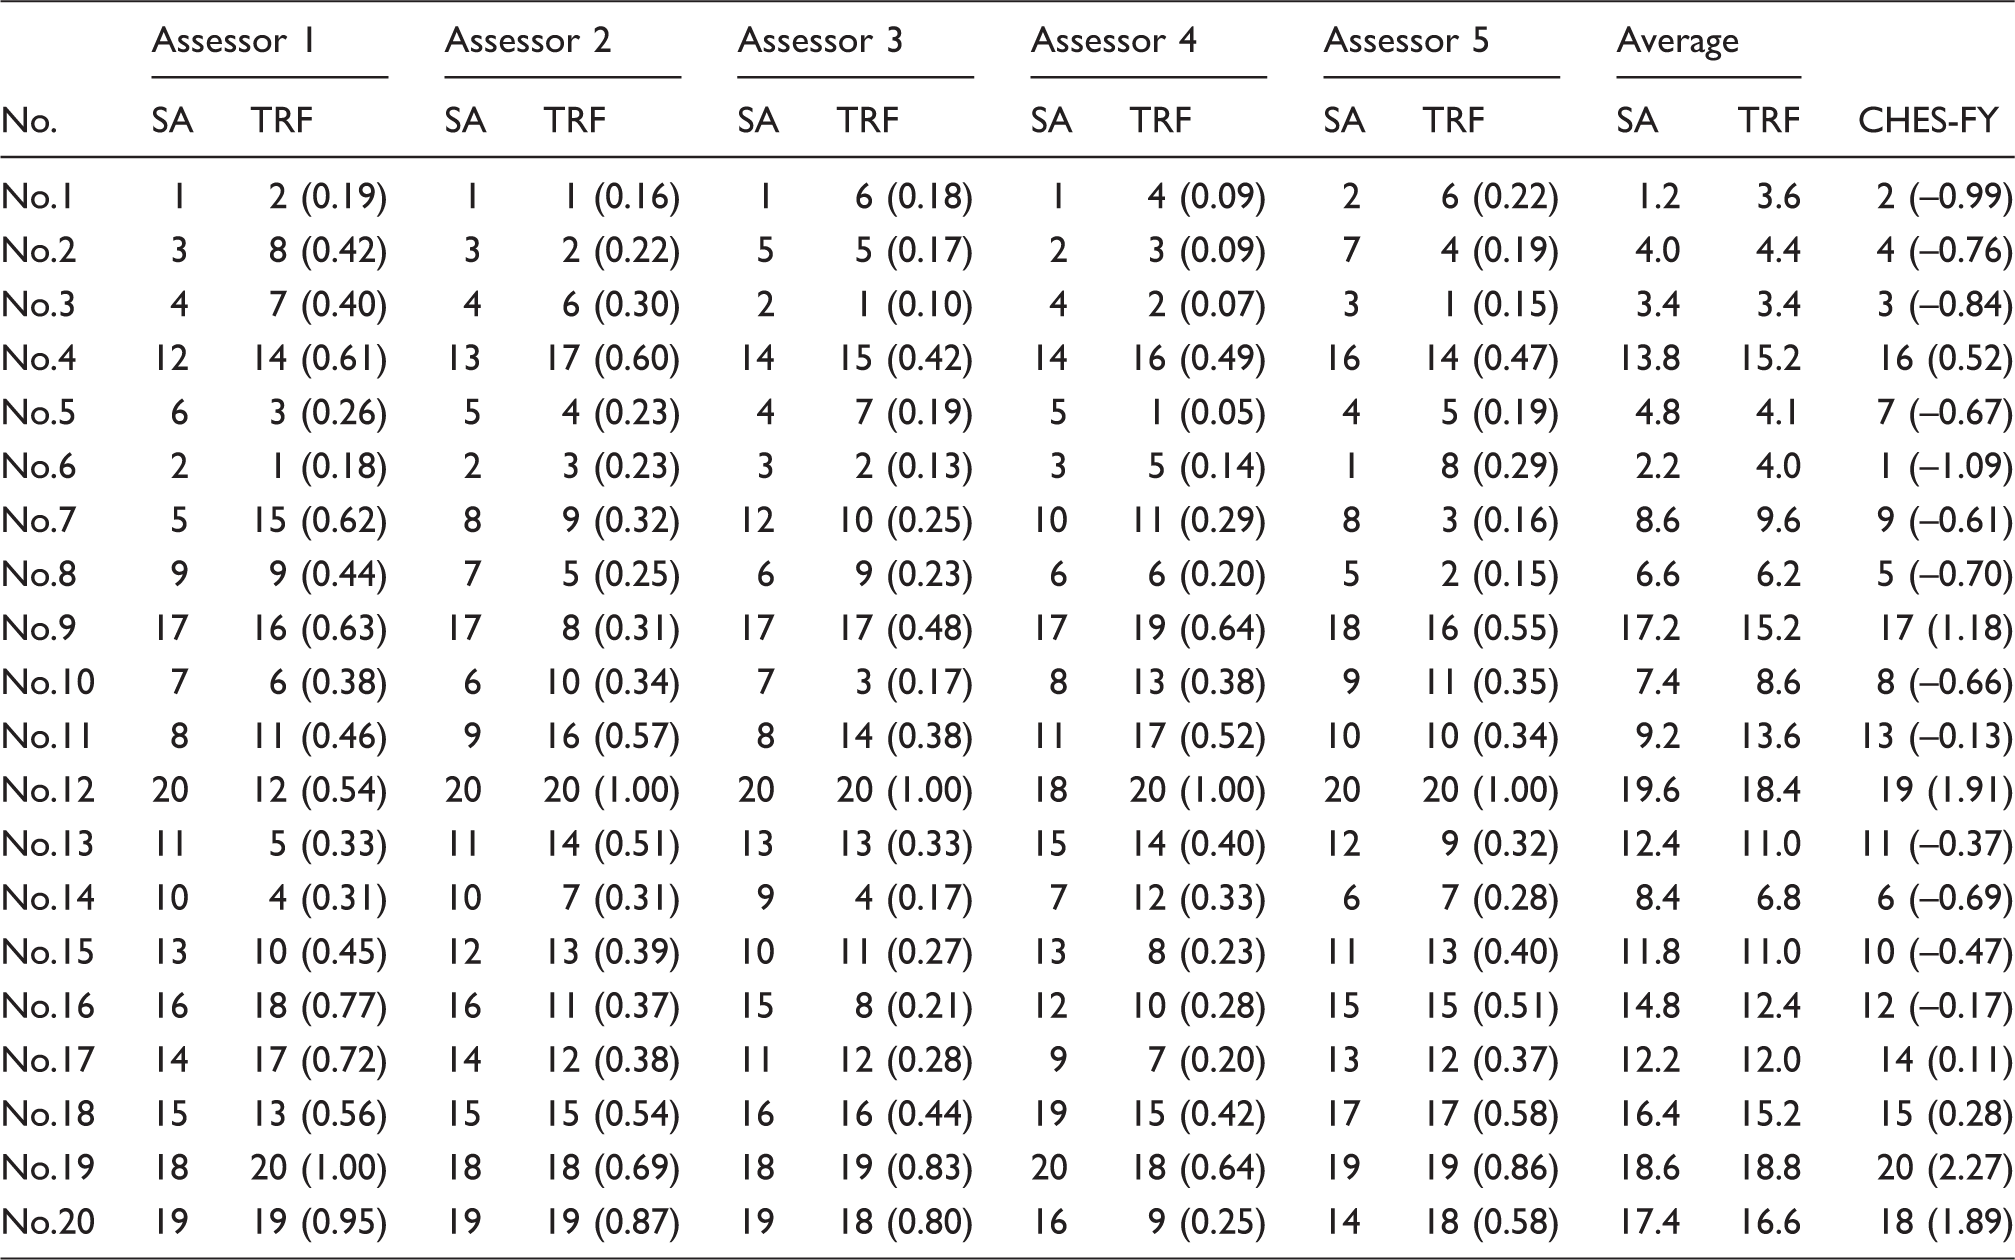
Ranking scores of stiffness handle assessed by subjective assessment (SA), tactile resistance force sensed by the FlexiForce sensor (TRF), and the CHES-FY; the values in brackets are normalized force value recorded by the sensor and scores of the stiffness index by the CHES-FY
Correlation analysis between ranking scores of stiffness handle assessed by subjective assessment (SA), tactile resistance force sensed by the FlexiForce sensor (TRF), and the CHES-FY
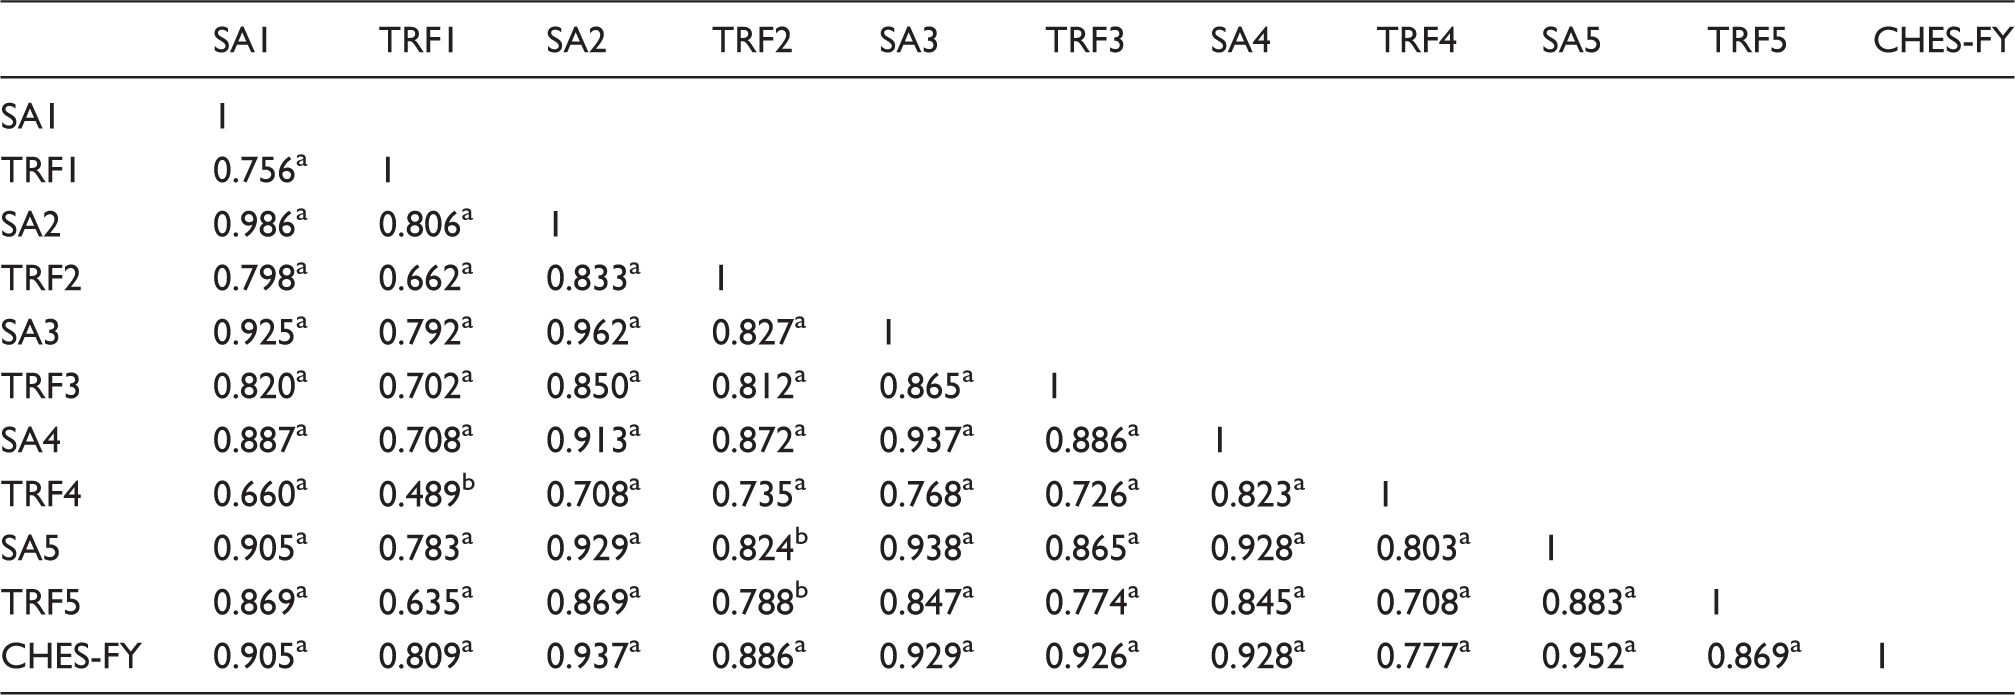
SAi and TRFi represent the results from ith assessor;
Correlation is significant at the 0.01 level;
Correlation is significant at the 0.05 level.
Figure 8(a) illustrates comparisons of the average ranks of the five results of the subjective assessments and tactile resistance forces with the rank by the CHES-FY. There exists good coincidence in shape and trend of the three polylines, which further indicates that the CHES-FY can provide good predictions of fabric stiffness handle by simulating the pinching process when human assess fabric’s handle. Moreover, the good correlations with coefficient of determination R2 between tactile resistance force and the CHES-FY evaluation at 0.952 and between subjective assessment and the CHES-FY evaluation at 0.911 proves that the CHES-FY is feasible to characterize the stiffness handle of fabrics effectively (Figure 8(b)).
Comparisons (a) (the lines are only guides to the eye) and correlations (b) of ranks of tactile resistance force (TRF), subjective assessment (SA), and the CHES-FY.
Conclusions
Ten curve parameters, reflecting the main features of the pulling-out force–displacement curve of the CHES-FY, were extracted and defined. In order to better characterize the stiffness handle of fabrics, factor analysis was used to remove the co linearity of the curve parameters. As a result, three principal factors were determined, which explained 87.53% of the total variance of the ten curve parameters. The first principal factor, explaining 61.46% of the total variance of the curve parameters, was significantly correlated to the curve parameters P, S1, S2, A1, A2, and Fa that were associated with the bending property of fabrics, as well as D and A3,based on loadings of the curve parameters to the rotated factors, which meant that the first principal factors play a dominant role in predicting the stiffness handle of fabrics; this was termed the stiffness index. Moreover, comparisons between the stiffness index and results of the cantilever test showed that the stiffness index was significantly correlated to the bending length, with the determination coefficient of linear relation of 0.57, and could be used to evaluate the bending stiffness of fabrics. Comparisons between the stiffness index and results of the dual subjective/objective assessments were also conducted. The good correlations of the stiffness handle ranks between the CHES-FY and dual subjective/objective assessments proved that the CHES-FY, together with the stiffness index determined by factor analysis, provides a fast and effective method to characterize the stiffness handle of fabrics. It was also presumed that the CHES-FY closely simulated the evaluation process of stiffness handle by human touch and pinch of a fabric.
Footnotes
Declaration of conflicting interests
The authors declared no potential conflicts of interest with respect to the research, authorship, and/or publication of this article.
Funding
The authors disclosed receipt of the following financial support for the research, authorship, and/or publication of this article: This work was supported by National Natural Science Foundation of China projects (grant number 11272086 and 51203022), the Fundamental Research Funds for the Central Universities (grant number 2232014A3-02 and CUSF-DH-D-2016006), the “DHU Distinguished Young Professor Program (grant number B201307)”, and Fok Ying Tung (huoyingdong) Education Foundation (grant number 151071). The authors are grateful to the China scholarship council (CSC) for the scholarship (grant number 201506630046) provided to the first author for his stay at Deakin University, and supported by the National Key Research and Development Program of China (Grant No.2016YFC0802802).