
Abstract
Thermal comfort, an important factor when designing fabric, is strongly related to heat transfer in the fabric. Fabric is not homogeneous because the constituent yarns are interlaced at a certain weave angle, and the contact area between yarns varies. Therefore, heat transfer along the yarn in the fabric is not yet well understood. In this study, we developed a heterogeneous fabric model in which heat transfer along the longitudinal and transverse directions of the yarn is treated independently, and proposed a method for estimating the contact heat transfer coefficients for yarns. The geometrical fabric structure was constructed based on the cross section of three fabrics observed with a three-dimensional microscope. The parameters used were the mass density, specific heat, and thermal conductivity of the fibers and air. The heat flow calculated using the model was compared with that measured experimentally. Fairly good agreement was observed, verifying the validity of this heterogeneous model. The simulation results indicated that when the anisotropy of the fiber thermal conductivity is high, heat is transferred significantly faster along the longitudinal direction than along the transverse direction of the yarn, and the equilibrium temperature distribution is strongly influenced by heat transfer in the longitudinal direction.
Clothing plays a crucial role in thermal comfort by creating a barrier between the human body and the environment, 1 and by appropriately regulating the degree of heat exchange between the two. 2
The heat transmission through fabric is complex due to the nature of fibrous material such as effect of air and the interwoven structure of fabric.3–5 Fabric consists of individual yarns that are interlaced at a certain weave angle, the contact area between the yarns varies, and the entire structure contains a large fraction of air. The internal structures of three-dimensional (3D) textiles have been characterized by using 3D image analysis, mainly based on micro-computed tomography (micro CT).6–14 The 3D images are often used to verify the textile composite structure. However, due to the limited resolution of the CT data, the resulting 3D structural models are insufficiently detailed to allow accurate calculations of heat transfer to be performed.
When heat transfer in fabric has been studied theoretically, the fabric has been considered to have a homogeneous structure,15–17 and the formulas used to calculate the thermal conductivity and thermal resistance were the same as those for any other homogeneous material. 18 Although the results obtained by this approach are clearly limited, they are still useful for determining bulk material constants.
Heat and moisture transfer have been also studied using numerical simulations for multilayer textile, 19 porous clothing assemblies. 20 In a mathematical model,21,22 heat and moisture transfer in textiles are described with several assumptions for the moisture sorption process. The application of this model was limited for the inaccuracy of these assumptions. This model was further improved and used to find a relationship between the moisture regain and the relative humidity and temperature of the surrounding air. 23 Li and Zhu proposed a continuum model to analyze the simultaneous heat and moisture transfer in porous textiles with phase change materials (PCMs). 24 The thermal buffering effect of the PCM was simulated by using the finite volume method. Fan et al. also developed a splitting semi-implicit finite volume method to solve a set of nonlinear convection-diffusion-reaction equations. 25 In their model, the heat and moisture transfer in clothing assemblies was simulated and the heat/convection and conduction/diffusion as well as phase change were taken into account.
In previous studies, the fabrics were regarded as general fibrous porous media and the influence of the heterogeneous internal weave structure was ignored. Recently developed textile manufacturing equipment can produce very complex structures using advanced materials. Such textiles can consist of various yarns with different thermal properties, combined in a sophisticated weave structure. There have been many experimental studies into the effect of internal structure on the thermal properties of fabric,26,27 but these have been very time-consuming and of limited use in developing new textiles. Also, they did not take into consideration heat transfer along weaved yarn.
In the present study, a new procedure was developed for separately calculating heat transfer along the warp and weft yarns using the finite element method (FEM). The FEM model used accounts for the space between individual yarns and the contact area between the warp and weft yarns. The time evolution of heat transfer in the longitudinal and transverse directions was then simulated. In addition, using a combination of simulation and experiment, the contact heat transfer coefficients for the yarns were estimated. This simulation process is important to choose the most suitable yarn for the required fabric thermal properties design.
Procedure
Figure 1 shows the procedure used to construct the heterogeneous model and simulate heat transfer in the fabric. We started with a single-layer fabric and later extended the model to analyze multilayer fabrics. For this analysis, Marc Mentat FEM software was used.
Procedure for constructing heterogeneous model and simulating heat transfer.
Heterogeneous heat transfer model for a single-layer fabric
This model considers two types of conductive heat transfer: (1) transfer along the longitudinal and transverse directions and (2) transfer across three contact regions, specifically warp yarn–weft yarn, warp yarn–air, and weft yarn–air. A two-dimensional FEM model was used to investigate the effect of the internal structure of textiles on heat transfer. Figure 2 shows the unit cell in this model, which is repeated to produce a plain weave pattern. A VR-3100 3D microscope (Keyence Corp., Japan) was used to observe the fabric cross section and measure the yarn thickness and cross-sectional shape, the distance between yarns, and the location of the air and fiber regions. These parameters were used to construct the heterogeneous model, in which the yarn had different thermal conductivities along the longitudinal and transverse directions.
Heterogeneous model of warp yarn for FEM analysis.
Estimation of contact heat transfer coefficient
In the weave structure of fabric, there are a large number of contact regions between the warp yarn and the weft yarn. Heat transfer occurs through these contact regions as well as through the air-yarn contact regions. Thus, the effect of yarn-to-yarn contact cannot be ignored. Unfortunately, there is no suitable experimental or theoretical approach for determining the contact heat transfer coefficients for the yarns inside the textile. Therefore, a method is proposed for estimating the contact heat transfer coefficients using a combination of simulation and experiment.
For simplicity, a two-layer FEM fabric model was constructed, as shown in Figure 3. Heat transfer takes place from the top and bottom of the unit cell, with temperatures T1 and T2, respectively, to the interior of the fabric. The thermal resistance of the fabric and air are obtained experimentally. The problem is how to quantify the thermal resistance of the yarn-yarn and yarn-air contacts. The red and yellow areas in Figure 3 represent regions of air and yarn (weft and warp), respectively. Heat loss from the fabric is ignored.
Homogeneous two-layer model for FEM analysis.
Figure 4 shows a schematic illustration of the method used to experimentally determine the thermal resistance of the fabric and interspersed layers of air. Multiple layers of fabric are stacked between two metal plates held at temperatures T1 and T2.
Measurement of thermal resistance of multiple layers of fabric.
The total thermal resistance of the stacked structure (RN) is given by

The temperatures T1 and T2 were set to 30℃ and 20℃, respectively. A force was applied to the upper plate to produce a pressure of 4600 Pa in the sample. This is because the heat flow is influenced by the thickness of samples and the thickness decreases with the increase of pressure and became almost constant at 4600 Pa.
The thermal conductivity (λ) and thermal resistance (R) of the fabric are given by
28


The contact heat transfer coefficient (h) is given by
29

For a heterogeneous single-layer model, the heat transfer coefficient is used in the contact regions between the warp yarn and the weft yarn. For the heterogeneous multilayer models, the contact heat transfer coefficient is also used for multiple layers of fabric.
Heterogeneous multilayer models
Heterogeneous models were constructed to simulate heat transfer in multiple layers of fabric (from two to five layers). Figure 5 shows the FEM models for two-layer and three-layer fabrics. In these models, the cross section of each layer was assumed to be the same as that for the single-layer fabric model in Figure 1.
Models for two layers (a) and three layers (b).
Parameters used in heterogeneous model
Material constants of air and fabric samples
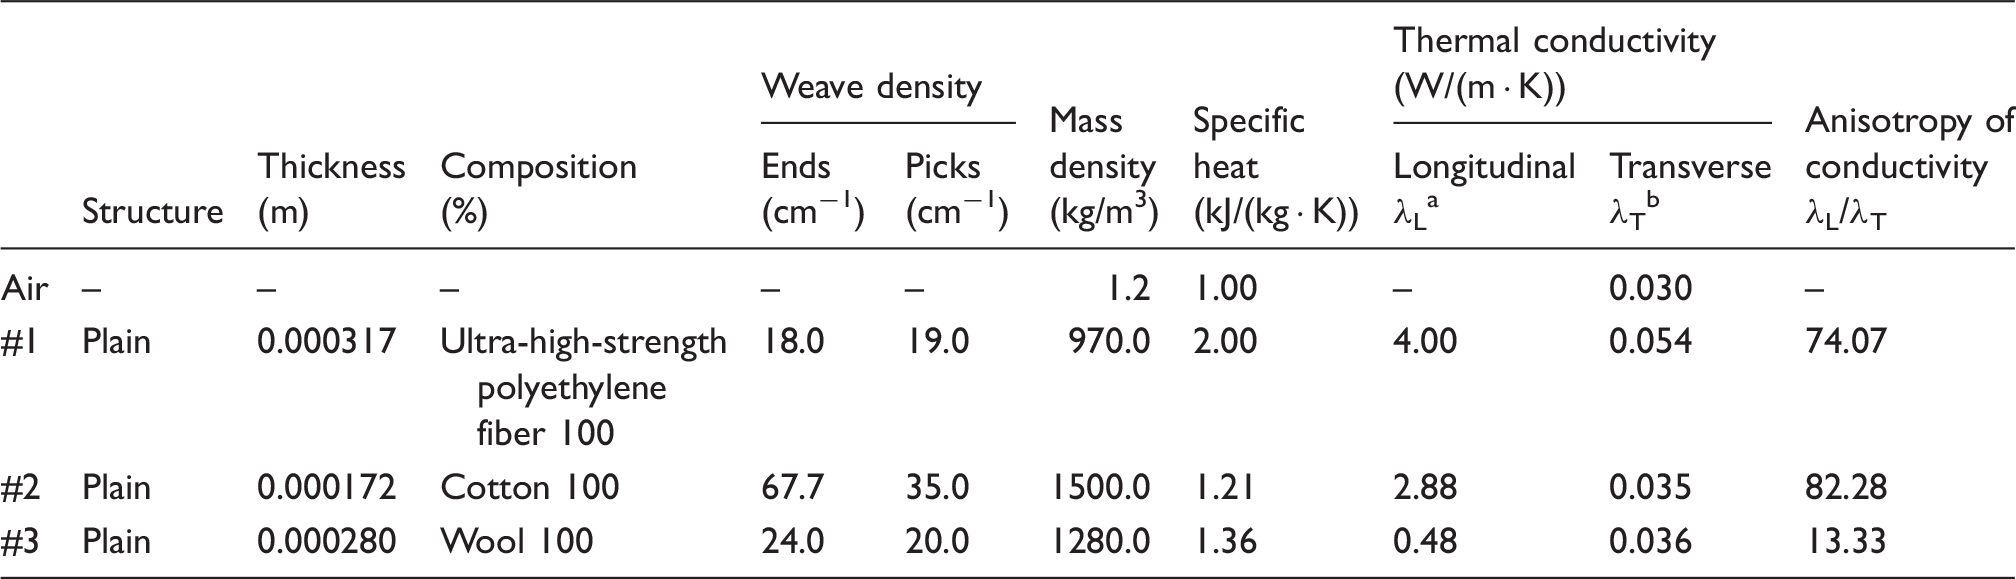
Values of transverse thermal conductivity of yarns obtained by experiment.
Results and discussion
Comparison of heat-flow results from experiments and simulations
Figure 6 shows the heat-flow results obtained from the simulations and experiments for the three samples listed in Table 1. The variation of experimental values were calculated and found less than 1% for all points.
Comparison of heat-flow results from experiments and simulations.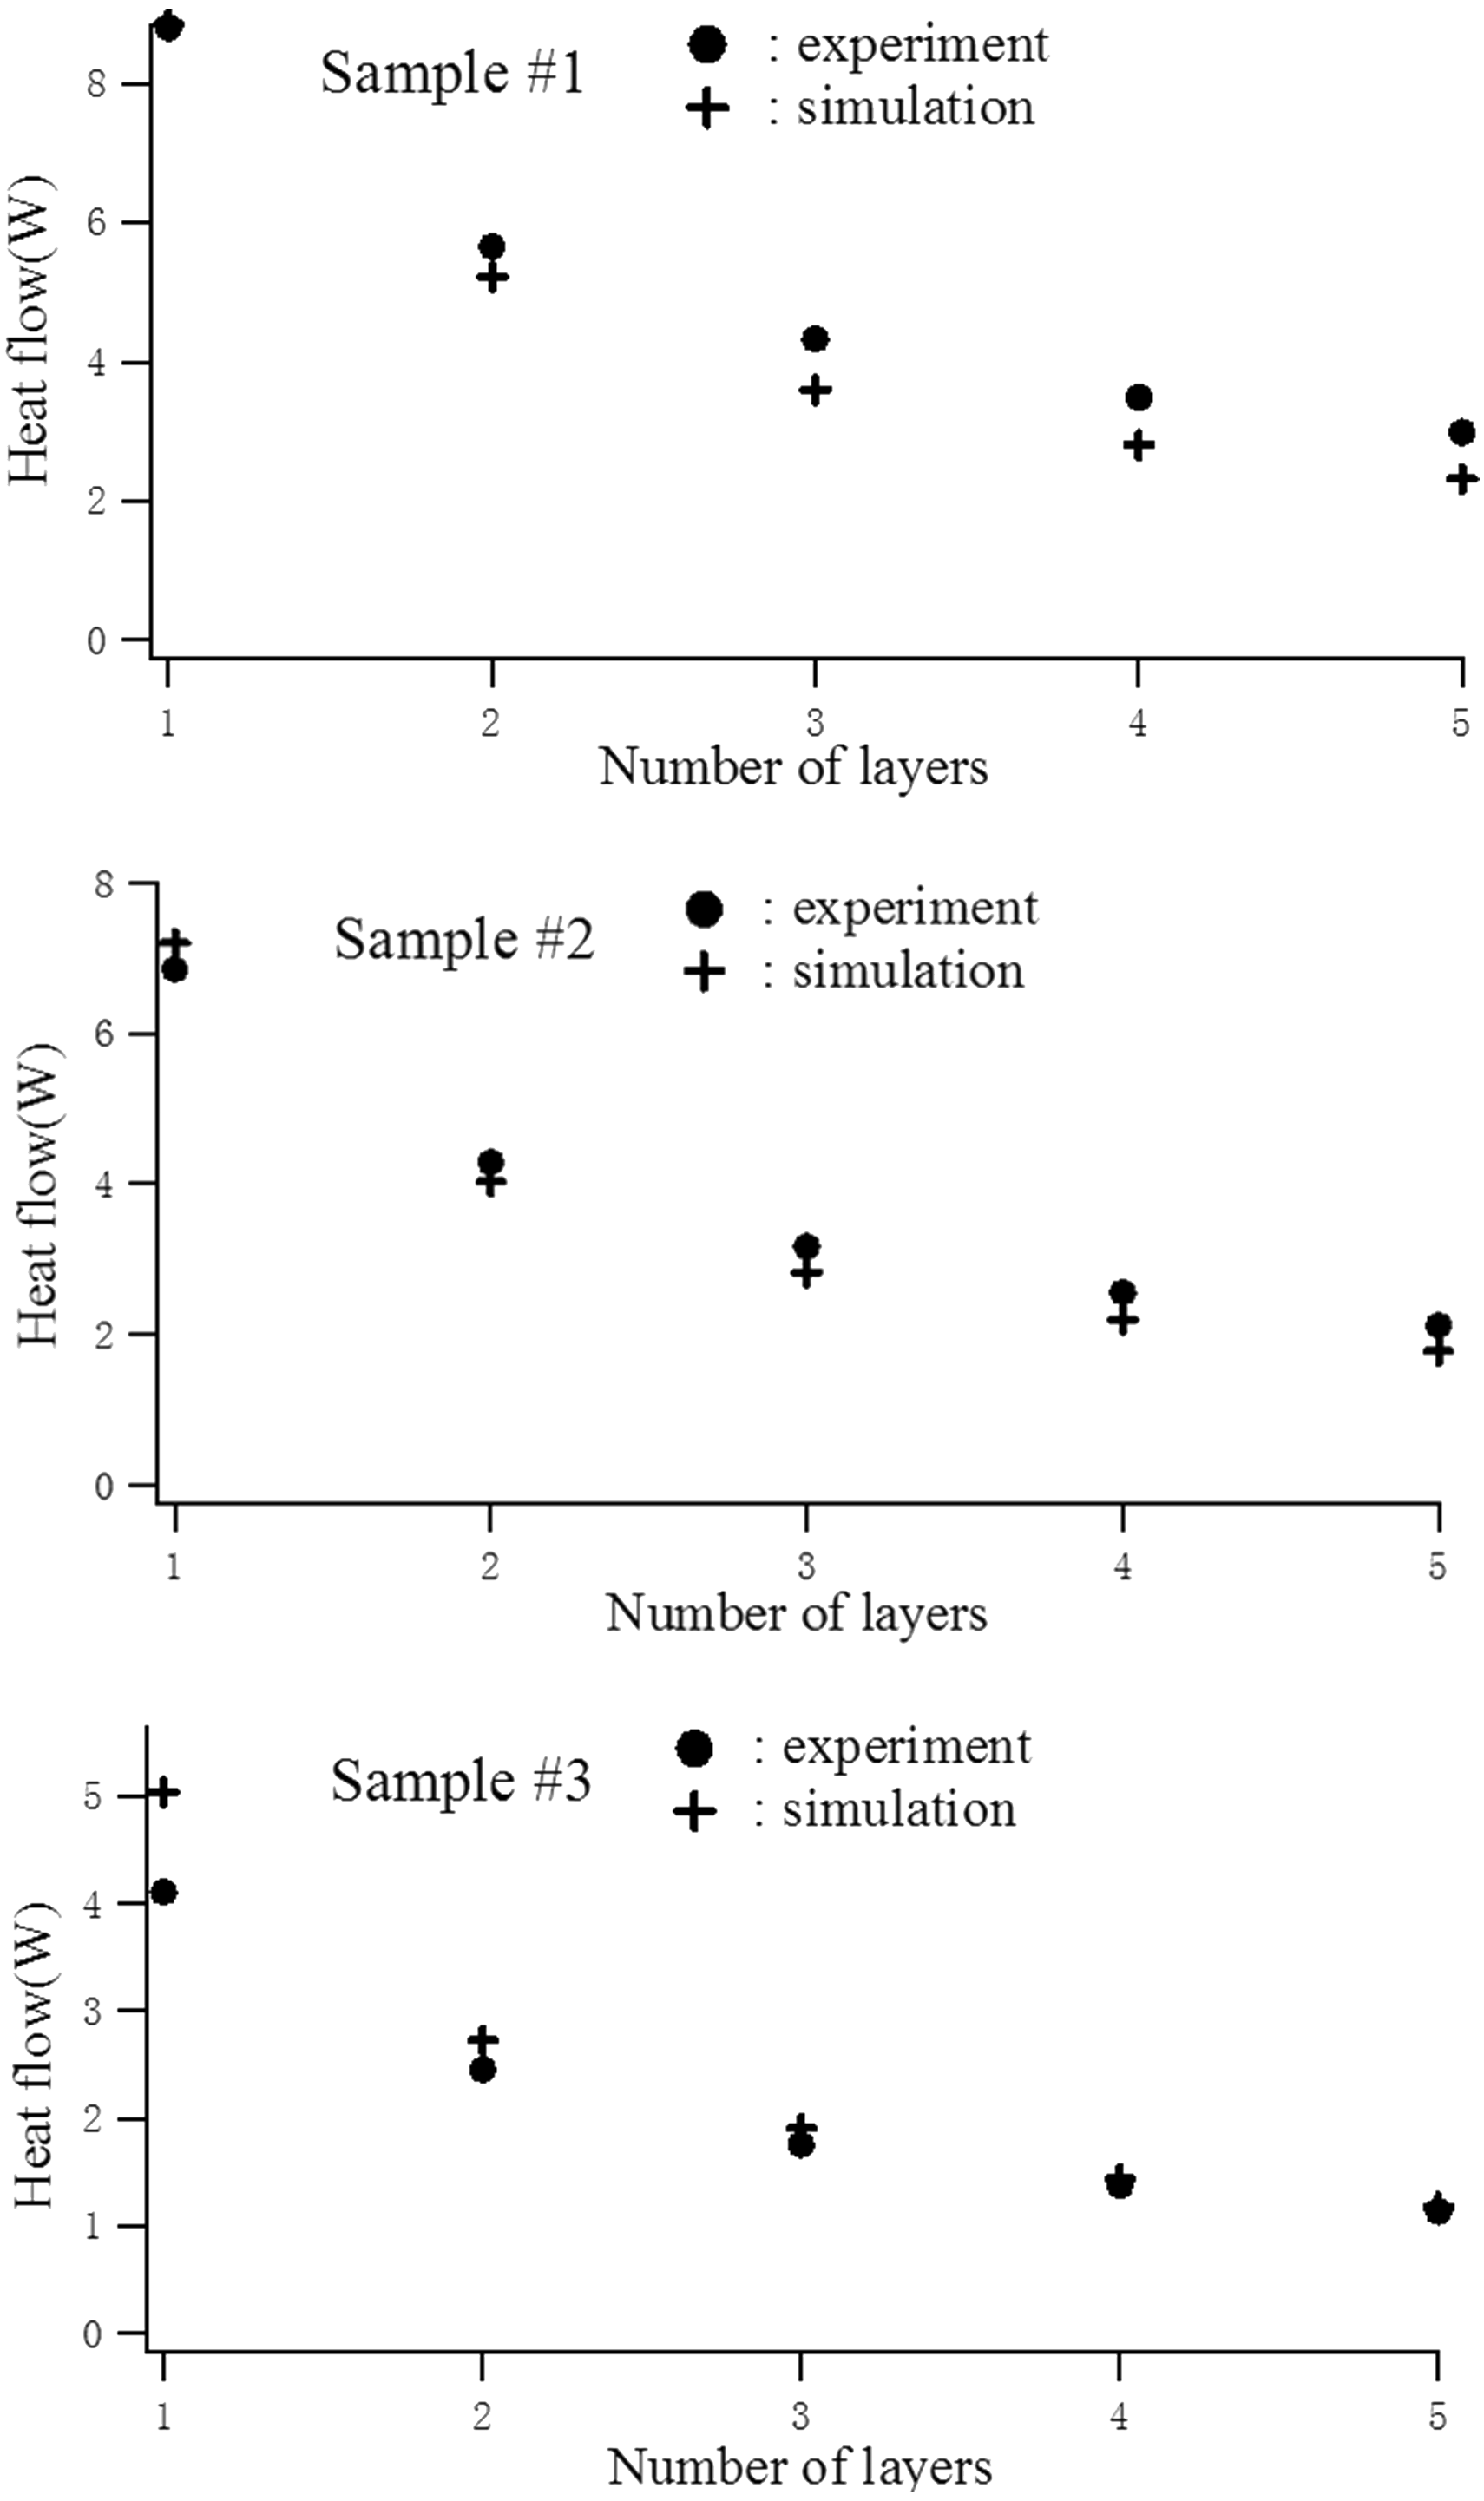
Only a slight difference between experimental values and simulation values is observed in all three samples. The correlation coefficients between the two sets for sample #1, #2, and #3 were calculated and they are 0.999, 0.997, and 0.998, respectively. The good agreement between the two sets of results confirms the validity of the heterogeneous models. The simulated heat flow appears to decrease slightly faster than the experimental values on increasing from one layer to three layers. The difference between simulated and experimental values remains almost the same for 3, 4, and 5 layers. For the real fabric, heat loss from the edges may become more significant as the total thickness increases, whereas in the simulation model, such heat loss is ignored.
Figure 7 shows optical micrographs of the surfaces of the three samples to show the distance between yarns. The total cover factors were calculated.
32
The cover factors of sample #1, #2, and #3 are 0.987, 0.952, and 0.907, respectively. Effect of the air-to-fiber ratio on the heat transfer in the fabrics was taken into account when constructing the FEM models. The results shown in Figure 6 therefore indicate that these models are suitable for simulating heat transfer in fabrics with different weave density and cover factors.
Optical micrographs of sample surfaces.
Temperature distribution in fabrics
There are many factors, which influence on the heat transfer in the fabric. In this model, yarn cross-section shape, yarn count and porosity of the fabric are included as well as yarn thermal conductivity and fabric thickness. Some other fabric properties such as the yarn twist, fabric finishing is not included in this model as parameters. Therefore the fabric thickness and thermal conductivity are discussed as the two important factors for the heat transfer using this model.
The temperature distributions in the fabrics 0.1, 0.2, and 0.3 s after the simulation starts are shown in Figure 8. Heat transfer appears fastest in sample #2; this is because this sample is the thinnest and woven from a relatively high thermal conductivity yarn, as shown in Table 1. Heat transfer is also relatively fast in sample #1 because it has the highest yarn thermal conductivity. The heat transfers slowly in sample #3 because it is thick and woven from a low thermal conductivity yarn.
Change in fabric temperature distribution with time.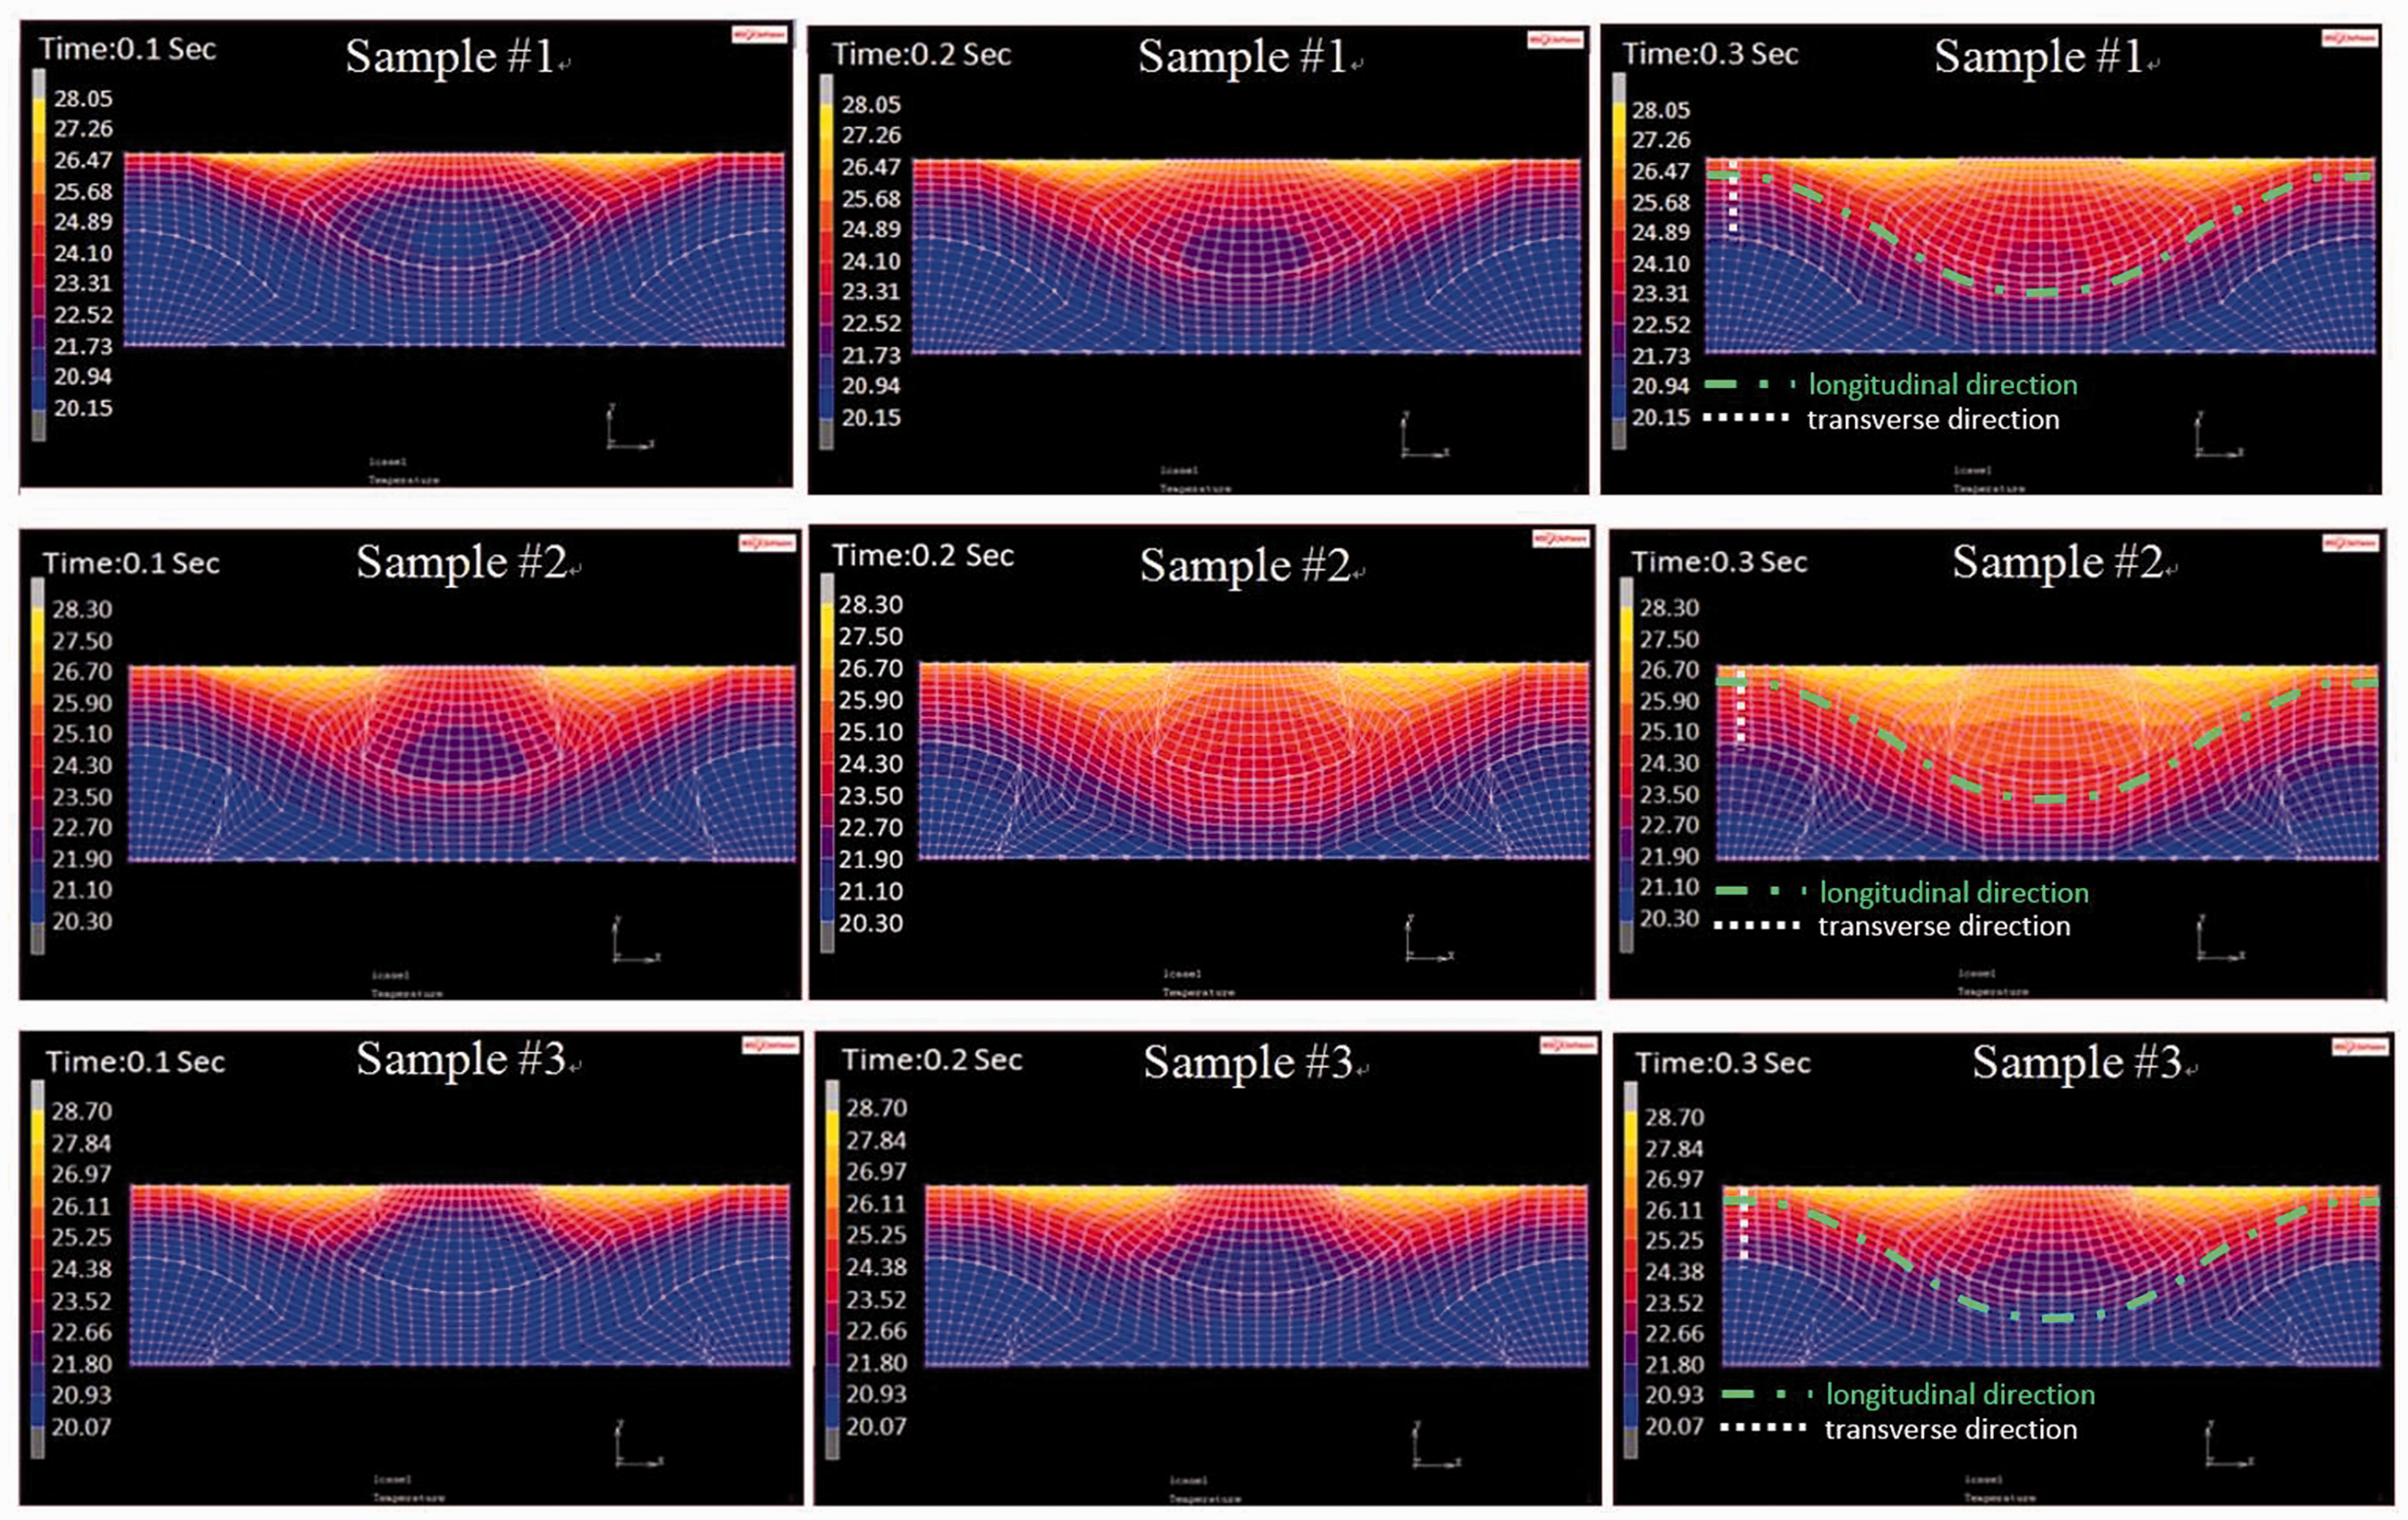
The change in the temperature distribution with time indicates that for samples #1 and #2, heat transfer occurs faster in the longitudinal direction than in the transverse direction of the yarn. At 0.3 s after the simulation had started, the temperature along the longitudinal direction of the warp yarn (marked in Figure 8) reached a temperature around 25℃, while the temperature in the transverse direction is in the range 20.5–28℃. This is because for polyethylene and cotton fibers, the thermal conductivity is much higher in the longitudinal direction than in the transverse direction, the anisotropy values being 74.07 and 82.28, respectively (Table 1). For sample #3, the difference between the heat transfer rate in the longitudinal and transverse directions is smaller, which is due to the lower anisotropy for wool fibers.
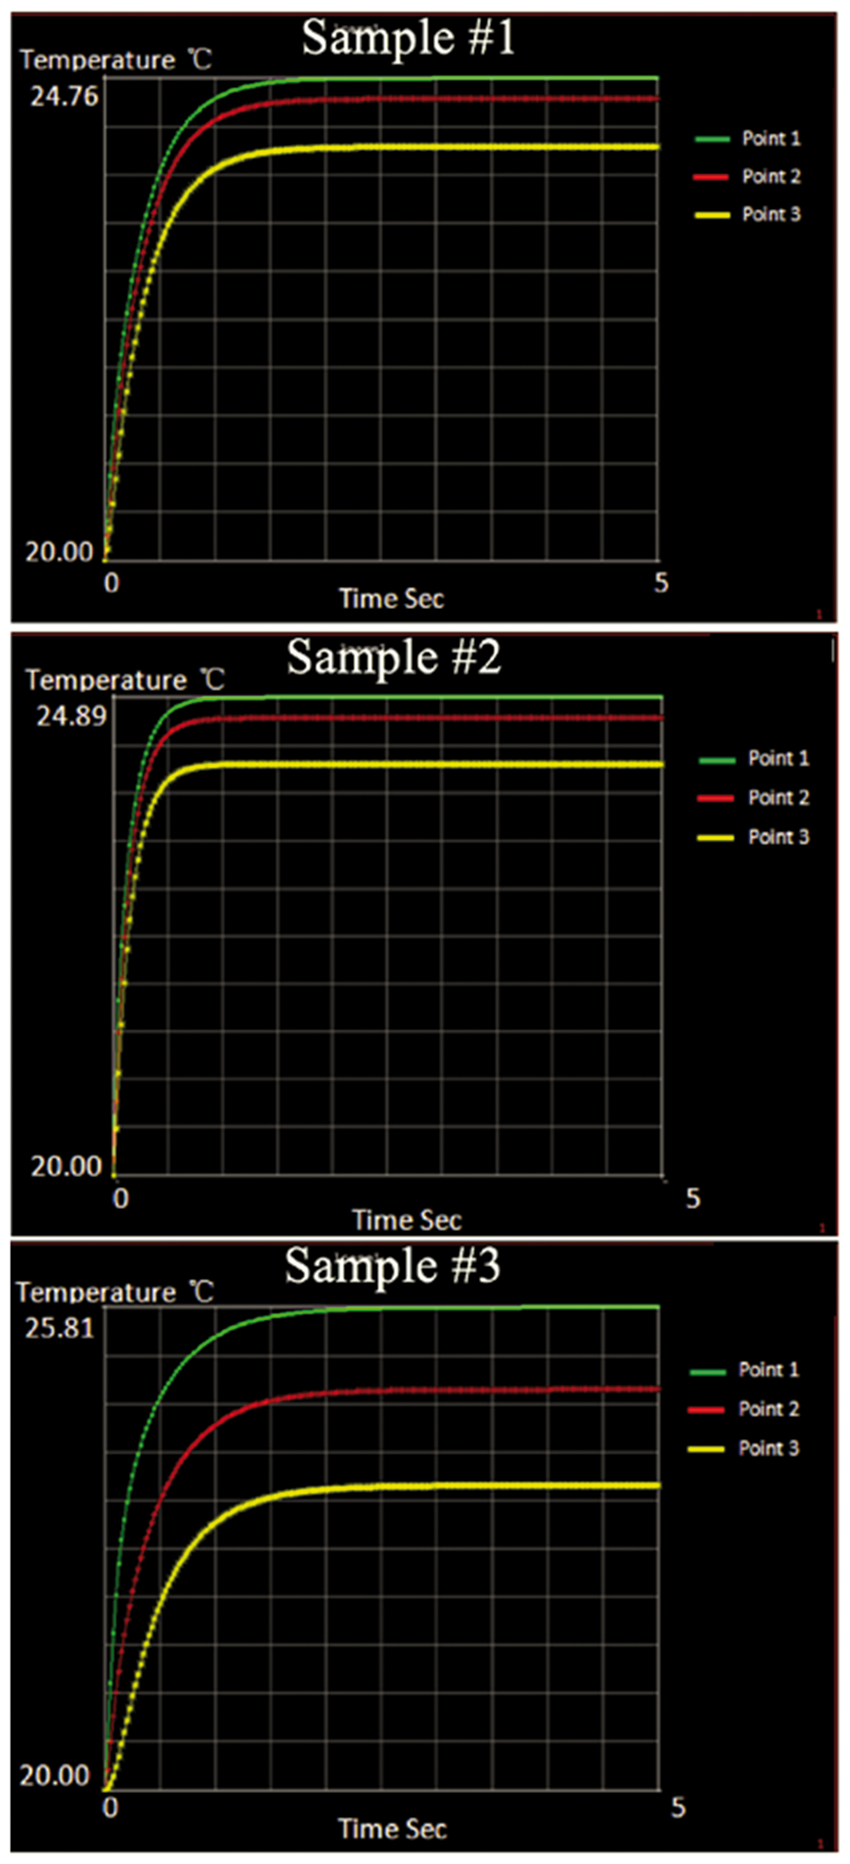
Figure 9 shows the temperature distributions for the three samples when equilibrium had been reached 5 s after the simulations had started. Figure 10 shows the change in temperature with time at the three points indicated by circles near the center of the warp yarn. For samples #1 and #2, the final equilibrium temperatures at these three points are similar, indicating that because of the high thermal conductivity in the longitudinal direction, rapid heat transfer occurs. For sample #3, the three points have very different equilibrium temperatures due to the lower thermal conductivity in the longitudinal direction.
Equilibrium temperature distributions for samples. Variation of temperature with time at points indicated in Figure 9.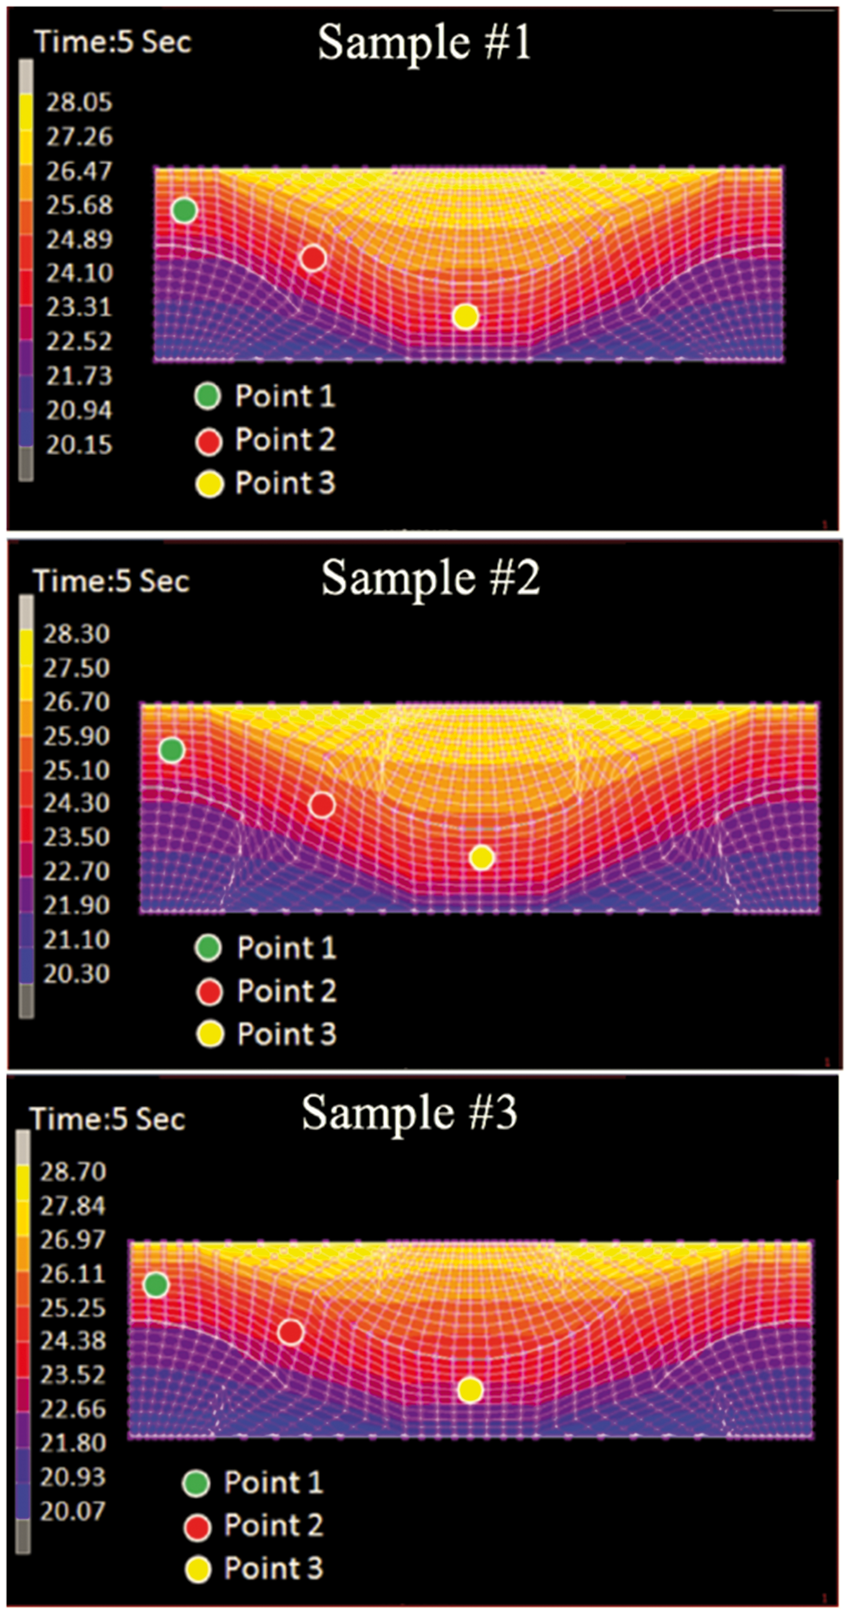
Conclusion
A new heterogeneous FEM model for fabric was developed in which heat transfer processes along the longitudinal and transverse directions in the yarn were treated separately. This is because a yarn has different thermal conductivities along the longitudinal and transverse directions. In the FEM fabric structure model, place of air and fiber area, anisotropy of thermal conductivity of yarns, and the contact heat transfer coefficients for yarns inside the textile were included. The contact heat transfer was estimated by a combination of experiment and simulation using the proposed two-layer FEM fabric model. The results were then used in the heterogeneous model to simulate the heat flow. Fairly good agreement was observed between the calculated and experimental heat flow values, thus verifying the validity of the estimation of contact heat transfer coefficient. The change in the temperature distribution with time was determined for three plain woven fabrics varying the anisotropy of thermal conductivity of yarns. The equilibrium temperature distributions clearly indicated differences between the heat transfer rates along the longitudinal and transverse directions of the yarn due to the high anisotropy of the fiber conductivity. The simulation results indicated that when the anisotropy of the yarn thermal conductivity is high, heat is transferred significantly faster along the longitudinal direction than along the transverse direction of the yarn, and the equilibrium temperature distribution is strongly influenced by heat transfer in the longitudinal direction.
Footnotes
Declaration of conflicting interests
The authors declared no potential conflicts of interest with respect to the research, authorship, and/or publication of this article.
Funding
The authors disclosed receipt of the following financial support for the research, authorship, and/or publication of this article: This work was supported by JSPS KAKENHI grant number 15H01764. Hua Shen also thanks to the supports of scholarship from China Scholarship Council (File No. 201406630006).