
Abstract
In our previous research, a tri-component elastic-conductive composite yarn (t-ECCY) with sophisticated structure was fabricated in one twisting process on a modified ring spinning frame, which employed the elastane filament as a core and the stainless steel filament combined with rayon fibers as a helical winding around the extensible core. Herein, structural assessment in initial and straighten states, a predictive model for the tensile behavior of t-ECCY during stretch, and the micro-morphologies of fractured yarn surfaces under varying strain rates were investigated. The deformation mechanism of coils in t-ECCY is the initial separation of adjacent coil surfaces and gradual unwinding until it is free of coils. The straight-limit level of t-ECCY is mainly dependent upon the geometric disposition of its constituents inside and the elastane draft ratio. No obvious changes were found under cyclic stretch, indicating its compact structure and super elasticity. The essentially nonlinear tensile behavior of t-ECCY was emphasized based on the typical characteristic S-curve and cord method. A modified Vangheluwe–Hook tensile constitutive model by introducing an exponent to the exponential function was proposed to fit experimental curves under varying strain rates, and the ideal analytical equations were obtained by using the genetic algorithm with 1stOpt simulation software for the nonlinear regression with iteration procedures. It was demonstrated that the proposed analytical model can fairly well replicate the stress characteristics of yarn under different strain rates qualitatively and quantitatively. In addition, a sharp break dominates at lower strain rates, whereas a local pull-out break is found at higher strain rates.
Keywords
In recent decades, we have witnessed a huge increase in the use of elastic-conductive composite yarns in practical applications of wearable technology, such as electronic displays, 1 electrodes, 2 strain gauges,2–6 and monitoring. 7 The good acceptance of such yarns fabricated using only physical actions is, to a certain extent, due to the fact that they can avoid several possible limitations including insufficient adhesion, a complex deposition scheme and a large ecological footprint caused by the chemical techniques, and their weavability. Composite spinning, an advanced physical method, is extensively used for fabricating the requested yarns in virtue of structural architecture. Moreover, elastic-conductive spinning techniques and the corresponding composite yarns, which have a great potential for the mass production and fulfill various technical demands, attract considerable attention in both scientific and industrial research communities. However, few investigations can be found on the formation of above yarns using the spinning method.4–6,8–10 Therefore, one of the main purposes of this research is to fill this gap, and make a contribution to the available literature.
Yarn tensile behavior has an important effect on the processability and end-use performance, and its performance is closely related to the yarn structure. Yarns that could be pixilated to matrix-type in the form of fabrics have to experience different mono/multi-cyclic stretching in practical applications. Thus, it is essentially crucial to assess its structure during extension. However, few investigations are related to the progressive deformation mechanism under stretch,11,12 especially helical yarns for large strain and cyclic tests, which is very important for its use stability. Besides, the theoretical models for the tensile curve of textile materials have been a topic of intense research. Ghosh et al. 13 and Ussman et al. 14 presented a modified Vangheluwe model to describe the tensile behavior of ring-spun yarns. Vangheluwe 15 reported a nonlinear Maxwell model to demonstrate the relaxation behavior of warp yarns following cyclic tests. Aksan and Zurek 16 used a model to characterize the viscoelastic behavior of rayon. Albert et al. 17 modified Vangheluwe and Zurek models to simulate the polypropylene fiber behavior. Maatoug et al. 18 used a modified Zurek model to identify viscoelastic properties of sizing yarns. Sami and Naima 19 revealed the viscoelastic behavior of open-end and ring yarns using a nonlinear spring and a Maxwell element. Furthermore, the core–sheath structuring effect was modeled using a spring and damper as elements. 20 Helali et al.21,22 used a rheological model to identify the tensile behavior of elastane core-spun yarns. A four-element nonlinear model was applied to analyze the tensile behavior of modal/polyurethane core yarns. 23 Unfortunately, to date, little attention has been paid to using theoretical models describing the stress–strain curve of elastic-conductive composite yarns. Thus, these issues should be addressed.
In our previous research, a tri-component elastic-conductive composite yarn (t-ECCY) applicable to smart textiles was fabricated using a modified ring spinning frame. 10 Herein, a dedicated self-designed instrument was used to appreciate the structural changes of the yarn during stretch in a comprehensive manner, in order to obtain more fundamental understanding of progressive deformation and formulate a reasonable hypothesis for the theoretical models. Then, the combined experimental and analytical research program of stress–strain behavior was developed in consideration of the broad base of theories that have been established in the literature. The modified Vangheluwe–Hook models under varying strain rates were proposed, and the ideal analytical equations, which can fairly well represent the stress evolution, were identified by using the genetic algorithm with 1stOpt software by nonlinear regression. In addition, fracture modes of t-ECCY with the variation of strain rates were discussed based on optical images.
Experimental details
Materials
Herein, rayon roving (RR), elastane filament (EF), and stainless steel filament (SSF, AISI type 316L) were used. The RR was made from rayon fibers (RFs) of 38 mm and 1.33 dtex and had a linear density of 568.5 tex with a twist of 35.6 T/m. The detailed specifications and stress–strain diagrams of EF and SSF are presented in Figure 1. The EF consists of a bunch of straight microfibers, whereas the SSF exists in a single form. With respect to EF, it can stretch as much as about 400% but has a relatively slow Young’s modulus, indicating its very good softness and flexibility. As for SSF, the load is linearly proportional to the extension, and the yield point is very close to 1%. As the load is increased, the slope eventually deviates from this linearity, and the stress-induced plastic flow starts.
Typical stress–strain curves and detailed characteristics of (a) EF and (b) SSF.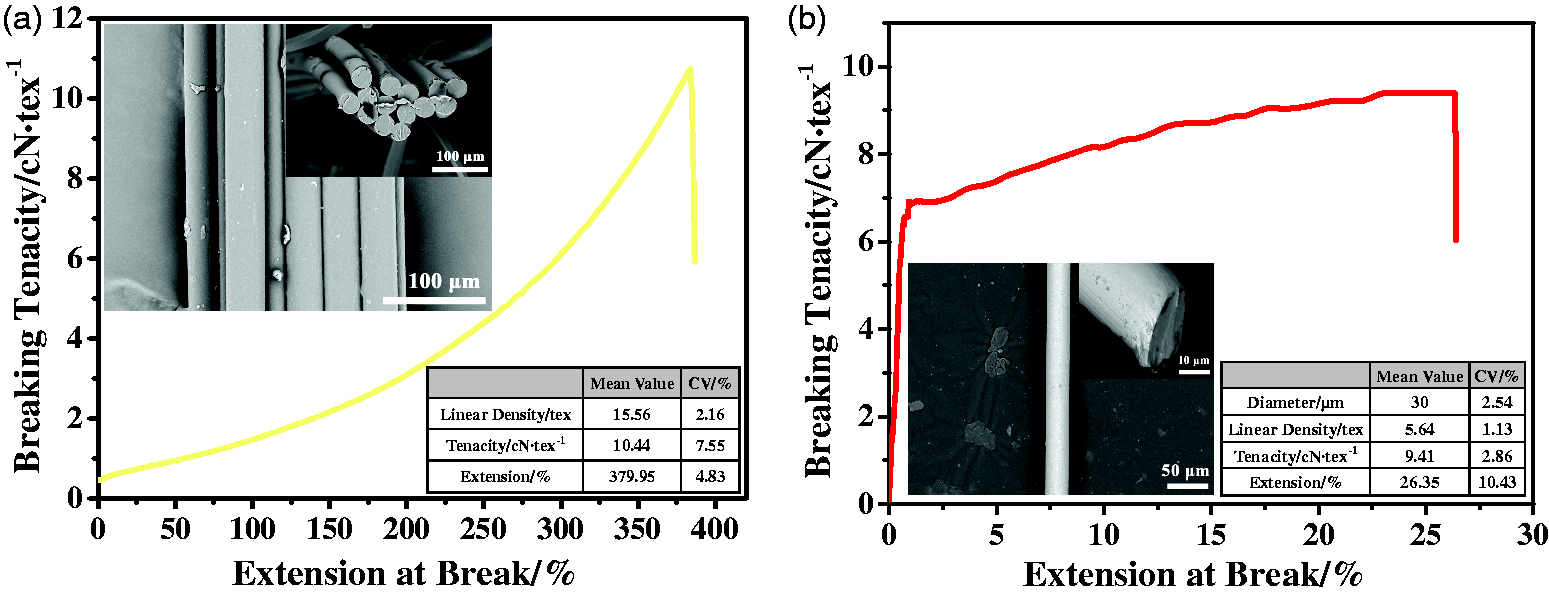
Manufacturing and stretching model of t-ECCY
The t-ECCY was prepared on a modified ring spinning frame, which was elaborately retrofitted with a grooved roller, positive feed rollers, and a tension disc (Figure 2a).
10
The SSF joined with RR first at convergence point A, and then the combination assemblies joined with EF at convergence point B of the yarn formation triangle. Clearly, the SSF component was positioned at the center of RR whilst the EF was fed in at a certain distance by means of a grooved roller whose specification and position were cleverly designed. Moreover, the draft ratio of EF was accurately controlled by positive feed rollers, and the pretension of SSF was adjusted by a tension disc. The real ring-spun processes from different perspectives are displayed in Figures 2(b) and (c). The key processing variables are as follows: draft ratio of EF 3.0; pretension of SSF 10–12 cN; total draft/break draft 18.08/1.20; strand spacing 10.5 mm; twist 700 T/m; and spindle speed 7000 rpm.
10
The count of the resultant t-ECCY is 43.5 tex.
(a) Fabrication process of tri-component elastic-conductive composite yarn (t-ECCY). (b)-(c) Real process from side-rear and front views. (d)-(e) Structure and stretching models. (f) Visual image and configurations of elastane filament (EF) and stainless steel filament (SSF) inside. RR: rayon roving.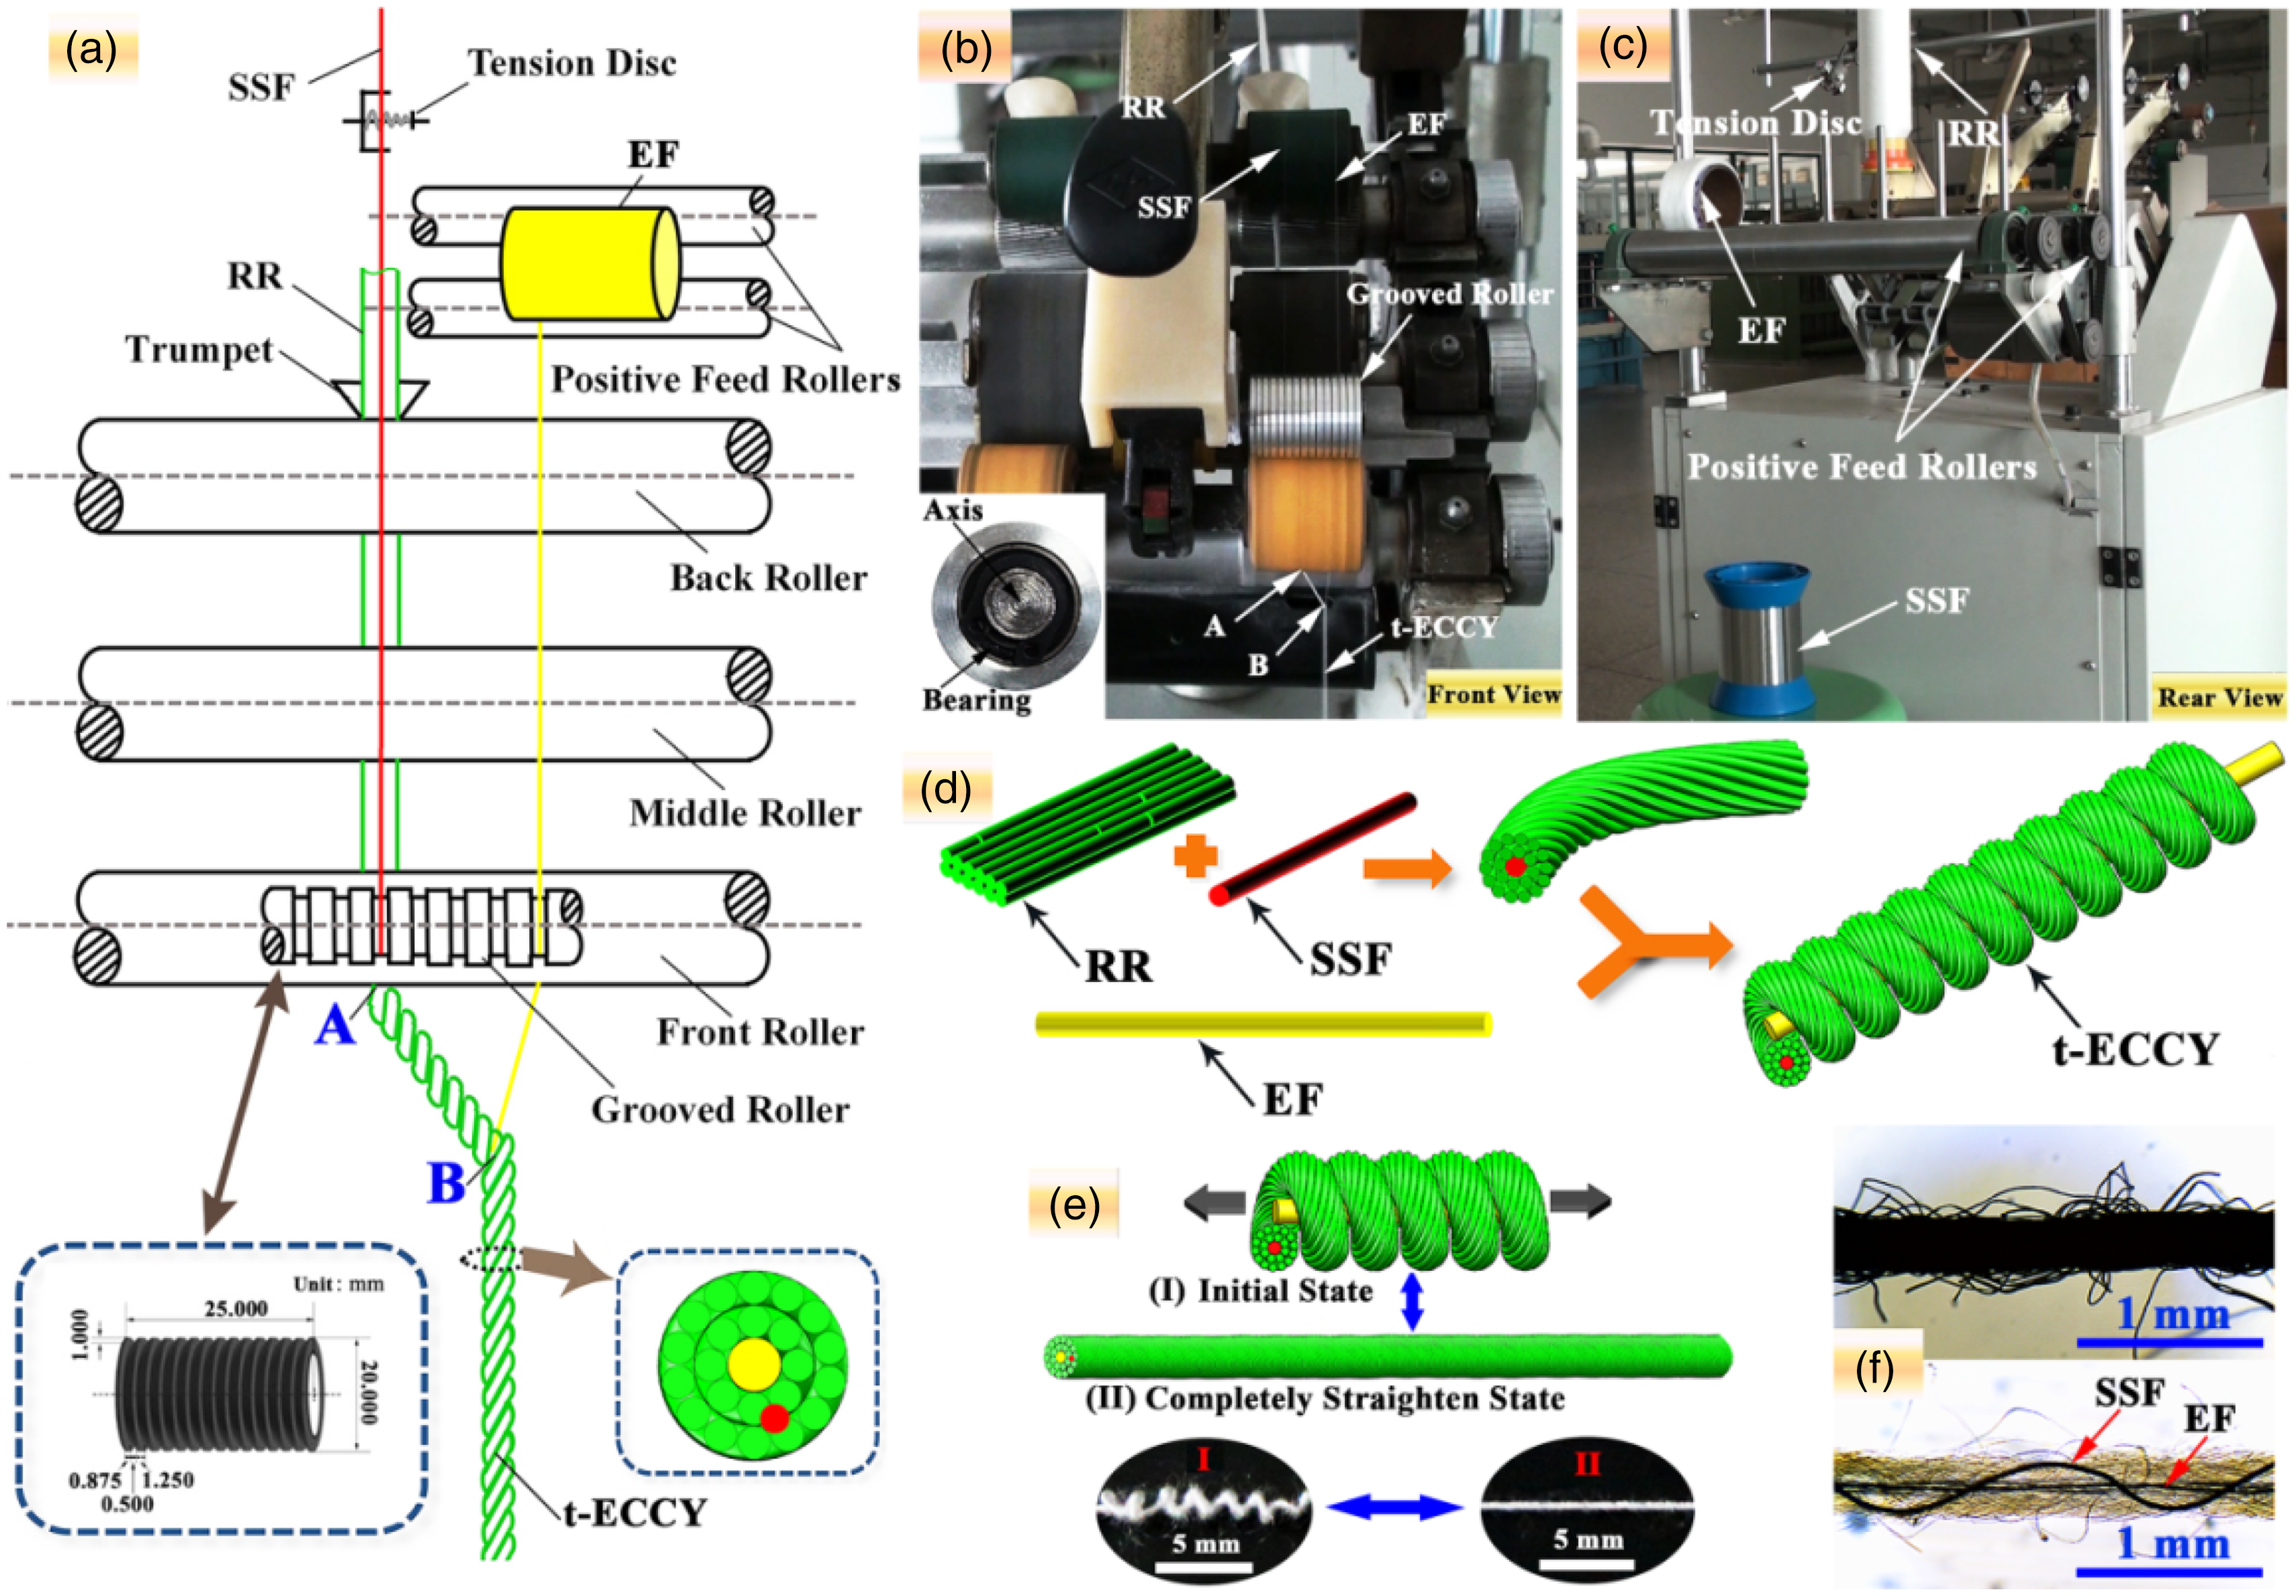
Figure 2(d) illustrates the structural model of the t-ECCY, which employs EF as a core and the SSF combining with rayon assemblies, as a helical winding around the extensible core. Figure 2(e) shows the stretching model. When the tension was applied to each yarn end, the yarn extended through the processes of (I) and (II). An elongation from a coiled structure in initial state to a straight condition in stretched state can be allowed. Note that the EF element inside yarn is assumed to have a straight cylindrical shape in the ideal original state. This, of course, deviates somewhat from the actual structure, in which all elements would take positions and forms in order to adhere to the minimum energy principle, and both the wrapper combinations and the axis of the EF core would thus take up a spiral form in real initial state, which may be confirmed by our experimental trials shown in stage I in the inset. Figure 2(f) exhibits the longitudinal external and internal morphologies of the t-ECCY specimen at a preload of 0.5 cN/tex.
Structural observation and tensile testing
A special self-designed instrument was fabricated to capture the external morphologies of t-ECCY during stretching, shown schematically in Figure 3(a). Each specimen with an initial length was clamped by two sliders, one of which was fixed and the other was movable. It was then elongated by moving the movable slider under manual operation with an extension rate of about 100 mm/min,
12
and the overall visual images of the yarn sample on extension were graphed with a digital camera. The partial-enlarged views of specimens were captured by a Hi-Scope microscope, with each observation being repeated five times. The twist angles between the axes of t-ECCY and the component yarn (which here refers to a short segment of yarn in its unidirectional helical structure) and the axes of the component yarn and its surface fiber are denoted by α and β, respectively. For a better understanding, the schematic of each parameter (α, β) is graphically illustrated in Figure 3(c). Each parameter was measured directly 10 times with a semicircular protractor. Moreover, the configurations of SSF and EF were observed by immersing the set-up gripping yarn in a watch glass containing methyl salicylate for a short time (<1 min), whereas only SSF can be optically seen for a longer time (>10 min).
(a)-(b) Photographic representation of elongation of tri-component elastic-conductive composite yarn (t-ECCY) and stainless steel filament disposition inside during extension. (c)-(d) Relationship between twist angles and yarn extension under single/cyclic stretching.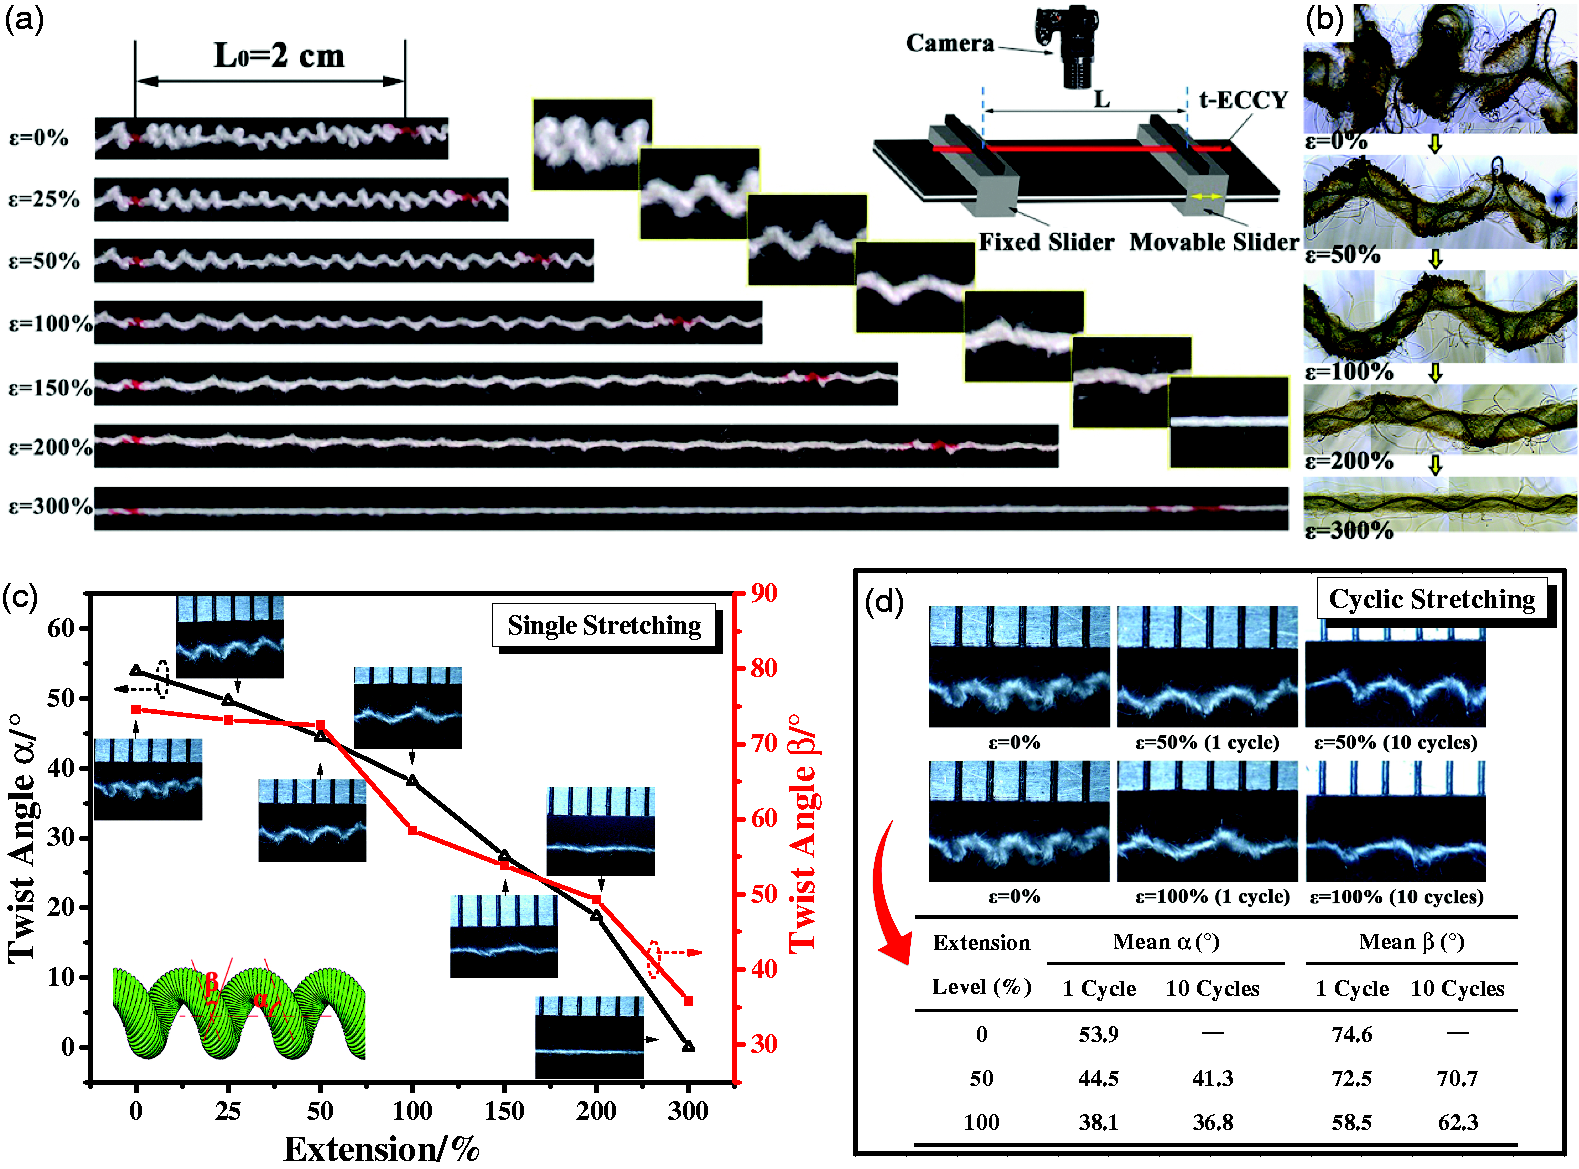
The tensile tests for yarn samples were performed under various strain rates (0.1, 1, and 2/min), at a gauge length of 500 mm and a pretension of 0.5 cN/tex on an XL-1A tensile tester. At least 40 specimens were tested for each. In addition, the broken ends of post-test yarn samples were collected on a glass slide and viewed using a BEION F6 microscope.
All tests were carried out under standard condition of 20 ± 2℃ and 65 ± 3% relative humidity (RH).
Experimental results and discussion
Structural characteristics under single/cyclic stretch
Figure 3(a) shows consecutive images of t-ECCY under extension; a yarn sample with a test length of 2 cm was marked at two points by means of a red color stain. The yarn has a super helical-coiled structure in the initial state (ɛ = 0%), suggesting its highly bulk characteristic. Temporary false twists can be generated, but can be eliminated by stretching both ends. The screw pitch becomes larger, whereas the apparent diameter becomes smaller with increasing strain (ɛ = 25–300%). The deformation mechanism of coils in t-ECCY is initially separation of the adjacent coil surfaces and gradual unwinding until free. Notably, the yarn can tolerate strain up to about 300% without pulling apart, primarily owing to the stretchable nature of EF with a draft of 3.0 and unique geometric disposition of SSF (Figure 2(f)). The actual microstructural evolutions of the SSF element inside under elevated applied strains, that is, 0%, 50%, 100%, 200%, and 300%, are graphically presented in Figure 3(b), converting from relatively loose and unstrained to a helical form.
In Figure 3(c), it is clear that the twist angle (α) decreases as extension increases, which is attributed to more straightening and lower skewness along the yarn axis during extension. 11 The twist angle (β) also has a tendency to decrease, and the decreasing rate of β with extension shows an ascending trend. For the strain up to 50%, angle β decreases marginally, after which it reduces dramatically. The higher decreasing rate at 200–300% indicates that there is a crucial point between full-straighten and low-tension stretched states. Figure 3(d) shows partial-enlarged optical micro-images of given strain levels, viz., 50% and 100%, of the t-ECCY under cyclic stretch, and no obvious changes have taken place, revealing its compact structure and super elasticity. In contrast, t-ECCY following 10 cycles has slight slack in the length of the screw pitch, especially for the yarn with 100% strain level. The EF constituent loses an inappreciable part of its plasticity under mild solicitation. The residual extension of yarn with 100% strain is relatively greater, primarily because larger stretch is prone to accumulate large plastic deformation. Furthermore, the experimental results of twist angles were summarized. As expected, α has a tendency to decrease following 10 cycles irrespective of the strain level considered. More unconfined packing density and slippage of surface fibers inside the yarn body are conducted during the cyclic larger strain stretch, which results in an increasing of β with 10 cycles, especially for 100% strain.
Tensile characterization of t-ECCY
Figure 4(a) illustrates a typical stress–strain curve of the t-ECCY, and its corresponding input yarns. In our previous investigation, we assume that the t-ECCY has two distinct components, that is, bi-component conductive composite yarn (b-CCY) in the sheath and EF in the core.
10
It is evident that the three materials behave mechanically totally differently. The b-CCY suffers from a lower strain and higher strength, whereas the EF has a superior extensibility. The combined t-ECCY compromises the strength of b-CCY and the extension of EF. While putting the yarn under tension, the force to which the nominal b-CCY was subjected is a shear force and a pulling stress, but the EF was subjected to a normal pulling force. Due to the distinctive structure of t-ECCY and inherently weaker force of EF under small deformation, the EF is not sufficient to sustain the large extra load applied to it at the breaking point of the sheath constituent; hence, it broke and the yarn broke accordingly.
(a) Representative stress–strain curve of tri-component elastic-conductive composite yarn (t-ECCY) with the corresponding input component. (b) Three-phase deformation mechanism of tensile characteristics during stretch. b-CCY: bi-component conductive composite yarn; EF: elastane filament.
As shown in Figure 4(b), the shape of stress–strain curve of t-ECCY is essentially nonlinear, with an initial concavity and a consequent convexity characteristic. The tensile curve intersects the stress axis with an intercept that is equal to the pretension. According to the character of the stress–strain curve, the stretching process can be divided into three stages. A relatively lower slope in region I (0–4%) represents the stretching of EF and decrimping of the winding assemblies, 23 that is, nominal b-CCY, for which only lower loads need to be applied. The stress in yarn is approximately proportional to the strain level. As a result, this region can be viewed as a Hookean region. With continuously loading, a rapid increasing of the stress with the increment of strain follows in region II (say 4–8.7%), the curve progression changes, and the slope appears steeper, primarily due to the winding assemblies, viz., nominal b-CCY, starting to contribute to the tensile characteristics. The stress is proportional to strain, but it depends on time, hence the yarn is viscoelastic. The yarn, of course, is described as linear viscoelastic. At still higher elongations until the ultimate rupture in region III, the strain-hardening phenomenon takes place, which causes the yarn to become more difficult to deform. 9 Besides, the permanent damage occurs and nonlinear deformation appears. 23 In addition, the cord method presented in the inset, 22 whose core idea is to plot the tensile curve derived of tenacity according to strain, used here also highlights the nonlinear tensile behavior of t-ECCY and the existence of the aforementioned three zones.
Constitutive modeling of tensile responses
The experimental data presented in the previous section clearly illustrate the complicated nonlinear tensile behavior of the t-ECCY. To address the observations, two modified constitutive models are proposed in Figure 5. The respective model consists of three components placed in parallel, the first of which is a Maxwell model, which includes a spring and a dashpot, the second of which is a nonlinear spring, and the third of which is a linear spring. In Figure 5(b), the model can be considered as a Vangheluwe’s model with an association of a Hook’s spring model, whereas in model (a) shown in Figure 5(a), a modified Vangheluwe’s model is placed in parallel with a Hook’s spring model.
The two rheological models (a)-(b) proposed to describe the tensile behavior of tri-component elastic-conductive composite yarn.
Constitutive description
As shown in Figure 5(a), the linear springs of modulus E1 (cN/tex) and E2 (cN/tex) are assumed to follow Hook’s law, and the dashpot is assumed to be filled with Newton fluid of viscosity η (cN·s/tex).
23
Corresponding to the components of the constitutive model (a), the total strain, ɛ, can be decomposed into two parts

The total stress σ acting on t-ECCY is decomposed into three respective components

The stress acting on each component of the Maxwell model remains the same, that is

The stress developed in the nonlinear spring is assumed as

The tensile behavior for the third component is given as

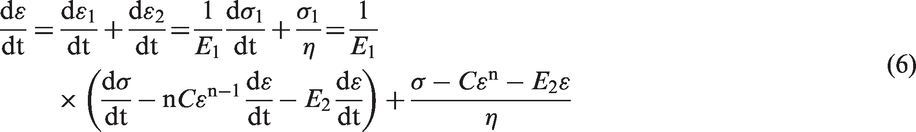
By taking the derivation of Equation (1) and combining with Equations (2)–(5), we get
Note that the yarn is stretched at a constant extension rate, where k is the strain rate

Therefore, the constitutive response of the model between stress σ (cN/tex) and strain ɛ (%) combining Equations (6) and (7) is described by

The tensile behavior of the model during traction is mathematically given as
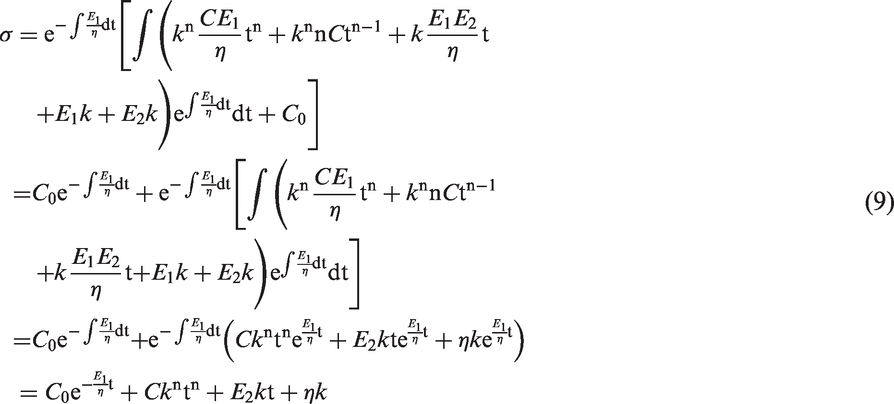
Substituting Equation (7) into Equation (9) and solving it with the initial condition σ (0) = 0 leads to the stress–strain equation, as follows

A pretension of 0.5 cN/tex has to be modified to the yarn while clamping in the tensile tester. At this pretension, strain is zero.13–15,22,23 With this correction, the tensile curve can be derived as
Model (a):

In order to obtain a best fit of the experimental tensile curve, an exponent (p > 0) was introduced to the exponential function based on Equation (11).14,17,19 Therefore, the behavior of t-ECCY in tension can be expressed as follows
Modified Model (a):

The constitutive model presented in Figure 5(b) could be considered as a special case of the model proposed in Figure 5(a), in which it is simply supposed that n is identically equal to 2. Consequently, the corresponding stress–strain equations are given by
Model (b):

Modified Model (b):

Numerical simulation and validation
Numerical simulations were conducted to better understand the tensile deformation of t-ECCY using the genetic algorithm with 1stOpt software. The fitting aptness of constitutive models is evaluated by widely accepted statistical criteria, correlation coefficient (R), average-absolute-relative error (AARE),
24
and root-mean-square error (RMSE).
25
Then, a suitable analytical model can be acquired. R is a commonly used statistic parameter and provides information on the strength of the linear relationship between experimental and predicted values, whereas AARE is calculated through a term-by-term comparison of the relative error in prediction with respect to the actual value, thereby being an unbiased statistic variable to measure the model’s predictability.
24
The RMSE statistic variable is used to calculate the average error at each point.
25
Where the higher R, the lower AARE and RMSE are, the better regression model is. These are expressed as


Figure 6(a) presents the experimental data and predicted values considering the above four constitutive models (Equations (11)–(14)), for a strain rate of 1/min. As can be seen, the modified models (a) and (b) provide a fairly reasonable representation of the tensile deformation mechanism for each stage in t-ECCY, and the shape progression goes hand in hand with the experimental curve, whereas the predictions of the other two models slightly deviate from the experimental ones. Values of statistical parameters, viz., R, AARE, and RMSE, for the above four models are listed in Figure 6(b). As is expected, the R values for all four models are above 0.998, indicating that a good correlation between predicted and experimental data has been obtained. Furthermore, values of AARE and RMSE were found to be relatively low; this also shows that the four proposed models end in precise stress estimations. In contrast, the modified model (a) gives the least AARE and RMSE of 0.647% and 0.0196, respectively, whereas model (b) gives the maximal values of AARE and RMSE of 5.718% and 0.1773, respectively.
(a) Comparisons of four models with experimental data to predict the tensile behavior of the tri-component elastic-conductive composite yarn under k = 1/min. (b) R, AARE and RMSE between experimental and predicted values.
Considering all the above analysis, it is highly appreciated that modified model (a), incorporating an exponent to exponential function into the Vangheluwe–Hook model, is proved to be capable of representing the stress evolution of t-ECCY during stretch.
In order to validate modified model (a), the independent uniaxial tests of t-ECCY outside of the fit domain at different strain rates, that is, 0.1 and 2/min, are simulated numerically, the results of which are illustrated in Figure 7. It is obviously seen that the predicted stress is capable of tracing well the experimental data for the entire range of strain and expressing the stress characteristics. Values of AARE and RMSE at strain rates of 0.1 and 2/min are 0.584% and 1.071%, 0.0251 and 0.0447, respectively, and the R value of each is calculated as 0.9999, which further demonstrates a good predictability of the proposed tensile model. In addition, the tensile curve is substantially sensitive to strain rate, so it shifts toward the stress axis when the test is executed at a higher rate, indicating an increasing modulus of t-ECCY with elevated strain rates.
Comparison of experimental and predicted values based on modified model (a) under k = 0.1 and 2/min, respectively. The inset presents the statistical measures, that is, R, AARE and RMSE.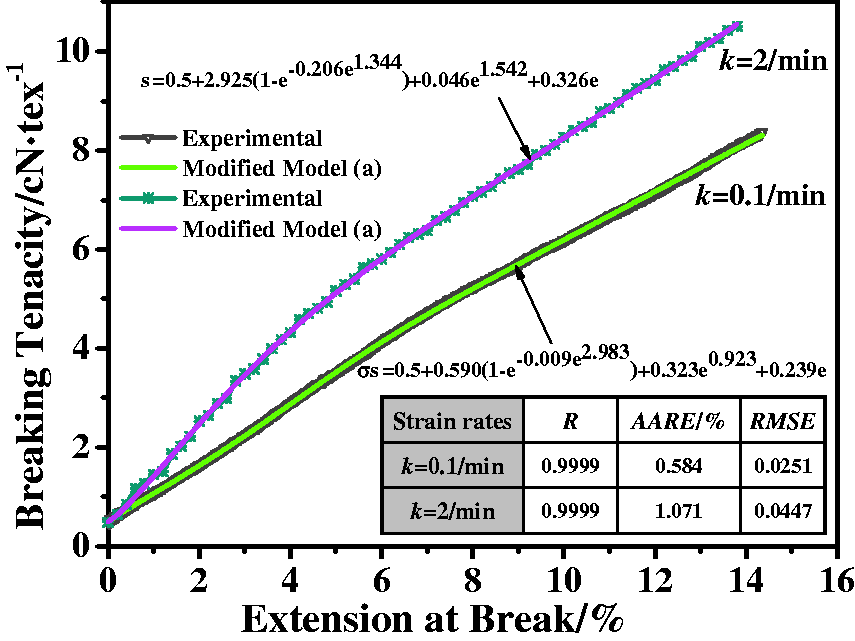
The fitted tensile curves of yarn under different strain rates are represented by the following explicit expressions
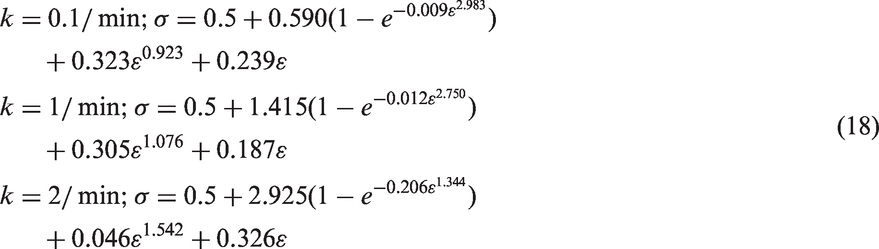
Identified parameters for modified model (a) of tri-component elastic-conductive composite yarns as a function of strain rate

Fractography analysis
The fracture morphologies of post-test t-ECCY under different strain rates are shown in Figure 8. It can be perceived that a sharp break happens at a lower strain rate, that is, 0.1/min, whereas a pull-out break is found at higher strain rates beyond 1/min. We can clearly track the evolution of fracture profiles of the post-test yarns under varying strain rates. In Figure 8(a), almost all the RFs break sharply and separate from each other. However, the RFs, which are tightly bound together winding around the SSF, form a local undulating break at higher strain rates (Figures 8(b) and (c)), primarily due to the intensive instant impact force of SSF along the tensile direction.
10
In addition, as can be seen, the EF inside three yarns cannot be observed in the failure zones, whereas the SSF and RFs are visible, which is most likely the result of the excellent elastic resilience of EF.
Fracture morphologies of the post-test tri-component elastic-conductive composite yarn with different strain rates: (a) 0.1/min; (b) 1/min; (c) 2/min, respectively. SSF: stainless steel filament; RF: rayon fiber.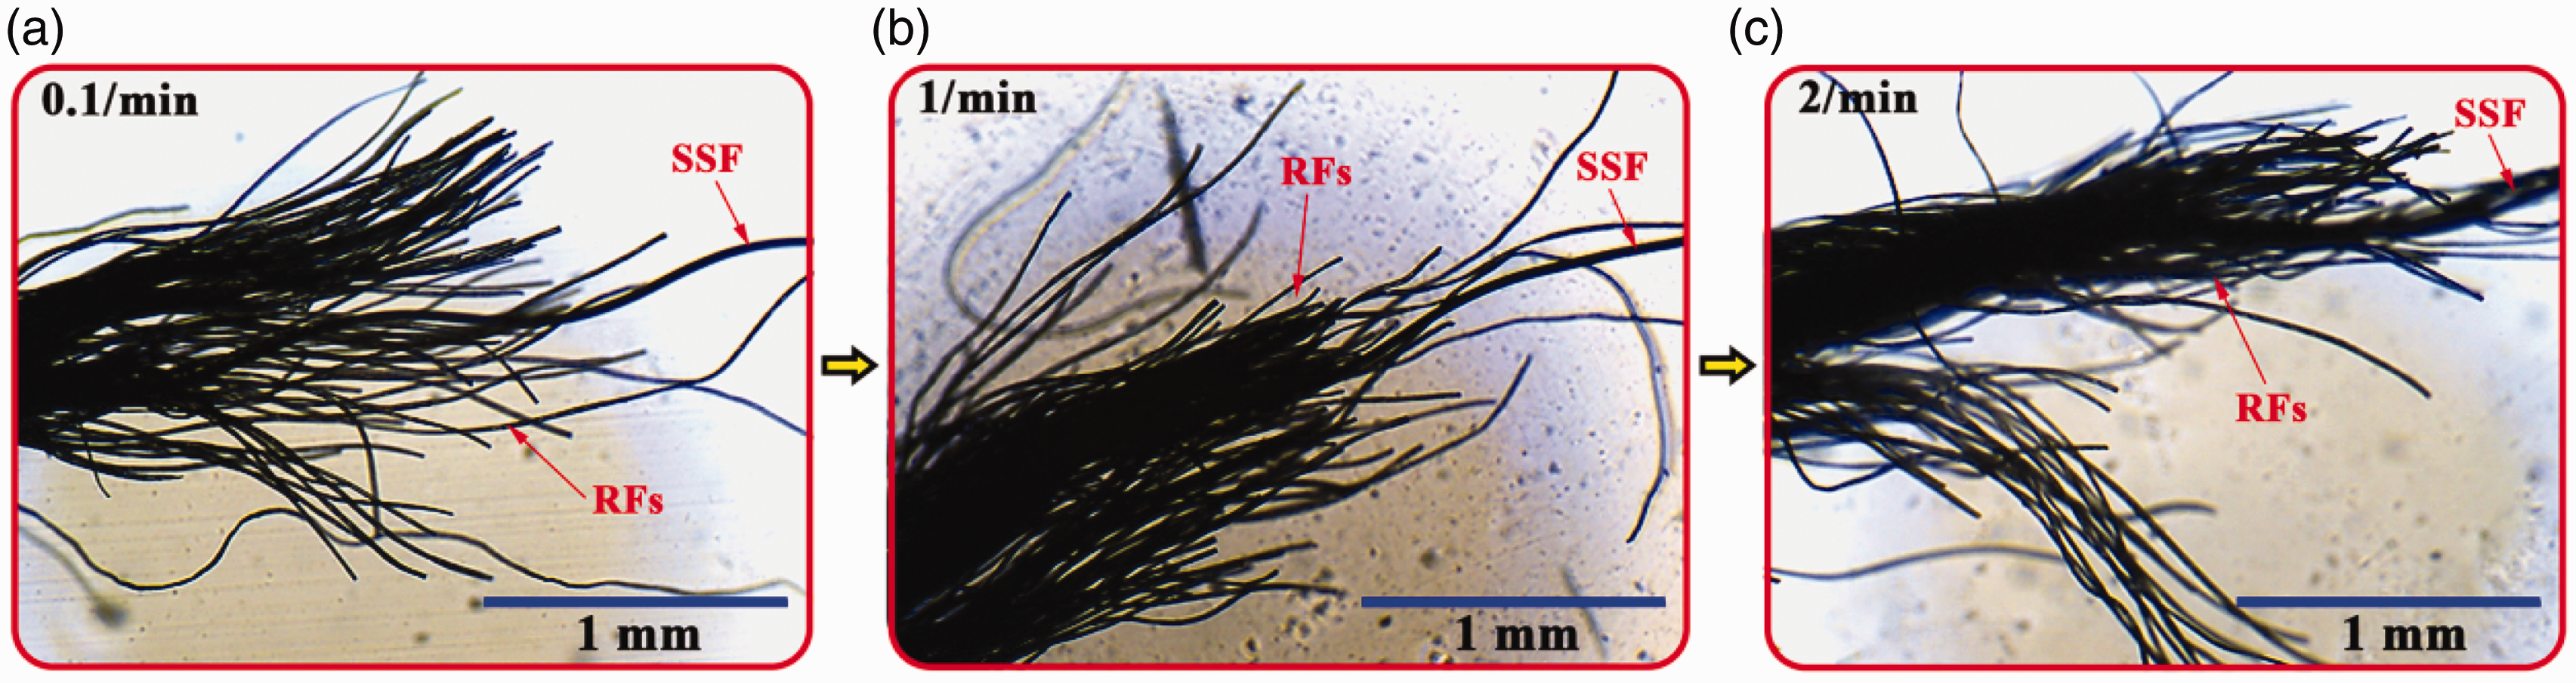
Conclusions
In this study, the structural assessment of t-ECCY in its initial-straighten states was conducted. The results were as follows: (I) the deformation mechanism of the coils in t-ECCY is initially separation of the adjacent surfaces and gradual unwinding of coils until it is free of coils; (II) the stretch-limit level of the yarn is closely related to the draft ratio of EF and geometric disposition of SSF inside; (III) both the twist angle between the axes of t-ECCY and component yarn (α) and angle between the axes of component yarn and fiber (β) decreases during extension, and no obvious changes have taken place following 10 cyclic stretch tests, indicating its superior elasticity and structural regularity.
A combined experimental and analytical investigation has been performed to elucidate the tensile characteristics of the t-ECCY with different strain rates. On the experimental side, a typical characteristic S-curve and a modulus–strain curve obtained by taking the first derivative of the tensile curve suggest its essentially nonlinear behavior. On the analytical side, a modified Vangheluwe–Hook constitutive tensile model by introducing an exponent to the exponential function was proposed, in order to obtain a best fit of the experimental curve under elevated strain rates. The discrete quantitative parameters were extracted by using the genetic algorithm with 1stOpt software for the nonlinear regression. The established model represents the stress evolution of t-ECCY under different strain rates. The reliability of predictions is evaluated using standard statistical formulae. Average absolute relative error (AARE) and root mean square error (RMSE) associated with the predictions for the entire domain are below 1.1% and 0.05, respectively, and the correlation coefficient (R) is found to be above 0.999. In addition, a sharp break happens at lower strain rates, whereas a local pull-out break is found at higher strain rates.
Footnotes
Declaration of conflicting interests
The authors declared no potential conflicts of interest with respect to the research, authorship, and/or publication of this article.
Funding
The authors disclosed receipt of the following financial support for the research, authorship, and/or publication of this article: This work was supported by the National Key R&D Program of China (2016YFC0802802), Fok Ying Tung (huoyingdong) Education Foundation (151071), and Fundamental Research Funds for Central Universities (CUSF-DH-D-2017018).