
Abstract
There is a continuous change in cell wall composition and organization during cotton fiber development. Cotton fiber strength correlates to the molecular weight (MW) and molecular weight distribution (MWD), and organization of cellulose chains in the secondary cell wall. These parameters change drastically during fiber development. This study reports on the MW, MWD, and organization of cellulose in cotton fibers harvested from two cotton cultivars of Gossypium hirsutum L., (Texas Marker-1 and TX55) at different levels of maturity. Fiber dissolution is necessary to estimate the molecular properties of cellulose. Cellulose in mature cotton fibers is larger in MW and highly crystalline and, therefore, poorly dissolves in common solvent systems. To facilitate the dissolution, fibers were first pretreated with 23% sodium hydroxide and then dissolved in a dimethylacetamide/lithium chloride solvent system. Gel permeation chromatography of dissolved fibers indicated that cellulose in both cultivars reaches its maximum MW around 30 days post anthesis. Fourier transform infrared microspectroscopy imaging in the transmission mode indicates changes in cellulose distribution in cotton fibers with fiber development. The distributions of infrared vibrations of cellulose at 897 (β-linkage of cellulose), 1161 (anti-symmetrical C-O-C stretching of cellulose), and 1429 cm−1 (CH2 scissoring of cellulose) provided information on cellulose deposition in intact cotton fibers.
Keywords
Cotton is one of the leading cash crops in the USA with more than 16.9 million bales produced in 2016/2017 with an approximate total world production of 106 million bales (480-pound net weight bales).1,2 A universal interest exists in the development of cotton varieties for superior fiber properties to maintain a premium quality cotton industry. Cotton fiber traits, especially strength, length, and fineness are the main predictors of fiber performance in the textile industry. In particular, strong cotton fibers tend to withstand vigorous mechanical handling along the processing lines and produce stronger yarns and fabrics.3,4
Cotton fibers have more than 96% cellulose at maturity.4,5 This dominance of cellulose makes the cotton fiber physical properties greatly affected by molecular characteristics and structural organization of cellulose in the secondary cell wall. In particular, cotton fiber strength shows a great dependency on the weight average molecular weight (MW), 5 and on cellulose microfibrils orientation in the secondary cell wall. 6 Improved tensile strength and abrasion resistance can be achieved by increasing the MW and narrowing the molecular weight distribution (MWD) of cellulose. 4 Variations in the MW and MWD appear to be variety-dependent. 4
The molecular properties of cellulose are commonly obtained by dissolution of cotton fibers and analysis using size exclusion chromatography. The N,N-dimethylacetamide (DMAc)/lithium chloride (LiCl) solvent system is one of the most common cellulose solvent systems, which has been used to dissolve cellulose under different conditions.5,7–10 However, the solubility depends on several factors, such as molecular properties, plant source, concentrations of cellulose and LiCl, the activation process, and the availability of water in the solvent system. 8 The DMAc/LiCl mixture cannot completely dissolve high MW cellulose, especially in the crystalline regions. Cotton cellulose has a larger MW and a higher level of crystallinity than cellulose extracted from other natural sources (e.g. wood). Therefore, cotton fibers are pretreated using a so-called “activation step” to improve the dissolution. This activation weakens the interaction between cellulose chains, which increases the accessibility of cellulose due to the breakage of inter- and intramolecular hydrogen bonds and intra- and inter-crystallite swelling,11,12 resulting in relaxed chain conformation. 13 In most common activation procedures, cellulose samples were treated with liquid ammonia, 12 water followed by solvent exchange with DMAc,12,13 water followed by solvent exchange and freeze drying, 14 and with hot DMAc. 15 However, some of those pretreatments, especially heating in DMAc/LiCl, tend to degrade cellulose molecules under high-temperature conditions, which may ultimately facilitate the dissolution. 11 Mercerization is a well-known commercial process that treats cotton fibers with a strong NaOH solution. This process was reported to facilitate the dissolution of high MW crystalline cotton cellulose. 16
The MW of mature cotton cellulose has been studied,4,5,15,16 and the variations in the MW and MWD of cotton cellulose as a function of fiber maturity have also been investigated. 17 However, the variation of the MW and MWD of cellulose in developing cotton fibers in different cotton varieties grown under controlled conditions has rarely been reported. Moreover, cellulose distribution in intact cotton fibers at different stages of fiber development has not been studied. However, the rate of cellulose synthesis and deposition can vary during fiber development in different cultivars. A cotton variety that reaches a higher MW and a narrower MWD within a shorter period may have better fiber strength at early stages of fiber development. Therefore, early harvesting under critical environmental conditions, such as freezing, may not drastically reduce fiber strength. A comprehensive estimation of molecular characteristics and organization of cellulose in different cotton varieties at various stages of fiber development will be vital in the selection of better quality cultivars under highly variable weather conditions similar to West Texas.
In the current experiment, the main objectives are to investigate changes in MW, MWD, and cellulose deposition along individual fibers during different stages of cotton fiber development. Cotton fiber dissolution was facilitated by treating samples with 23% NaOH solution. We report on the physical and chemical changes associated with NaOH pretreatment of cotton fibers, changes in molecular properties of cellulose during fiber development, and distribution of cellulose in individual fibers harvested at different stages of fiber development.
Experimental details
Material
Cotton plants from two cotton cultivars, Texas Marker-1 (TM-1) and TX55, were grown in a greenhouse with 11–13 h daytime duration with 31/24℃ diurnal temperature cycles. Plants were grown in 20 l pots filled with Sungrow SB 300 potting mix with Peters 15-9-12 slow-release fertilizer, and were watered as required. Each flower was tagged on the day of anthesis. Harvesting of cotton bolls began at 10 days post anthesis (dpa) and continued at different levels of maturity. Then, the pericarp was immediately removed and ovules were separately stored in a cryobiological system filled with liquid nitrogen. A detailed description of the cotton samples, their cleaning, and dehydration procedures was reported previously. 18 Cotton ovules were thawed and seeds were separated from fibers. Fibers were washed several times with water to remove extracellular compounds and dried at 40℃ for 48 h. Cleaned fibers were then manually blended with lint from bolls having the same age.
NaOH was purchased from Fisher Scientific (Fisher Scientific, USA), and Triton X-100, acetic acid, DMAc, and LiCl were purchased from Sigma- Aldrich (Sigma-Aldrich Corporation, USA).
Cotton fiber pretreatment with sodium hydroxide
Cotton fibers were pretreated with NaOH following the procedure reported elsewhere with slight modifications (e.g. vortex mixing and oven drying of pretreated fibers). 16 Cotton fibers were ground using a Wiley mill to pass 20 mesh size. Approximately 30 mg of the ground cotton fiber sample was vortexed with 10 ml of 23% NaOH containing 1% (V/V) Triton X-100 as a wetting agent. The test tubes, containing sample mixtures, were placed in a multi-block heater that was preheated to 45℃. The multi-block heater was placed in a laboratory shaker, and samples were vortexed once after 15 min of shaking. The pretreatment was carried out for 30 min. The sample was transferred to a beaker containing approximately 20 ml of distilled water. The total volume was brought up to 50 ml by adding distilled water. The pretreated cotton samples were recovered by vacuum filtration through Whatman filter papers (grade 42). Cotton fiber samples were washed on the filter paper consecutively with distilled water three times, 5% acetic acid two times, and distilled water three times. Then, samples were dried at 100℃ for 3 h before the dissolution.
Microscopic characterization
Morphological changes due to NaOH pretreatment were visualized using a scanning electron microscope (SEM) (TM-1000, Hitachi, Japan) with an accelerating voltage of 15 kV. Clean and dry cotton fibers were mounted on carbon discs (no coating was performed before the visualization). Similarly, individual fibers were also visualized using polarized light microscopy (PLM) (ECLIPSE LV100POL, Nikon Instruments Inc., USA) with a 20× polarizing objective lens and analyzer plate. A lambda plate, a sensitive color plate with a lambda value of 530 nm, was placed in the optical path to produce improved images.
X-ray diffraction characterization
Wide-angle X-ray diffraction (WAXD) curves of mature cotton fibers were collected from cotton fibers before and after NaOH pretreatment to investigate the effect of the pretreatment on the crystalline structure of cellulose. Cotton fiber samples, which were ground into 20 mesh size, were placed on the sample holders (2 cm × 2 cm), and the diffraction data were recorded using a SmartLab XRD system (HD2711 N, Rigaku Corporation, Japan). CuKα (λ = 1.54 Å) radiation was generated at an accelerating voltage of 40 kV and a tube current of 44 mA. The diffraction intensities were counted at a continuous scanning speed of 1o/min and a scan step of 0.01o between 2θ = 5o and 45o.
Fourier-transform infrared spectroscopy and microspectroscopy characterization
Untreated and treated cotton fibers, conditioned at 65 ± 2% relative humidity and 21 ± 1℃ for at least 48 h, were analyzed using Fourier transform infrared (FTIR) Spectrum-400, equipped with a universal attenuated total reflectance (UATR) accessory and temperature stabilized fast-recovery deuterated triglycine sulfate (FR-DTGS) detector (Spectrum-400, PerkinElmer, USA). Thirty-two co-added scans were collected from each sample in the mid IR range (4000–650 cm−1) with a spectral resolution of 4 cm−1. Baseline corrected and normalized FTIR spectra were compared to identify the effect of NaOH pretreatment.
Untreated and treated cotton fibers and individual fibers at each dpa were mounted on IR cards and analyzed using the Spotlight 400 Imaging System (Spotlight 400, PerkinElmer, USA), equipped with 128 × 128 mercury cadmium telluride (MCT) focal plane array detectors. Spectral data in the mid-infrared range (4000–750 cm−1) were acquired in the transmission mode with a spectral resolution of 16 cm−1 and pixel size of 6.25 µm. One-hundred-and-twenty-eight co-added spectra were collected from each pixel. FTIR images were analyzed using Spectrum Image software (PerkinElmer, USA). Specifically IR images were analyzed by developing functional group distribution images (chemimaps) of different infrared bands that are attributed to cellulose.
Cotton fiber dissolution and molecular characterization
Cotton fiber samples were dissolved in the DMAc/LiCl solvent system using the protocol reported elsewhere with slight modification. 15 Fifteen milligrams of treated cotton samples were transferred into 10 ml test tubes separately and dried in the oven at 100℃ for 1 h. Then, 5 ml of anhydrous DMAc, which was dried with molecular sieves (MX1583D-1 Type 3 A, EMD Millipore, USA), was added to each test tube. The temperature was increased to 150℃ using a multi-block heater while keeping the test tubes open. When the temperature reached 150℃, the test tubes were closed and maintained for 2 h while vortexing once every 30 min. Samples were cooled to 100℃ and 400 mg of oven-dried LiCl was added to each test tube. Samples were immediately vortexed to dissolve LiCl and maintained at 100℃ for 1 h and vortexed once every 15 min. All test tubes were directly transferred to a 50℃ heating block placed on a laboratory shaker. Samples were maintained at the same temperature for 6 days and the dissolution was facilitated by vortexing twice a day. The dissolved samples were transferred to 50 ml volumetric flasks and diluted with dried DMAc. The solutions were filtered into 1.5 ml sterile glass vials (Malvern, UK) using 0.20 µm hydrophobic polytetrafluoroethylene (PTFE) disposable membrane filters (Millex-FG, Millipore, Germany).
A gel permeation chromatography (GPC) system (Model 305, Viscotek, USA), equipped with an autosampler (Model VE 201, Viscotek USA), was used to determine the MW and MWD of cellulose in cotton fibers at selected stages of development. The GPC system was first calibrated using the poly(methyl methacrylate) (PMMA) standard. The GPC system contains a series of detectors, which includes refractive index (RI), viscometer, right angle light scattering, and lower angle light scattering. The mobile phase, consisting of anhydrous DMAc with 5% LiCl (w/v), was pumped through the system at a flow rate of 1 ml/min. The separation column (ViscoGEL I series column, 7.8 mm × 300 mm (Cat #- I-MBHMW-3078)) was maintained at 50℃ during the run and a volume of 100 µl from the sample solution was injected for analysis. OmniSEC GPC software version 5.00 (Malvern, UK) was used for data analysis. Three samples were analyzed from cotton fibers harvested at each dpa and dissolved separately for GPC analysis.
Results and discussion
In this study, fiber samples were selected to represent overlapping developmental stages of cotton fibers. However, we could not dissolve immature fibers, especially at 10 and 14 dpa, possibly due to the physical and chemical nature of immature fibers. Immature fibers were stuck together after cleaning and dehydration, resulting in a film rather than separate fibers, which may ultimately reduce the solubility. Moreover, the presence of a large quantity of non-cellulosic material in immature fibers may also contribute to poor solubility. Therefore, the MW and MWD of cellulose in fibers harvested at 17, 20, 23, 27, 30, 36, 46, and 56 dpa are analyzed.
Effect of NaOH pretreatment
The mercerization process, treatment of cotton fibers with strong alkali solution, is a well-known method used to increase cotton fiber strength and reactivity. Cotton fibers undergo changes in morphology and in crystalline allomorphs upon treatment with a strong alkali solution.19,20 Treated fibers appear lustrous and white compared to untreated fibers. This could be attributed to the following. (1) Removal of the surface layer, which contains pigments, wax, and pectin. The surface wax layer is washed away with alkali treatment.21,22 (2) Swelling of fibers by Na+ ions. 23 Cotton fibers become cylindrical and reflect light more than untreated fibers. It has been reported that cellulose nanocrystals, obtained by acid hydrolysis of cellulose, form chiral nematic phases. Changes of color observed were due to variation in orientation of the birefringent suspension. 24 This change in light reflection imparts a lustrous look to mercerized yarn and fabric.
SEM
Figure 1 shows the flat twisted ribbon-like structure of untreated fibers and the cylindrical structure of NaOH-treated fibers harvested from both TM-1 and TX55 cultivars. Cellulose microfibrils are helically organized in the secondary cell wall of cotton fibers. These microfibrils change their angle (gyre) in reversal points of fibers.
25
Oriented cellulose microfibrils are clearly visible in untreated cotton fibers (Figure 1(a)) when compared to NaOH-treated cotton fibers, indicating that the microfibril orientations are disrupted due to the pretreatment.
21
Scanning electron microscopy micrographs of cotton fibers harvested at 56 days post anthesis: (a) untreated cotton fibers harvested from TX55 cultivar; (b) NaOH-treated cotton fibers harvested from TX55 cultivar; (c) untreated cotton fibers harvested from TM-1 cultivar; (d) NaOH-treated cotton fibers harvested from TM-1 cultivar.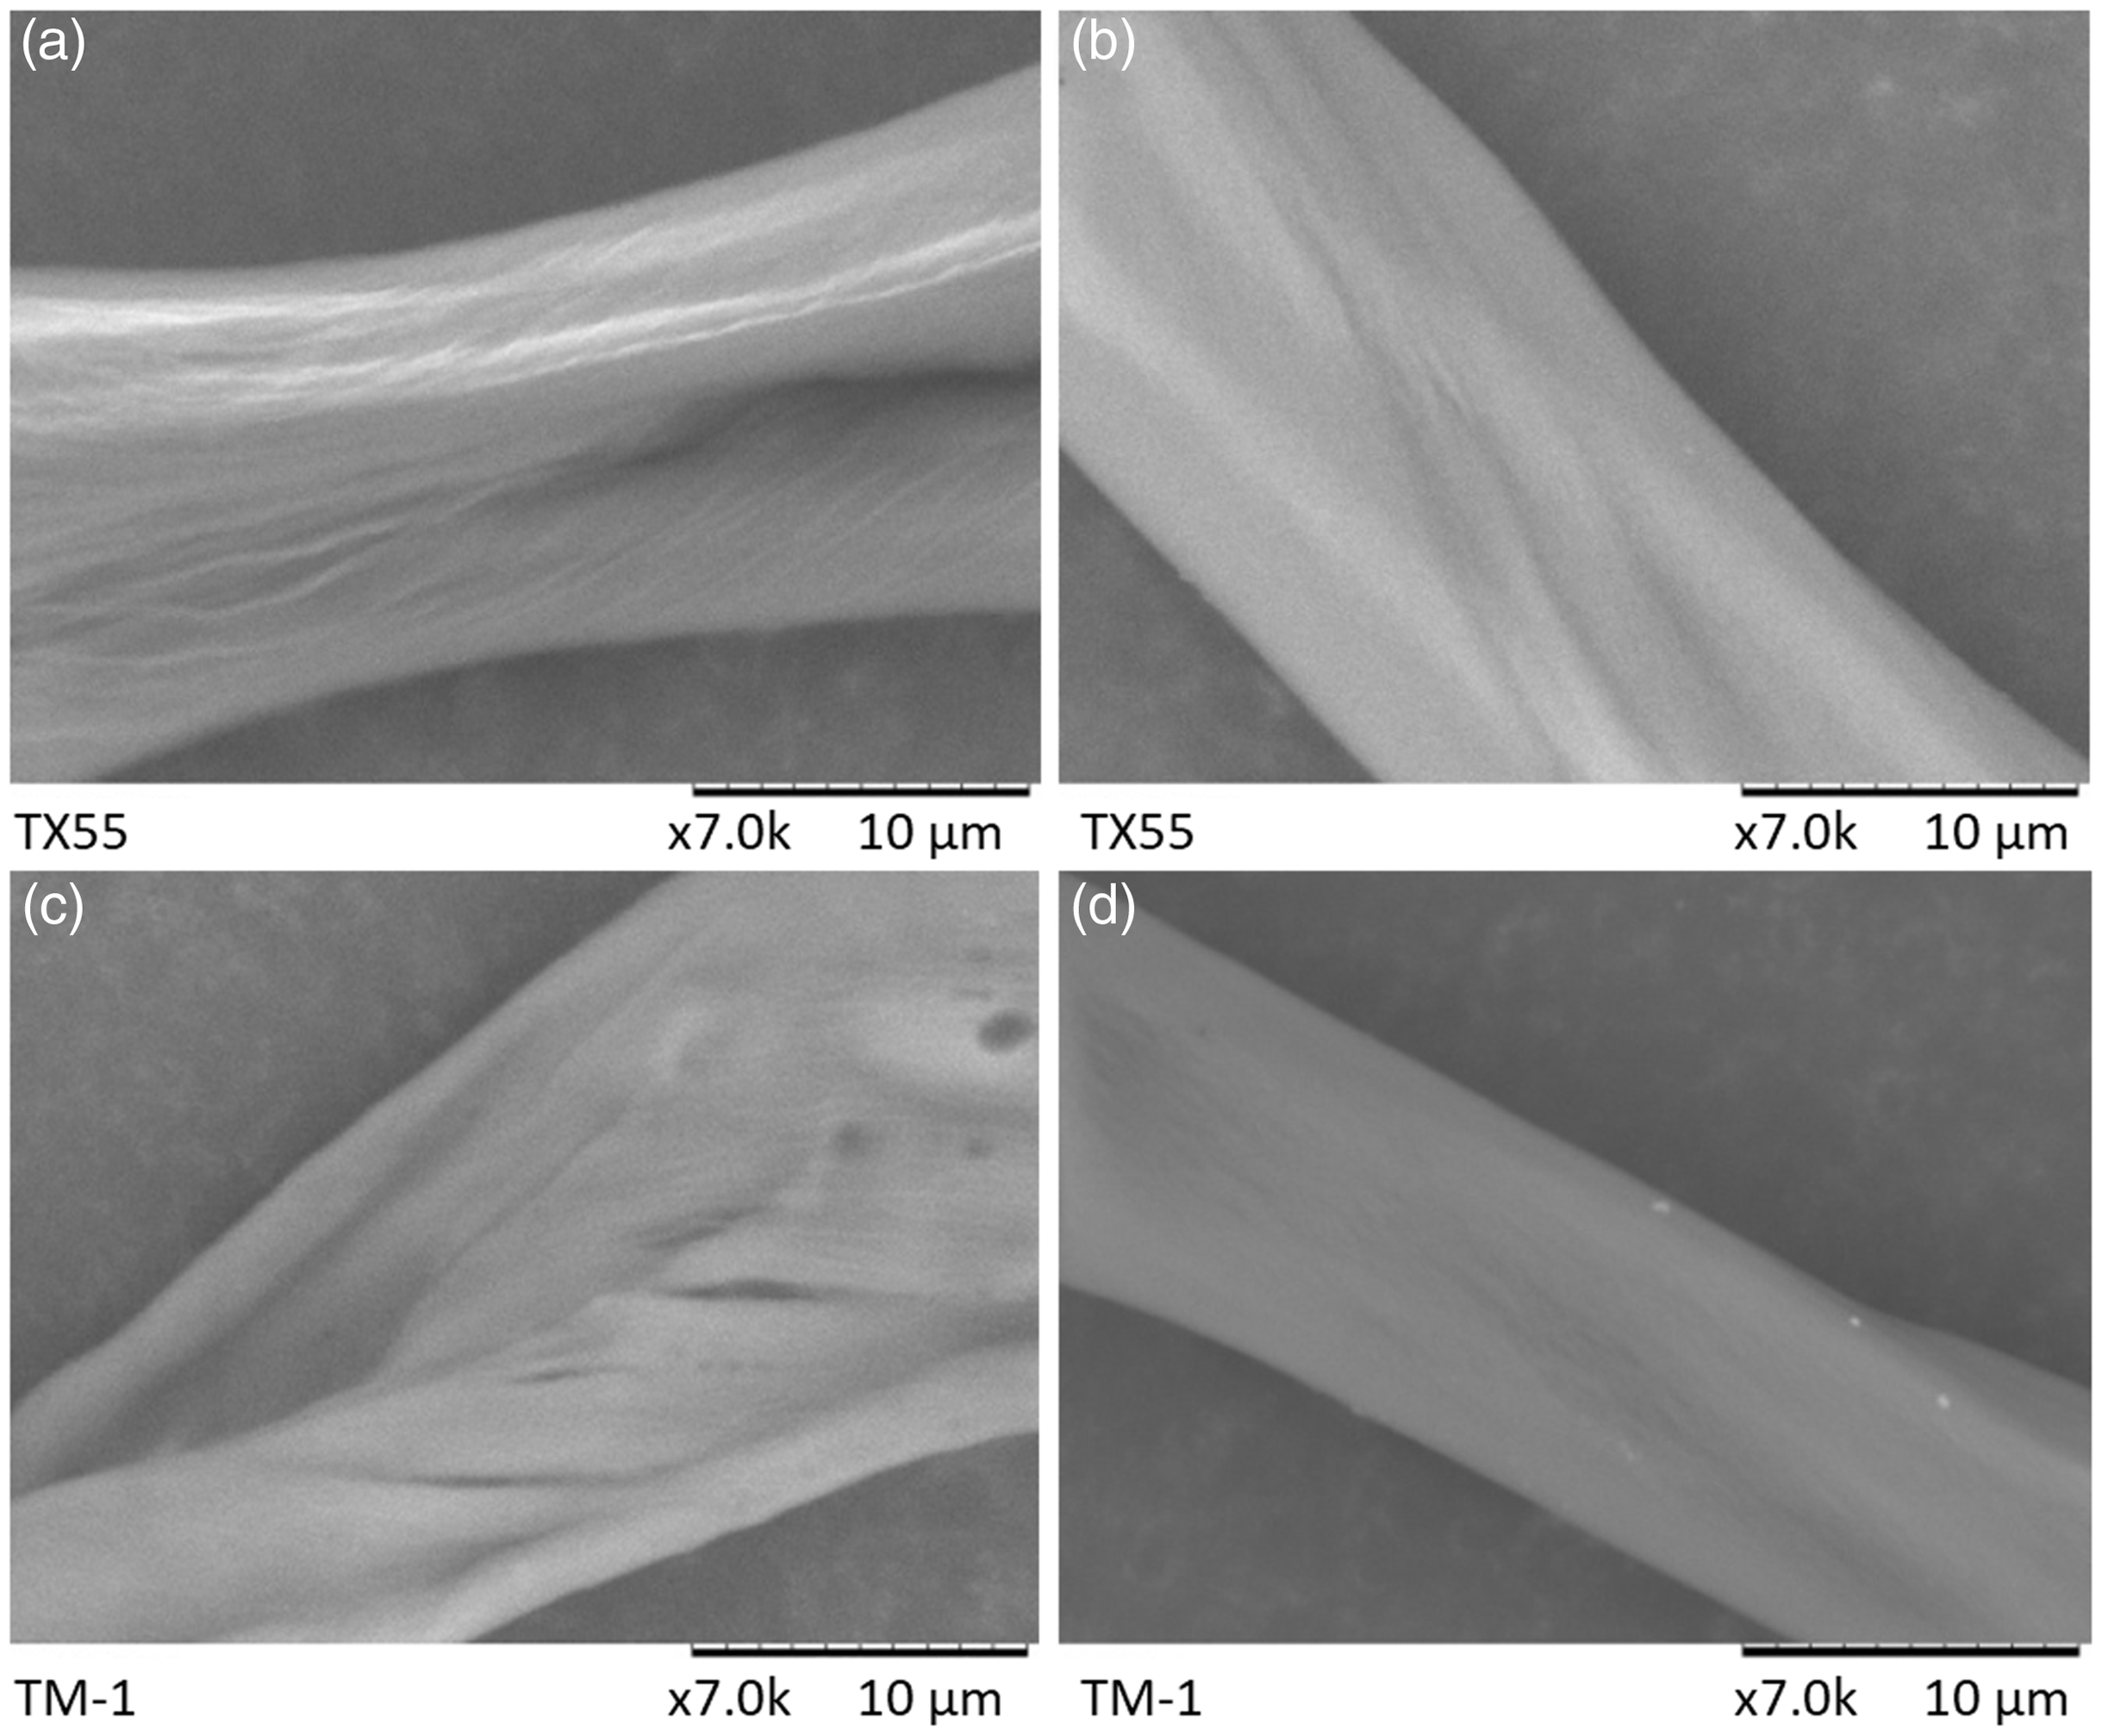
PLM
PLM is known to be efficient in monitoring cotton fiber maturity.
26
It is used in Cottonscope® to measure cotton fiber maturity, fineness, and ribbon width. The deposition of cellulose into well-organized crystalline areas in the secondary cell wall is identified by the development of birefringence in polarized microscopic images of cotton fibers.
27
Birefringence is the presence of two RIs in a material, which divide light into two visible species (double refraction).
28
An increase in birefringence has been reported when cotton fibers enter secondary cell wall synthesis phase.
29
Fibers with a well-organized secondary cell wall appear brighter and show greater birefringence.
27
According to the images of cotton fibers under crossed polarized light, mature cotton fibers harvested from both TX55 and TM-1 cultivars show birefringence (Figure 2). Alkali treatment seems to reduce the birefringence of the secondary cell wall and it is in agreement with the slack mercerization of cotton fibers with 20% NaOH solution.
30
This could be due to the reduction of the crystalline areas of the secondary cell wall during alkali swelling.
Polarized light microscopic images of cotton fibers harvested at 56 days post anthesis: (a) untreated fibers harvested from TX55 cultivar; (b) NaOH-treated fibers harvested from TX55 cultivar; (c) untreated fibers harvested from TM-1 cultivar; (d) NaOH-treated fibers harvested from TM-1 cultivar.
WAXD
Figure 3 shows the WAXD of untreated and NaOH-treated cotton fibers. The crystalline structure of cellulose seems to be remarkably different after NaOH treatment. Untreated cotton fibers harvested from both cotton cultivars show cellulose crystalline polymorph type I with the greatest scattering of 200 lattice plane at 2θ = 22.5o.13,31,32 In addition, other characteristic peaks of cellulose I crystals were observed approximately at 2θ = 14o and 16.5o in untreated cotton fibers.21,31,32 The crystalline structure of untreated cotton fibers changed into crystalline polymorph type II upon NaOH treatment, showing prominent peaks of cellulose II at 2θ = 12.5o, 20.5o, and 22.1o in the diffractogram.
32
Overall, the diffraction patterns of both untreated and NaOH-treated cotton fibers were in agreement with previous studies.31,33 Mercerized cotton is known to have an increased amount of amorphous cellulose, smaller crystallite size, and disorganized crystallite orientation,
30
which may lead to better dissolution.
Wide-angle X-Ray diffraction pattern of untreated and NaOH-treated cotton fibers harvested at 56 days post anthesis from (a) TX55 cultivar and (b) TM-1 cultivar.
FTIR spectroscopy
FTIR spectroscopy was used to determine the changes in cellulose crystallinity.34,35 Figure 4 illustrates changes that occur in the FTIR spectra of mature cotton fibers subjected to 23% NaOH treatment. The peak locations and/or intensity of several characteristic vibrations are slightly changed following NaOH treatment, indicating changes in the type of crystalline structure and the level of crystallinity.23,34 In fact, the mercerization process reduces the peak intensities of many absorption bands except the vibration located approximately at 897 cm−1,
35
which is attributed to β-linkage of cellulose.
18
This is because NaOH treatment increases the amorphous nature of cellulose in cotton fibers. FTIR spectroscopy further demonstrates the change in the type of crystallinity, especially due to the appearance of two characteristic peaks of cellulose II located at 3488 and 3447 cm−1. These vibrations are attributed to –OH stretching of intramolecular hydrogen bonds.
36
The peaks located at 1108 and 1052 cm−1 are assigned to ring stretching in-plane vibration and C-O stretching vibration at the sixth carbon of glucose, respectively, of cellulose I allomorphs.
23
The aforementioned vibrations are hardly visible in the treated fibers, indicating the transition of cellulose I allomorph into cellulose II following NaOH treatment. The IR crystallinity index or lateral order index, which is estimated by calculating the IR peak intensity ratio of 1429/897, is known to decrease as the amount of cellulose II increases.
35
The NaOH-treated cotton fibers show reduced intensity at 1429 cm−1 and increased peak intensity at 897 cm−1, which in turn denotes a reduction in the IR crystallinity index.
Fourier transform infrared spectra of untreated and NaOH-treated cotton fibers harvested at 56 days post anthesis: (a) harvested from TX55 cultivar; (b) harvested from TM-1 cultivar [3488 and 3447 cm−1: OH stretching of intramolecular hydrogen bonds; 2900 cm−1: C-H stretching; 1640 cm−1: O-H bending of adsorbed water; 1429 cm−1: CH2 scissoring (crystalline); 1372 cm−1: C-H bending; 1100 cm−1: anti-symmetric in-plane stretching; 1052 cm−1: C-O stretch; 897 cm−1: β-linkage (amorphous); 710 cm−1: CH2 scissoring (crystalline)].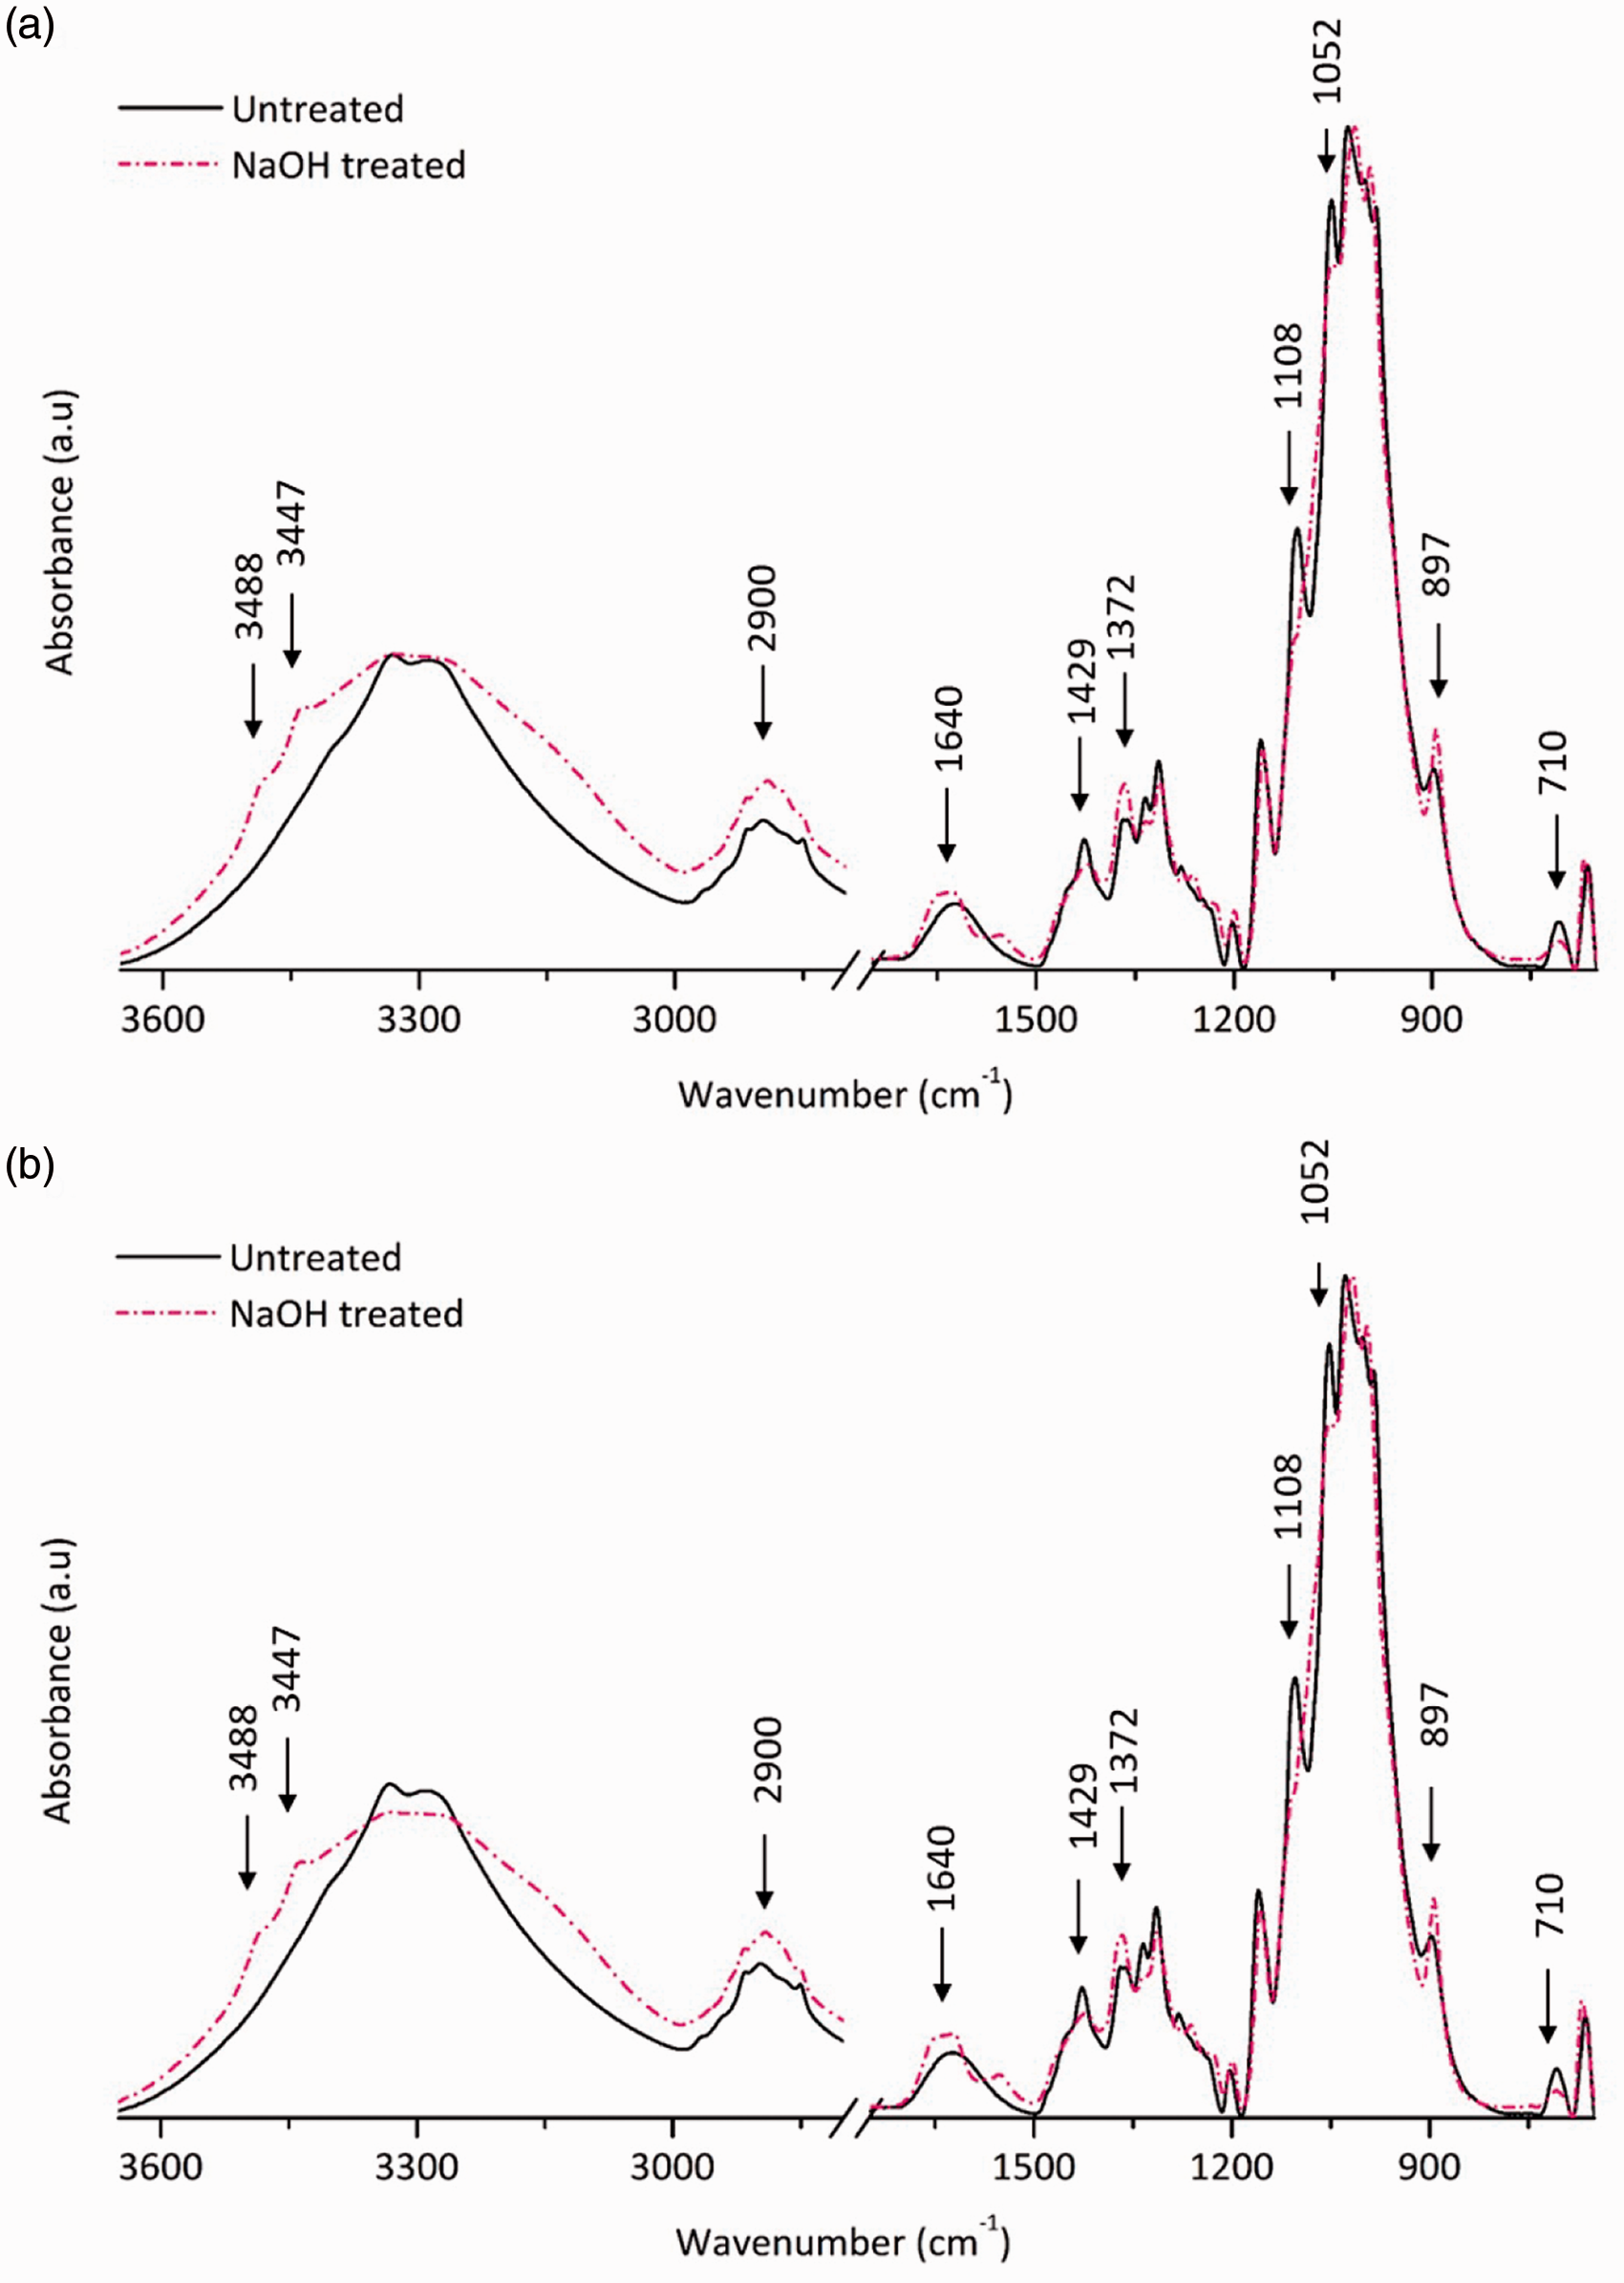
FTIR imaging
FTIR imaging is a powerful analytical tool that can be used to determine the chemical composition and spatial distribution of chemical functional groups within a sample. It is ideal for the determination of chemical changes in cotton fibers upon NaOH treatment. Images were captured in the transmission mode to determine changes inside cotton fibers. Figure 5 shows visible images, false-color average absorbance FTIR images, and chemical maps of the β-linkage of cellulose in untreated and NaOH-treated fibers harvested at 56 dpa. The visible images of treated fibers appear thinner compared to untreated fibers as a result of becoming cylindrical and untwisted due to NaOH swelling of cellulose. The highest absorbance of FTIR images is presented in red, while the lowest is presented in purple as shown in the side scale. As we observed in the FTIR spectra of fibers (Figure 4), there is an increase in intensity of the vibration at 897 cm−1 in pretreated fibers, which is attributed to β-linkage in cellulose. The distribution of β-linkage of cellulose provides information on the location of the amorphous cellulose within cotton fibers. Therefore, the distribution of the peak at 897 cm−1 was obtained using the spectrum image software. Untreated cotton fibers harvested from both TX55 and TM-1 cultivars show an uneven distribution of β-linkage compared to treated fibers. Treated cotton fibers show a rather even distribution of β-linkage, which indicates that the amorphous nature of cellulose increases upon pretreatment. However, TM-1 fibers seem to have a lesser effect from NaOH treatment because the distribution of β-linkage in untreated and NaOH-treated fibers does not differ drastically.
Visible image of cotton fibers harvested at 56 days post anthesis (left), corresponding average absorbance Fourier transform infrared images (middle), and chemical maps showing the distribution of the peak at 897 cm−1 (right), which is attributed to β-linkage in cellulose: (a) untreated fiber harvested from TX55 cultivar; (b) NaOH-treated fiber harvested from TX55 cultivar; (c) untreated fiber harvested from TM-1 cultivar; (d) NaOH-treated fiber harvested from TM-1 cultivar. (Color online only.)
Dissolution of cotton fiber samples in DMAc/LiCl
According to our preliminary investigations, mature cotton fibers were very difficult to dissolve in the DMAc/LiCl solvent system under low temperature conditions even after 6 days of dissolution. Moreover, dissolution experiments conducted at different conditions, such as higher temperature conditions, excessive vortex mixing, and magnetic agitation, resulted in lower MW and broader MWD, indicating possible polymer degradation (result not shown). Cellulose in samples that were dissolved at a lower temperature with mild shaking and vortexing twice a day had considerably increased MW.
The dissolution process took a longer period of time compared to previous studies for a number of reasons5,8,10,12,17,37,38: different sources of cellulose vary in MW, level of crystallinity, and composition, which results in complete dissolution within a few minutes or over a period of several days. Cotton cellulose, high in crystallinity and MW, is generally difficult to dissolve. However, cotton cellulose has been reported to dissolve within a shorter period of time depending on the method of activation and dehydration conditions. 16 For example, NaOH-treated cotton fibers, dehydrated using solvent exchange with DMAc, may dissolve faster compared to NaOH-treated oven-dried cotton samples. Oven drying at high temperatures removes inter-molecular water molecules and facilitates the formation of strong hydrogen bonds between neighboring cellulose molecules, which reduces the solubility. In the current study, we dried NaOH-treated fibers at 100℃ for 4 h. This could be one of the reasons that resulted in a longer dissolution period compared to NaOH-treated cotton fibers dehydrated under solvent exchange with DMAc. 16 Furthermore, the level of mechanical agitation, dissolution temperature, and LiCl concentration may have affected the dissolution period.
Little is known about the role of the primary cell wall on cotton fiber strength. 5 The primary cell wall is generally removed during scouring and bleaching operations. Therefore, in the current experiment, we neglected the removal of the primary cell wall compounds with NaOH treatment and did not characterize the molecular properties of cellulose in the primary cell wall. It has been reported that dissolved cellulose chains form strong hydrogen bonds with water molecules and, therefore, become aggregated in the presence of water. 14 Hence, several measures were used to avoid contaminating the system with water as LiCl and absolutely dry DMAc are extremely hygroscopic. 14 Lithium chloride was dried at 100℃ for at least 48 h and taken out of the oven immediately before use. The pretreated cotton and the test tubes with 15 mg of the sample were dried at 100℃ for 3 and 1 h, respectively. DMAc was dried using molecular sieves. The DMAc and cotton sample mixture was heated to 150℃ before closing the test tubes to eliminate any remaining water. Finally, the test tubes were kept closed during the entire dissolution period to prevent moisture contamination. The presence of water traces in diluted cellulose stock solution induces the formation of larger aggregates upon storage over 5 days. 14 Therefore, diluted solutions were immediately filtered and analyzed using GPC. The undissolved cellulose particles and polymer aggregates in the solvent system were removed by filtering through 0.20 µm filtering units.
Molecular weight and molecular weight distribution of cellulose
Figure 6 shows the RI versus the retention volume of cotton fibers harvested at 23, 36, and 56 dpa. All three replicates of each maturity level gave consistent MWD. It is clearly shown that cellulose tends to have a broader peak distribution at early stages of fiber development.
17
Immature fibers, harvested from TM-1 at 23 dpa, for example, show a broader MWD compared to fibers harvested at 36 and 56 dpa. As a result, 23 dpa samples are polydisperse to some extent (average polydispersity index: 23 dpa – 1.33, 36 dpa – 1.08, and 56 dpa – 1.09). Polydispersity indexes and MWD curves of TX55 fibers do not drastically change during fiber development (average polydispersity index: 23 dpa – 1.15, 36 dpa – 1.06, and 56 dpa – 1.04). Moreover, the curves peaked at higher retention volume compared to 36 and 56 dpa, demonstrating that cellulose molecules have not yet reached the maximum MW. In contrast, mature cotton fibers show a narrower MWD. The chromatograms peaked at lower retention volume, illustrating that the majority of cellulose molecules have reached their maximum MW. The MWD and peak retention volume of cotton fibers harvested at 36 and 56 dpa are identical in both varieties, indicating the cessation of cellulose synthesis around 36 dpa. The gel permeation chromatogram of cotton usually shows two distinct peaks related to primary and secondary cell wall cellulose.
4
However, in the current study, we did not observe a peak for the primary cell wall, possibly due to the removal of low MW primary cell wall cellulose during NaOH treatment; low MW cellulose tends to dissolve in aqueous NaOH solutions.
33
Refractive index versus retention volume of cotton cellulose harvested at 23, 36, and 56 days post anthesis (dpa) from (a) TX55 cultivar and (b) TM-1 cultivar.
Figure 7 and Table 1 show the evolution of the MW and degree of polymerization (DP) of cellulose as a function of fiber development. For fibers harvested from TX55, a linear increase in MW between 17 to 30 dpa is observed. No major change is observed after 36 dpa (P ≤ 0.05). The MW of cellulose reached a plateau at 2.4 × 10⁶ Da. For fibers harvested from TM-1, the MW of cellulose increases between 20 to 30 dpa, and no major change is observed thereafter (P ≤ 0.05). The pattern in Figure 7 is in good agreement with the variation in cellulose content reported in our previous experiment, and it demonstrates that cellulose content and MW simultaneously increase with fiber development.
18
The MW of cellulose in cotton fibers harvested from TM-1 between 17 and 23 dpa is lower compared to that of cellulose in fibers harvested from TX55. The MW of cellulose in fibers harvested from TM-1 at 17 dpa is 0.549 × 10⁶ Da. This value is in comparable range to the value reported by Timpa and Triplett.
17
According to our study, the MWs of mature cotton fibers harvested from TX55 and TM-1 are 2.64 × 10⁶ and 2.67 × 10⁶ Da, respectively. These values are comparable to that of cotton fibers collected from open bolls at 60 dpa (2.225 × 10⁶ Da).
17
However, a few studies reported MW of cellulose as 1.83 × 10⁶,
15
1.5 × 10⁶, 3.0 × 10⁶,
5
1.64 × 10⁶, 1.58 × 10⁶, and 1.21 × 10⁶ Da,
4
which are relatively different from our results. This could be due to several reasons, such as growing conditions, variety, method and conditions of dissolution, and the use of the PMMA standard for system calibration.
Molecular weights of cellulose in fibers harvested from TX55 and TM-1 at different stages of fiber development. Degree of polymerization of cotton cellulose at different stages of fiber development dpa: days post anthesis.

We observed that cellulose in fibers from TX55 had a larger MW and narrower MWD at early stages of fiber development compared to cellulose in fibers from TM-1. Moreover, infrared spectra extracted from FTIR images of individual fibers harvested at 20 dpa show that the infrared vibrations in the fingerprint region (∼1161, ∼1108, and ∼1052 cm−1) appear sharper and higher in intensities in fibers harvested from TX55 compared to TM-1. This indicates the presence of more cellulose in immature fibers harvested from TX55 compared to that of fibers harvested from TM-1 at a similar age. Because molecular properties as well as structural organization of cellulose influence fiber strength, further studies are needed to confirm whether immature TX55 fibers behave as mature fibers and produce strong yarns.
Cellulose distribution in individual fibers
In a previous study performed on a bundle of fibers, we reported that fibers harvested from TM-1 and TX55 cultivars at different stages of development can be categorized into three major development stages (elongation/primary cell wall formation, secondary cell wall formation, and maturation).
18
However, biochemical information from individual cotton fibers at different phases of fiber development have not been studied. Therefore, we collected FTIR images in the transmission mode from individual cotton fibers at different development stages. Since the infrared beam is passing through intact cotton fibers, we can acquire compositional data from inside a fiber. Visual image and corresponding average absorbance FTIR images of three cotton fibers, representing the beginning of the secondary cell wall synthesis (23 dpa), secondary cell wall synthesis (30 dpa), and completion of fiber maturity (56 dpa) are shown in Figure 8. According to the side bar of the FTIR image, the highest absorbance area is shown in red, whereas the lowest absorbance is shown in dark purple. Every pixel of the infrared image contains an individual spectrum, which represents the chemical composition at that particular location. The extracted spectra from various locations are compared to identify the relative concentration of different chemical functional groups. Furthermore, chemimaps are developed from the average absorbance image to study spatial variations in composition. A chemimap shows the relative distribution of a given infrared peak (chemical functional group) or a group of consecutive peaks in the sample.
Visible and corresponding Fourier transform infrared images of cotton fibers harvested from TX55 at (a) 23 days post anthesis (dpa), (b) 30 dpa, and (c) 56 dpa and from TM-1 at (d) 23 dpa, (e) 30 dpa, and (f) 56 dpa. Highest and lowest absorbance are shown in red and purple, respectively. (Color online only.)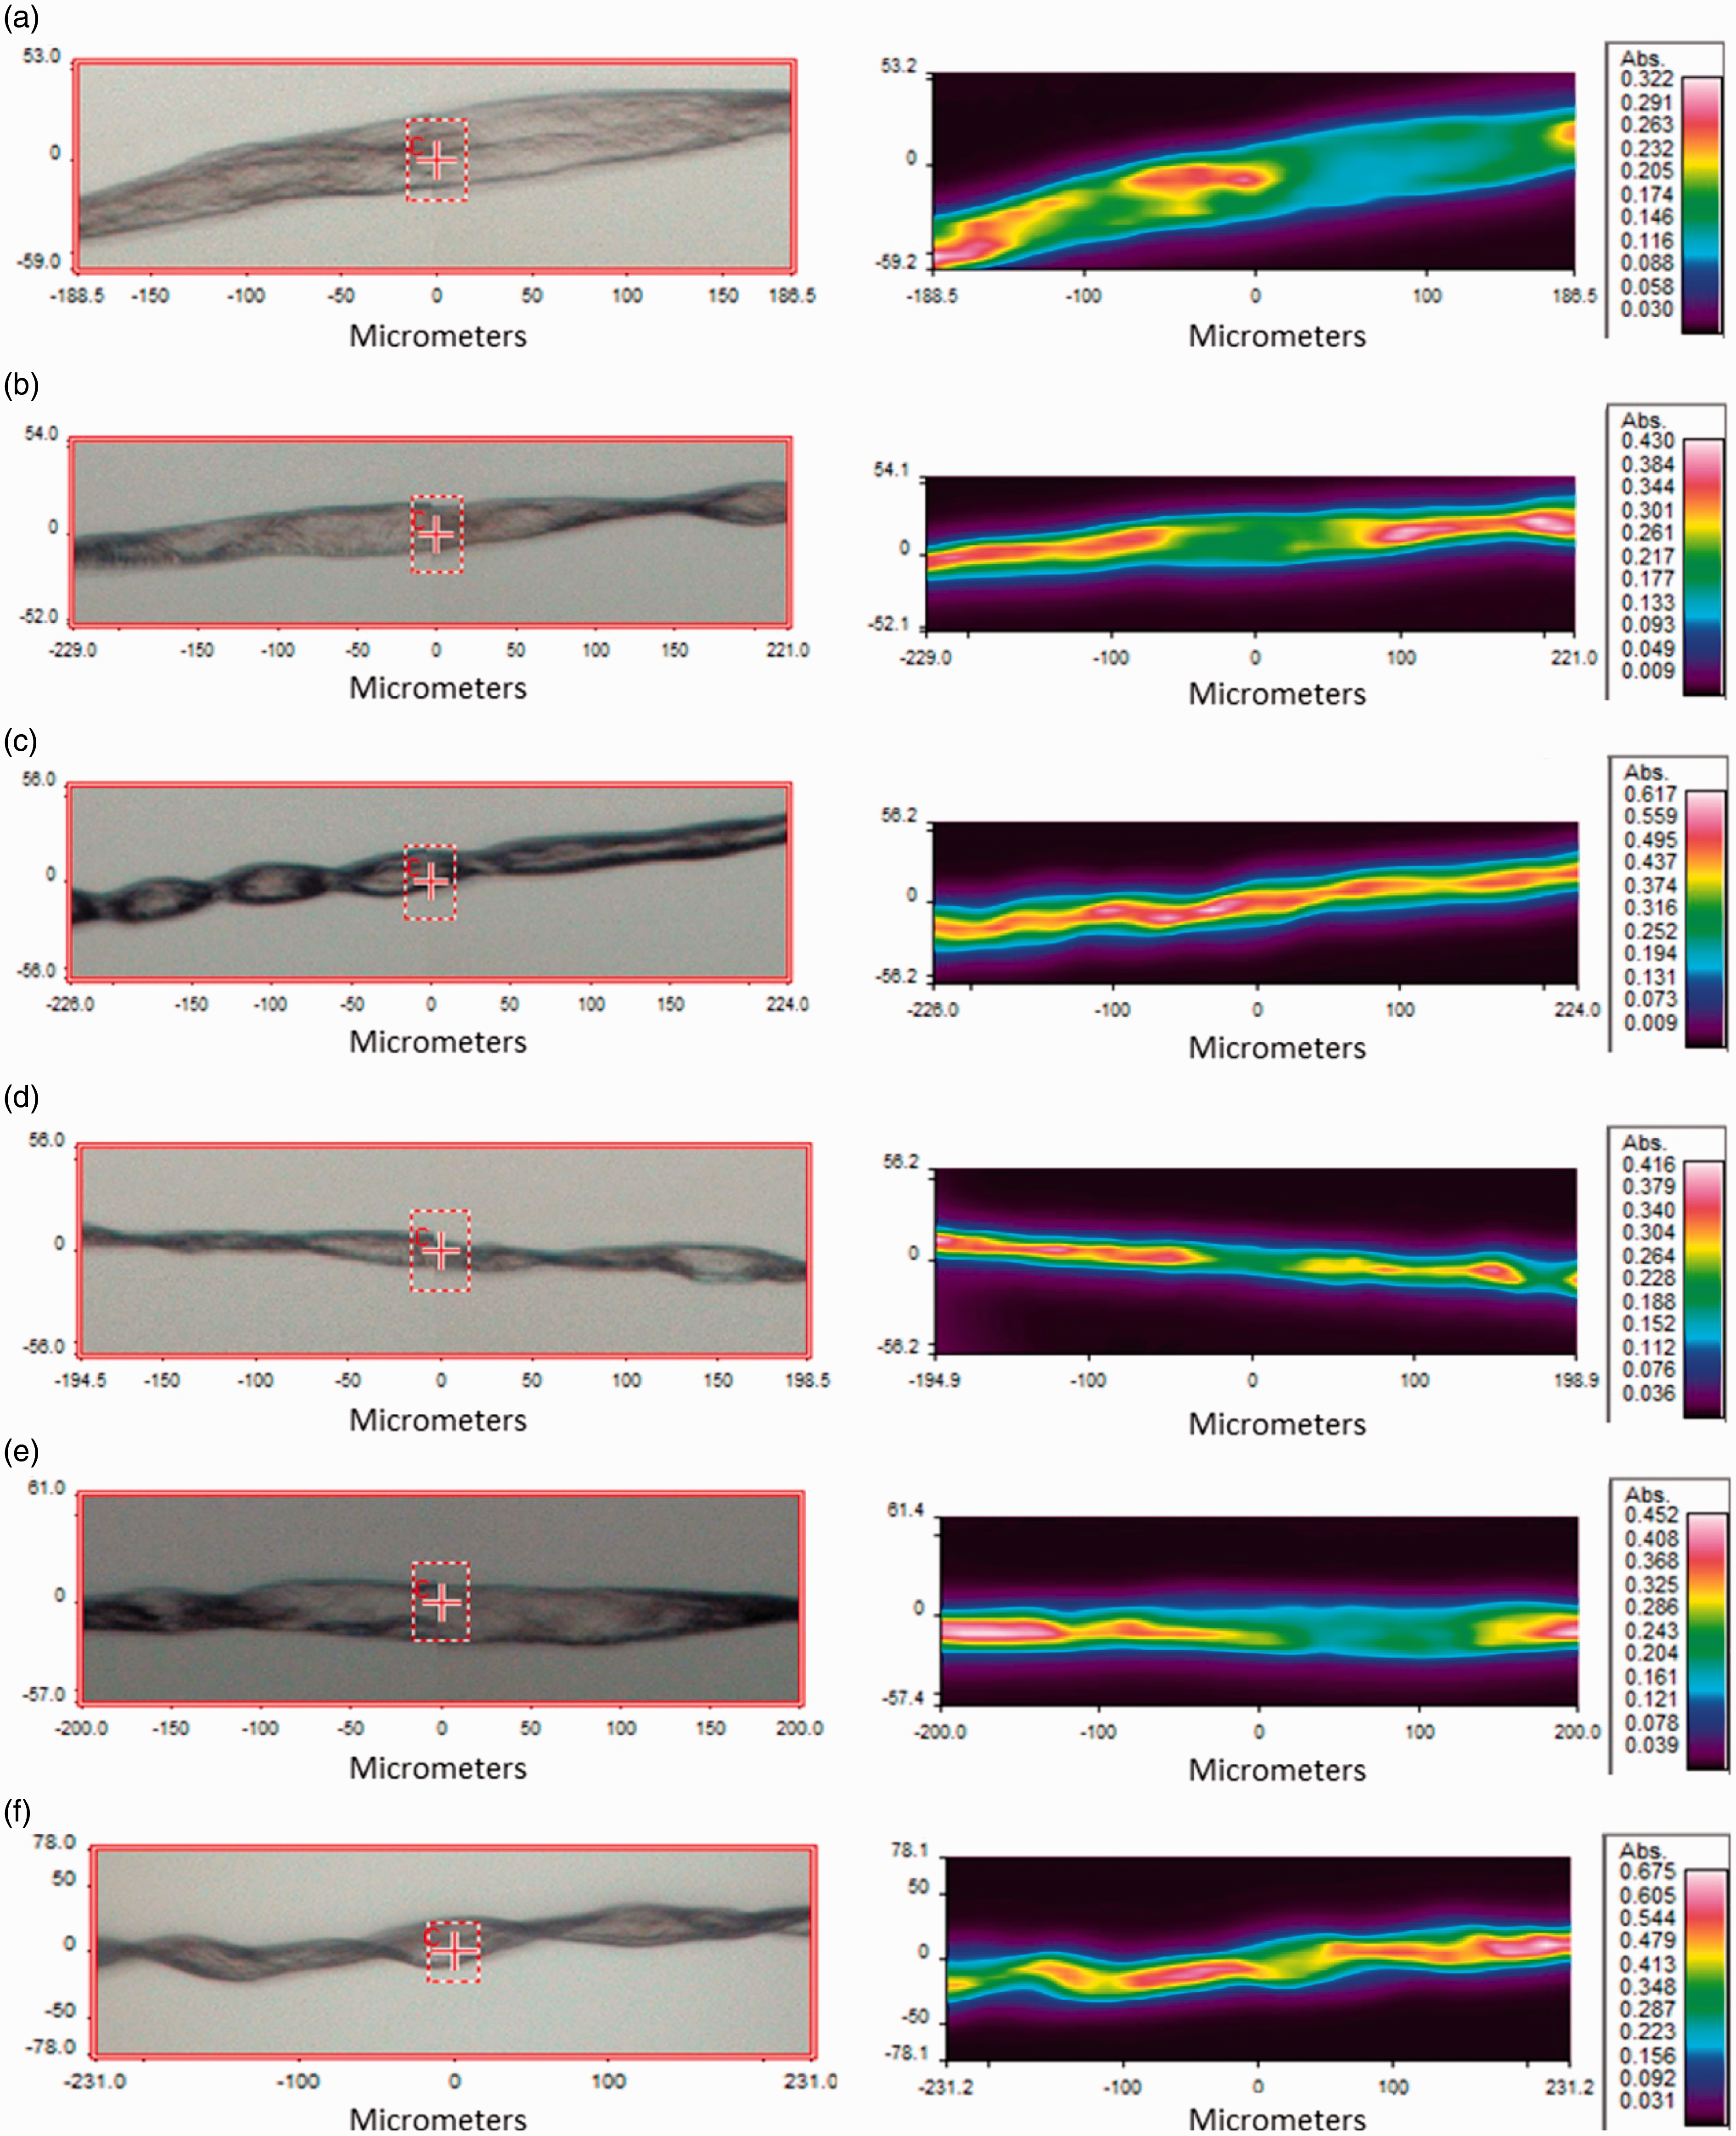
In this experiment, we used chemimaps of selected important functional groups of cellulose to study the compositional and structural changes in cotton fibers with fiber development. Based on our previous work, intensities of the vibrations at 897 (β-linkage of cellulose), 1161 (anti-symmetrical C-O-C stretching of cellulose), and 1429 cm−1 (CH2 scissoring) increased during fiber development.
18
The distributions of the aforementioned infrared vibrations tend to spread within fibers during development (Figure 9). Both β-linkage and anti-symmetrical C-O-C stretching of cellulose are distributed in small areas of fibers at 23 dpa. This indicates low cellulose deposition in the secondary cell wall at the beginning of secondary cell wall biosynthesis. These high absorbance areas tend to spread along the fibers with further fiber development. At fiber maturity, the middle part of the fibers is visible in red, depicting an increased cellulose deposition in the secondary cell wall. However, the outer layer of the fibers, possibly the winding layer and the primary cell wall, are shown in green and blue, respectively. This indicates a lower amount of cellulose in the winding layer and the primary cell wall. Furthermore, cellulose crystalline vibration at 1429 cm−1 shows a similar trend, demonstrating that cellulose organization gradually increases with fiber maturity. These results indicate non-uniform cellulose deposition along cotton fibers that may lead to weak spots in fibers. A large number of fibers should be analyzed from each dpa to understand differences in cellulose deposition between cultivars. Further studies are needed to identify the possible relationship between fiber strength and differences in cellulose deposition.
Distribution of important infrared absorbance bands of cellulose in cotton fibers harvested at 23, 30, and 56 days post anthesis (dpa) from (a) TX55 and (b) TM-1. Highest and lowest absorbance are shown in red and purple, respectively. (Color online only.)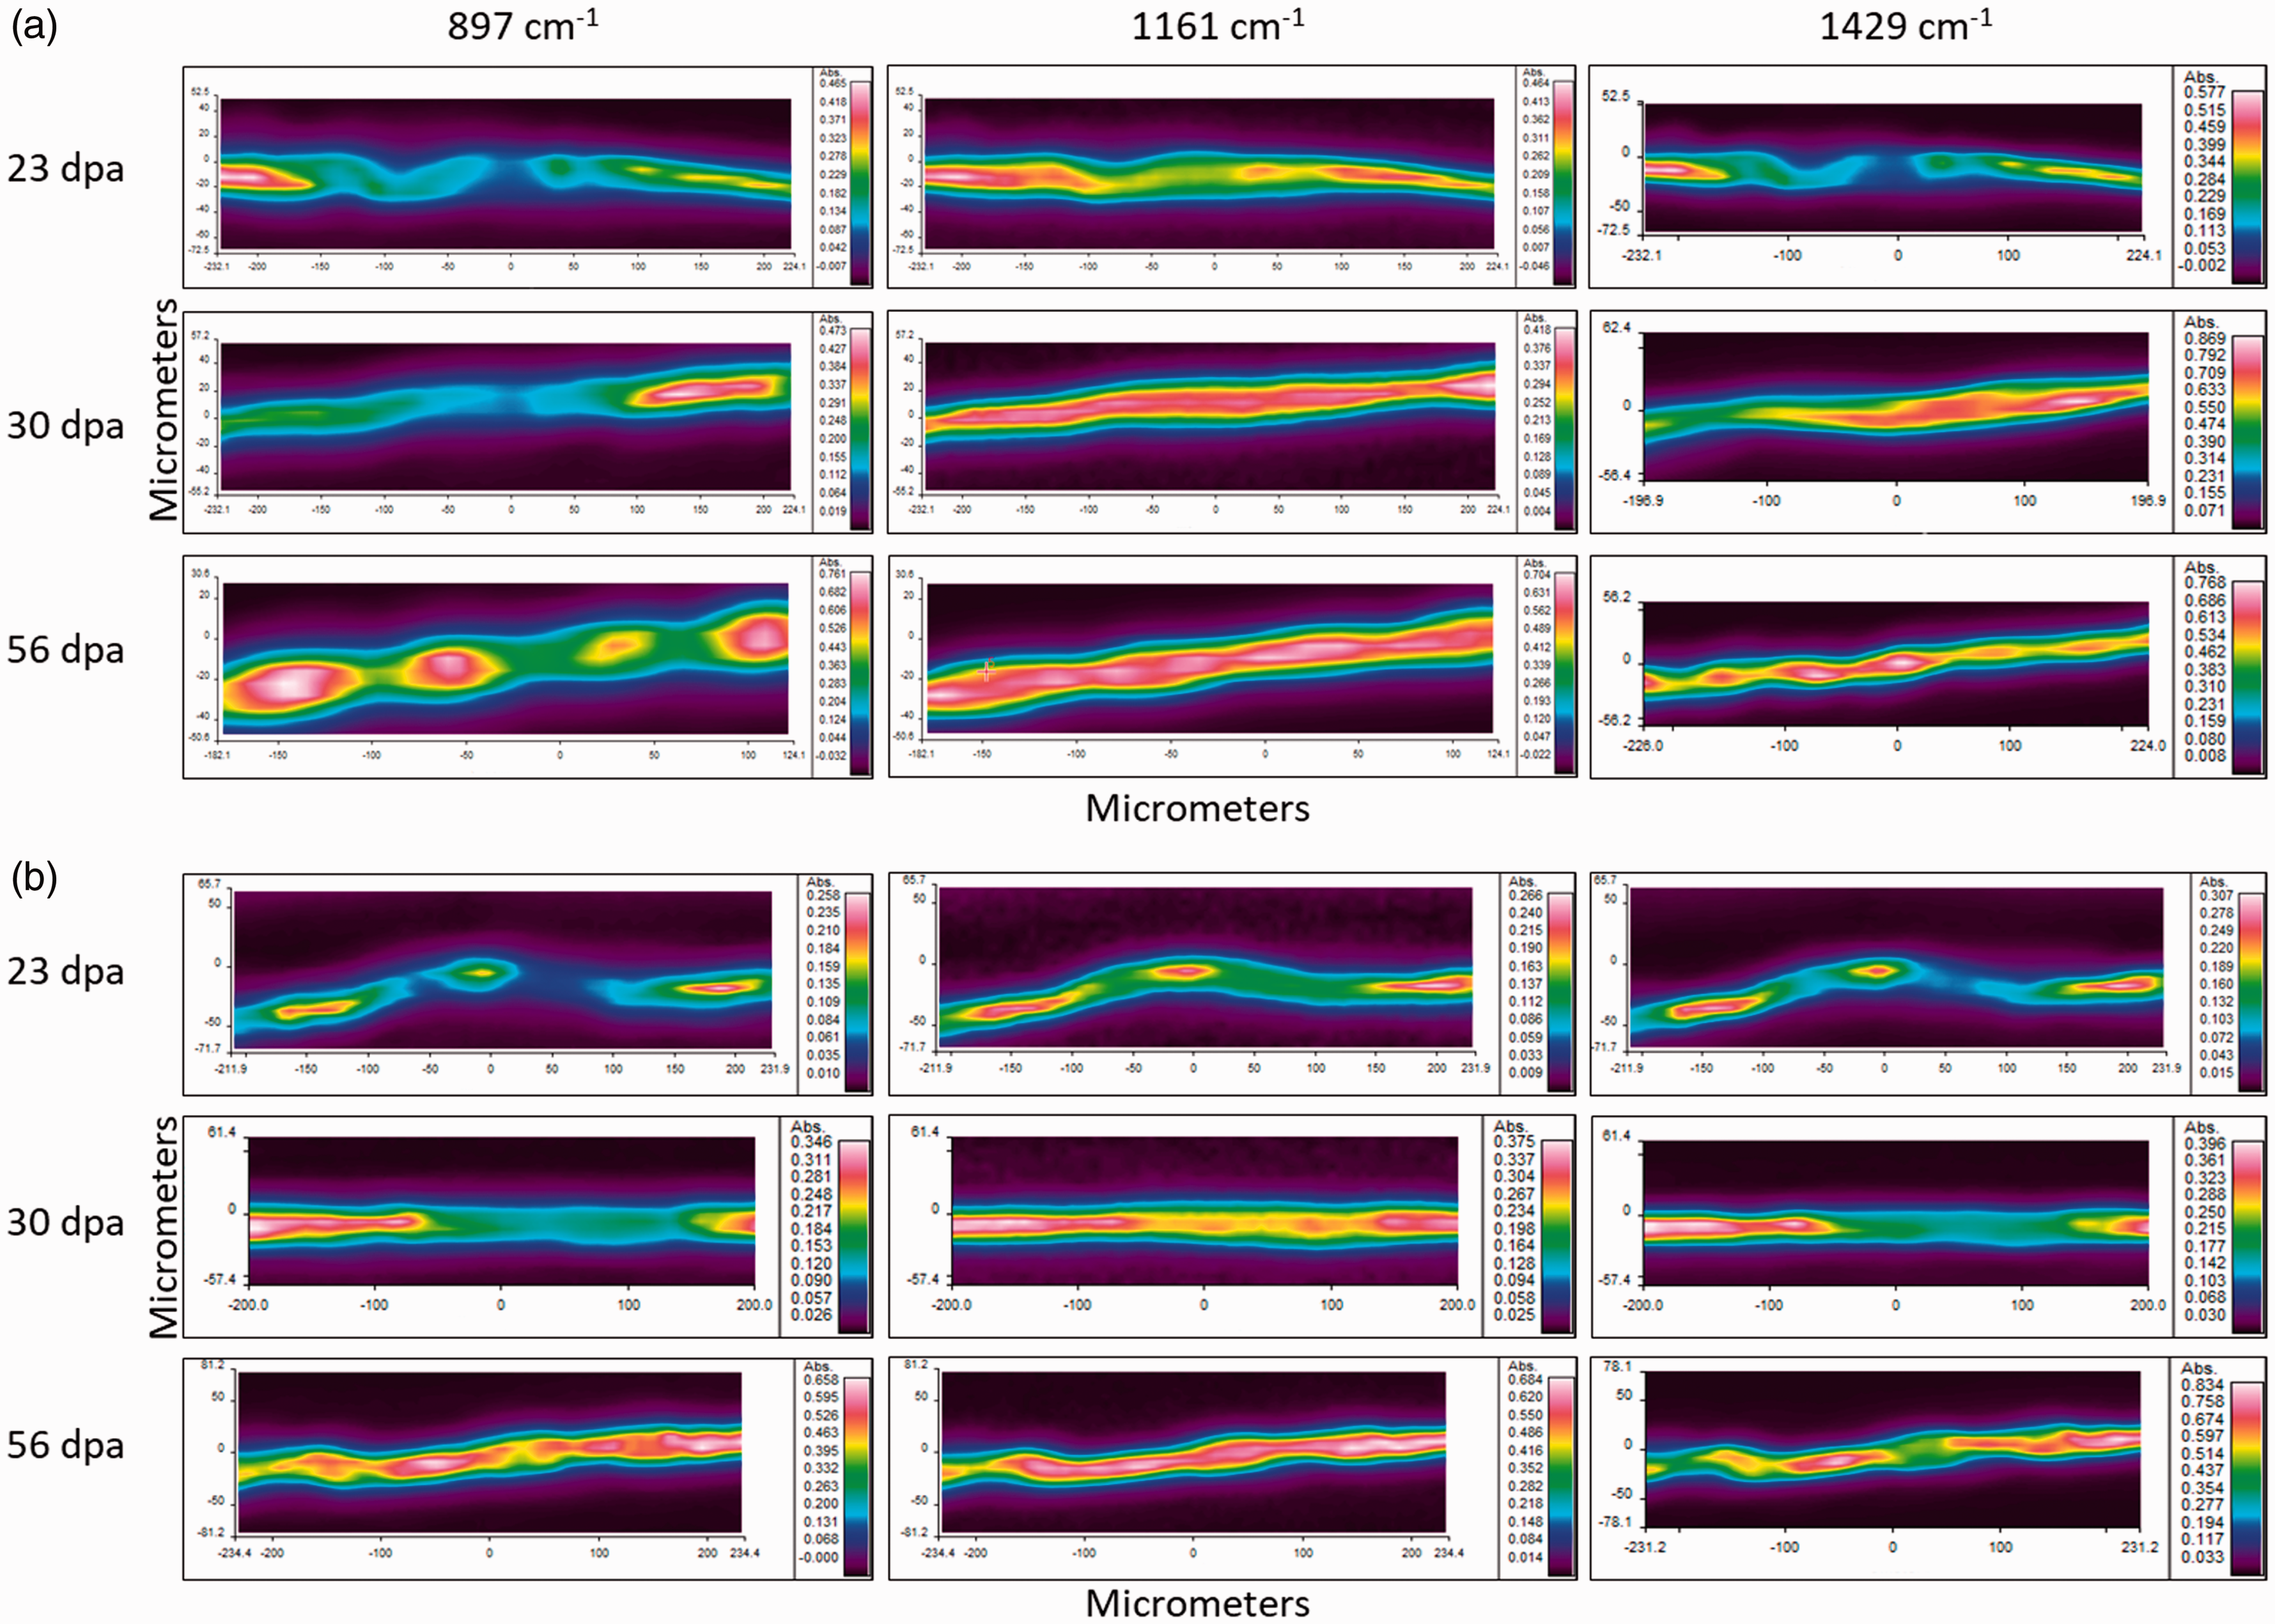
Conclusions
Changes in the MW and MWD of cellulose in fibers harvested from two cotton cultivars (TX55 and TM-1) were analyzed using GPC. Cotton cellulose was hard to dissolve in the DMAc/LiCl solvent system even after 6 days of dissolution. This could be attributed to large MW, a high level of crystallinity, and the presence of crystalline polymorph type I. Pretreatment of cotton fibers with strong alkaline solution (23% NaOH) reduced the level of crystallinity and changed the crystalline polymorph form I to II. Physical, chemical, and morphological changes resulting from NaOH treatment were studied using several analytical tools, such as FTIR spectroscopy, X-ray diffractometry, polarized microscopy, scanning electron microscopy, and FTIR microspectroscopy. The dissolution was carried out over a longer period of time under mild conditions (low temperature and reduced level of mechanical agitation) to minimize the degradation of cellulose molecules. We observed that the MW and MWD of cellulose in fibers harvested from TX55 and TM-1 differ at early stages of fiber development. At maturity, there was no difference in MW between fibers harvested from the two cultivars. Fibers harvested from both TX55 and TM-1 reached a maximum MW by 30 dpa, and no significant difference in MW is observed thereafter (P ≤ 0.05). Furthermore, FTIR images of individual cotton fibers, harvested at different stages of fiber development, showed changes in cellulose distribution with fiber development. In particular, distributions of infrared vibrations that are attributed to β-linkage, anti-symmetrical C-O-C stretching, and CH2 scissoring of cellulose showed cellulose distribution in intact cotton fibers.
Footnotes
Acknowledgements
The authors would like to thank Erandathi Rajakaruna and Tanya Jackson for collecting GPC and XRD data, respectively.
Declaration of conflicting interests
The authors declared no potential conflicts of interest with respect to the research, authorship, and/or publication of this article.
Funding
The authors disclosed receipt of the following financial support for the research, authorship, and/or publication of this article: This work was partially supported by the Cotton Incorporated Texas State Support Committee (Grant Number 12-118TX).