
Abstract
This paper proposes a seven-characteristic method called Local Feature Similarity (LFS) to recognize weave pattern repeat automatically. The LFS method includes yarn feature acquisition, yarn marking, yarn marking subsequence segmentation, yarn marking subsequence similarity calculation and weave pattern repeat size, which recognizes the repeat size by the texture of the fabric image without considering the color influence. LFS can be applied to the three primary weave patterns and their expansions, such as warp rib, weft rib and panama, and basket weave patterns. Furthermore, six classical adaptive methods are introduced to increase the recognition rate based on the LFS method. As a result, the pre-steps of the recognition of the weave pattern repeat size are improved. Experiments proved the high degree of applicability and robustness of the LFS method. Compared with state-of-the-art methods, the LFS method has the highest recognition rate (99.62%) for the whole sample and excellent performance in average recognition time (6.97 ms). Experiments revealed that the higher recognition rate of the LFS method is helpful for a higher rate of weave pattern repeat recognition and weave pattern recognition (our source code and all experimental results are publicly available: https://github.com/spring2001/automatic-recognition-method-for-the-repeat-size-of-weave-pattern-on-woven-fabric-image).
Most fabrics, in which wefts and warps are woven periodically, can be deciphered as one or multiple types of weave pattern repeats. The weave pattern repeat expresses the plane distribution of warp and weft floats, 1 which repeats over the whole area of the fabric and ignores the physical characteristics of each yarn. Weave pattern repeats are tiled in the warp and weft orientation periodically on fabrics. As a key parameter, the repeat size of a weave pattern plays an important role in the design and redesign, production design and control, performance analysis, texture analysis, etc., of woven fabrics.2–4
An automatic recognition method for the repeat size of weave patterns is an important step to recognize weave pattern repeat and improve the accuracy of weave pattern recognition. Presently, the methods of recognizing a weave pattern with computer vision can be categorized as database-based5,6 and adaptive algorithm-based.7,8 Moreover, the latter methods can be classified as image feature-based methods working on the fabric images9–12 and weave pattern-based methods, using the pre-recognized weave pattern.7,13–15
For the database-based recognition methods, matching or classification algorithms are used to match fabrics to different preset templates or categories of weave pattern repeats. Salem and Nasri 16 extracted the Gabor wavelet, LBP (Local Binary Pattern), or GLCM (Grey Level Co-occurrence Matrix) feature from a fabric image, respectively, then used the SVM (support vector machine) on each feature to classify the pattern of the fabric image as plain, twill or satin. Bao et al. 17 proposed an improved KIII simulation model based on the ONN (Olfactory Neural Network), which can recognize the textures of plain weaves, twill weaves, satin weaves and complex weaves. Kuo et al. 5 used back-propagation (BP) neural networks to classify the features extracted from the pre-recognized weave pattern of the three basic weave patterns based on a black–white co-occurrence matrix, then the repeat size of the weave pattern was obtained by the identified three basic weaves. Obviously, those classification methods are only applicable to the basic weaves. Pan et al.6,18 built a standard pattern database storing the basic weave pattern repeats, and similar coefficients were calculated between a pre-recognized weave pattern and the standard pattern to classify the weave pattern repeats with this database. In Pan’s work, a BP neural network was also used to match the structure features of a pre-recognized weave pattern with the standard pattern. 19 However, the performances of those matching methods all depend on database capacity.
The weave pattern repeat recognition methods based on the image feature were proposed in 1999. Kang et al. 20 calculated the general autocorrelation in the weft and warp directions of a fabric image to determine the pattern repeat unit size. In 2015, Jing et al. 9 applied the IDMF (Improved Distance Matching Function) to fabric images and obtained the IDMF curve. The location of the maximum value in the second derivative of the curve is the size of the corresponding weave pattern repeat. Kang and Jing’s methods are only suitable for those fabric images that have similar thickness in the warp and weft. Zheng 10 detected the corners from textural information by the Harris corner detector, then searched for the adjacent corners in the horizontal or vertical direction to identify the repeat size of the weave pattern. This method can only process fabric images with clear texture, horizontal weft and vertical warp. Moreover, the repeat size of the weave pattern obtained by the three methods mentioned above is described by the number of the pixels rather than the yarns in a weave pattern repeat. Lim and Kim 8 calculated the average difference in the color among the rectangular regions in the center of the fabric image and its four same-size neighboring regions, then obtained the size of the weave pattern repeat by expanding the dimension of those regions until the minimum average color difference was calculated. Lim’s method can only be used for a yarn dyed fabric image with uniform illumination. Xiao et al. 11 extracted each yarn’s feature vector by combining all feature vectors of weave points in the corresponding yarn, then calculated the correlation coefficient of the features of the first yarn with that of the other yarns. The pattern repeat size could be obtained based on the peak of the correlation coefficient sequence. However, it is difficult for Xiao et al.’s method to estimate the correct peak of the correlation coefficient sequence automatically when the repeat size is over four yarns or the texture is not clear.
The state-of-the-art research focuses more on the weave pattern-based methods21–23 because these are close to the definition of weave pattern repeat. In Ajallouian et al.’s 24 paper, to obtain the pattern repeat size, each row and column of the pre-recognized weave pattern are put in a separate matrix sequentially until the first repeated row and column are found. Zhong et al.25,26 calculated the largest independent group of the rows and columns of the pre-recognized weave pattern respectively to determine the size of the repeat units. Ajallouian and Zhong’s methods are similar in principle, which is similar to some extent to the approach in Xiao’s method. However, the two methods are only suitable for the recognized weave pattern without error or unrecognized weave point. Wang et al.13,27 calculated the two-dimensional (2D) autocorrelation matrix of the pre-recognized weave pattern to detect the size of the pattern repeat. Zhou et al.14,28 proposed an EL (Extraction and Location) method to detect the size of the repeat unit from the pre-recognized weave pattern with errors and unrecognition. Yet, the accuracy of Wang and Zhou’s methods have good performance only when the repeat size of the weave pattern is less than six. Zhang et al. 7 divided the pre-recognized weave pattern into sub-matrices according to different specified repeat sizes along the horizontal or vertical direction. The similar degree between the same-size sub-matrices is calculated to find the size of the repeat units. Zhang’s method only works when the size of the weave pattern repeat is less than the smaller number, between six and a quarter of the quantity of weft or warp threads on the fabric image. Schneider and Merhof 29 segmented the recognized weave pattern into weave pattern repeats manually. In the current automatic weave pattern-based methods, a general challenge is the rapid increase in the rate of false recognition when the repeat size of the weave pattern is over six.
It is necessary to develop a systematic, comprehensive and modular method of recognizing the repeat size of a weave pattern that can improve the recognition rates and adaptive capacity of the weave pattern repeat size recognition method. In this paper, a seven-characteristic method is proposed to recognize the weave pattern repeat, making full use of the geometric and texture characteristics of the weave pattern repeat, and achieving the best experimental result in comparison with the current methods. This paper is organized as follows: firstly, seven characteristics of the weave pattern repeat are deduced; then an automatic recognition method for the repeat size of the weave pattern, that is, the Local Feature Similarity (LFS) method, is proposed; all the steps of the LFS method and six classic weave pattern repeat recognition methods are modified to prove the validity of the theory; the proposed method is compared with the improved six classic methods to verify the efficiency; the conclusions are given in the last section.
Recognition algorithm on the weave pattern repeat size
Analysis of the characteristics of weave pattern repeats
To precisely recognize the repeat size of weave patterns, the characteristic of the weave pattern repeat must be analyzed comprehensively. There are three basic types of weave patterns and their expansions. As the structure is extended on a plane, weave pattern information can be extracted from a single-layer woven fabric image. Figure 1 shows the three basic patterns of woven fabric and their weave pattern repeats via multi-angles. Figures 1(a)–(c) show the original three basic pattern images obtained by a microscopy camera. Figures 1(d)–(f) show the performances of each weave pattern repeat on these three images. Figures 1(g)–(i) show how the weave pattern repeats are distributed on the weave pattern of the three basic patterns. Figures 1(j)–(l) illustrate the weave pattern repeats of the three basic patterns.
Three basic patterns of woven fabric and their weave pattern repeats: (a) original plain fabric image; (b) original twill fabric image; (c) original satin fabric image; (d) weave pattern repeats in the plain fabric image; (e) weave pattern repeats in the twill fabric image; (f) weave pattern repeats in the satin fabric image; (g) weave pattern repeats in the plain weave pattern; (h) weave pattern repeats in the twill weave pattern; (i) weave pattern repeats in the satin weave pattern; (j) a plain weave pattern repeat; (k) a twill weave pattern repeat; (l) a satin weave pattern repeat.
The definition of the weave pattern repeat is that the smallest unit represents the distribution of warp and weft floats and appears repeatedly over the whole area of the fabric, as shown in Figure 1. The weave pattern repeats on a woven fabric with a simple weave pattern have the following characteristics.
Each weave pattern repeat is a rectangular area constituted by weft floats and warp floats. The repeat size of the weave pattern is determined by the number of wefts and warps in the rectangle. All weave pattern repeats on a woven fabric have the same sizes. Warps or wefts in the weave pattern repeat are classified into different types according to different yarn structures, that is, a different arrangement of weft floats and warp floats along a yarn. The structural type of warp or weft in a weave pattern repeat is the same as the structural type of the corresponding warp or weft in any other weave pattern repeats on a woven fabric. On a woven fabric, different types of warp or weft in all weave pattern repeats are arranged in a fixed order from left to right or from top to bottom. The two nearest weave pattern repeats on a woven fabric are adjacent. Furthermore, the weave pattern of a woven fabric is formed by tiling the same weave pattern repeats on a plane. For two adjacent weave pattern repeats on a woven fabric, one is located along the horizontal or vertical direction with respect to the other one.
These seven characteristics are not only adapted to the basic and simple weave pattern but also adapted to the extended and most complex weave patterns.
As well as the above-mentioned characteristics, the weave pattern repeats have multiple kinds of structures and types due to the various arrangements of weft and warp floats. The database-based methods are only able to match fabrics with preset templates or categories of weave pattern repeats, which may limit the flexibility to recognize various weave pattern repeats. The image feature-based methods and weave pattern-based methods are considered here. The generic representation of the weave pattern repeat is shown in Figures 1(j)–(l). Obviously, it is more intuitive to extract the weave pattern repeat size from the weave pattern shown in Figures 1(g)–(i), so weave pattern-based methods are studied more widely. However, those methods are modeled on the ideal weave pattern without the inevitable weave point errors and defects. Beyond that, the pre-recognized weave pattern is stored in the computer as a matrix whose elements are 0 (for warp floats) and 1(for weft floats). Sometimes, –1 is used to represent the unrecognizable weave points, which means that there are not enough redundant features to ensure the accuracy of weave pattern repeat recognition. The possible errors or defects and the lack of redundant features in the weave pattern may limit the accuracy of weave pattern recognition. Therefore, the image feature-based methods seem to be the best choice to recognize the repeat size of weave pattern.
Compared with the current image feature-based methods, Xiao et al.’s method 11 is more suitable for the above-mentioned weave pattern characteristics. The statistical method is also used in Xiao’s method to avoid possible extreme situations. Nevertheless, Xiao et al.’s method cannot work well when the target image has a large weave repeat or unclear texture, and for these types of woven fabric images, some help in the form of manual operation is needed to increase the recognition accuracy. To overcome the shortcomings of low recognition rate and manual operation, an automatic method is proposed in this paper, which is inspired by Xiao et al.’s method and the seven characteristics. The necessary pre-steps and the whole steps of the LFS method are described as the following sections.
Pre-steps: image pre-processing, deviation correction, weave point segmentation and weave point features extraction for characteristics (a) and (b)
The fabric images taken by microscopy camera are red, green, blue (RGB) color images. To eliminate the influence of color and keep the geometric detail on the fabric, images are transformed into hue, saturation, value (HSV) color space, as shown in Equation (1). Then the V component, that is, the illumination images, will be used in the subsequent processing, which has been proven to be effective for weave pattern recognition.
30
Then median filtering and eroding are deployed to enhance the value image

To extract each yarn and weave point, and rearrange them into a rectangular matrix as characteristics (a) and (b), deviation correction and weave point segmentation are as described in Xiao et al.’s paper, 11 and its improvement by statistical methods is proposed in this paper. For fabric images with horizontal and straightened weft yarns, weft yarns are segmented from the image based on the curve troughs of the horizontal illumination projection first with a Gaussian filter. Then the inclination angle of warp yarns is calculated by counting the average deviation between the corresponding troughs of the top and bottom wefts, and all warp yarns are corrected vertically according to the inclination angle. Finally, warp yarns are segmented based on the curve troughs of the vertical illumination projection with the Gaussian filter. The segmented weft yarns and warp yarns are combined by interlacing to extract each weave point.
When projecting the illuminated images in the horizontal direction, some redundant curve troughs may exist in the projecting curve that will interfere with the yarn segmentation. In this paper, the thickness of yarn is taken into consideration to remove the redundant curve troughs. Every curve trough is regarded as the boundary between two neighboring yarns, so the interval between two neighboring troughs is regarded as the thickness of the corresponding yarn. Wefts or warps in a woven fabric have the same thickness, that is, each interval between neighboring troughs in a projection curve has similar length. Here, we calculate the average length of all intervals between neighboring troughs on the horizontal projection curve of the illuminated image. If the length of one interval is less than 50% of the average length, the interval will be merged with the smaller neighboring interval, and then the trough between the merged neighboring intervals will be removed. The remaining troughs are regarded as the correct boundaries of wefts. This procedure of curve screening is repeated when segmenting the warps. The number of warps is defined as
Figure 2 illustrates the result of pre-processing, deviation correction and weave point segmentation. To demonstrate the validity of the proposed method, we use the woven satin fabric image to display the whole procedure. Compared with plain fabrics and twill fabrics, the recognition of satin fabrics is more difficult.
Illustration of image pre-processing, deviation correction and weave point segmentation: (a) original fabric image; (b) the illuminated image of (a); (c) the result of deviation correction; (d) the result of weave point segmentation.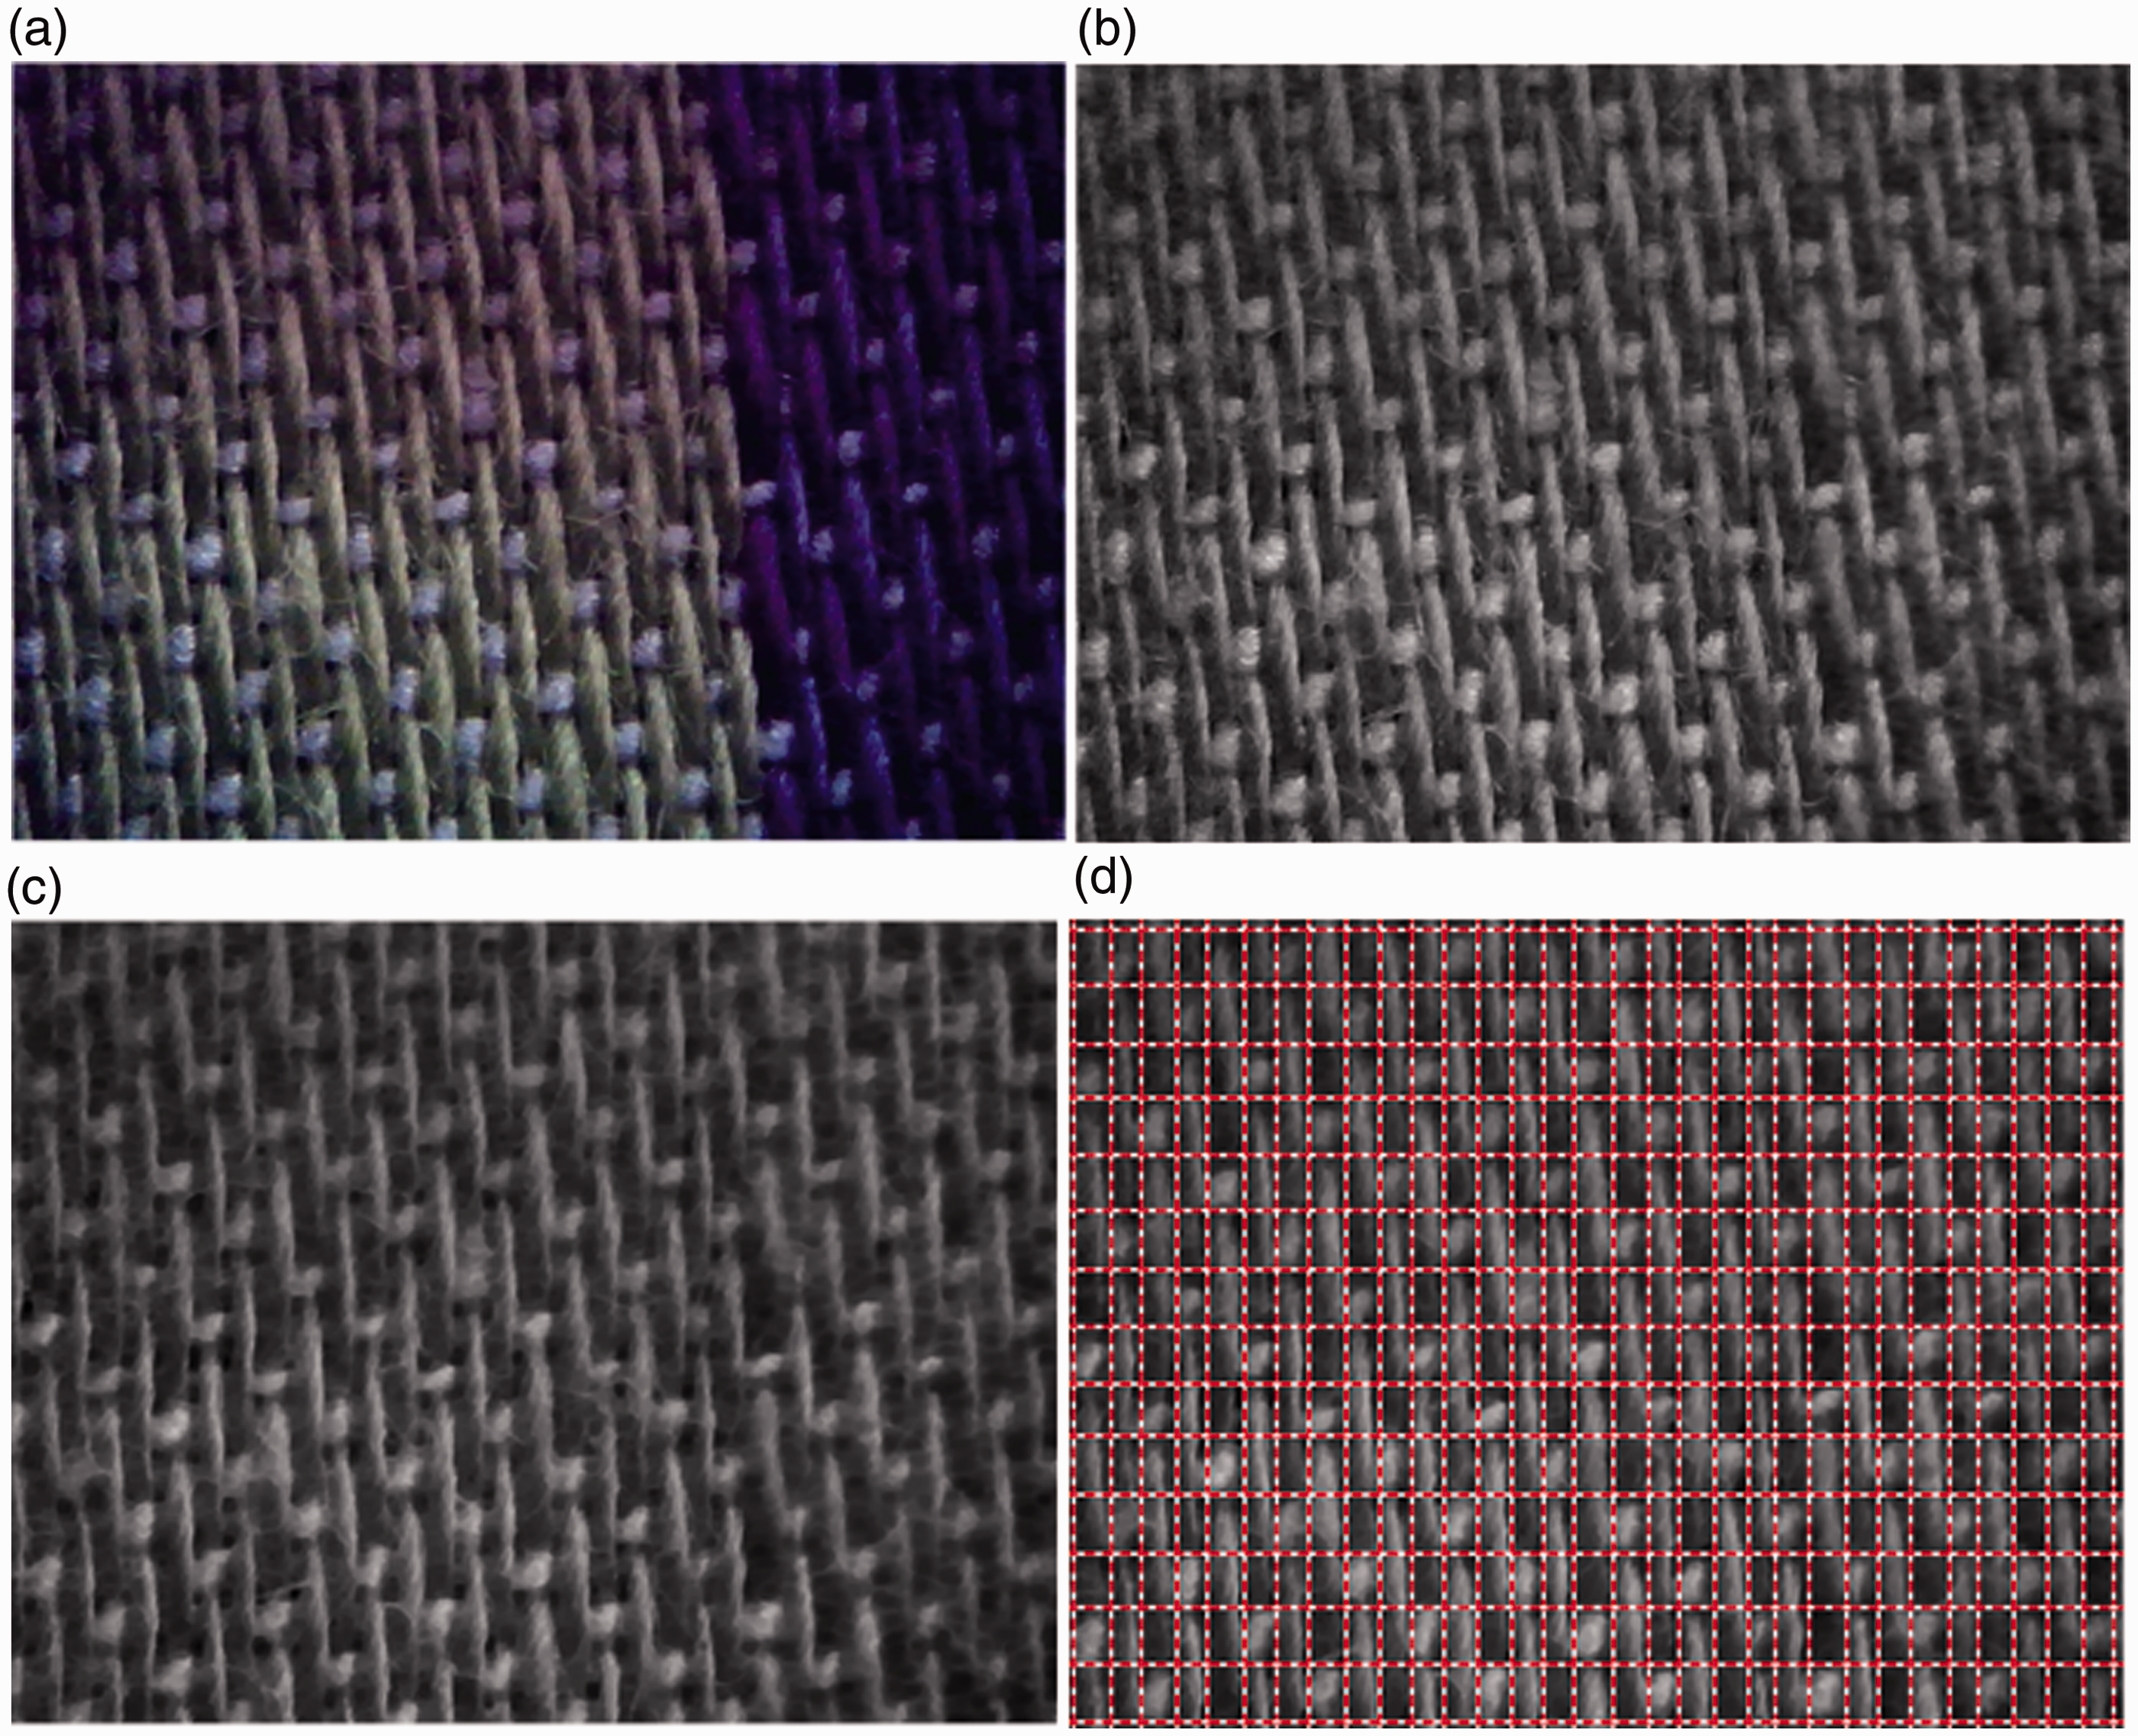
According to characteristic (a), the weave points need to be divided into two groups, that is, warp floats and weft floats. To distinguish between the two different types of weave points, a type of effective feature should be used to represent warp floats and weft floats. The gradient orientation histogram feature proposed by Xiao et al. has already been proved to meet the above conditions.
Firstly, we set the direction of horizontal-right as the 0-degree angle and the clockwise rotation of the positive direction of angles. Then, the gradient orientations of all pixels on each weave point image are calculated, which are distributed in the interval Example for the gradient orientation histograms of a weft float and a warp float on a fabric image: (a) a weft float and a warp float on a fabric image; (b) gradient orientation histograms of the weft float; (c) gradient orientation histograms of the warp float.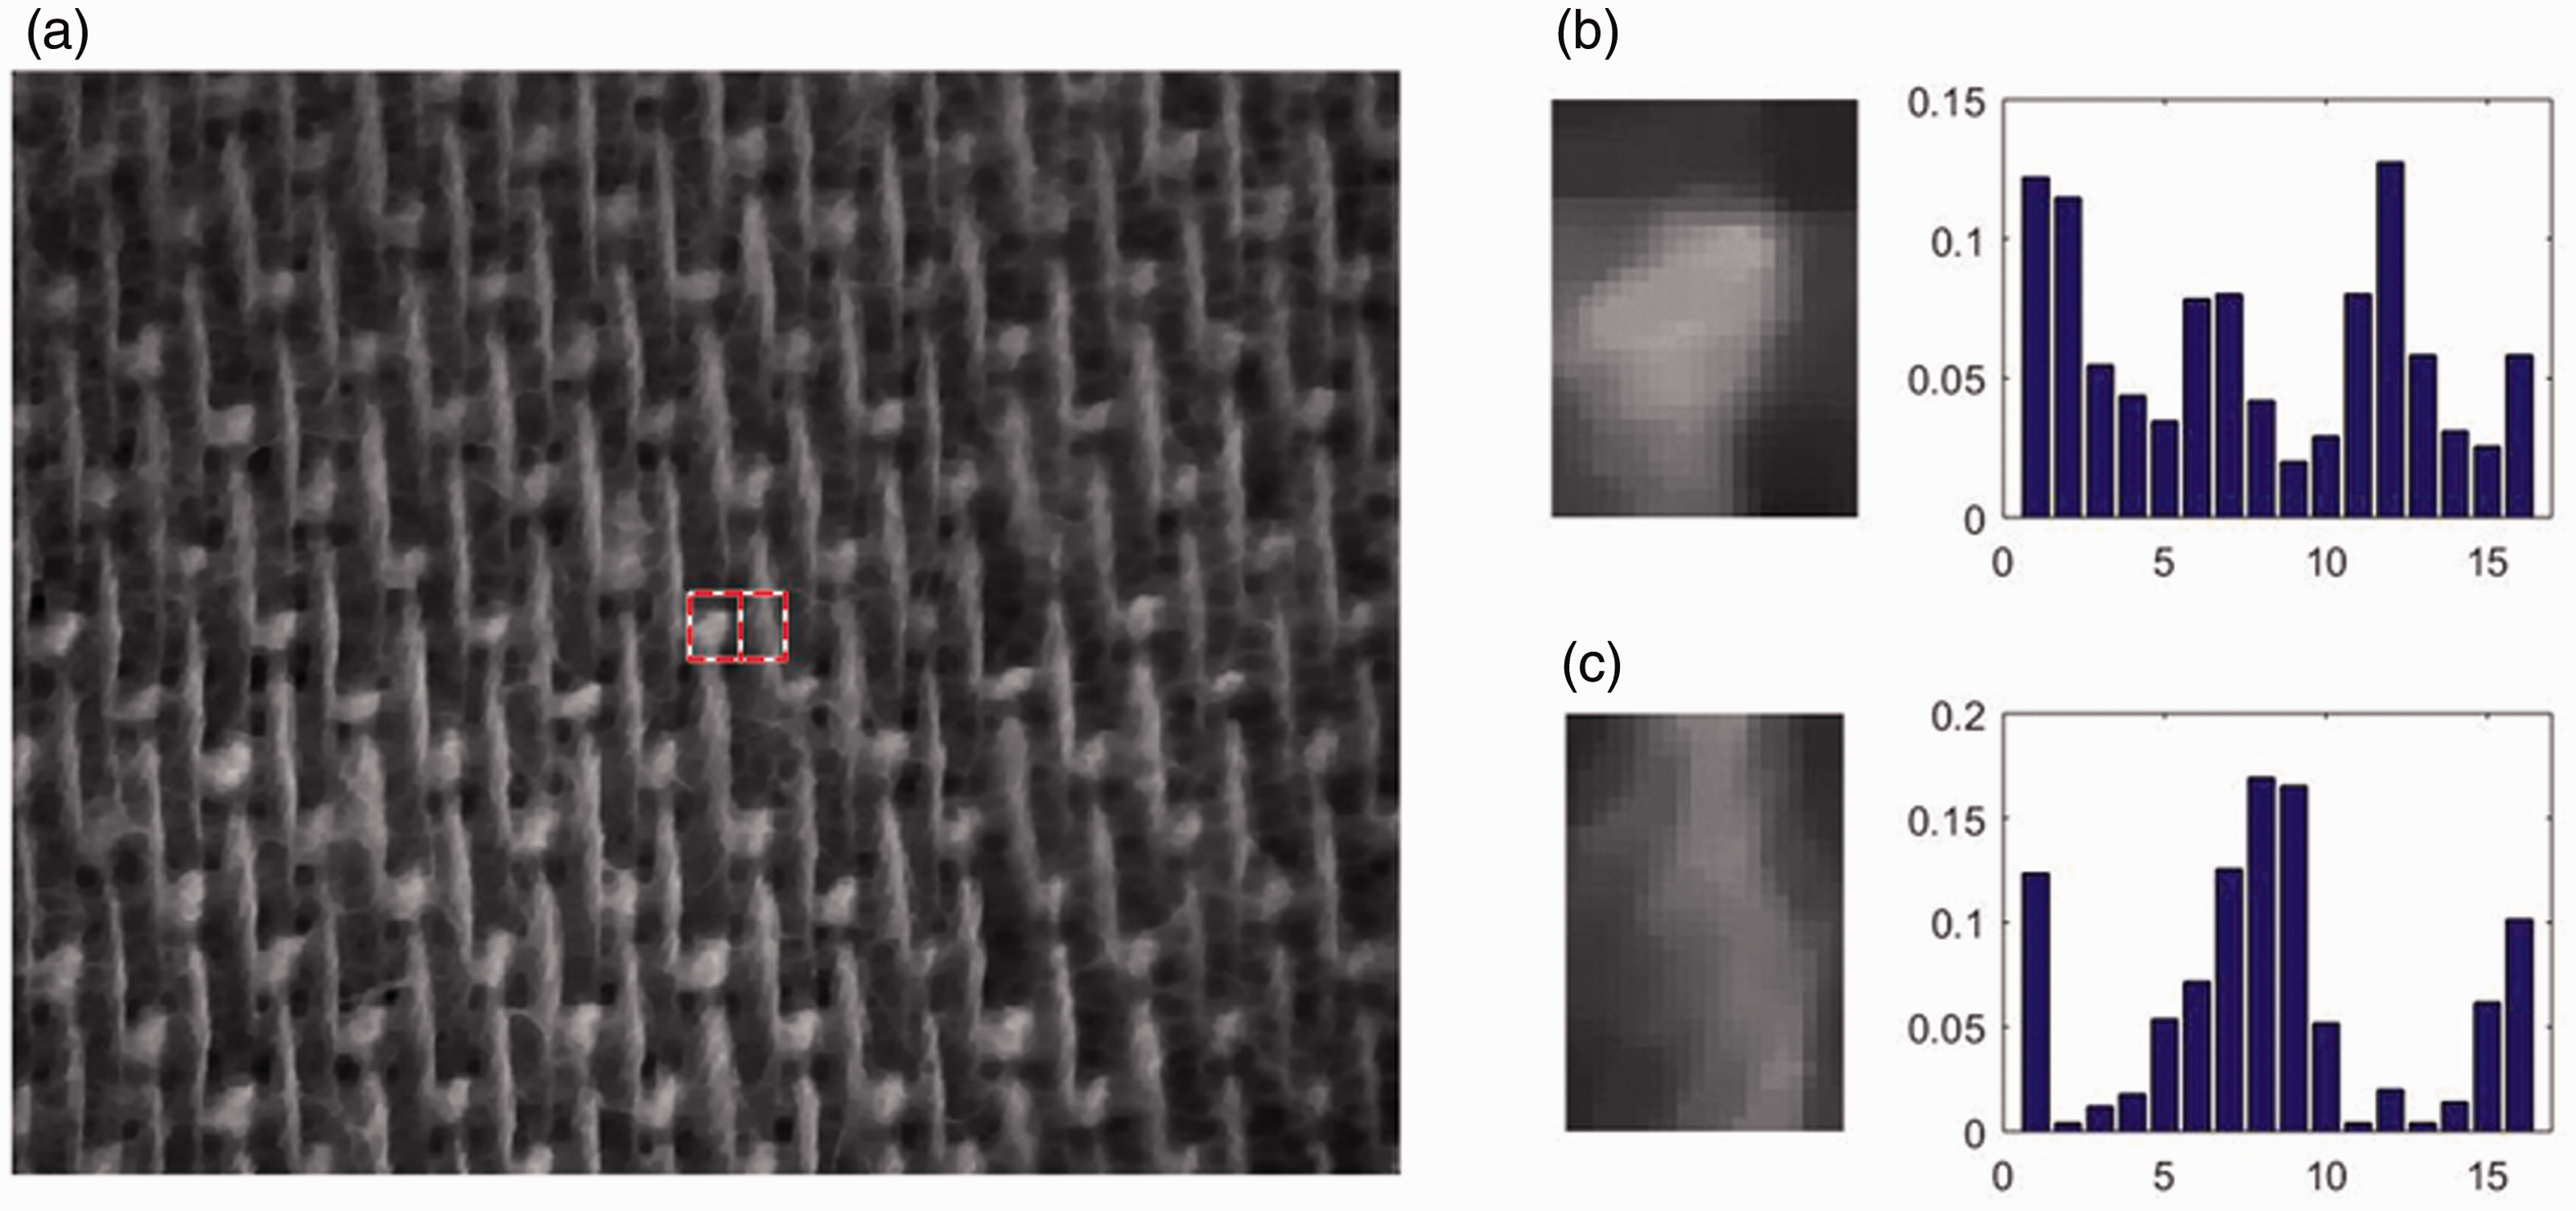
The pre-steps are important for the subsequent steps and can improve the recognition performance. The first pre-step makes the proposed method available to colored yarn fabric or dying fabric by calculating the illumination component of RGB image, which can remove the color information and retain the geometric information of the texture on fabric images. The subsequent steps are designed based on the geometric characteristics of yarns, which makes the proposed method work well on different materials with the same geometric characteristics, for example, cotton, silk, linen, or even glass, carbon, etc.
It is noteworthy that the inclination angle is defined as the angle between the warp yarn and the vertical direction. Theoretically, if all yarns have the same thickness, Xiao et al.’s deviation correction method can correct warp yarns for which the inclination angle is up to 30° (from –30° to 30° by taking the rightward direction as positive). It is not difficult to control the inclination angle of warp yarns within this range when capturing the fabric images. In fact, the thicknesses between weft yarns and warp yarns may be different. For example, according to different weft yarns thicknesses, the upper bounds of the inclination angles that the proposed method can tolerate are from 6.20° to 39.81° for different fabric images in the database. However the max warp yarn inclination angle of all fabric images in this dataset is only 5.87° (from –4.36° to 5.87° on different fabric images).
What is more, by the pre-steps, the proposed method can be used to recognize fabrics with different yarn thicknesses. The deviation correction, weave point segmentation and weave point feature extraction can automatically adapt to different yarn thicknesses, and then all weave points with different yarn thicknesses are transformed into feature vectors with the same length; finally, the following steps only work on the features of these weave points, irrespective of the yarn thickness.
The image pre-processing, deviation correction weave point segmentation and weave point feature extraction are necessary and generic steps to analyze the texture of the fabric images. They are not included in the LFS method since the task of the LFS method is identifying the number of wefts and warps in the rectangular area that represent a weave pattern repeat as characteristic (b). All the steps of the LFS method will be discussed latter.
Yarn feature acquisition and yarn marking for characteristics (d) and (g)
The recognition between warps and wefts in the weave pattern is only in the operational direction. The process to recognize the warp number of the weave pattern repeat is given as follows. In addition, the weft number of the weave pattern repeat can be obtained by repeating the steps of warp number recognition with the change of direction.
According to characteristics (d) and (g), each column in a weave pattern repeat can be extended to a column in the weave point matrix, which is the same for each row. Therefore, the number of warps in a weave pattern repeat is equal to the cycle period of the warp in a specified float arrangement mode. The feature of each warp is obtained by combining the features of weave points in the corresponding column. The nth warp feature Un is obtained as follows

The size of Un is a
To reduce the dimension of each warp and obtain the cycle period of a specified float arrangement warp, one warp will be selected as the standard warp to calculate the correlation coefficient of these features related to all warps. If two warps are in the same float arrangement mode, then their features are more alike, which means their correlation coefficient is close to 1; otherwise, their correlation coefficient is close to 0. As illustrated in Figure 4, since human attention and lamplight usually focus on the center of the fabric, which influences the layout and image definition when scanning fabric images, the middle warp of a fabric image has better geometric information. Therefore, the middle column Middle warp in Figure 2(c).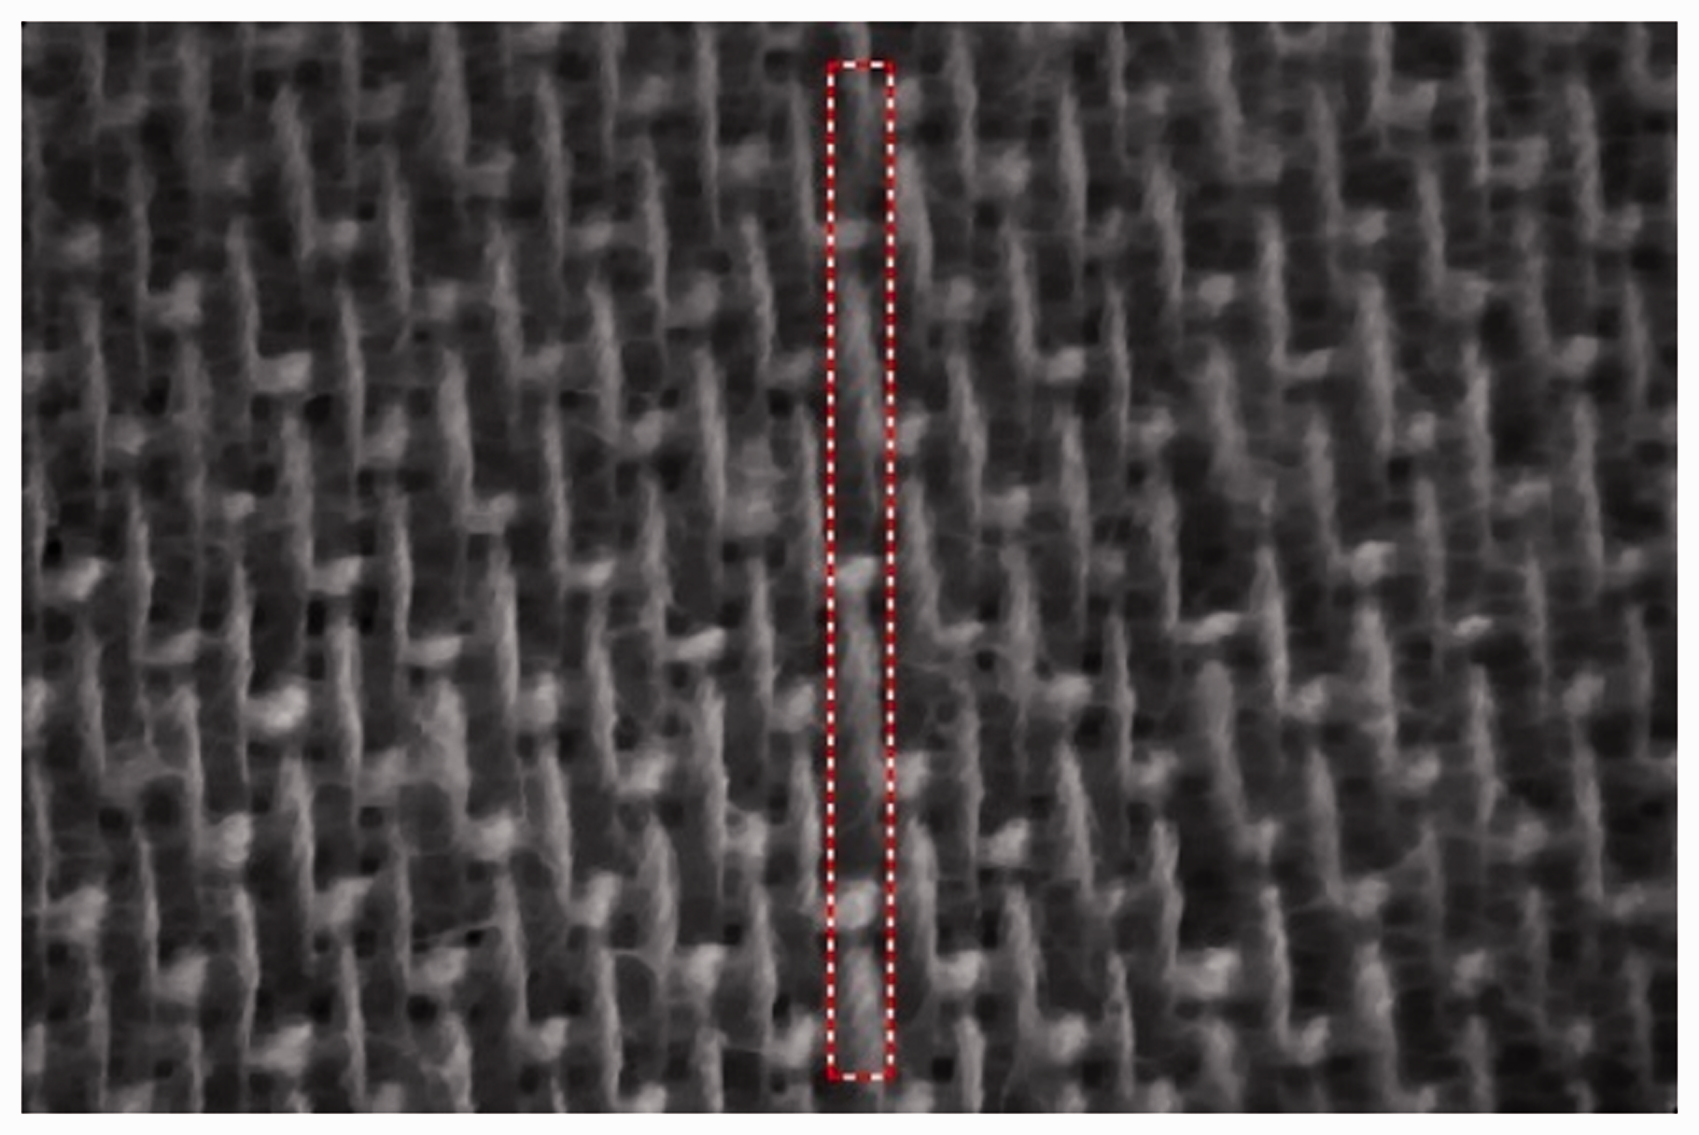

The correlation coefficient All yarns in Figure 2(c) and the curve of their marking numbers, 
Yarn marking subsequence segmentation according to characteristics (c), (f) and (g)
According to characteristic (d), the number of warps in each weave pattern is equal to the distance between two adjacent peaks of the warp-marking sequence. However, it is difficult to extract all the correct peaks from the warp-marking curve, as marked by red circles in Figure 5. The correct peaks represent the warps, which have the same float arrangement mode as the standard warp, but there exist some extra peaks with interference in the warp-marking sequence. General peak extraction algorithms, such as the threshold method, extremum method or maximum method, are not suitable for the marking-sequence curve with multiple correct peaks or interference peaks.
As a typical example, Xiao’s method calculates the repeat size by locating the yarns that have a strong correlation coefficient with the first yarn. In this paper, there are some differences from Xiao et al.’s paper, in that Xiao et al.’s method attempts to be reworked by using the extremum points in the warp-marking curve where the correlation coefficient is over 0.6. To some extent this threshold can filter out the error peaks. However, due to the varied yarn features, it cannot find the correct peaks in the cases that two yarns have different structures but similar yarn features, or two yarns have the same structure while obvious different yarn features. Both cases can lead to the complicated distribution and varied value of the peaks in the warp-marking curve, except the relative relation in the warp-marking curve, that is, the shape of the warp-marking curve.
To avoid the instability in calculating the weave pattern repeat size based on the peaks of the warp-marking curve, an innovative automatic detection method based on the shape of the warp-marking curve is proposed so as to avoid the limitation of peak extraction. With characteristics (c), (f) and (g), different yarn structures of warps are considered to be different types, and warps with different types in every weave pattern repeat are arranged in a fixed order, which means that the curve of warp-marking numbers in every weave pattern repeat has a similar shape. For example, the repeat size of the weave pattern in the fabric image in Figure 2(c) is 5 × 5, so the warp repeat cycle is 5. As can be seen from Figure 6, three groups of adjoining equal-length subsequences are segmented from the warp-marking sequence curve based on different subsequence lengths.
Correlation performances for three groups of adjoining equal-length subsequences. The groups are segmented from the warp-marking sequence curve in Figure 2(c) based on subsequence lengths 3, 5 and 10 respectively.
When the subsequence length is 5 (the real warp repeat cycle) or 10 (a double length), the correlation coefficient between two equal-length continuous subsequences is very high (0.98 and 0.96, respectively, in Figure 6). However, when the subsequence length is 3 (neither the real warp repeat cycle nor its integer multiple), the correlation coefficient between the two equal-length continuous subsequences is very low, for example, 0.23 in Figure 6. Given a warp-marking sequence
Here, l is denoted as the length of subsequences and Sl as the number of subsequences in length Subsequence segmentation result of the warp-marking sequence shown in Figure 5 with each subsequence length l. Columns from left to right: the length of subsequence will be segmented from the warp-marking sequence, the segmentation way of warp-marking sequence shown in Figure 5 and all subsequences obtained by segmentation with the corresponding subsequence length. Rows from top to bottom: the lengths of subsequences are from 2 to 15. (Color online only.)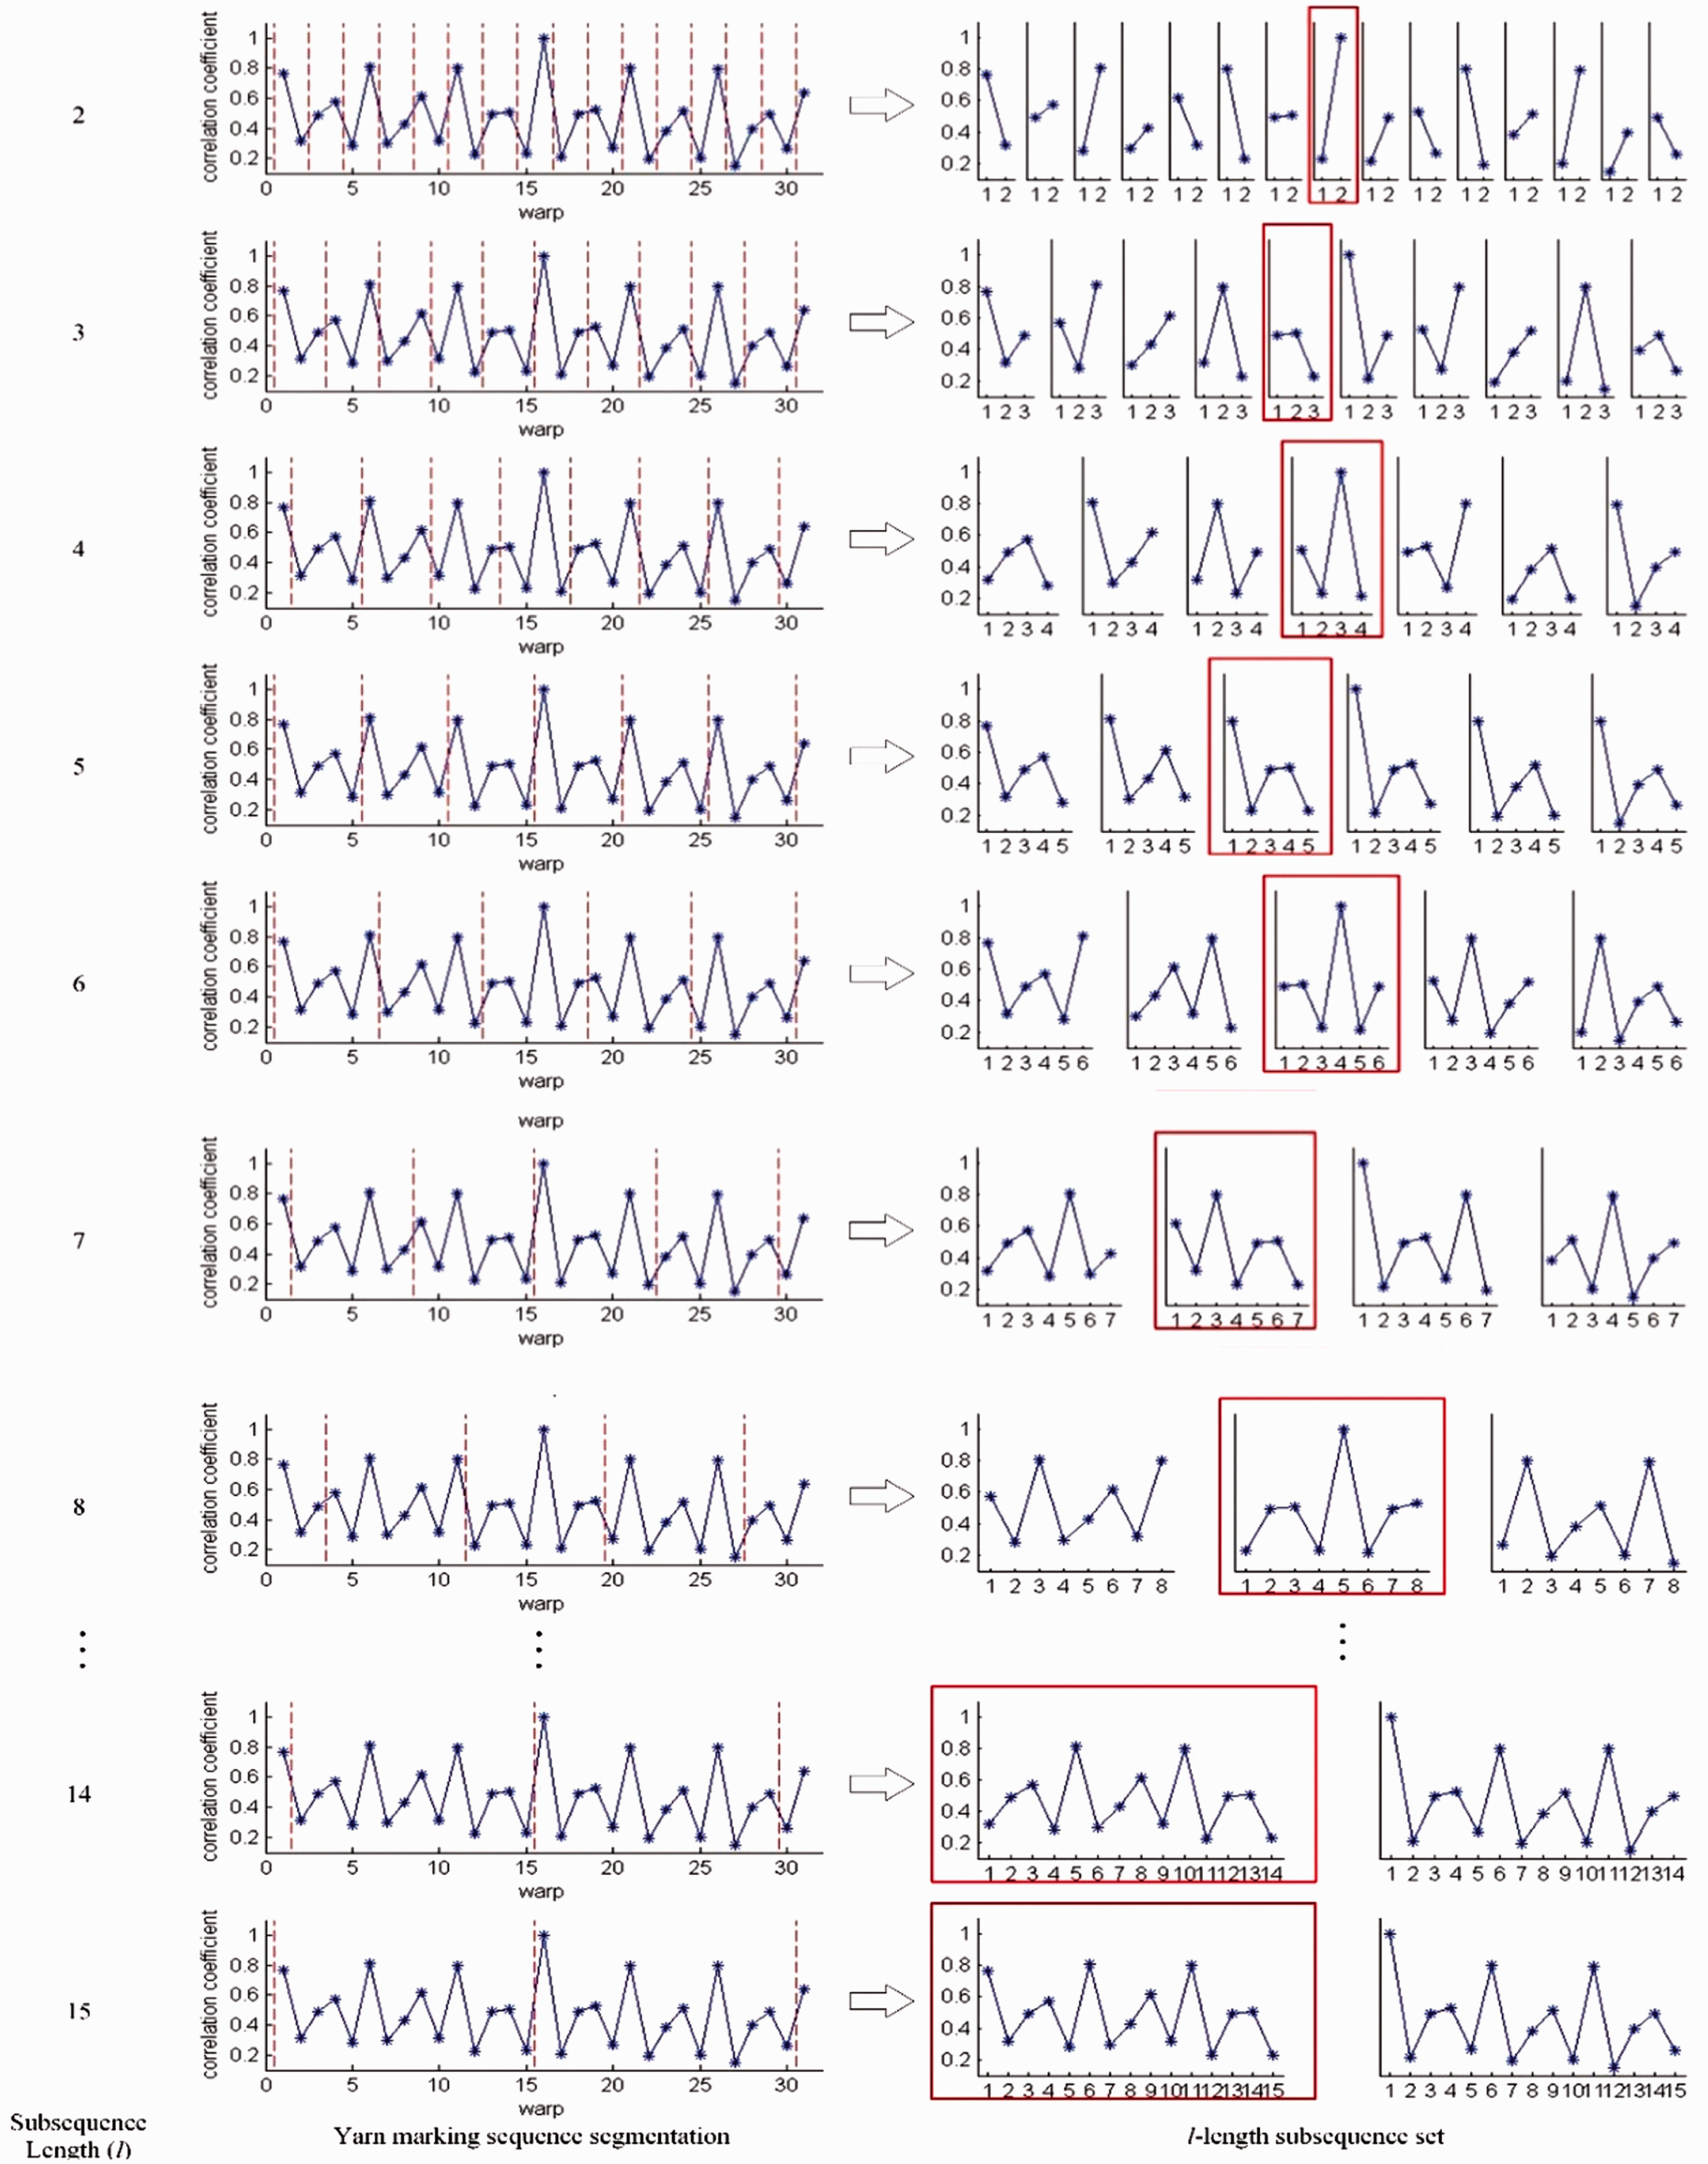


Similarity calculation of yarn-marking subsequences and weave pattern repeat size obtained by characteristic (e)
After the warp-marking sequence segmentation, the average correlation coefficient among subsequences in each l-length subsequence set will be calculated. It is unnecessary to compute the correlation coefficients between every subsequence and the rest, which needs

A selected

All rl of the l-length subsequence are set for Subsequence similarity sequence calculated from Figure 7. (Color online only.)
To extract the strong correlation value from Rc, a relative threshold T is set. If the value of correlation between two subsequences is T or more, then those two subsequences are considered to be strongly correlative. Here, the threshold of T is adopted to isolate the first l0-length subsequence set with strong correlation from all the l-length subsequence sets, where l0 is the warp number of the weave pattern repeat. In this paper, an absolute threshold T is set to determine the first l-length subsequence set with a strong correlation. As shown in Figure 8, the absolute threshold is marked with a red-dot horizontal line.
However, because of the influence of irregularity in the fabric image, subtle texture features or inaccuracy in the previous steps, etc., not all Rc include elements greater than or equal to T. For example, Figure 9 shows two fabric images. The wefts of Figure 9(a) are not horizontal or straight, while the texture feature of Figure 9(b) is unclear. As a result, for the Rc calculated from Figures 9(a) or (b), the maximum element is less than T. However, the peak of Rc, calculated from Figures 9(a) or (b), which represents the warp number or the weft number of the weave pattern repeat, is significantly higher than the others. In this paper, a relative threshold to determine the first l-length subsequence set with very strong correlation is designed to refer to the T rule. The relative threshold is equal to T times the maximum value of Rc. In Figures 9(e) and (f), the relative threshold is marked with a red horizontal dotted line.
Two examples of fabric images with irregularities in the image and subtle texture features: (a) original fabric image whose wefts are not horizontal or straight; (b) original fabric image whose texture feature is insignificant; (c) weave point segmentation of (a); (d) weave point segmentation of (b); (e) warp-marking subsequence similarity sequence of (c); (f) weft-marking subsequence similarity sequence of (d). (Color online only.)
The value of T plays an important role, which affects the recognition result. If T is too low, the recognized repeat sizes of weave pattern for a fabric may be smaller than the real value; otherwise, the recognized repeat sizes of the weave pattern may be larger than the real results. According to the strong correlation coefficient theory and experiment results, this paper sets

The weft number of the weave pattern repeat can be recognized by repeating the above process from yarn feature acquisition to the weave pattern repeat size obtained. The only difference is that the processing object changes to wefts. Image pre-processing, deviation correction, weave point segmentation and weave point feature extraction are also necessary steps. Therefore, only the steps from yarn feature acquisition to weave pattern repeat size acquisition are called LFS in this paper. Figure 10 demonstrates the result of the recognition of the weave pattern repeat size from Figure 2(a) based on LFS. The LFS method can recognize a weave pattern repeat whose sizes are not larger than one half of the number of warps and wefts on the fabric image.
The result of weave pattern repeat size recognition from Figure 2(a) based on Local Feature Similarity.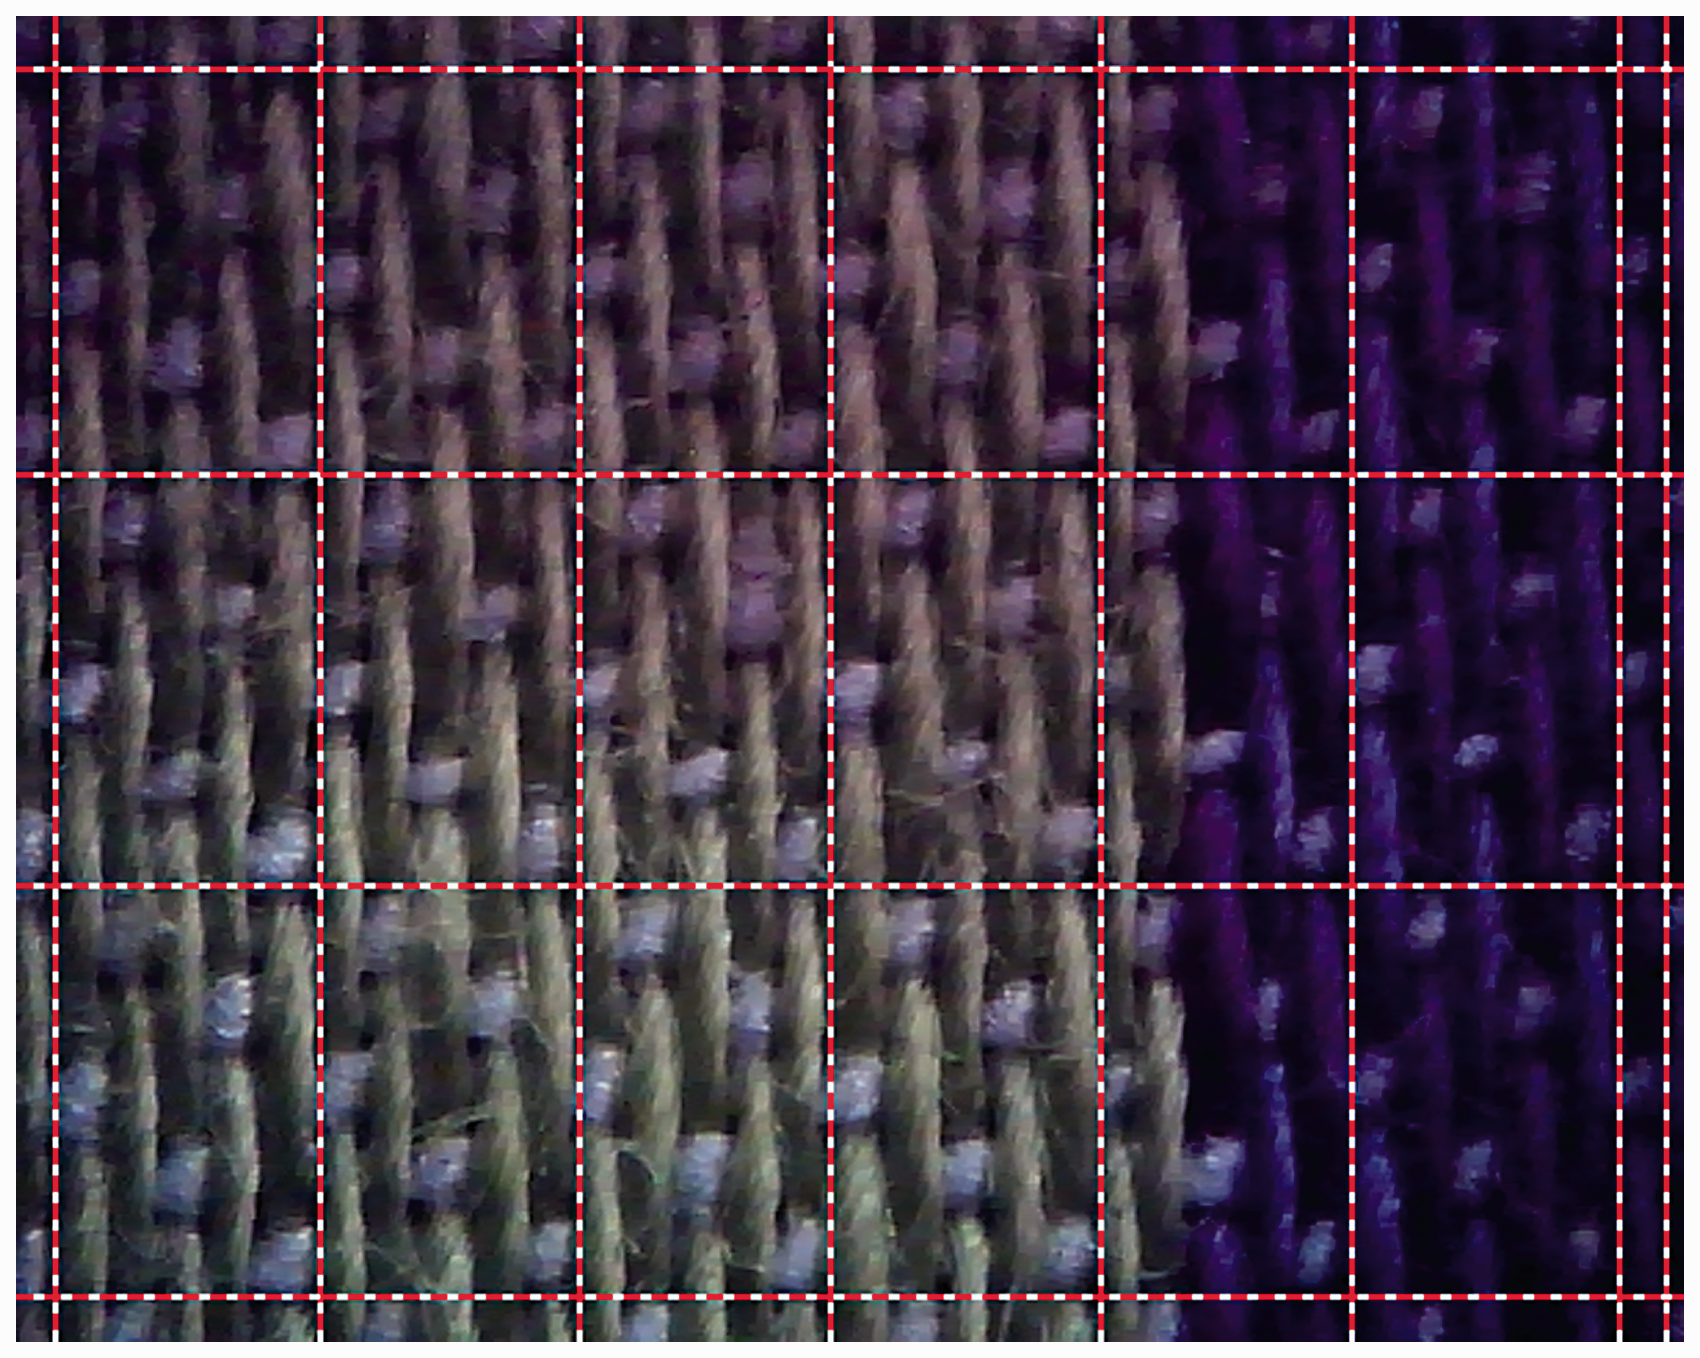
Improvements to comparison methods based on Local Feature Similarity
Experimental framework and dataset

The six methods selected are the IDMF method, 9 the gray autocorrelation method, 20 Ajallouian’s method, 24 the pre-recognized weave pattern autocorrelation method (pattern autocorrelation method for short), 13 the EL method 14 and Zhang’s method. 7
Four of the six methods are based on pre-recognized weave patterns. Thus, the weave points must be categorized into warp floats and weft floats or, sometimes, as unrecognized floats. This paper classifies these weave points by clustering the weave point features based on the improved FCM algorithm in Xiao et al.’s paper. The weave point features will be divided into two groups, that is, warp floats (marked with 0) and weft floats (marked with 1). Each weave point in the weave point matrix corresponds to 0 or 1 to form a
A fabric image dataset is used in this paper, which was provided by Xiao. All the images are in RGB color space and they comprise 205 fabric images with plain weave, 34 with twill weave and their simple expansions and 26 with satin weave. On each image all the yarns are straightened as much as possible; light is focused on the center of fabric; the wefts are almost horizontal; and the warps are tilted to some extent in the vertical direction when scanning. Samples with different colors, different yarn thicknesses, defocus blurs, irregular textures and cotton yarns are included in this dataset, which can be processed by the proposed method robustly, as this method is based on the geometric characteristics rather than the color information of yarns on fabric images. The size of each image in this dataset is 640 × 480 pixels. On each sample, the number of weft yarns is from 6 to 32, the number of warp yarns is from 11 to 45 and the thickness of each yarn is from 13 to 94 pixels, which provides enough geometric information of yarns for LFS and the comparison methods.
As LFS and the comparison methods depend on the geometric information of the yarns, the scanning resolution in the experimental dataset, which is enough to obtain the necessary information, has little impact on the analysis in this paper. Although the higher the resolution the better, it is better to ensure the thickness of every yarn over 5 pixels to keep the different geometric information between the warp float and weft float for LFS.
As the IDMF method, the gray autocorrelation method, Ajallouian’s method, the pattern autocorrelation method, the EL method and Zhang’s method used different ideal data in their respective papers, the performances of these methods on Xiao et al.’s dataset are poor. In order to test and compare these algorithms on a unified dataset, each algorithm was improved simply based on LFS. However, Xiao et al.'s method is an exception because it has been proved to be suitable for this dataset in Ziao et al. 11 The codes and dataset used in this paper is available on the authors’ webpages (https://github.com/spring2001/automatic-recognition-method-for-the-repeat-size-of-weave-pattern-on-woven-fabric-image).
Comparison methods I and II: improved IDMF method and improved gray autocorrelation method
The principles of the IDMF method and the gray autocorrelation method are similar. According to characteristics (b)–(d), (f) and (g), both methods are based on the periodic cycle of texture on the fabric image. It is assumed that each warp on the image has the same thickness as all others, and the same for wefts. Another assumption is that different pixel values can represent the two weave point types directly. Therefore, the IDMF and gray autocorrelation methods try to search for the minimum cycle of the pixel value, which is also the pixel number of each weave pattern repeat in the horizontal or vertical direction. In this paper, average yarn thickness is introduced to ensure that the outputs of the IDMF and gray autocorrelation methods are the numbers of yarns.
Firstly, improve the IDMF method. Let
The first step is to calculate the average warp thickness 
The second step is to calculate the horizontal IDMF. As the smallest weave pattern repeat, the plain fabric limits the initial periods pi to be larger than an average warp thickness. Let 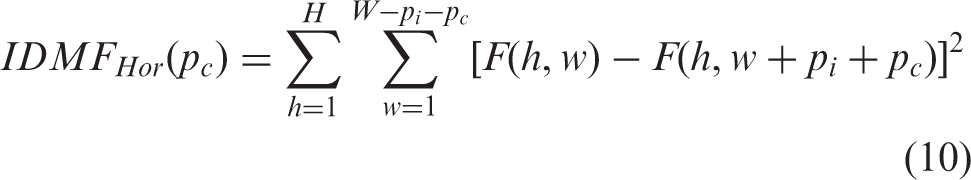
The third step is to extract the location of the maximum value 
Secondly, improve the gray autocorrelation method. The element index of the gray autocorrelation function is unconventional according to Kang et al.’s paper.
20
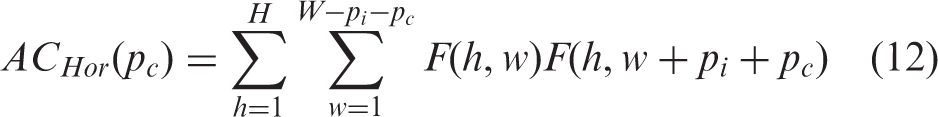
Moreover, it is difficult to extract the correct peaks representing the cycle period of the weave pattern repeat. In this paper, we try to improve the gray autocorrelation method referencing the improved IDMF method. As for the example of warps, the only difference is in computing the horizontal autocorrelation curve using corrected Equation (12) in the second step and extracting the minimum value location of the autocorrelation curve to obtain the warp number of the weave pattern repeat
As the IDMF method and gray autocorrelation method process each pixel on the fabric image, the time complexities for these two methods are higher than that of LFS.
Comparison methods III: improved Ajallouian’s method
In Ajallouian et al.’s paper, 24 the method to recognize the size of the weave pattern is to find the distance between two adjacent rows and columns with the same arrangement of warp and weft floats from the pre-recognized weave pattern by expanding a separate matrix. Ajallouian et al.’s method only meets characteristics (a), (b), (d), (f) and (g), and assumes that each weave point is recognized as a weft float or warp float accurately. However, the assumption gives a lack of robustness to this method. To overcome this shortcoming, the limit of the separate matrix is left out and a tolerance of error is introduced to search for two adjacent rows and columns with a similar arrangement of warp and weft floats.

The steps to recognize the weft number of the weave pattern repeat are similar. With the introduction of error tolerance, the recognition rate of Ajallouian et al.’s method increases from 33.21% (88 out of 265) to 81.51% (216 out of 265).
Comparison methods IV: improved pattern autocorrelation method
The pattern autocorrelation method proposed in Wang et al.’s paper 27 is another way of applying the autocorrelation algorithm, which matches characteristics (a)–(d), (f) and (g). The element index is evidently also out of the matrix boundary when describing the autocorrelation function. Here C represents the 3 × 3 tiling of weave float matrix instead of just the weave float matrix, and it is used to recognize the size of the weave pattern repeat by the autocorrelation method.
Comparison methods V: improved EL method
The EL method was proposed by Zhou in 2014, 14 and it used the characteristics (a)–(c) and (e)–(g). Moreover, the EL method’s design was based on the assumption that the pre-recognized weave pattern matrix must possess at least one column and a row in which each weave point corresponds to the right type. If there is no exact identification in any column or row of the pre-recognized weave pattern matrix, the EL method will fail to function. To overcome the limitation of assumption and to increase the recognition accuracy, error tolerance Et and statistical theory are added to the EL method.
An example of recognition is taken for the warp number of the weave pattern repeat. Weft number recognition can be obtained in the same way. In the original EL method, each row of the pre-recognized weave pattern matrix is tried in turn until the following condition is achieved: the smallest interval (represented by
An improved EL method is proposed in this paper. The smallest intervals (
In experiments, the recognition rate of the original EL method is 80.00% (212 out of 265), and the recognition rate of the improved EL method is 88.30% (234 out of 265), which proves the validity of the improved method. Owing to the process that each row is divided into at least
Comparison methods VI: improved Zhang’s method
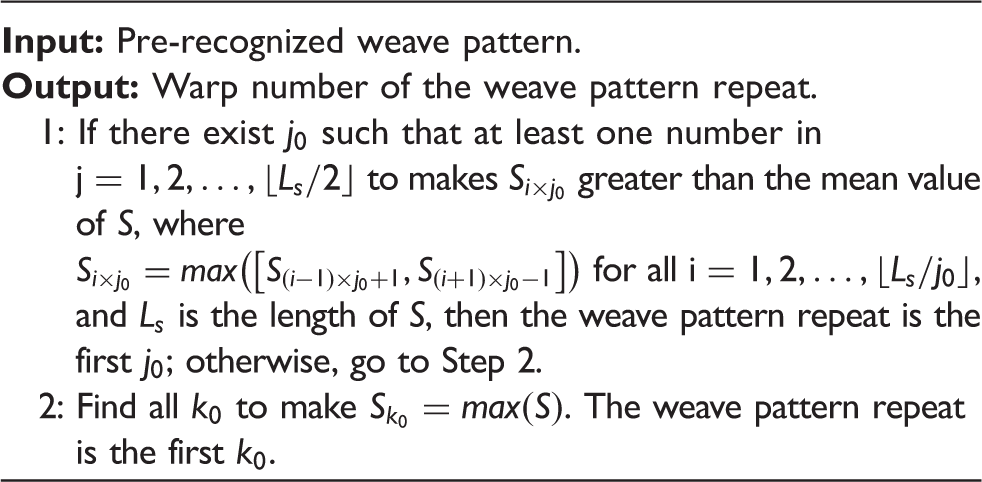
With the improved steps above, the recognition rate of Zhang et al.’s method has been improved to 97.74% (259 out of 265). However, restricted by Step 1 in Algorithm 4, Zhang et al.’s method can only recognize the weave pattern repeat well where the size is not larger than a quarter of the number of yarns on the fabric image.
Results and discussion
Theoretical comparison
Theoretical comparison of Local Feature Similarity, Xiao et al.’s method and six improved methods
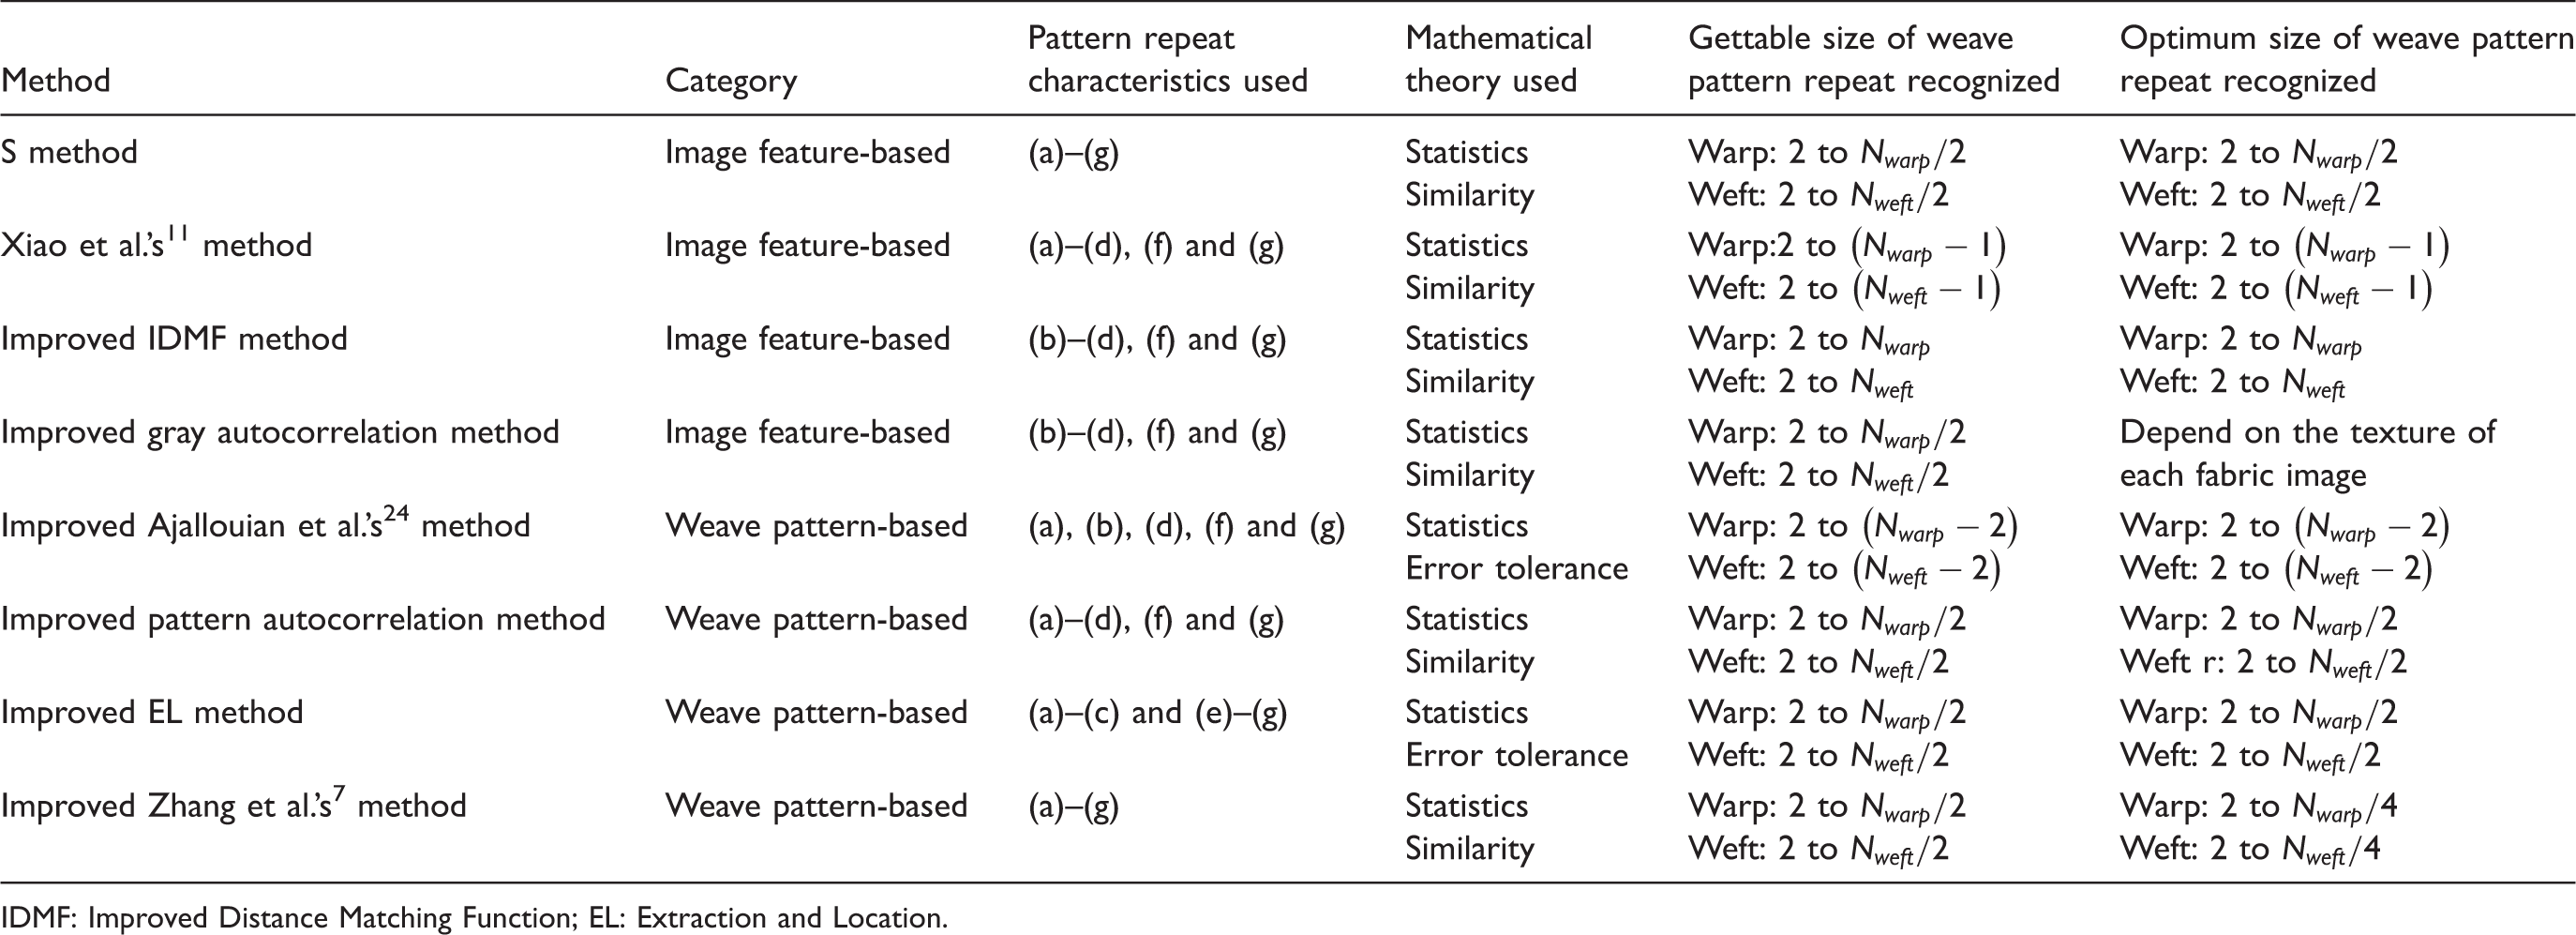
IDMF: Improved Distance Matching Function; EL: Extraction and Location.
The LFS method is a general algorithm for the size recognition of weave pattern repeats. The inputs of the LFS method are the weave point positions obtained by segmentation and the corresponding weave point features obtained by feature extraction. The segmentation method and feature calculation method are not limited to those used in this paper, which means that the LFS method can be used as a part of various weave pattern recognition methods with some adaptation. Moreover, LFS is not only applicable for the basic weave pattern and simple expansion of twill in the test dataset, but also for more complex derivatives of basic weaves, such as warp rib, weft rib, panama and basket weave pattern. These complex derivatives of basic weaves cannot be identified by other methods in theory. Moreover, when recognizing these complex derivatives with large repeat sizes, the only limitation for LFS is the image size.
Recognition results of the LFS method and discussion
To evaluate the versatility, applicability, robustness and accuracy of the LFS method proposed in this paper, eight methods are tested in the dataset on the platform built by using MATLAB with an I7-4710HQ CPU and 16 GB RAM. The experiment included three parts: Part 1 is the recognition of the LFS method for each fabric image, to prove the effectiveness of all steps from inputting the original fabric image to outputting the weave pattern repeat size; Part 2 is the comparison of weave pattern repeat size recognition among the LFS method and other improved methods; Part 3 compares the LFS method and other improved methods in its application to weave pattern repeat recognition and weave pattern recognition.
Figure 11 illustrates the recognition results of the LFS method for 18 fabric images in the dataset as three groups. Figures 11(a)–(c) show the recognition results for plain fabric, twill and its expansion fabric and satin fabric. All the weave pattern repeats are mapped out in the original color images with deviation correction. The area in each rectangular frame (red dotted line) is represented as a weave pattern repeat. From the color fabric image, the different colors, different yarn thickness, different clarity, different weave patterns and irregular textures are intuitionistic. The inclination angle of warp yarns before the deviation correction in each image can be deduced backward from the width of each shown image, as the deviation correction will remove the horizontal boundary pixels from the sample images with the same size. All the above factors may affect the result of weave pattern size recognition. Figure 11 can prove directly the high suitability and robustness of the LFS method.
Repeat size recognition results of the weave pattern using the Local Feature Similarity (LFS) method for 18 fabric images in the dataset: (a) the result of the LFS method for plain; (b) the result of the LFS method for twill and its expansion; (c) the result of the LFS method for satin. (Color online only.)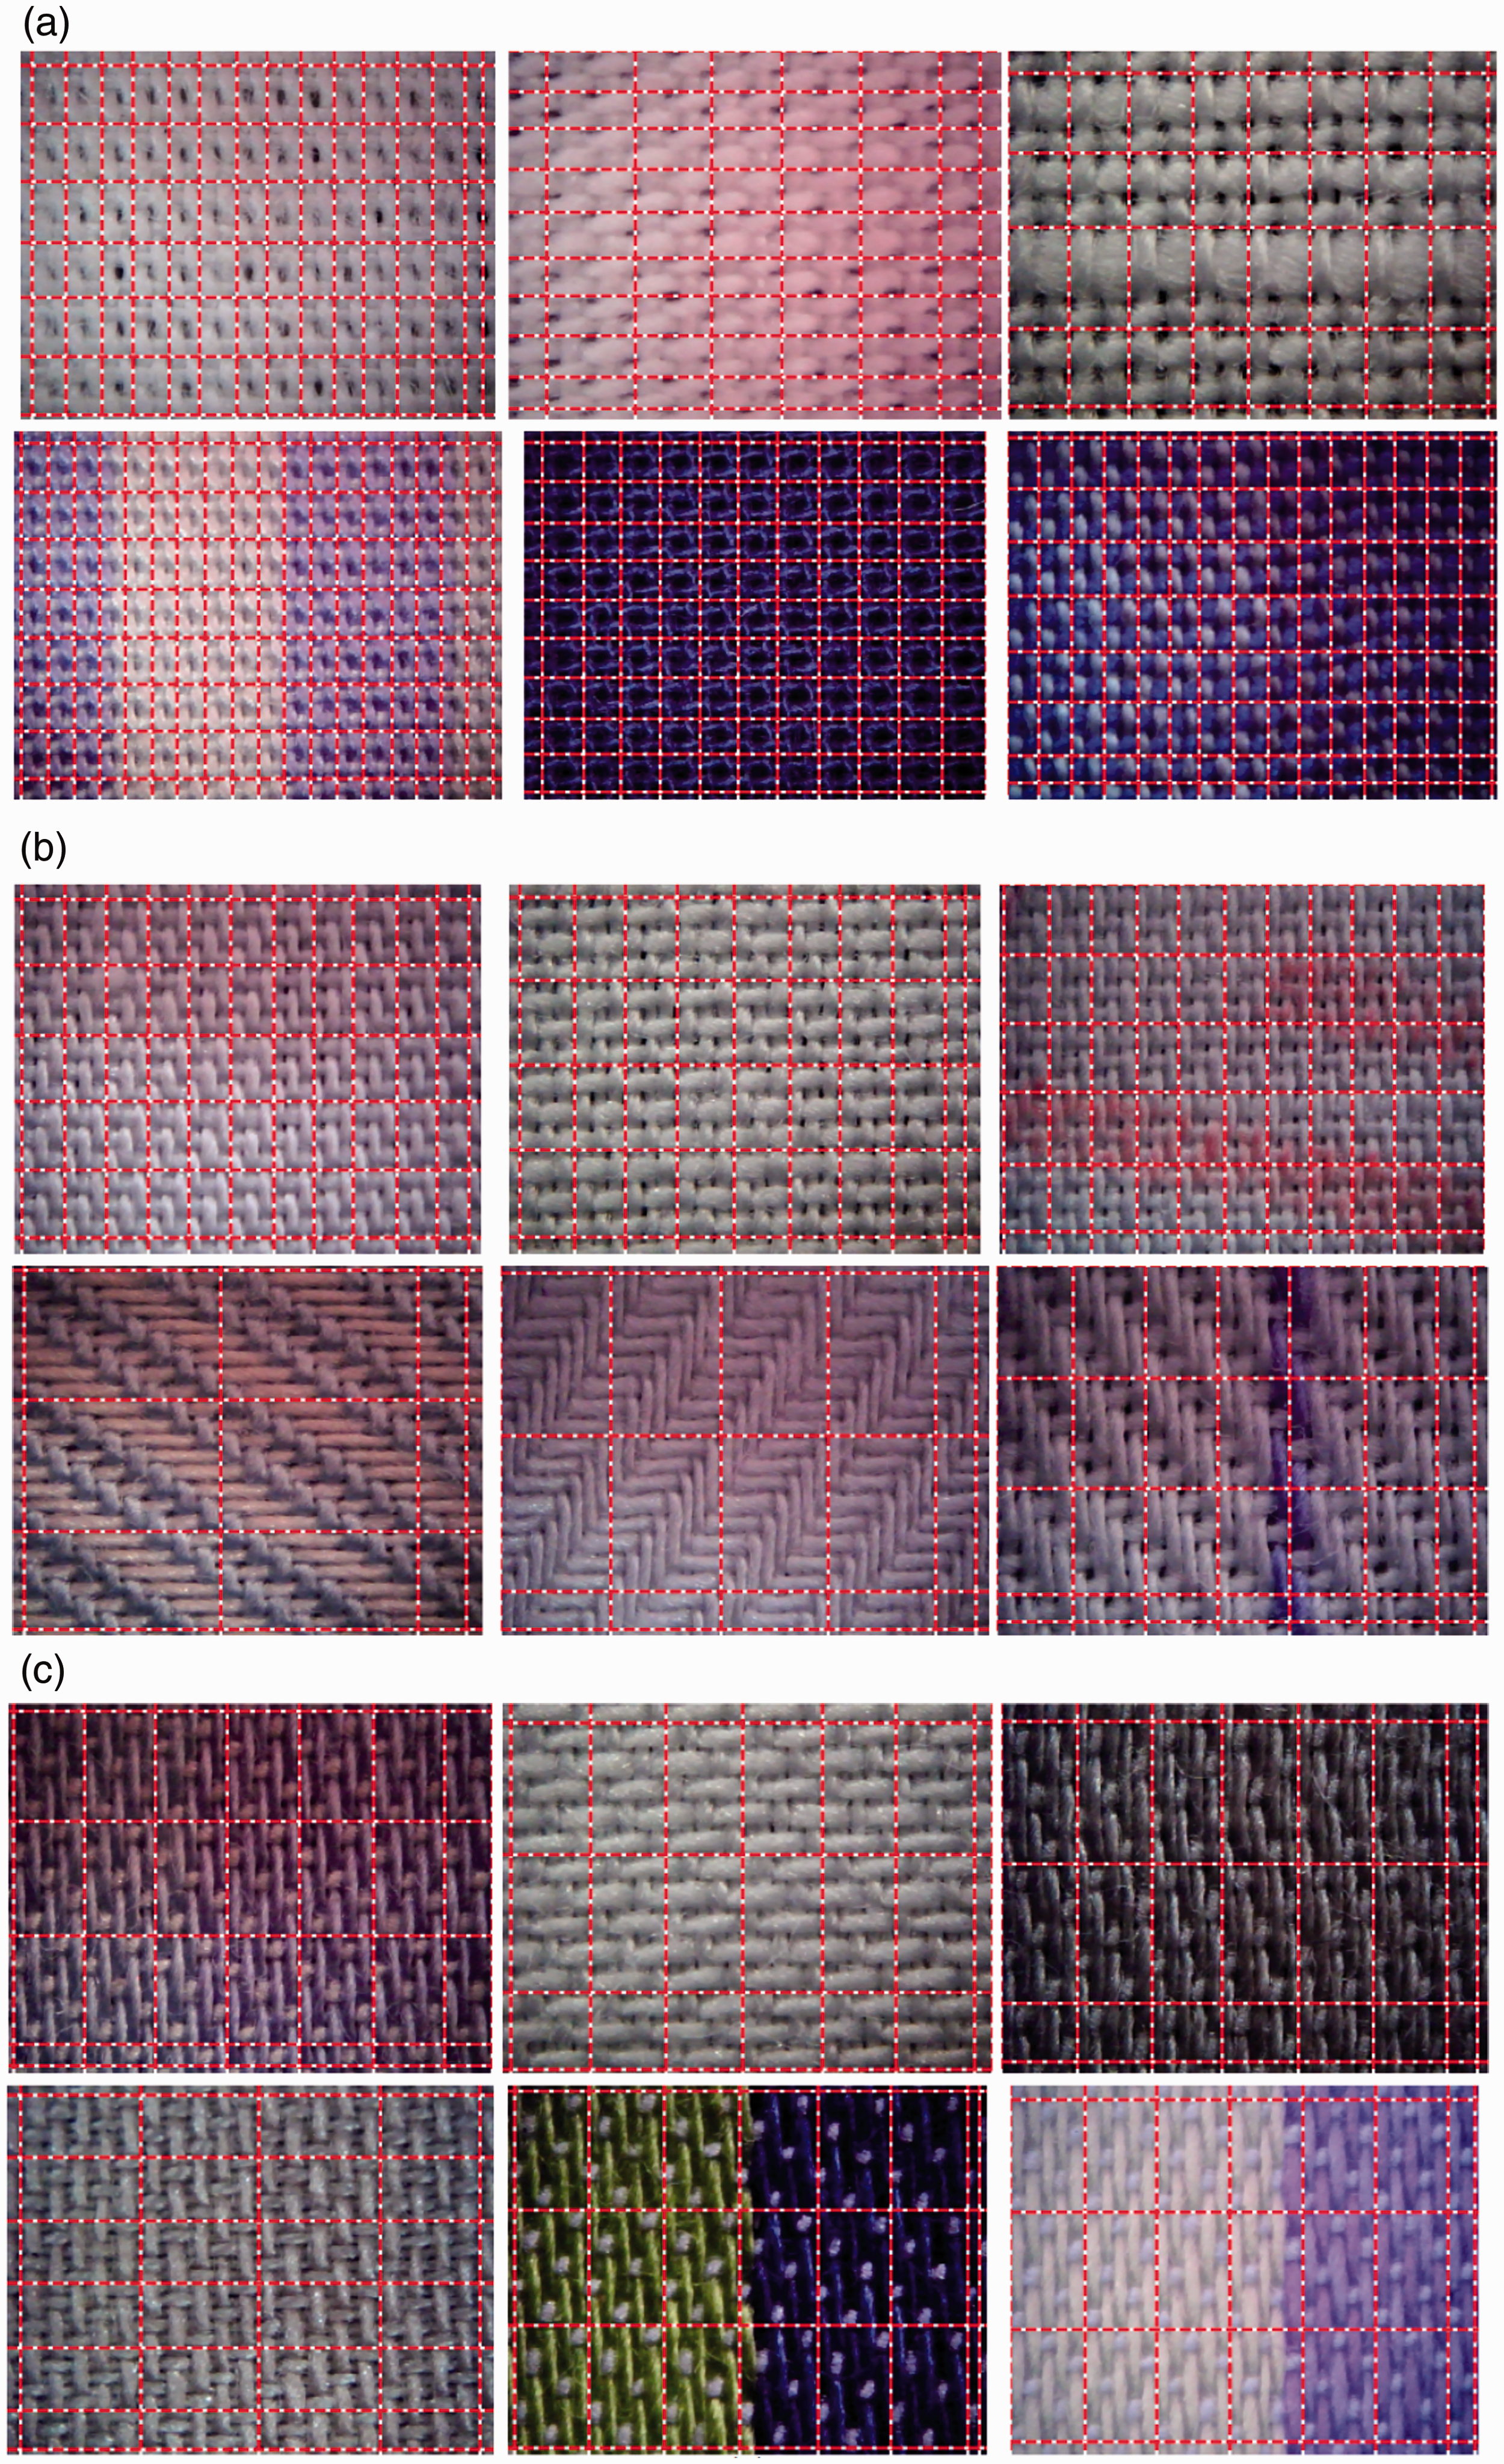
Comparison of methods for the recognition of the weave pattern repeat size
Comparison among Local Feature Similarity (LFS), Xiao et al.’s method and the six improved methods for weave pattern repeat size recognition

IDMF: Improved Distance Matching Function; EL: Extraction and Location. Note. Best recognition rates and minimum average recognition time are highlighted in bold.
A further comparative analysis of the LFS method and the improved Zhang et al.’s method is made. As both of them make full use of all seven characteristics, the LFS method presented only little better results than the improved Zhang et al.’s method. Compared to the LFS method, the improved Zhang’s method spent more average runtime on each fabric image. Different from the LFS method, the error weave pattern recognition reduced the weave pattern repeat size recognition rate by using the improved Zhang et al.’s method for plain, twill and its expansion, and the insufficient number of yarns on the fabric image caused the failure to recognize the size of 4/4 twill for the improved Zhang et al.’s method, thus proving the accuracy of the LFS method.
Comparison of methods for weave pattern repeat recognition and weave pattern recognition
In the third experiment, the LFS method and six improved methods are used respectively. The recognition of the weave pattern repeat only adds one step to Algorithm 2, which uses both the results of weave point classification by FCM and weave pattern repeat size recognition. According to Xiao et al.’s paper, 11 the pre-recognized weave pattern matrix obtained from weave point classification is divided into sub-matrices. These sub-matrices are distributed in the pre-recognized weave pattern matrix adjacently. The size of every sub-matrix is the recognized weave pattern repeat size. Then the corresponding elements in all sub-matrices are calculated. The element values appeared most often in the corresponding position of all sub-matrices forming a matrix, which is considered as the weave pattern repeat matrix.
Comparison of Local Feature Similarity (LFS), Xiao et al.’s method and the six improved methods for weave pattern repeat recognition

IDMF: Improved Distance Matching Function; EL: Extraction and Location.
Comparison among Local Feature Similarity (LFS), Xiao et al.’s method and the six improved methods for weave pattern recognition

IDMF: Improved Distance Matching Function; EL: Extraction and Location.
The weave pattern repeat recognition focuses on the repeat unit, while the weave pattern recognition focuses on the whole structure corresponding to the fabric image: the judgment standards of the recognition ratio are different. The influence factors of weave pattern repeat recognition and weave pattern recognition are very complicated, which include the repeat size, the classification result of weave points and the segmentation performance of weave points, and may lead to opposite results for these two recognitions based on respective judgment standards. If weave points were mis-segmented, the result of weave pattern recognition must be wrong, but that of weave pattern repeat recognition maybe right, for example, LFS and improved Zhang et al.’s methods. If an error size of the weave pattern repeat is obtained, particularly several times that of the real size, the result of the weave pattern recognition repeat maybe wrong but that of the weave pattern recognition maybe right, for example, the improved EL method.
Moreover, even if the size of the weave pattern repeat is calculated to be the integral multiple of the right size, the pre-recognized weave pattern can be corrected with high probability. As a result, compared with Table 2, the higher recognition rate for weave pattern repeat size is also helpful to the higher recognition rate for the weave pattern.
Conclusion
This paper proposes a weave pattern repeat recognition method with high versatility, applicability, robustness and accuracy based on a comprehensive review of the existing methods in the first section, and the characteristic analysis of the weave pattern in the second section. Seven characteristics of weave pattern repeat are summed up in this paper. Experiments proved that more characteristics of weave pattern repeat used in the weave pattern repeat size recognition method may lead to a higher recognition rate for the method. The methods designed with all seven characteristics have the highest recognition rate.
Further work will be devoted to the better adaptability and expansion of the LFS method for more application scenarios. For example, when recognizing the repeat size of double-yarn weave patterns, the two yarns with same weaving method can be merged into a single yarn before using the LFS method. In addition, when the correlation coefficient is not suitable for calculating the similarity between two yarns based on the extracted features some other methods, such as the Euclidean distance, Hamming distance, chi-square test etc., can be used. Another further work will be devoted to improve the weave pattern recognition rate for satin weaves. The satin weave is an unsteady structure in that the yarns of satin weaves are twisted out more easily. A more accurate weave point segmentation method, weave point features extraction method and weave point classification are needed to handle the highly variable shape of yarns. The deep learning methods, such as Convolutional Neural Network and Recurrent Neural Network, provide an option for the future.
Footnotes
Declaration of conflicting interests
The authors declared no potential conflicts of interest with respect to the research, authorship and/or publication of this article.
Funding
The authors disclosed receipt of the following financial support for the research, authorship, and/or publication of this article: This work was granted by Tianjin Sci-tech Planning Projects (Grant No. 14RCGFGX00846), the Natural Science Foundation of Hebei Province, China (Grant No. F2015202239), Tianjin Sci-tech Planning Projects (Grant No. 15ZCZDNC00130), Tianjin Sci-tech Planning Projects (Grant No. 17ZLZDZF00040) and Tianjin Sci-tech Planning Projects (Grant No.14JCYBJC18500).