




Abstract
Two-dimensional braided composite materials consist of an impregnated and cured braided fiber structure. The braid angle, which describes the orientation of fibers on the mandrel, affects the material properties of the composite part. Furthermore, braid production is often inaccurate, requiring quality assurance measurements of the fiber orientation. In this study, a frequency domain machine vision algorithm was applied to tubular braided preforms to measure fiber alignment during production. Several approaches to compensate for the tubular mandrel shape were tested and the fiber distribution in both the spatial and frequency domains was compared. The developed machine vision system allowed braid angle measurements to be made in real-time and in-line during the braiding process. The integration of such a system eliminates the need to make manual quality assurance measurements of the braided fiber structure, it further automates the braiding process, and it decreases production error.
Braided composite materials consist of a braided fiber preform consolidated with a cured liquid resin to form a rigid composite part. Production is a multi-step manufacturing process. By improving the manufacturing process, braided composite materials can be produced quicker, at a higher quality, and with a lesser degree of human interaction. Two-dimensional (2D) braided composite structures are produced on a 2D braiding machine (e.g. maypole or radial braiding machines). Resin impregnation can be accomplished manually
1
or be vacuum assisted,
2
and the curing process can be done in autoclaves, pultrusion dies, or in composite material tooling. The braid angle, θ, shown in Figure 1, is the predominant factor influencing material properties3–7 and is defined as the angle between the off-axis fibers and the longitudinal direction of the mandrel. The braid angle is the only readily measurable geometric feature on the braided fiber structure during production and is often verified post-production as a measure of quality assurance.
Annotated tubular braided preform showing the braid angle, θ.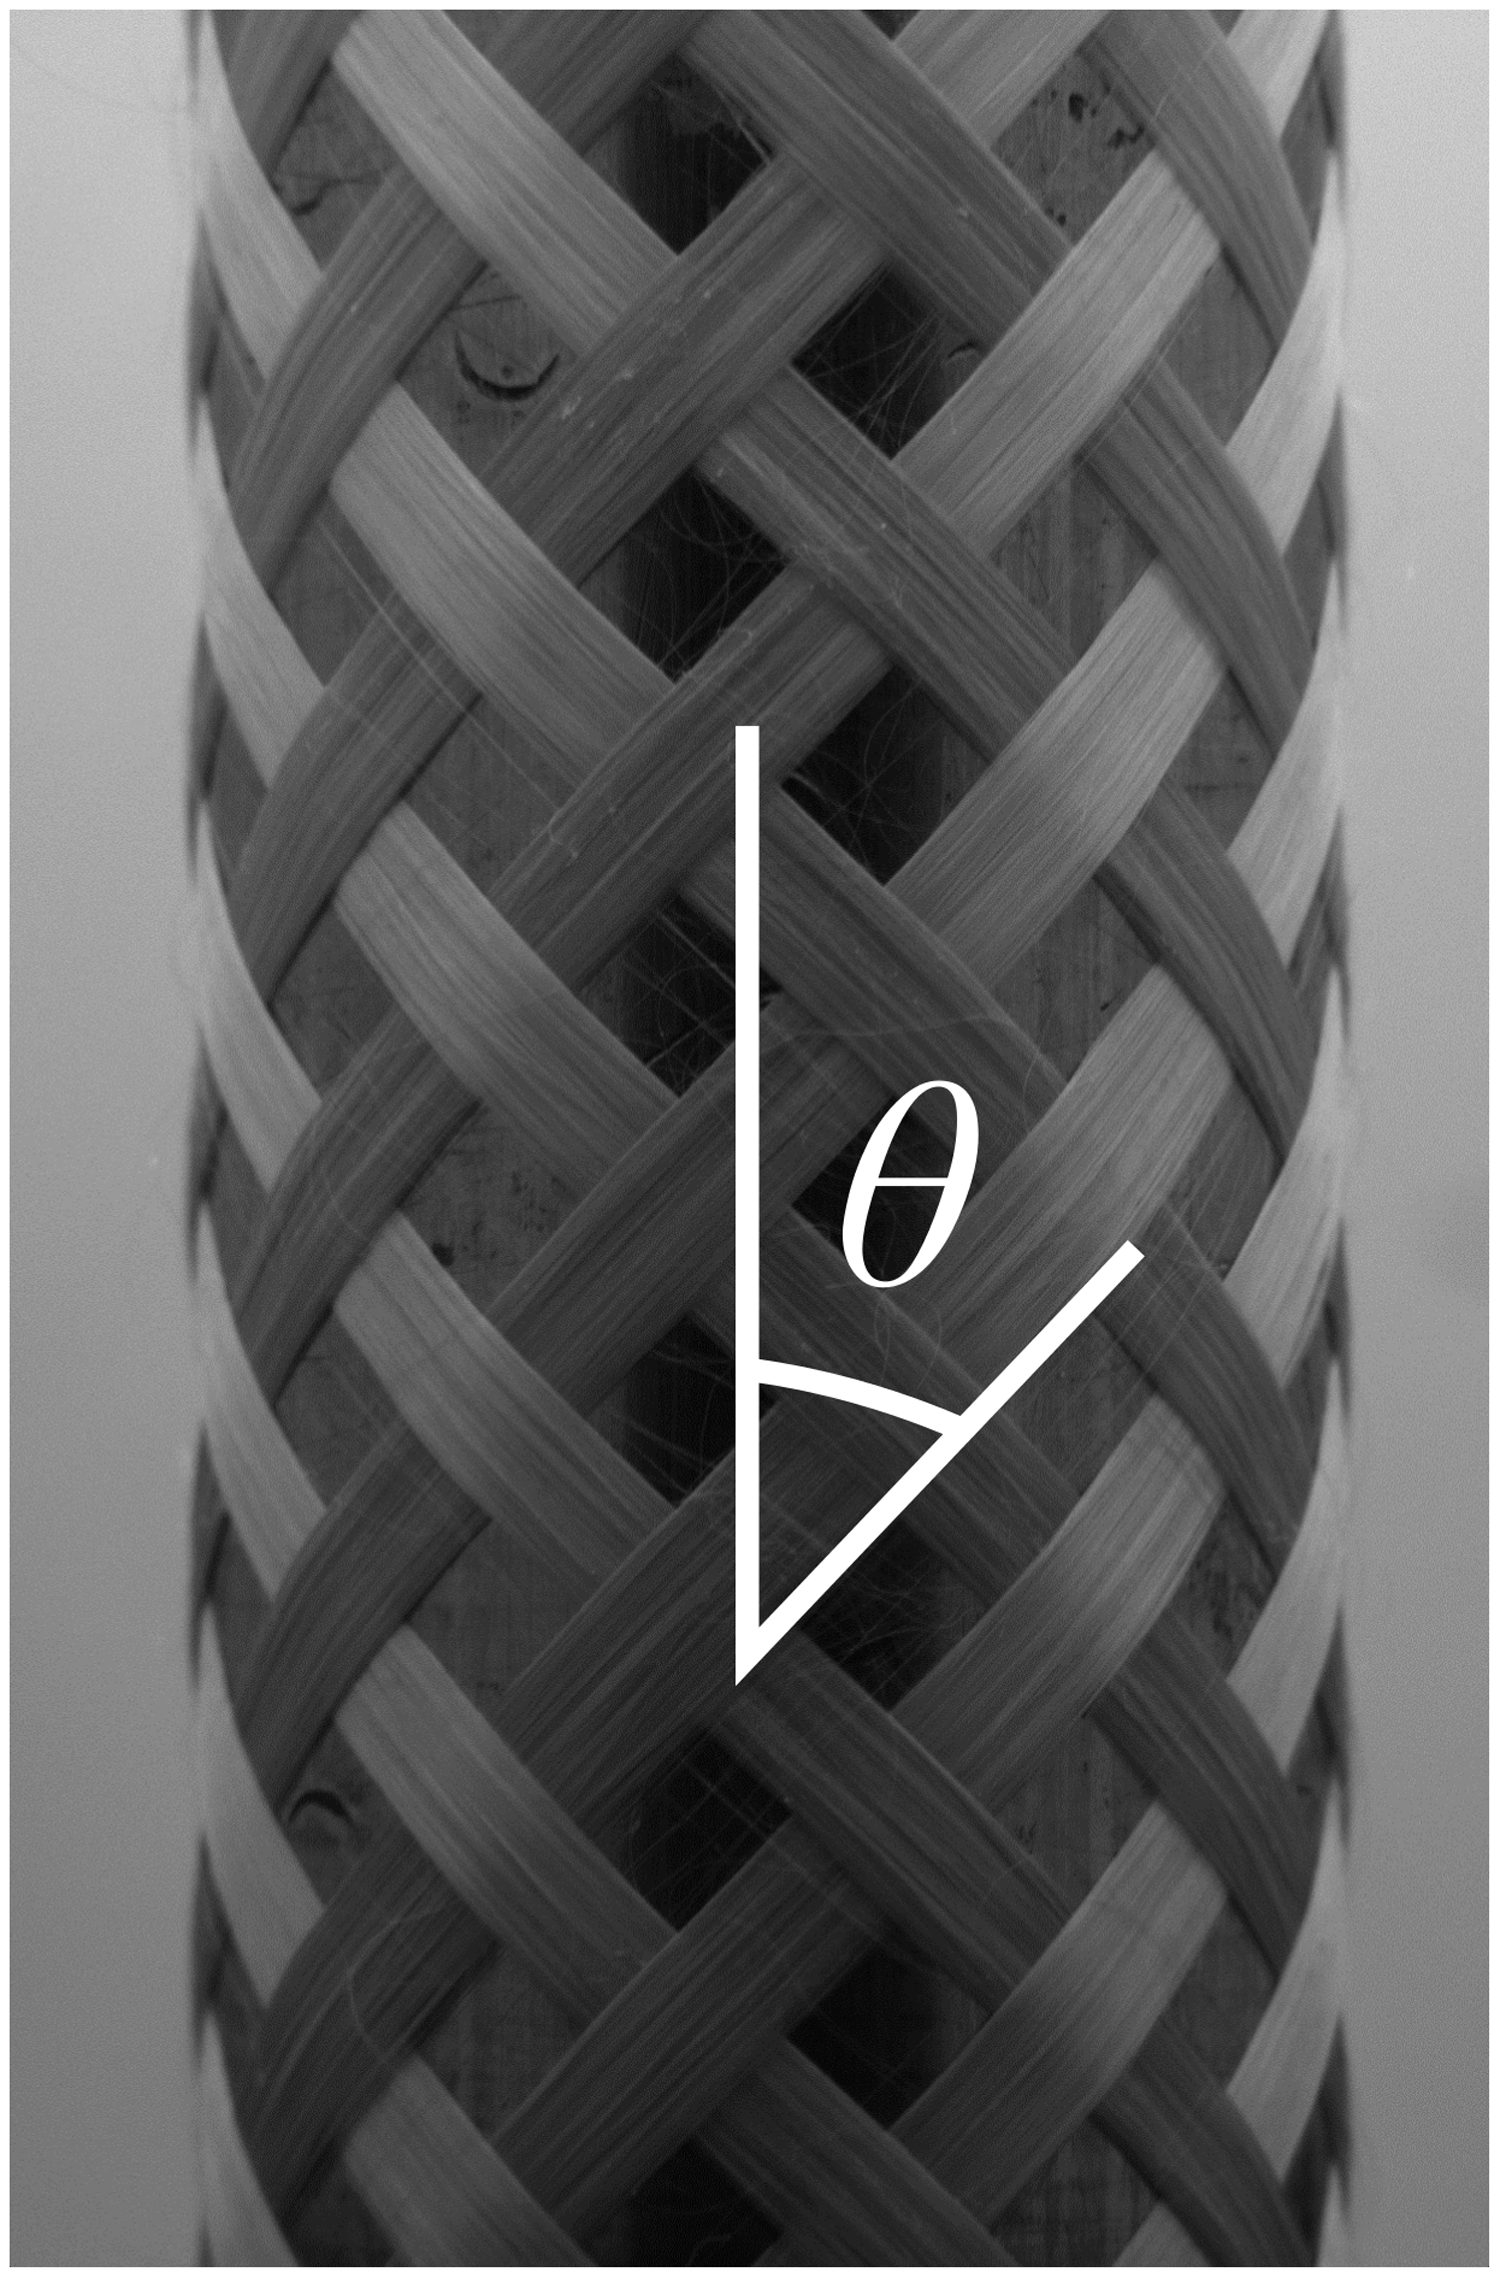
Kinematic relationships relate the desired braid angle to the required braiding machine speeds. Commonly used models by Du and Popper, 8 Guyader et al., 9 and Zhang et al. 10 rely on geometric relations; however, since they neglect inter-yarn friction, these models have been shown to be inaccurate for more complex braids by Du and Popper, 8 Van Ravenhorst and Akkerman, 11 Rawal et al., 12 and Na et al. 13 The work of Alpyildiz 14 and Ning et al. 15 shows that the yarn direction of braided structures contains an out-of-plane component, which is not considered in the previously mentioned models. Further work done by Zhang et al. 16 and Van Ravenhorst and Akkerman 17 shows the effect of inter-yarn forces on the braiding process; however, the complexity of these models requires significant processing time, and the outcomes are significantly affected by the assumed parameters, such as inter-yarn and guide ring friction. The dependence of these models on unique case-by-case braiding parameters creates the need for quality assurance measurements to verify the performance of the predictive braiding model. A non-contact braid angle measurement technique is critical to the braided composite industry. If successful, the approach can be extended to serve other types of fiber-reinforced composite materials.
Currently, braid angle measurements are made post-production using manual measurement techniques, either directly from protractors or goniometers10,17–19 or by tracing or identifying landmarks on images, as was done by Van Ravenhorst and Akkerman, 11 Lomov et al., 20 and Leung et al. 21 These techniques cannot be done in real-time because they require manual placement of tools or measurement points. The manual interaction causes inaccuracies as high as ±1–2° due to human error, as shown by Van Ravenhorst and Akkerman 11 and Hunt and Carey. 22 Measurement methods developed by Van Ravenhorst and Akkerman 11 and Leung et al. 21 used digital image correlation and multi-frame photogrammetry to take the three-dimensional (3D) surface profile into account. While these techniques are capable of resolving the surface profile, the fiber paths still require a manual landmark identification process. Fully automated measurement techniques have not yet been applied to samples with a 3D surface profile.
Machine vision consists of automated image acquisition, processing, and analysis. Such technology has been used in the textile industry by Sari-Sarraf and Goddard 23 to measure fabric density, and by Malek et al. 24 and Chan 25 as fault detection systems. Machine vision has been integrated into the braiding process by Branscomb and Beale 26 to track the position of the braid point to detect faults; however, a similar system has not been developed for quality assurance, measurement purposes, and production feedback. Sharon and Lin 27 and Taylor et al. 28 used machine vision techniques to monitor continuous wrapping processes; however, rather than measuring the wrapping angle, machine vision was used for fault detection purposes when wrapping wire.
The aim of this study was to develop and validate a machine vision system for the real-time braid angle measurement of braided structures during production for quality assurance and production feedback purposes. The developed system uses two-dimensional discrete Fourier transform (2D-DFT) to process the images and has been applied to tubular braided preforms. The machine vision algorithm will improve the braid angle measurement process by making the measurements in an automated fashion, absolving the fiber orientation measurement from human error.
Methods
Two-dimensional braiding theory
The 2D braiding process is governed by kinematic relationships, which relate the rotational speed of the carriers, ω, linear velocity of the mandrel, ν, and the radius of the mandrel, Rm, to the steady-state braid angle,

Transient braid patterns are the result of sudden changes in braiding machine speeds, either from the mandrel or the carriers. Once either of these process parameters is varied, the braid pattern will change in a transient fashion, as modeled by Du and Popper
8
in Equations (2) and (3). Equation (2) calculates the location of the convergence point (the axial location at which the fibers make contact with the mandrel), h(t), as a function of time. The location of the convergence point is related to the braid angle, θ, in Equation (3), the transition from the initial convergence point, h0, and, to the steady-state value results in a transient braid angle Schematic of the braiding machine showing important braiding machine geometry.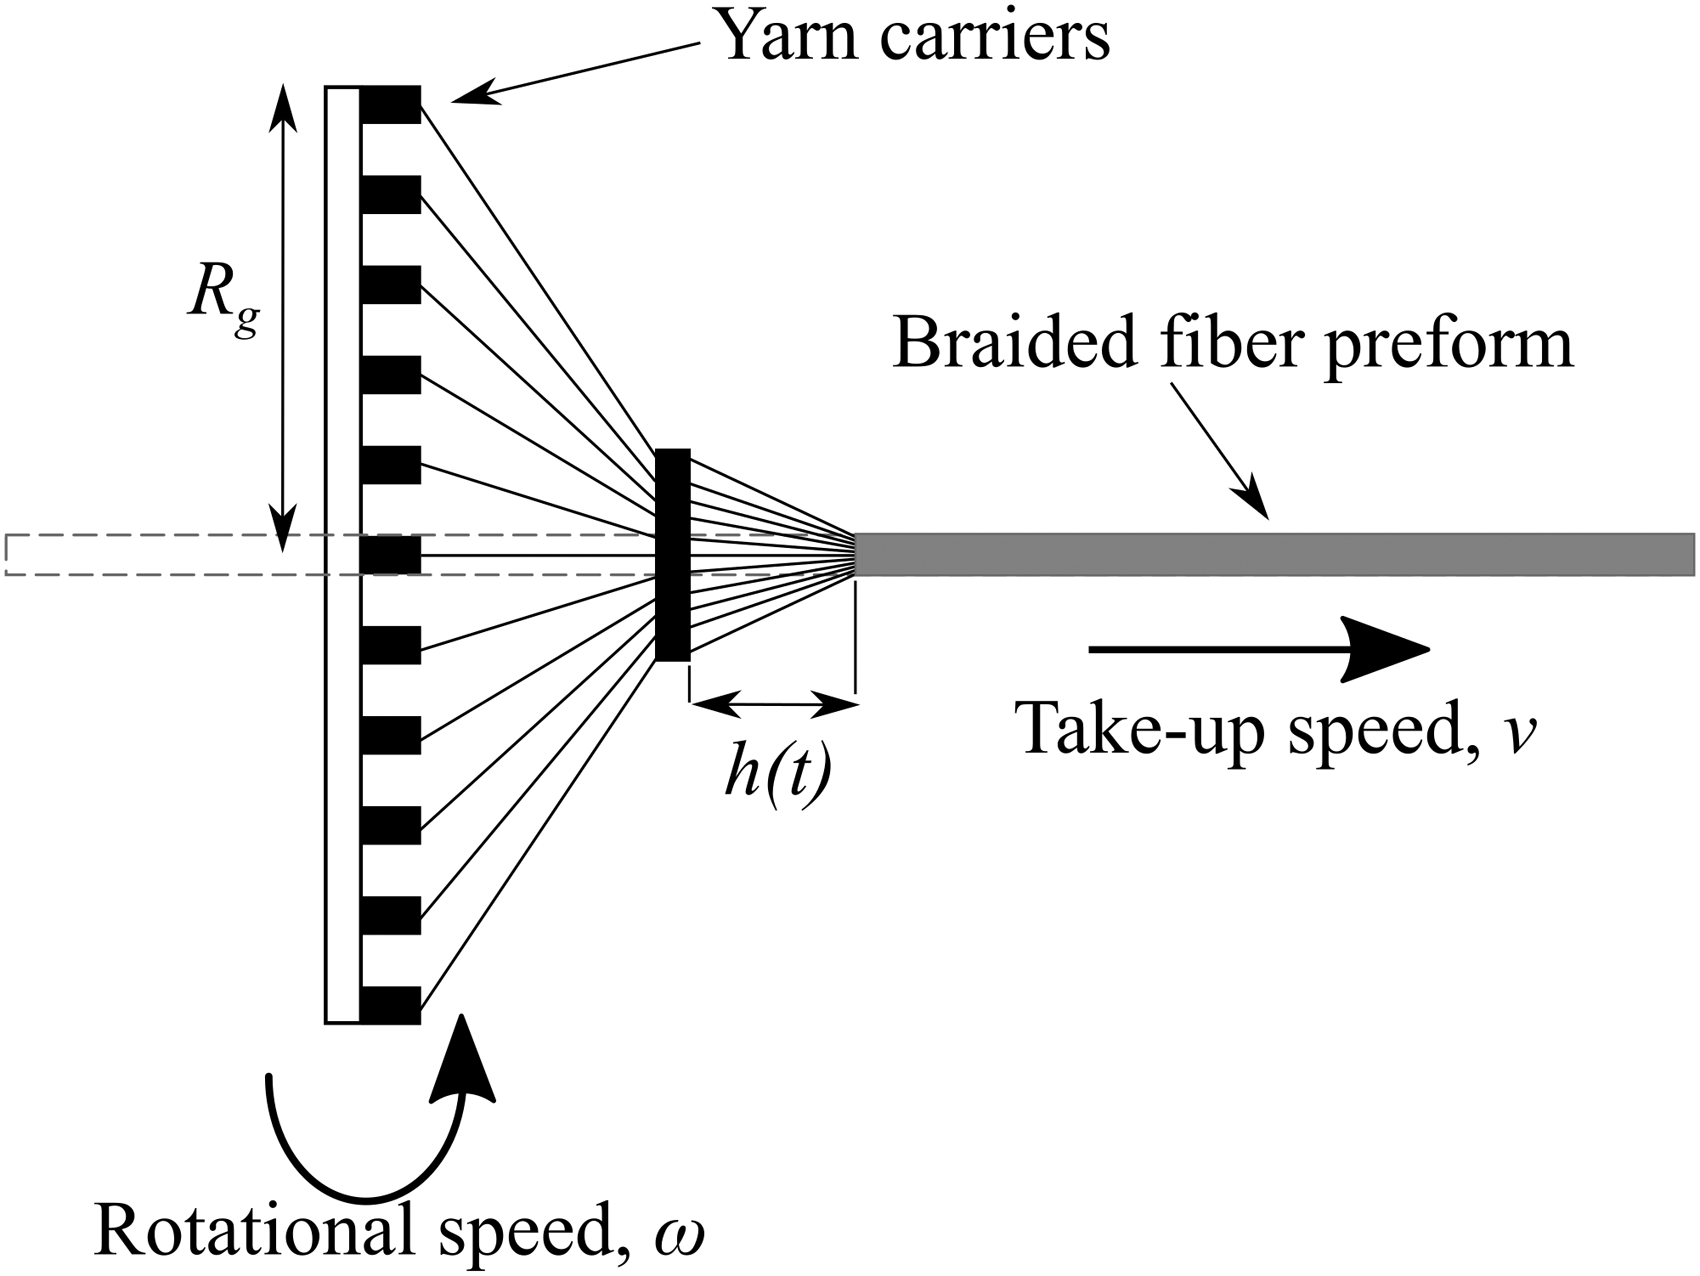



Sample production
Tubular braided preforms were produced using a 36-carrier maypole braiding machine [Steeger HS140/36-91, Germany], using aramid fibers [Kevlar49, Dupont, Mississauga ON] atop a tubular 1” (25.4 mm) diameter steel mandrel. Three braid angles were produced (30°, 45°, and 55°). This range of braid angles was chosen based on manufacturing limits of the biaxial braiding process. For the chosen experimental setup, the maximum manufacturable braid angle lies between 55° and 60° prior to the yarns becoming jammed. 8
Braiding production parameters for steady-state braiding tests

Transient braid patterns are the result of sudden changes in braiding machine speeds, either from the mandrel or the carriers. Samples with transiend braid patterns with increasing and decreasing braid angles between steady-state braid angles of 30° and 55° were produced.
Experimental procedure
Images of the braided preforms were captured using a single high-resolution scientific grade area-scan camera [Basler Pilot pi2400-17gm, Germany] with a five-megapixel charge-coupled device (CCD) sensor. Raw collected images measured 2456 × 2048 pixels with a bit depth of 8 bits. A 35-mm fixed focal length lens [NMV-35, Navitar, New York, USA] was used to achieve the required magnification, giving the images a spatial resolution of 0.025 mm/px. Considerations were taken to minimize the reflections from both the aramid fibers and the mandrel. Non-direct lighting from a diffuse light-emitting diode (LED) light source [DL106, Advanced Illumination, Rochester, VT, USA] was used to properly illuminate the samples. Machine vision measurements depend strongly on the quality of the lighting. Care was taken to evenly illuminate the fibers while minimizing strong reflections. The reflectivity of other common composite fibers, such as glass or carbon, will differ from aramid and may require a different illumination approach to achieve good quality images.
Images were taken during two distinct conditions. Firstly, measurements were taken in four locations along the length of a static preform. Secondly, the dynamic real-time performance of the machine vision measurement system was determined by making measurements in real-time, in-line with the braiding process. Samples with constant and transient braid angles were produced and imaged. For each sample, 80–120 measurements were taken along the length of each preform during the real-time tests at a rate of 1 Hz. This image acquisition rate was chosen based on the selected braiding speeds, as outlined in Table 1, following sampling rate theory, to provide sufficient sampling to characterize a transient braid pattern. The number of measurements taken per sample depended on the time taken to reach a steady-state braiding condition and the finite length of the mandrel.
Frequency domain analysis
The 2D-DFT was used as the primary image processing technique to extract fiber direction information from the captured images. Shown in Equation (5), the transform allows an image of size M × N with pixel intensity values f(x,y) to be transformed into a frequency spectrum, F(u,v), of size M × N. The values of f(x,y) depend on the bit depth of the image sensor, whereas the values of F(u,v) will be rescaled to lie between [0,1]. The coordinate systems were defined by the spatial coordinates, x and y, and the frequency coordinates, u and v, in the x and y directions, respectively. The reverse transform is shown in Equation (6). This transformation between spatial, Spatial image (a) and frequency spectrum (b) showing respective coordinate systems and relationship between the measured angles in the spatial and frequency domains, and the relationship between the fiber directions and frequency domain features.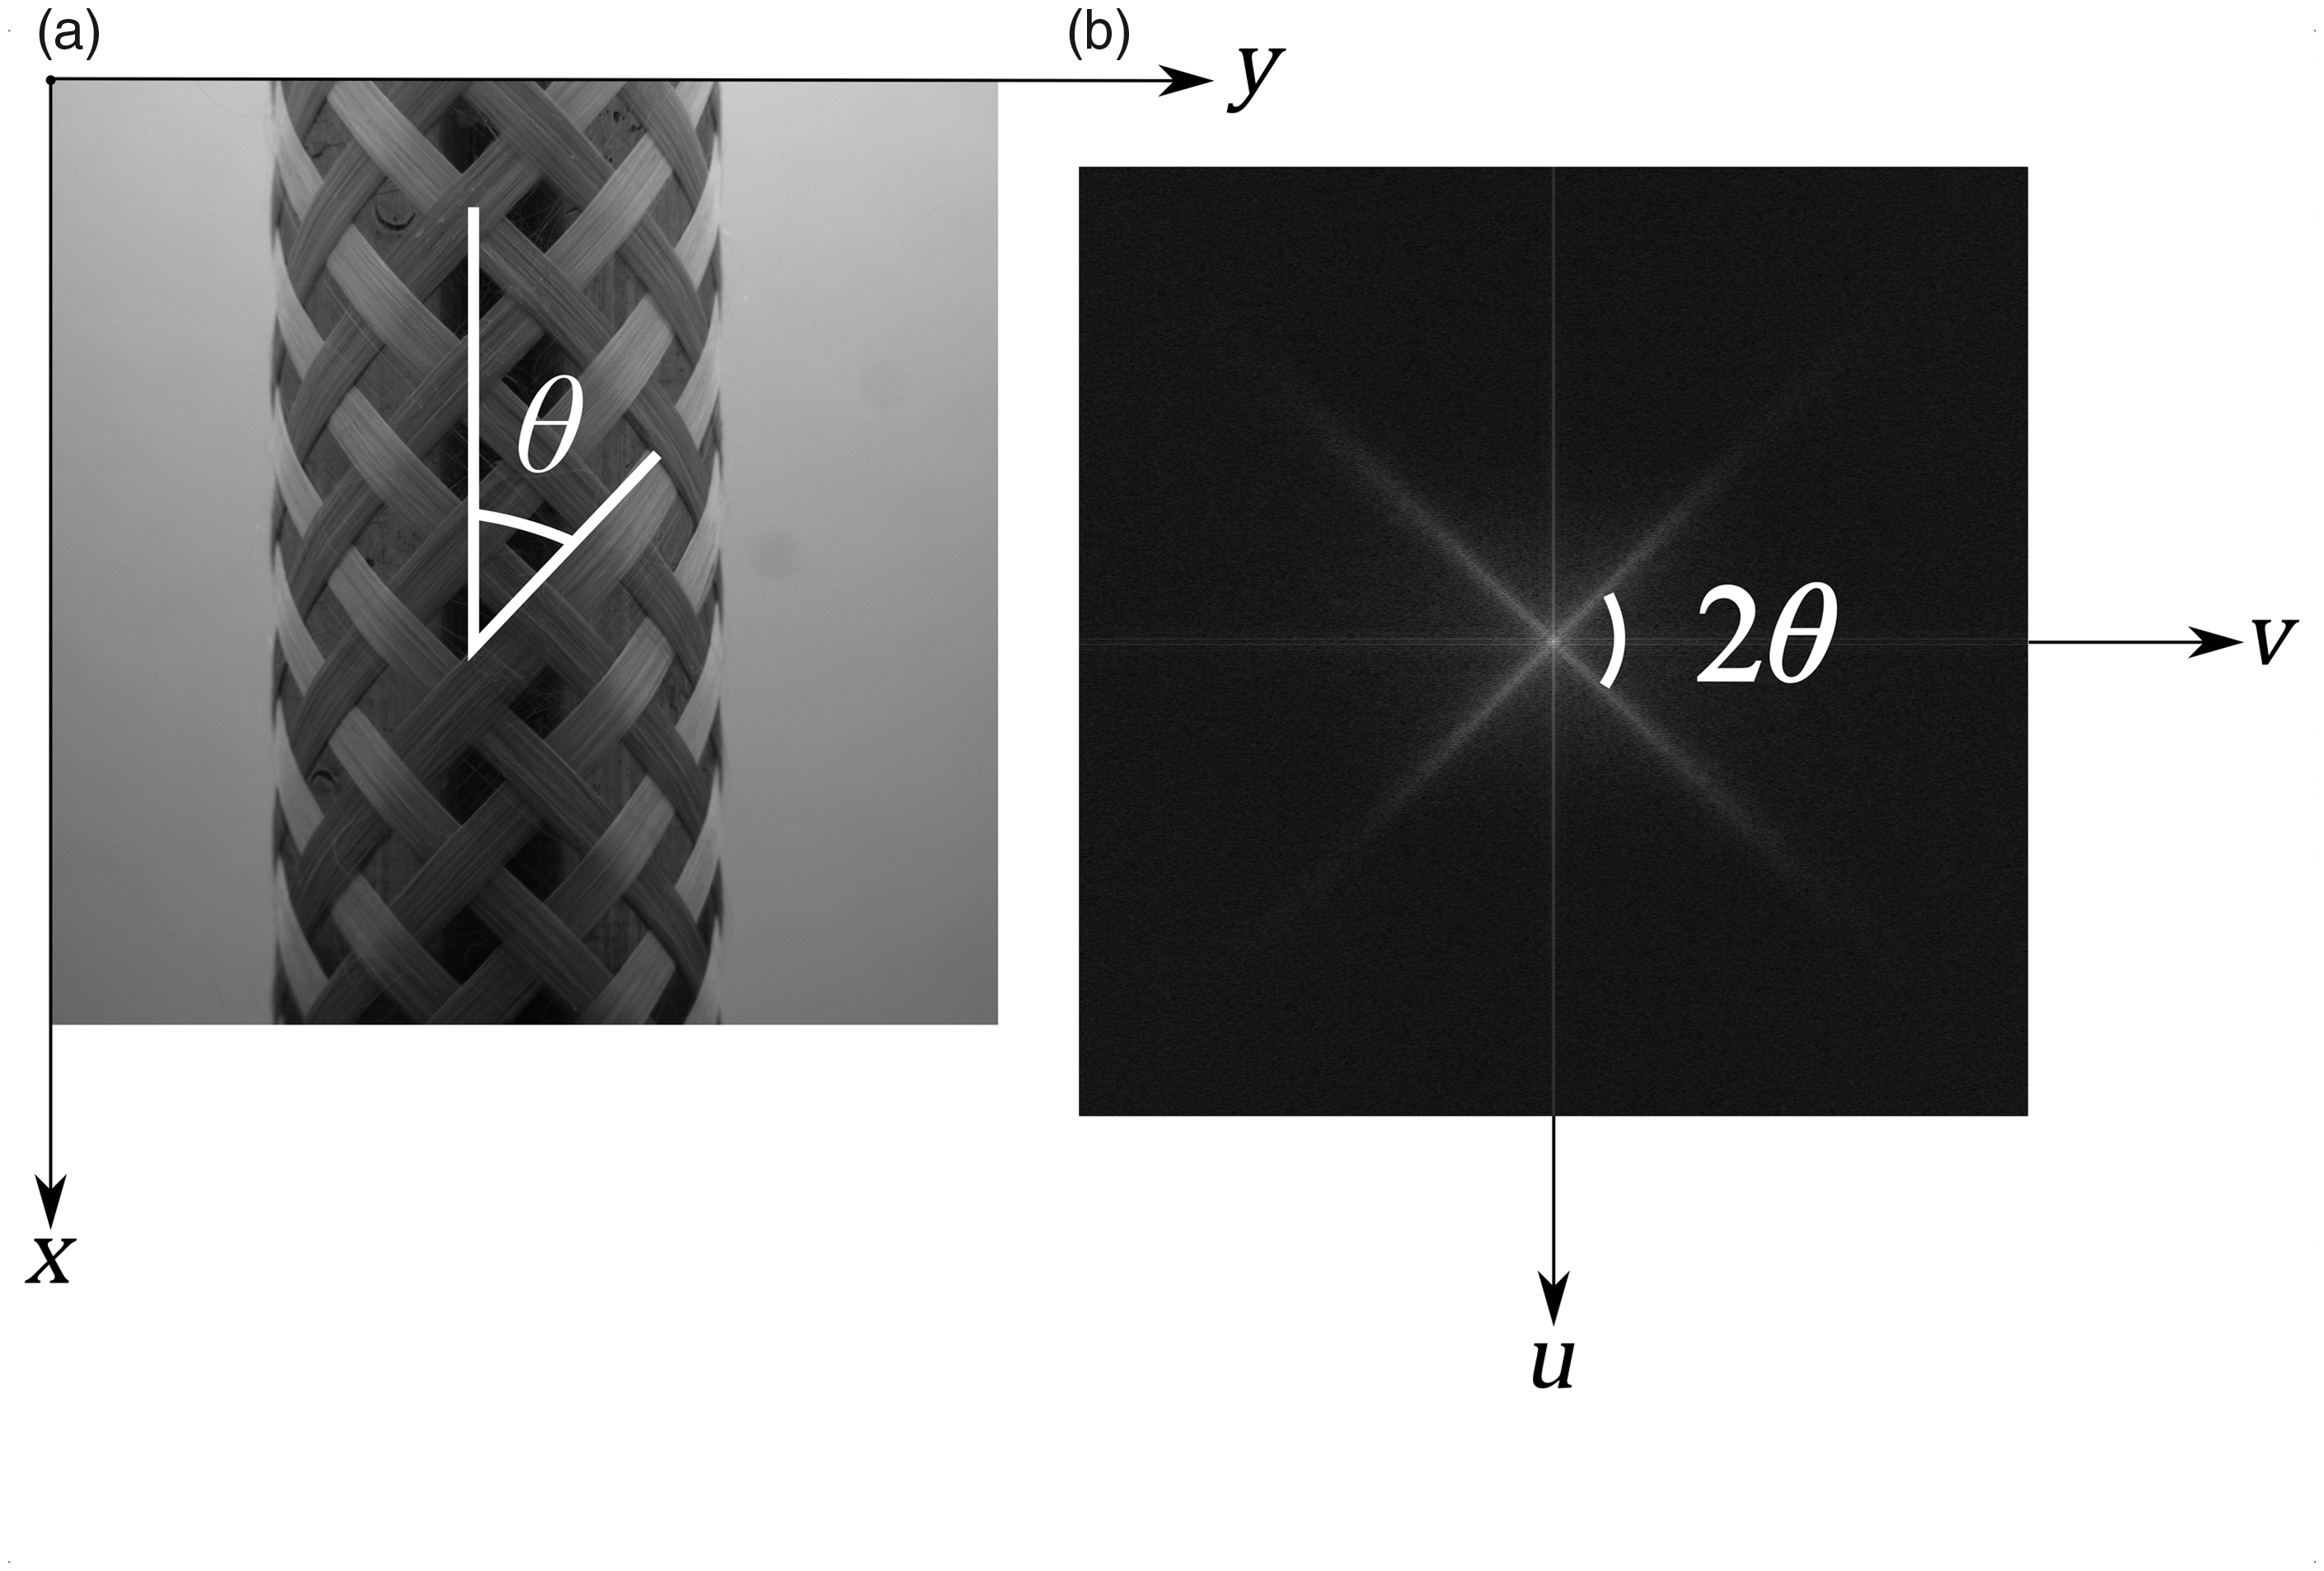
This approach has been used in both the composite30–32 and textile industries24,33–36 for image analysis applications ranging from feature identification to fault detection


Image frequencies are a representation of the magnitude and direction of the pixel changes in the spatial image, with high frequencies representing sudden changes in pixel intensity, and low frequencies representing regions of constant pixel value. The angular orientations of edges in the spatial image correspond to the angular orientation of features in the frequency domain for a square frequency spectrum. 37 This property is used to make the braid angle measurements; Figure 3 shows a spatial image and its corresponding frequency spectrum annotated with the braid angle, θ.
Braid angle measurement algorithm
The goal of the measurement algorithm is to obtain braid angle measurements in real-time and without user interaction. This algorithm was developed and implemented in the MATLAB programming environment [MATLAB 2017a, Mathworks, Natick, MA, USA].
Once an image of the braid image is collected, the 2D-DFT is applied to obtain the frequency spectrum. Due to the conversion from spatial to frequency variables, the sample can be positioned anywhere within the image region of interest. The alignment between the centerline of the sample and image is not required. Obtaining an angular measurement from the frequency spectrum requires determining the direction in the frequency spectrum with the largest frequency response. This was done by using a search routine, as shown in Figure 4. A search vector of a fixed length was swept around the center of the image and at each angular position. The mean pixel intensity of the pixels along the search vector was computed. This value represents the magnitude of the image frequencies at that angular orientation. The largest mean pixel intensity along this search vector represents the most significant image frequency. In this application, this corresponds to the fiber direction. Plotting these mean pixel intensity values as a function of angular orientation produces the angular intensity distribution (Figure 5), which provides a visualization of the significant angular orientations in the image. The chosen DFT technique creates some non-representative features located at 0°/90°. These peaks are a result of the implied periodicity of the input signal, Annotated frequency spectrum outlining the search routine used to measure the angular orientation of the strongest frequency components in the spatial image. Angular intensity distribution showing the distribution of angular features in the frequency spectrum. This plot is produced from the search routine in Figure 4.
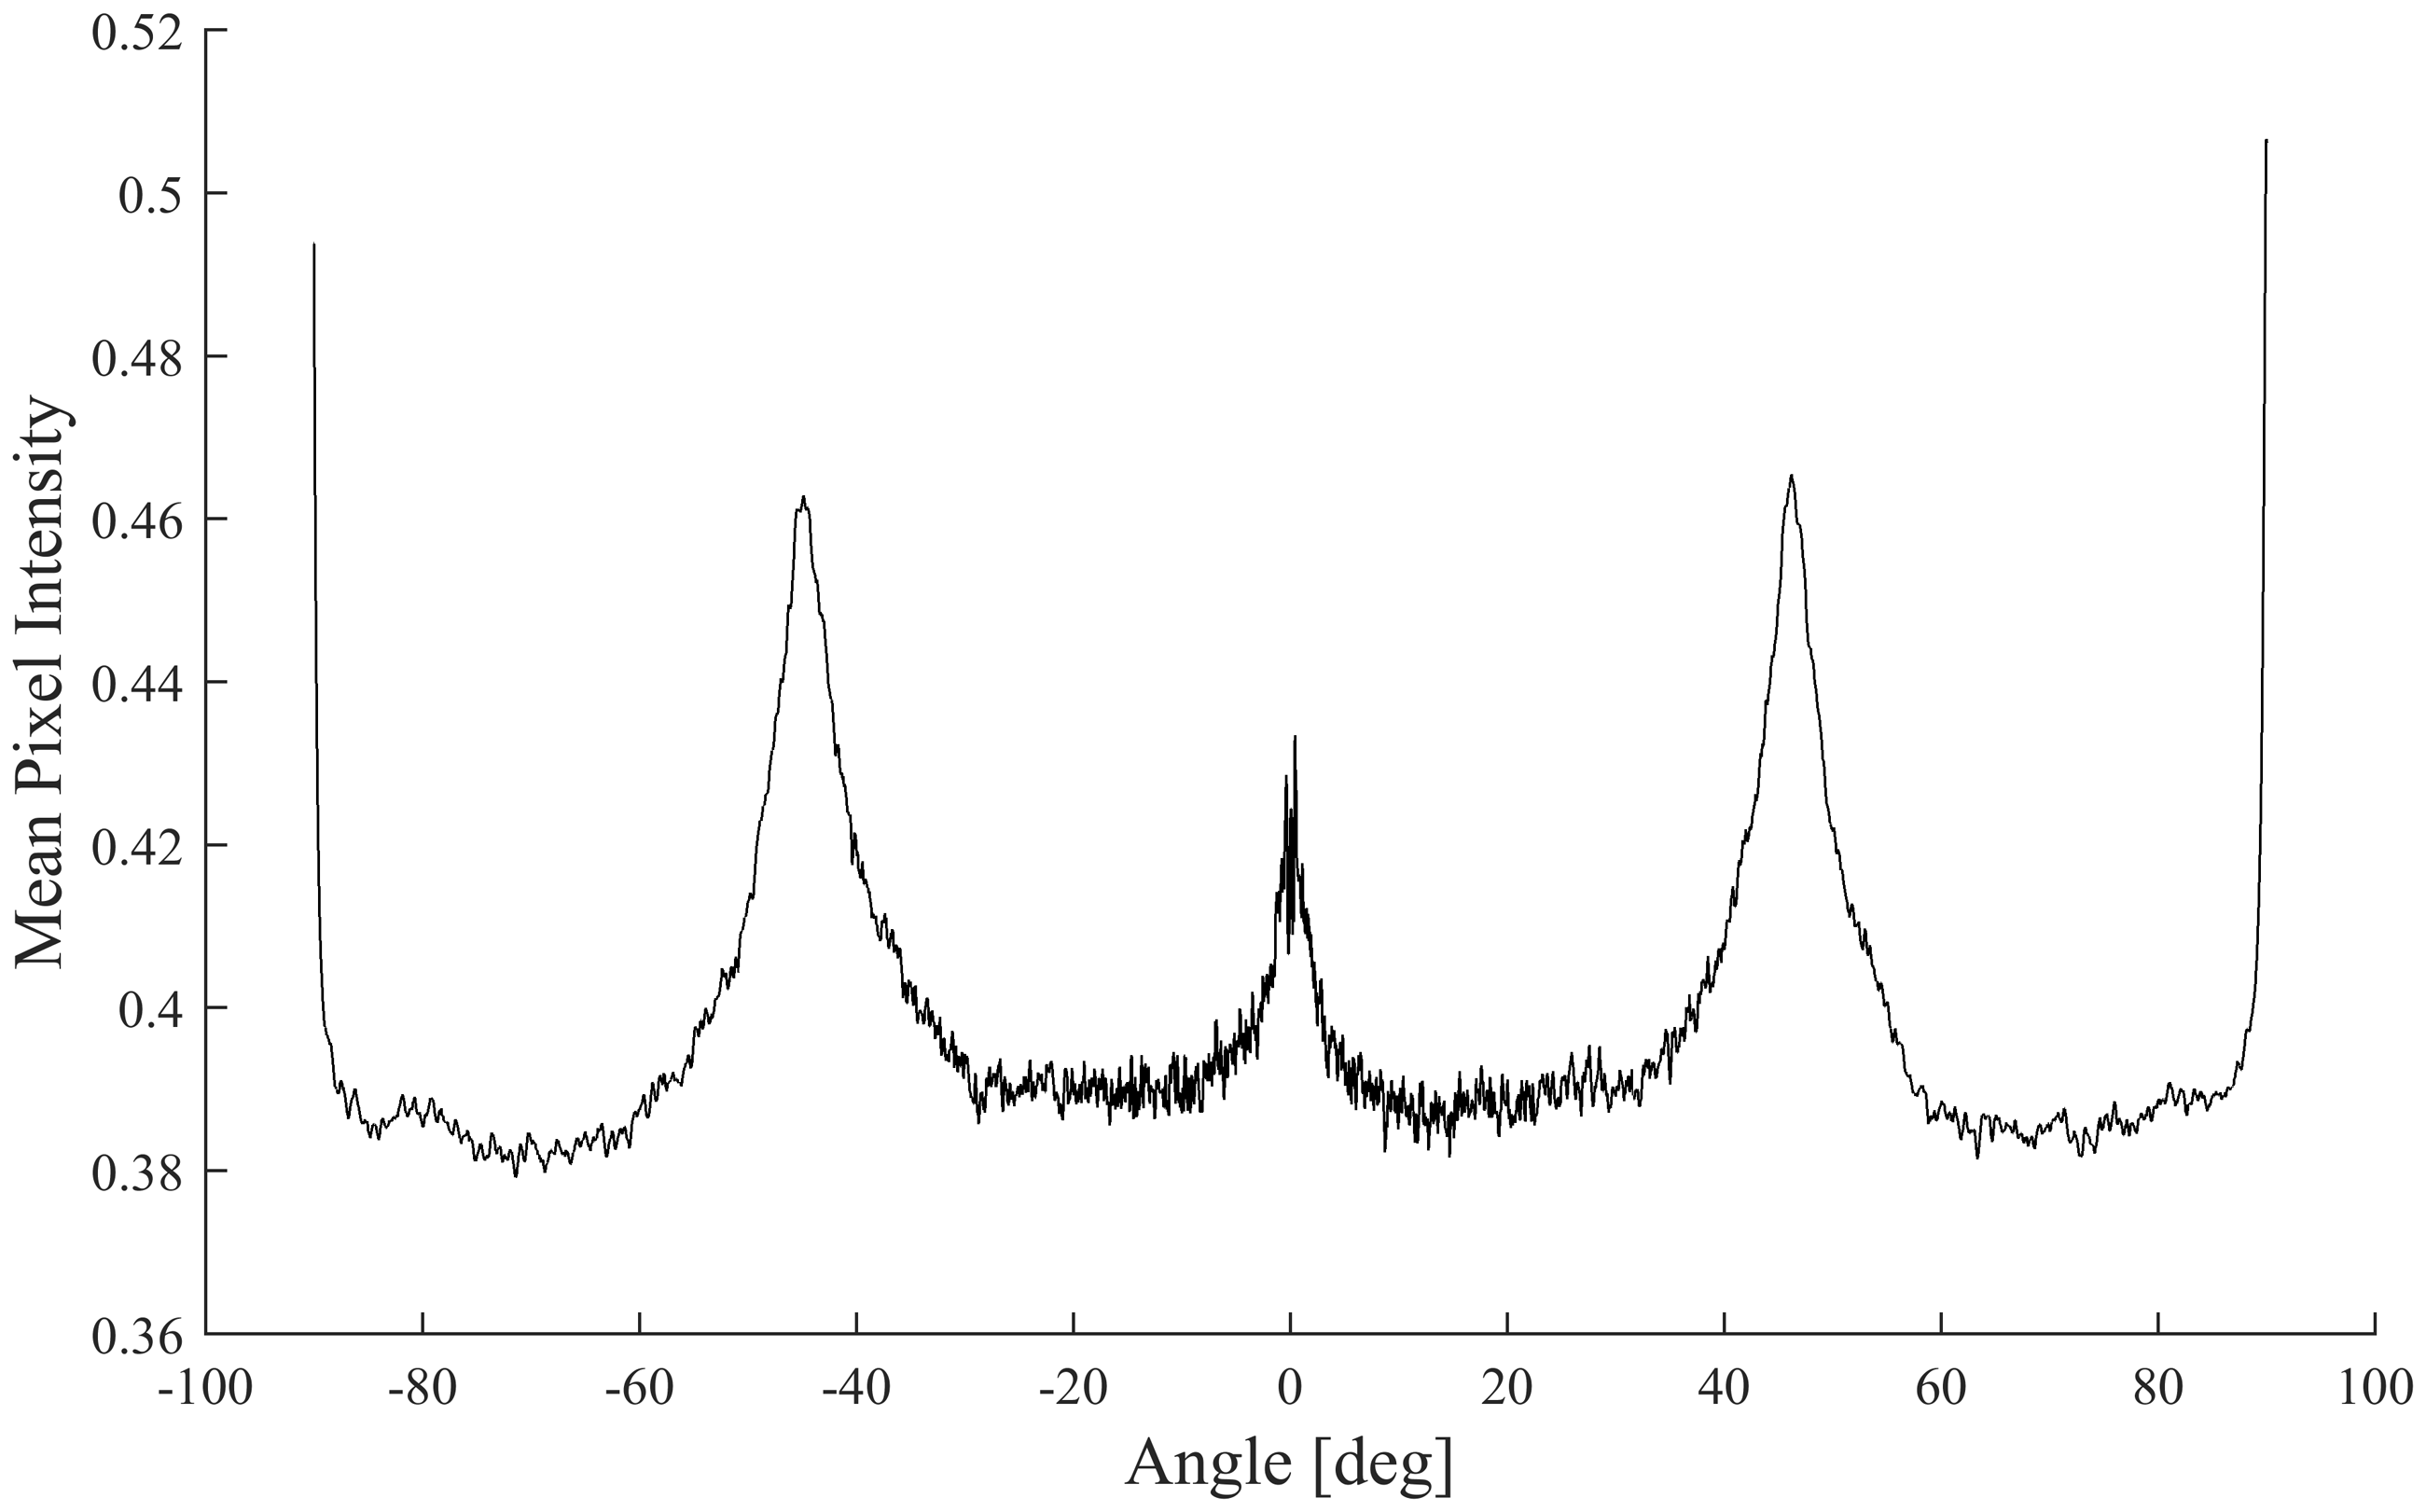
Consideration of tubular mandrel shape
In many studies involving 2D braided composites, braid tubes are produced and either flattened to produce flat samples2,38 or molded into a desired cross-sectional shape, as was done by Uozumi et al.
39
prior to the braid angle measurement. The initial braided fiber structure is, however, produced in a tubular fashion due to the axisymmetric nature of the 2D braiding process. The resulting 3D surface profile for these tubular samples must be considered when measuring the braid angle from the collected images. The non-constant distance between the imaging plane and the tubular surface distorts the fiber direction in the images, causing perspective error (Figure 6).
Projection of helical yarn on a cylindrical surface onto a two-dimensional plane showing that a fiber wrapped around a tubular surface with a constant inclination angle will appear to have a non-constant angular orientation when projected onto an imaging plane.
The amount of distortion was predicted through the analysis of a helical yarn path, which is an assumption used by Du and Popper
8
and Zhang et al.
10
in the development of geometric braiding models. The analytical equation of the projection of a helical path onto a 2D plane is shown in Equation (7).
40
This relates the slope of the line, c, the wrapping radius of the cylinder, r, and the transverse distance from the mandrel centerline, t, to the projected yarn path, p. By applying this to tubular braided samples, the slope corresponds to the produced braid angle and the wrapping radius, r, corresponds to the tubular mandrel radius

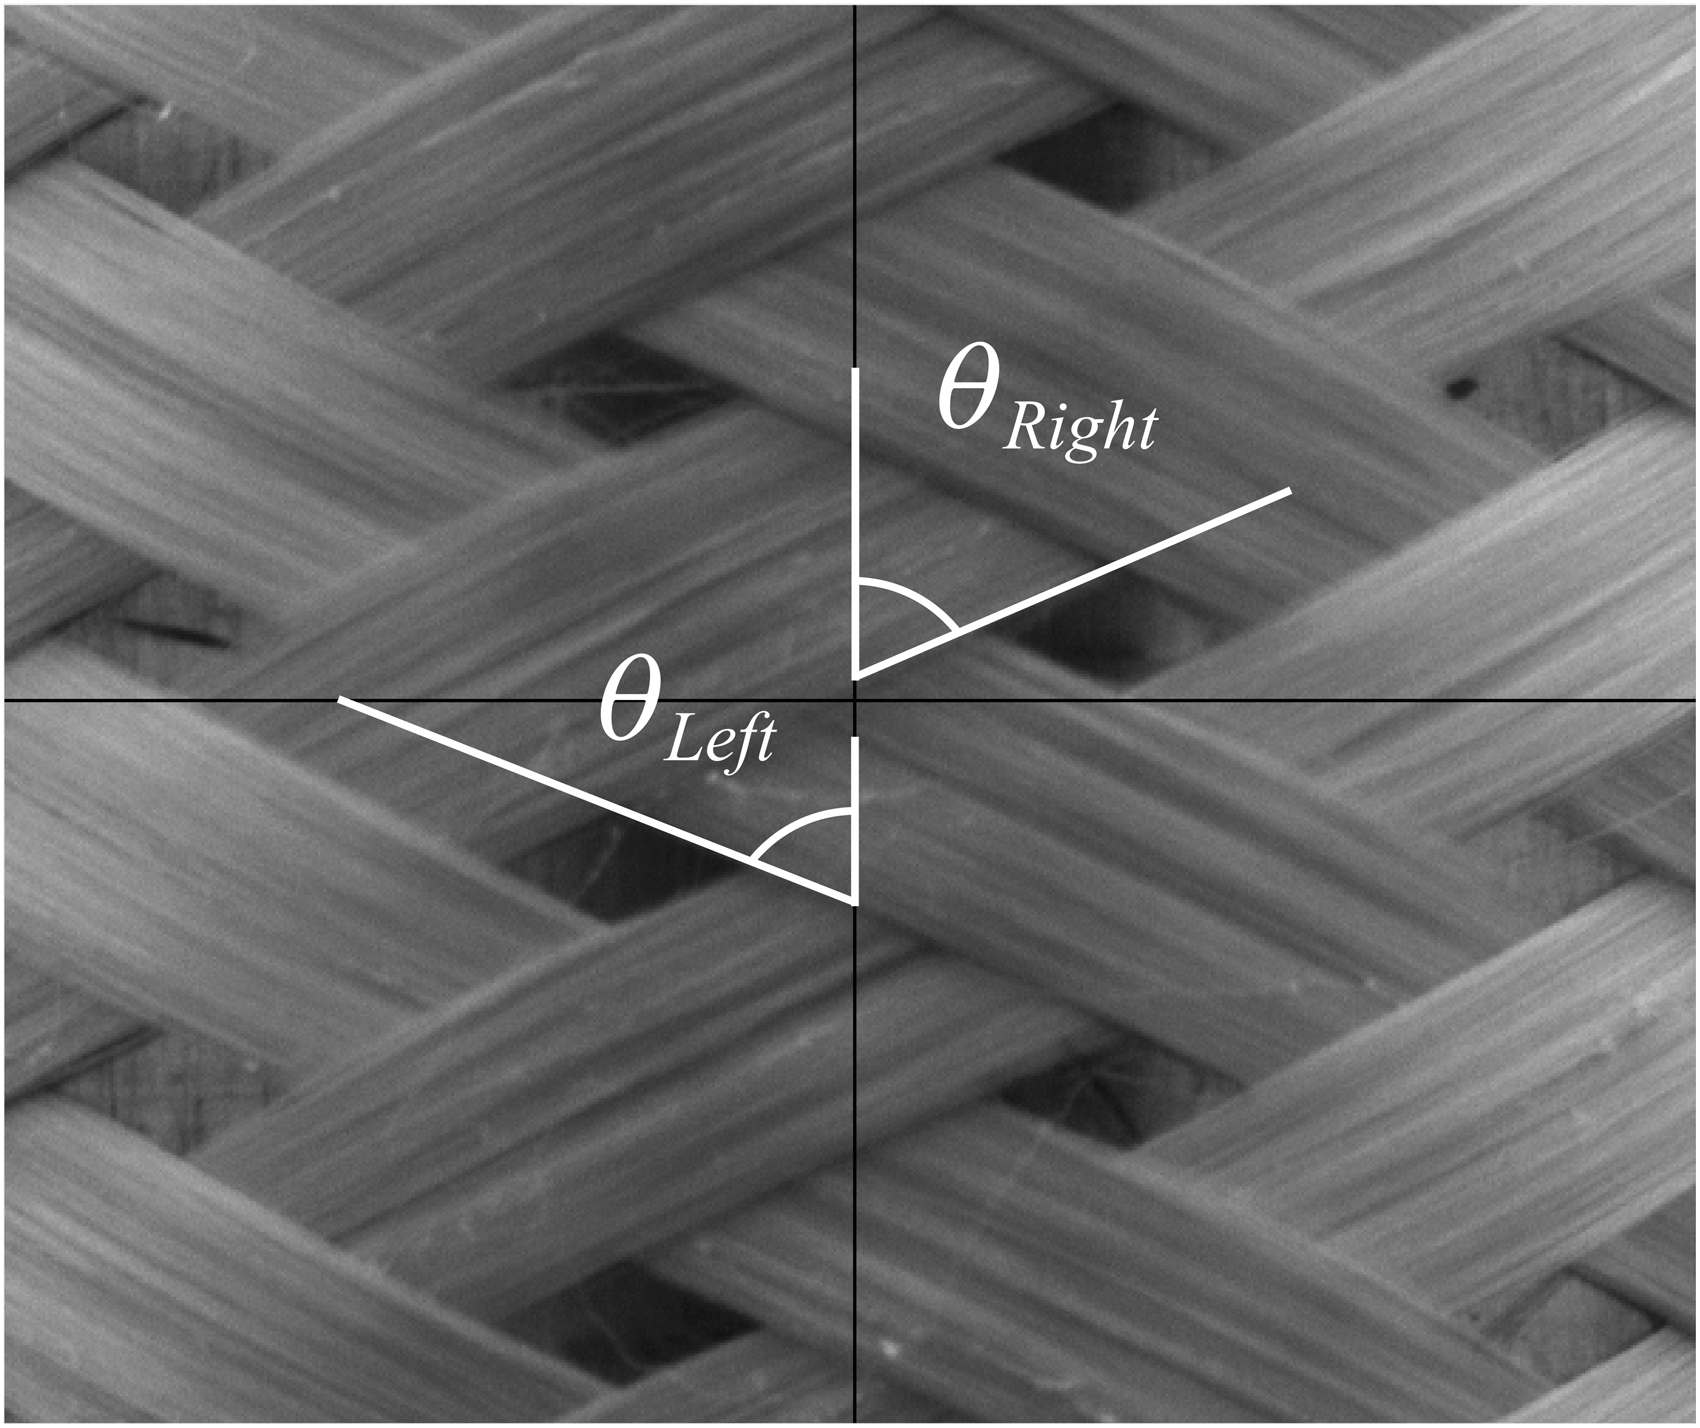
The angle of the projected helical paths was plotted as a function of horizontal position in the image relative to the centerline of the mandrel. This was done in Figure 7 for lines with slopes of 30°, 45°, and 55° relative to the longitudinal direction to explore the relationship between the distortion in fiber orientation and the horizontal distance from the centerline of the mandrel. To validate this model, a series of manual braid angle measurements were taken by tracing fiber boundaries and by using the Angle tool in ImageJ (ImageJ, Bethesda, Maryland, USA). At each location defined by a rectilinear grid traced on the image, the left- and right-hand fiber angles were measured with a manual vector measurement technique, as shown in Figure 8. Similar manual measurement techniques are accurate to ±1–2°, as shown by Van Ravenhorst and Akkerman
11
and Hunt and Carey.
22
Angle of the projected yarn path with respect to the vertical direction as a function of horizontal position from the centerline for a 1” (25.4 mm) diameter tubular mandrel. Close-up region of tubular braided preforms showing the left- and right-hand braid angles within the chosen region of interest.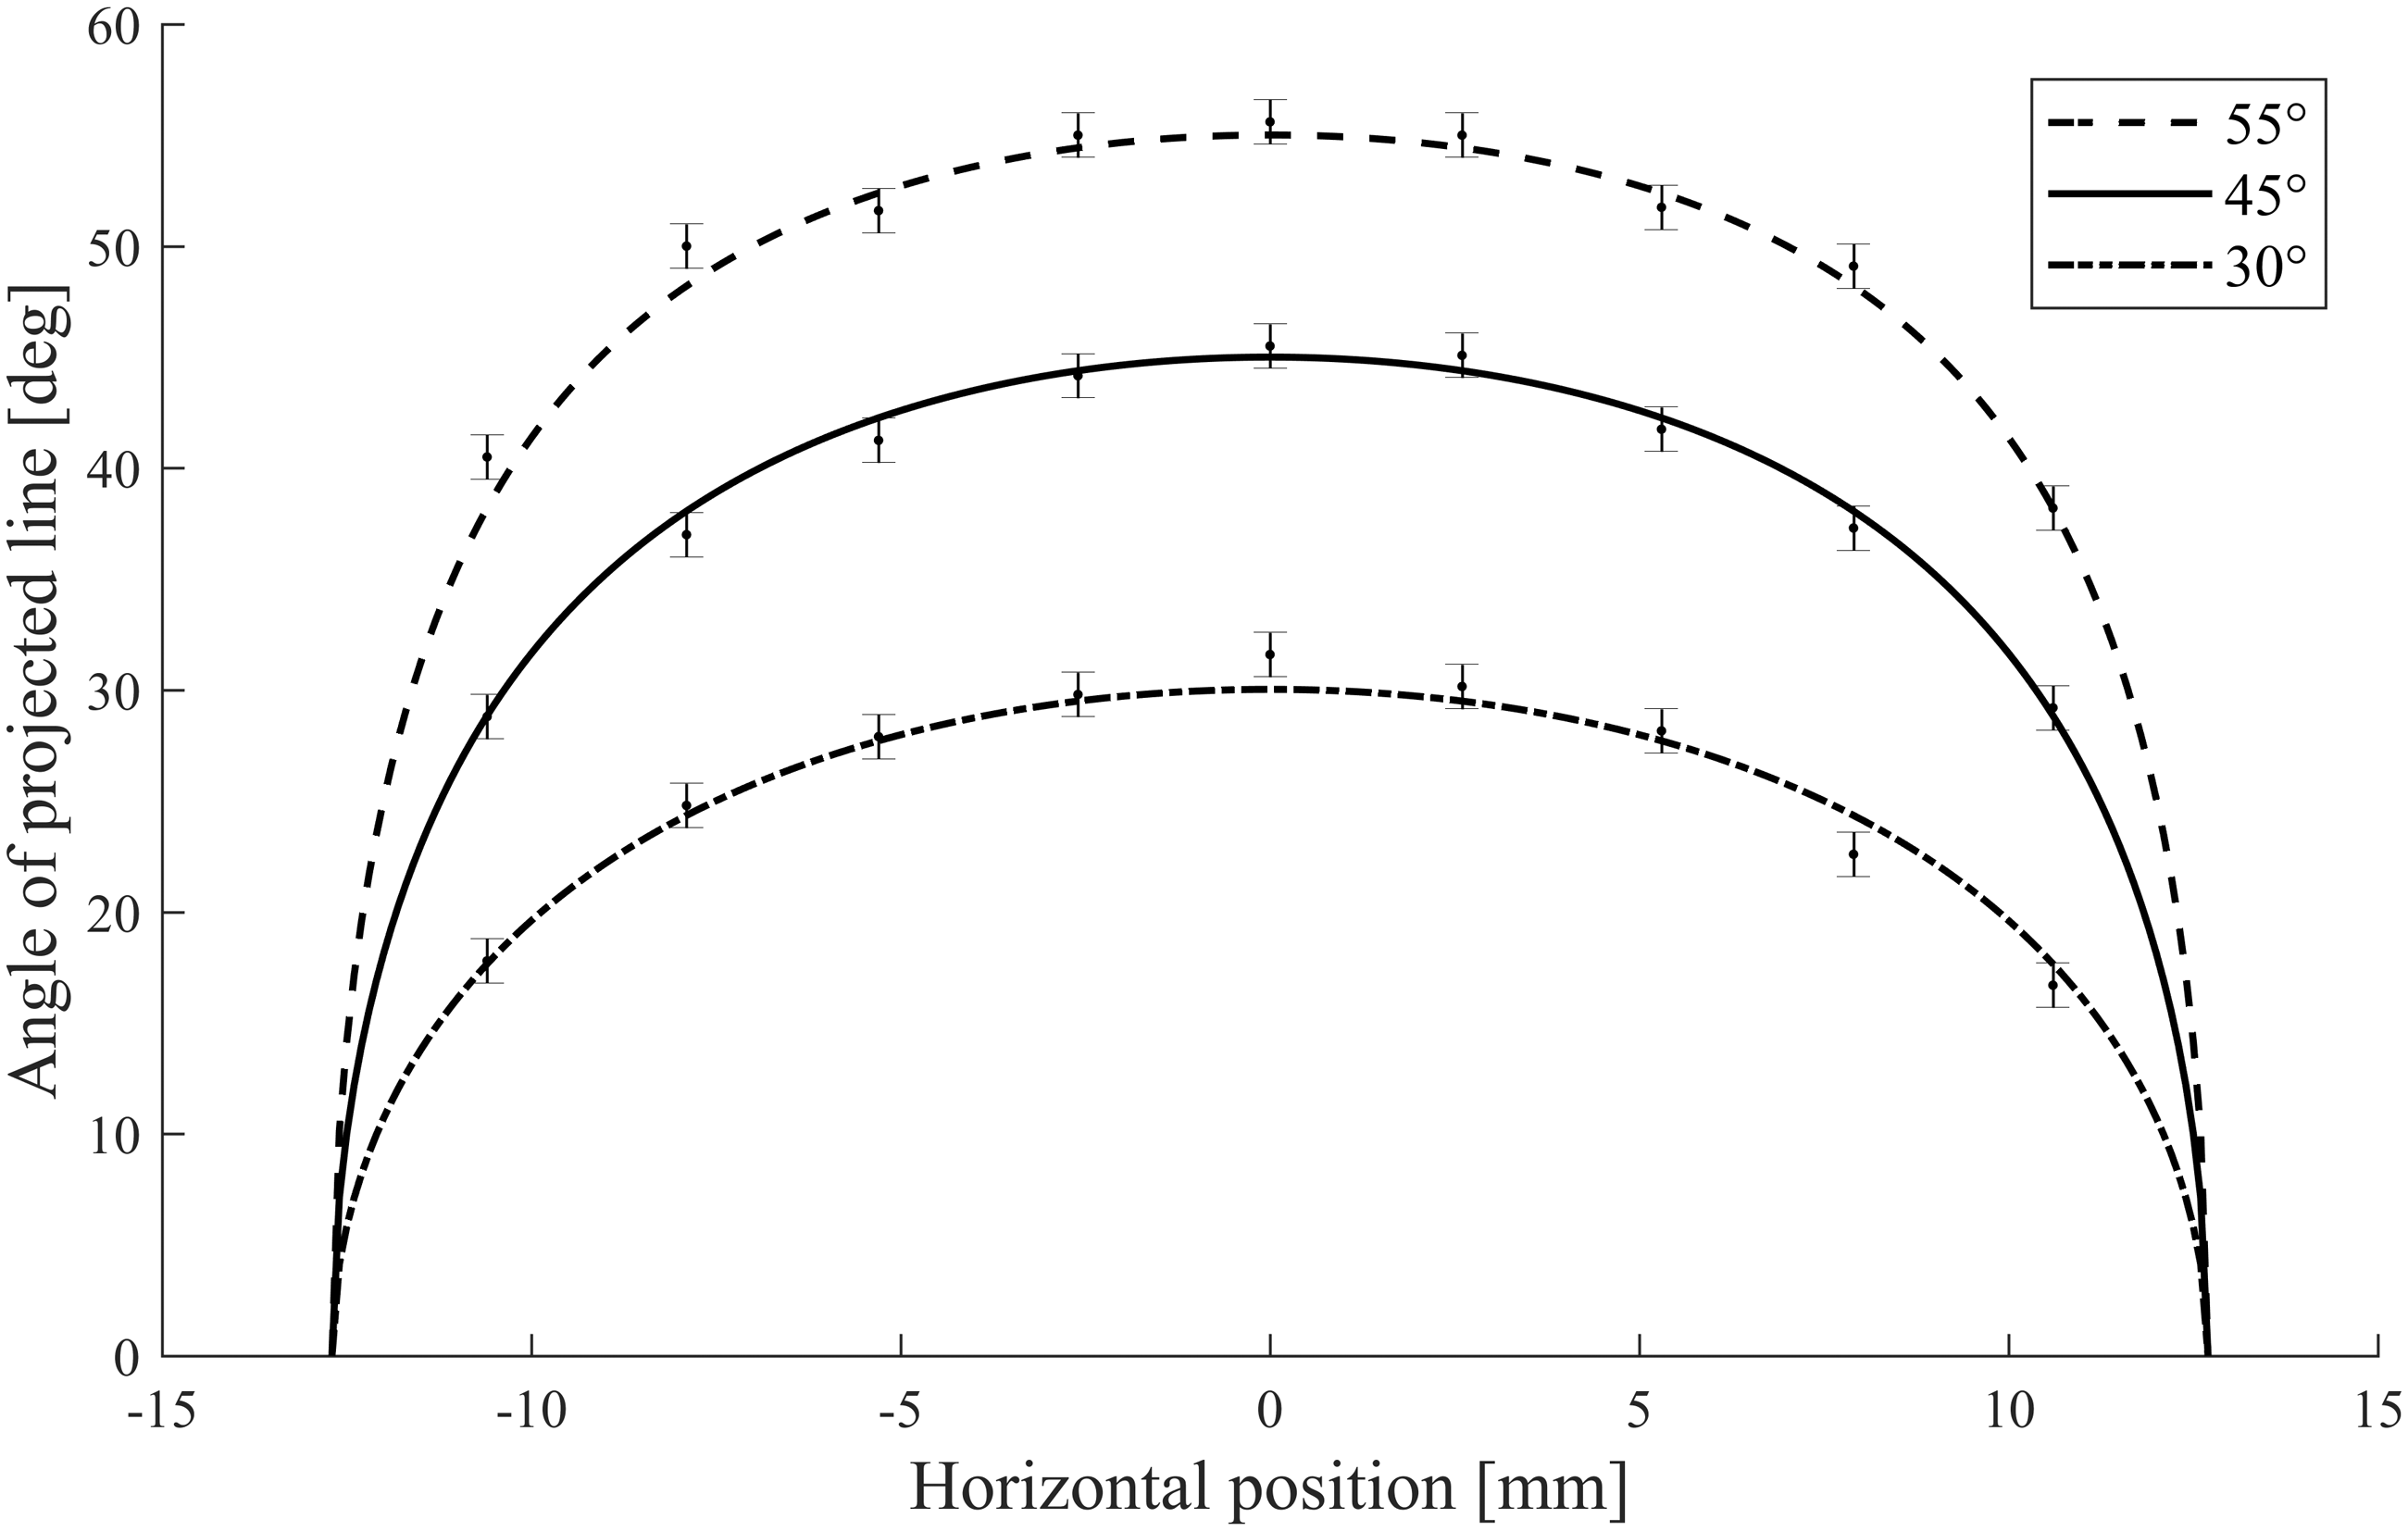
Two different approaches were taken to compensate for the presence of perspective error affecting the fiber direction on the mandrel in the collected images. The first of which was the removal of the heavily distorted regions of the image through image cropping. Perspective error significantly increases with increasing distance from the mandrel centerline. By removing these potions of the image, it can be expected that the distribution of reported fiber directions will decrease. The advantage of this technique is low computational intensity; however, the results will remain affected by perspective error, albeit to a lesser degree. Removing varying percentages of the braid image reduces the distribution of yarn directions in the image. This is shown in Figure 9, which shows the effect of cropping the sample to 50% of the original width, which was chosen for illustrative purposes. The plot in Figure 9 shows a line angle versus horizontal position plot, identical to that shown in Figure 7, with the thick line corresponding to the width of the cropped image. This allows the expected braid angle distribution within an image to be predicted for a cropped image of a specified width. The critical parameter in this method is the percentage of the braid that is cropped from the image on either side of the centerline.
Cropped braid image with 50% of the width removed (a) and the predicted angular distribution plot obtained from the perspective error model (b). The thick gray line in (b) corresponds to the width of the cropped braid in (a).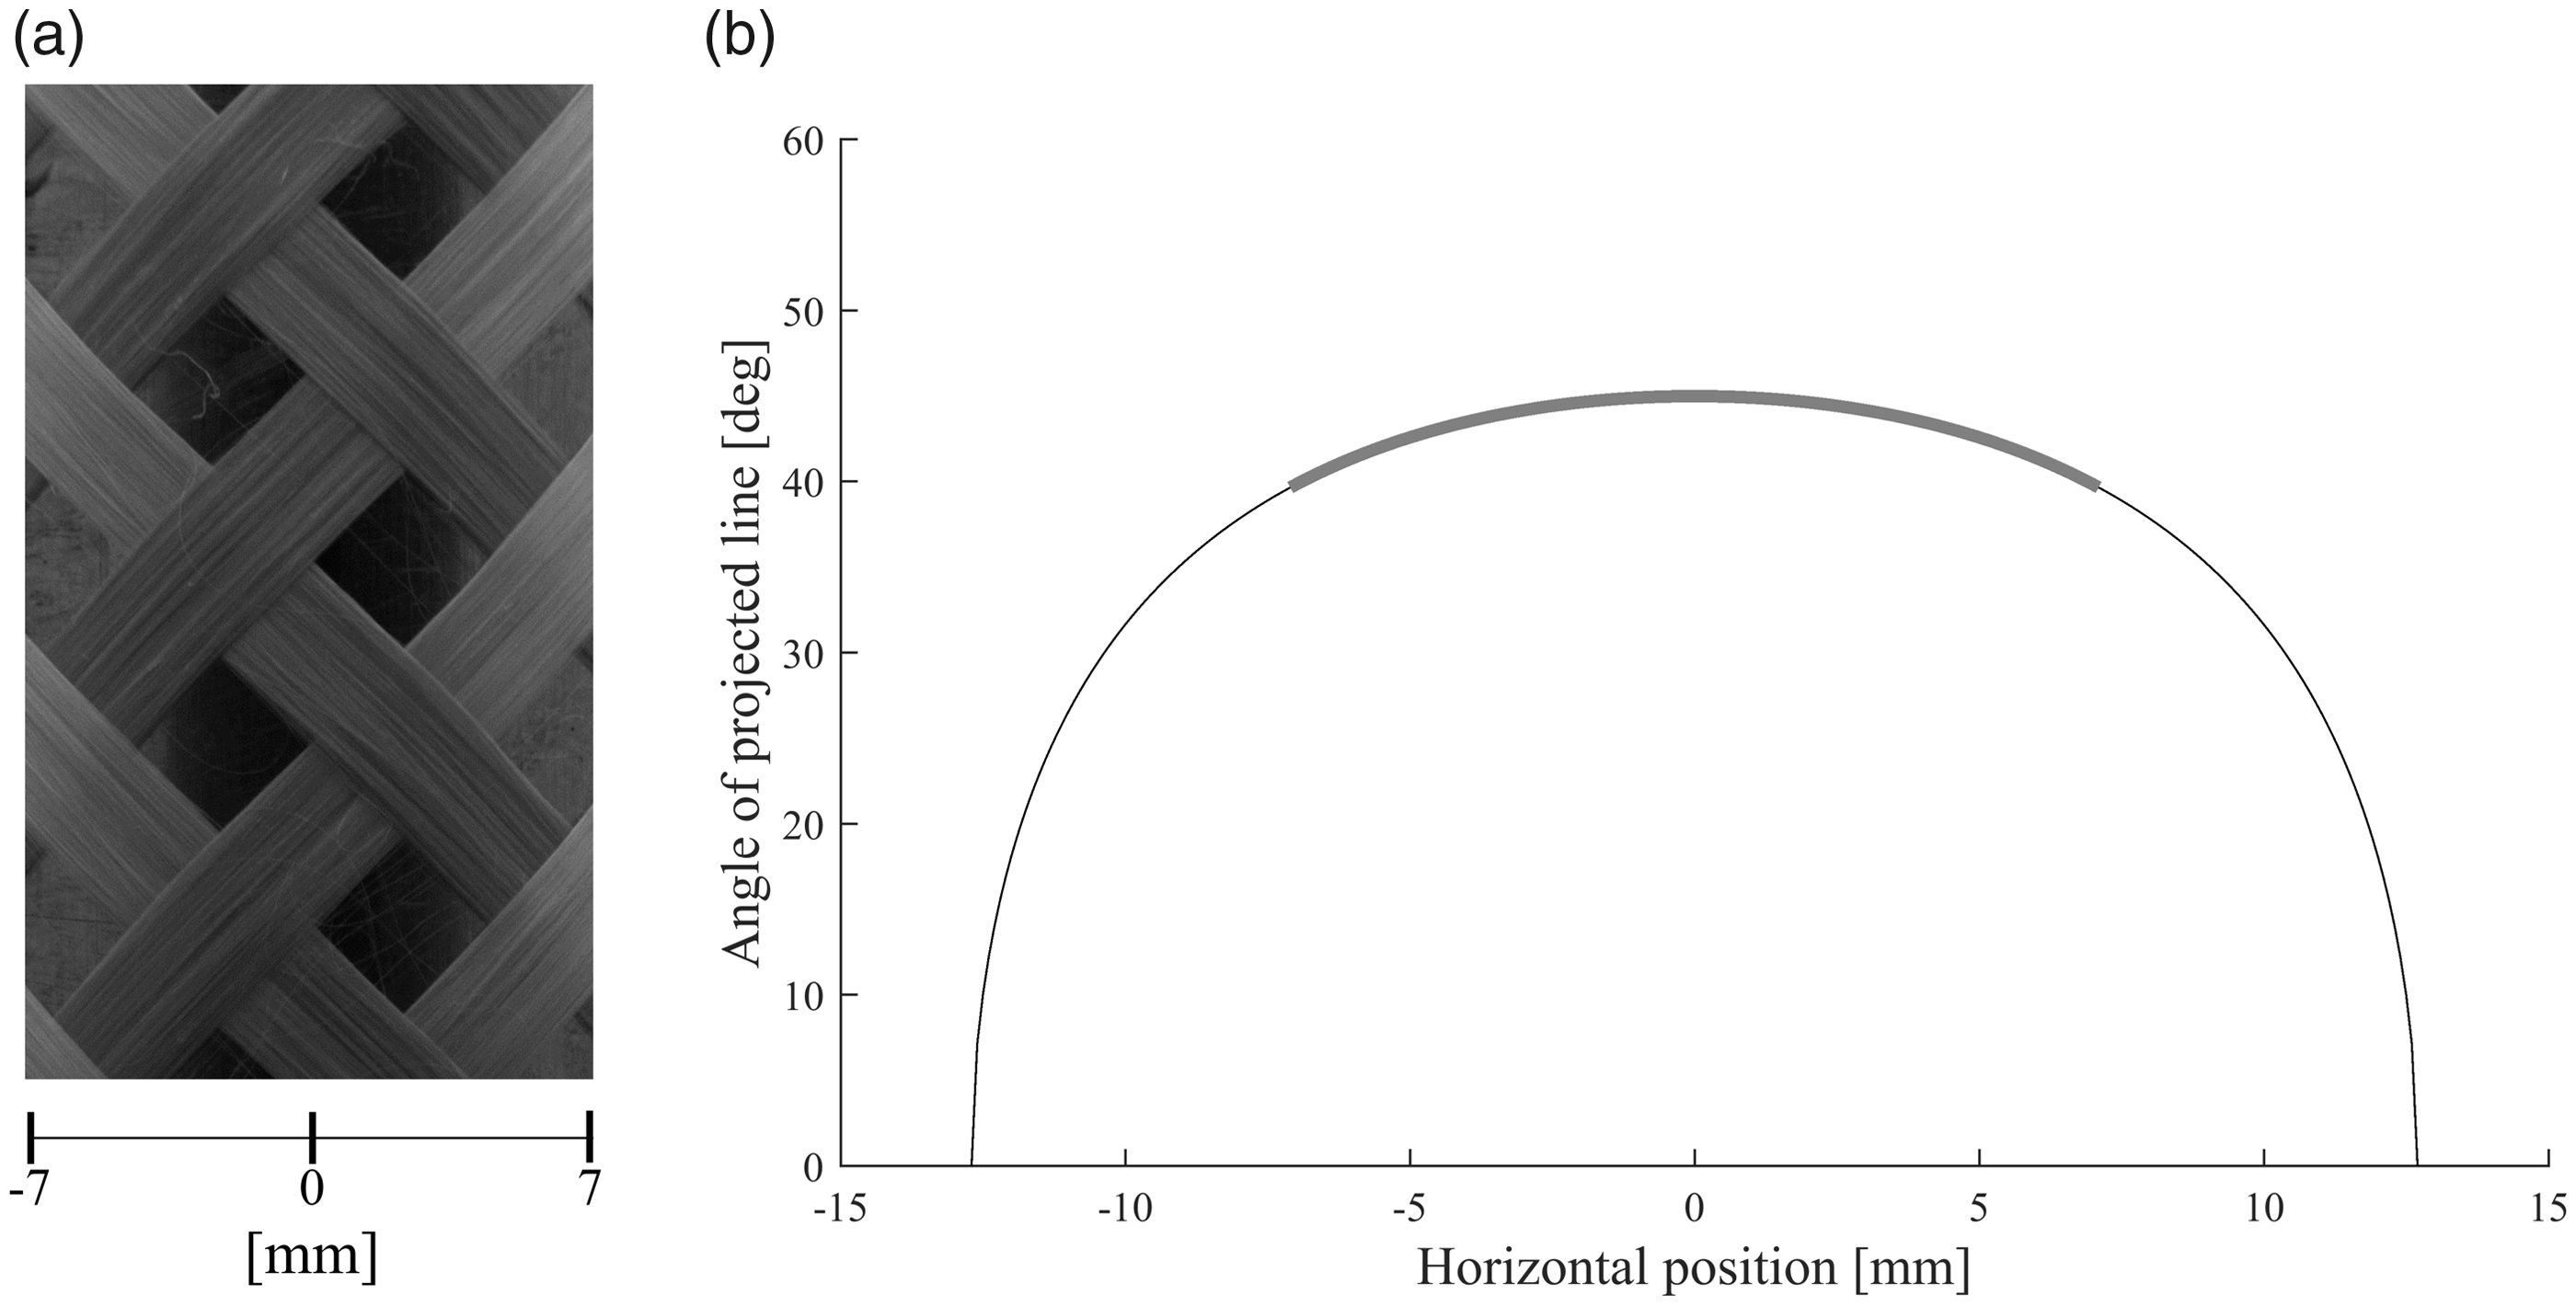
The second approach used to reduce perspective error was the orthographic projection of the tubular surface, which unwraps the surface features of the braid. Rather than removing the heavily distorted regions of the image, the surface can be unwrapped to compensate for the perspective error. To accomplish the image unwrapping, the geometric relations shown in Figure 10 were used, which relate the projected location of a point on the tubular surface, t, and its unwrapped point, x, to the radius of the tubular surface, r, and the circumferential angle, α.
Schematic of the tubular braid surface showing the relationship between the circumferential angle, α, the radius of the tubular surface, r, the projected distance of a point, t, and the unwrapped length of the arc segment, x.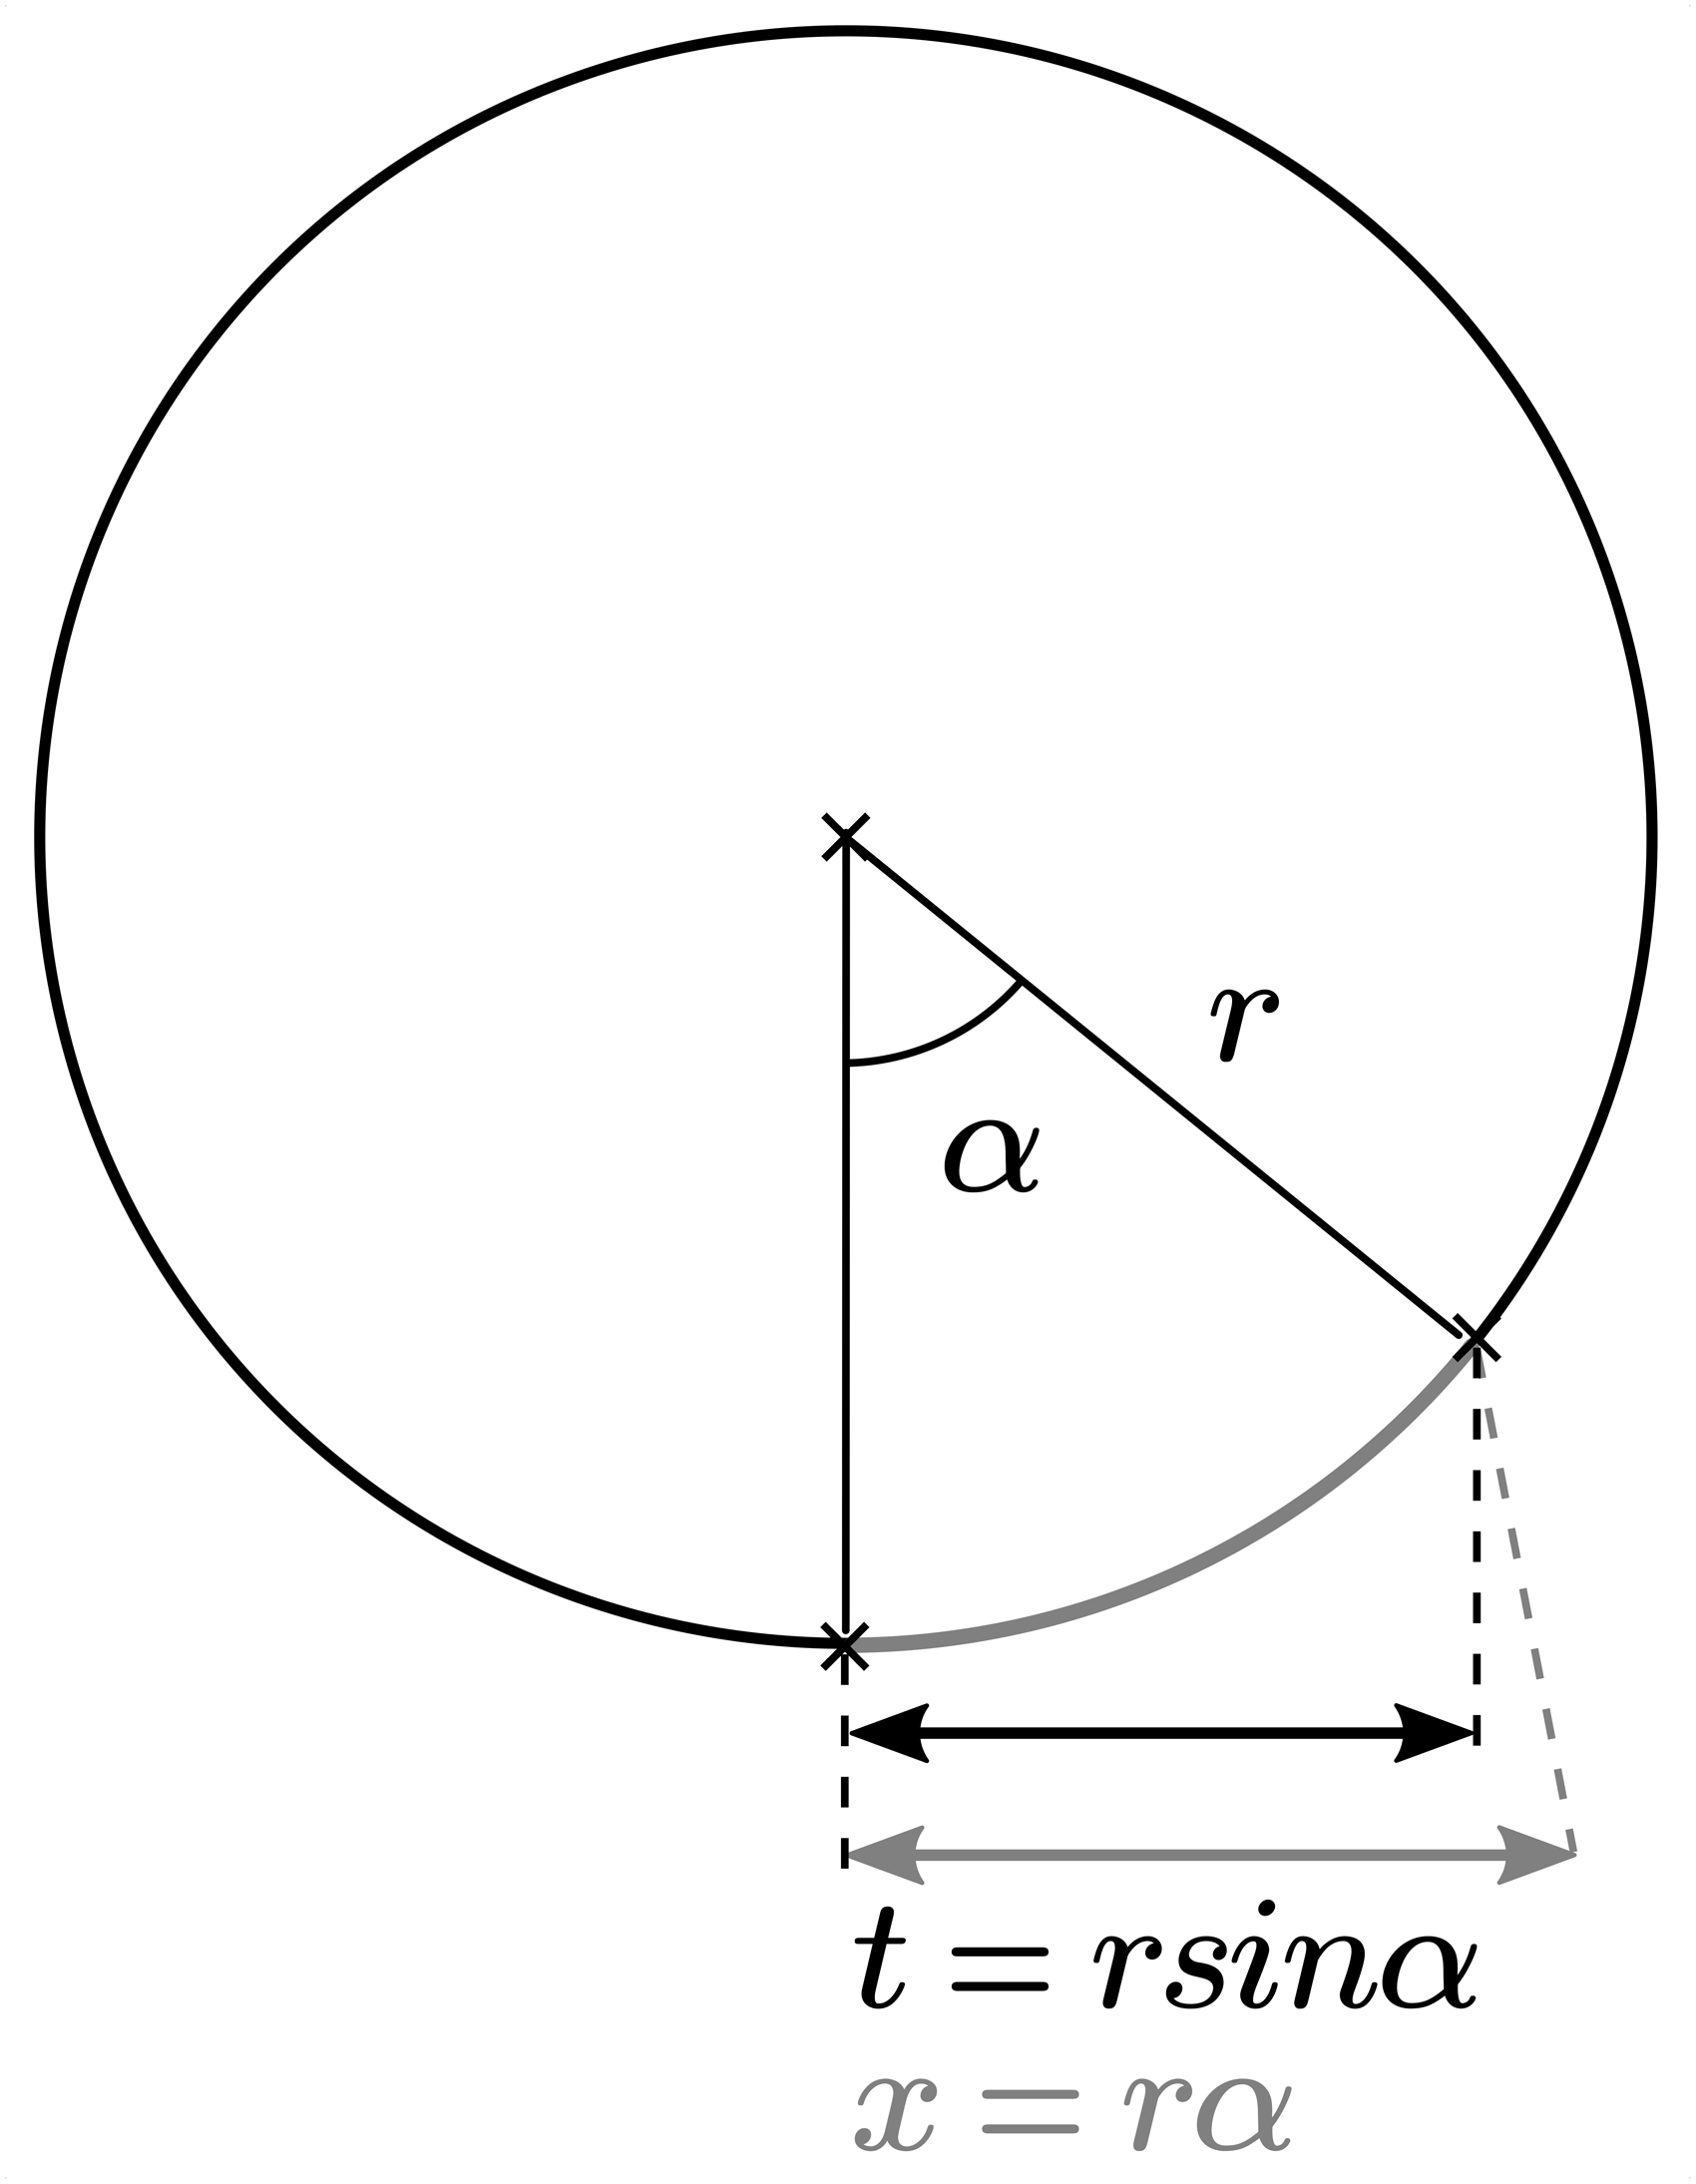
By comparing the distance between the projected position, t, and its corresponding unwrapped length, x, pixels are then displaced by the difference between the projected and unwrapped lengths. This process leaves empty regions in the image, which are interpolated linearly. This is computationally simple to implement and offers better frequency domain performance when compared to simpler techniques, such as nearest neighbor interpolation.
41
This unwrapping technique is shown in Figure 11, and the effectiveness can be seen through the straightening of the fibers in the unwrapped image.
Image pair showing the effect of the surface unwrapping through orthographic projection. The boxed region in (a) image is cropped and unwrapped to give the unwrapped image in (b).
The critical parameter in this method is the circumferential angle of the tubular surface, α, which dictates the amount of surface that is unwrapped. As this angle increases, a greater amount of data must be interpolated, leading to the smoothing of sharp edges in the image. This is shown in the boundaries of Figure 12, which have a reduced fiber detail and appear distorted from the interpolation process.
Braid image with a smoothed boundary caused by image data interpolation resulting from orthographic projection.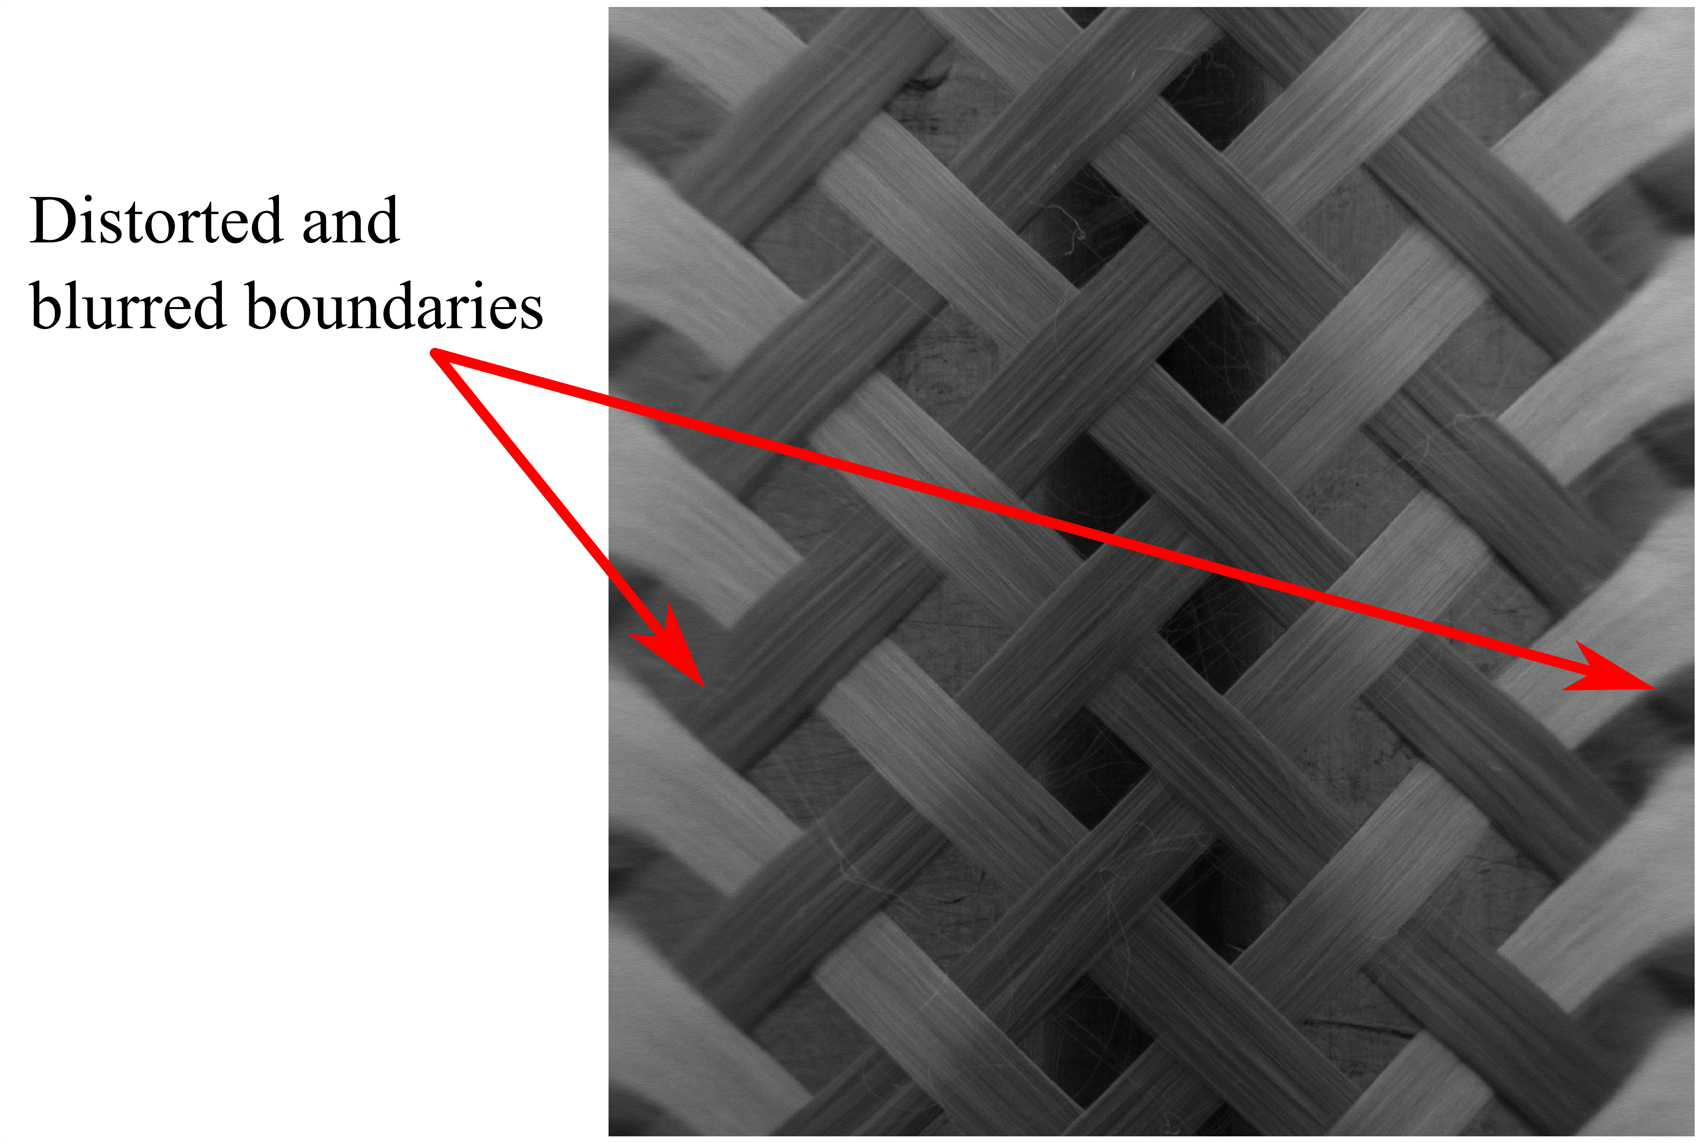
Results
Sensitivity of the data acquisition and the 2D-DFT measurement technique
To determine sensitivity of the 2D-DFT measurement technique, 15 repeat images of a stationary braided preform were collected and processed. The collected images had a bit depth of 8 bits. Camera position, sample position, and lighting were kept constant; however, an average difference of 1.7-pixel values was reported between images. The measurement algorithm was applied to these images and the results are shown in Figure 13. Fluctuations in the measurement were reported as a result of camera noise and demonstrate the sensitivity of this measurement technique. Previous works, which have used the frequency domain measurement technique for composite applications, do not explore the sensitivity of the technique.30,31 In this work, these results are used to both support its use and to explore the limitations of this technique.
Braid angle measurement for repeat images of the same region of interest. The dashed lines indicate a ±1° band surrounding the mean associated with the uncertainty of past measurement methods.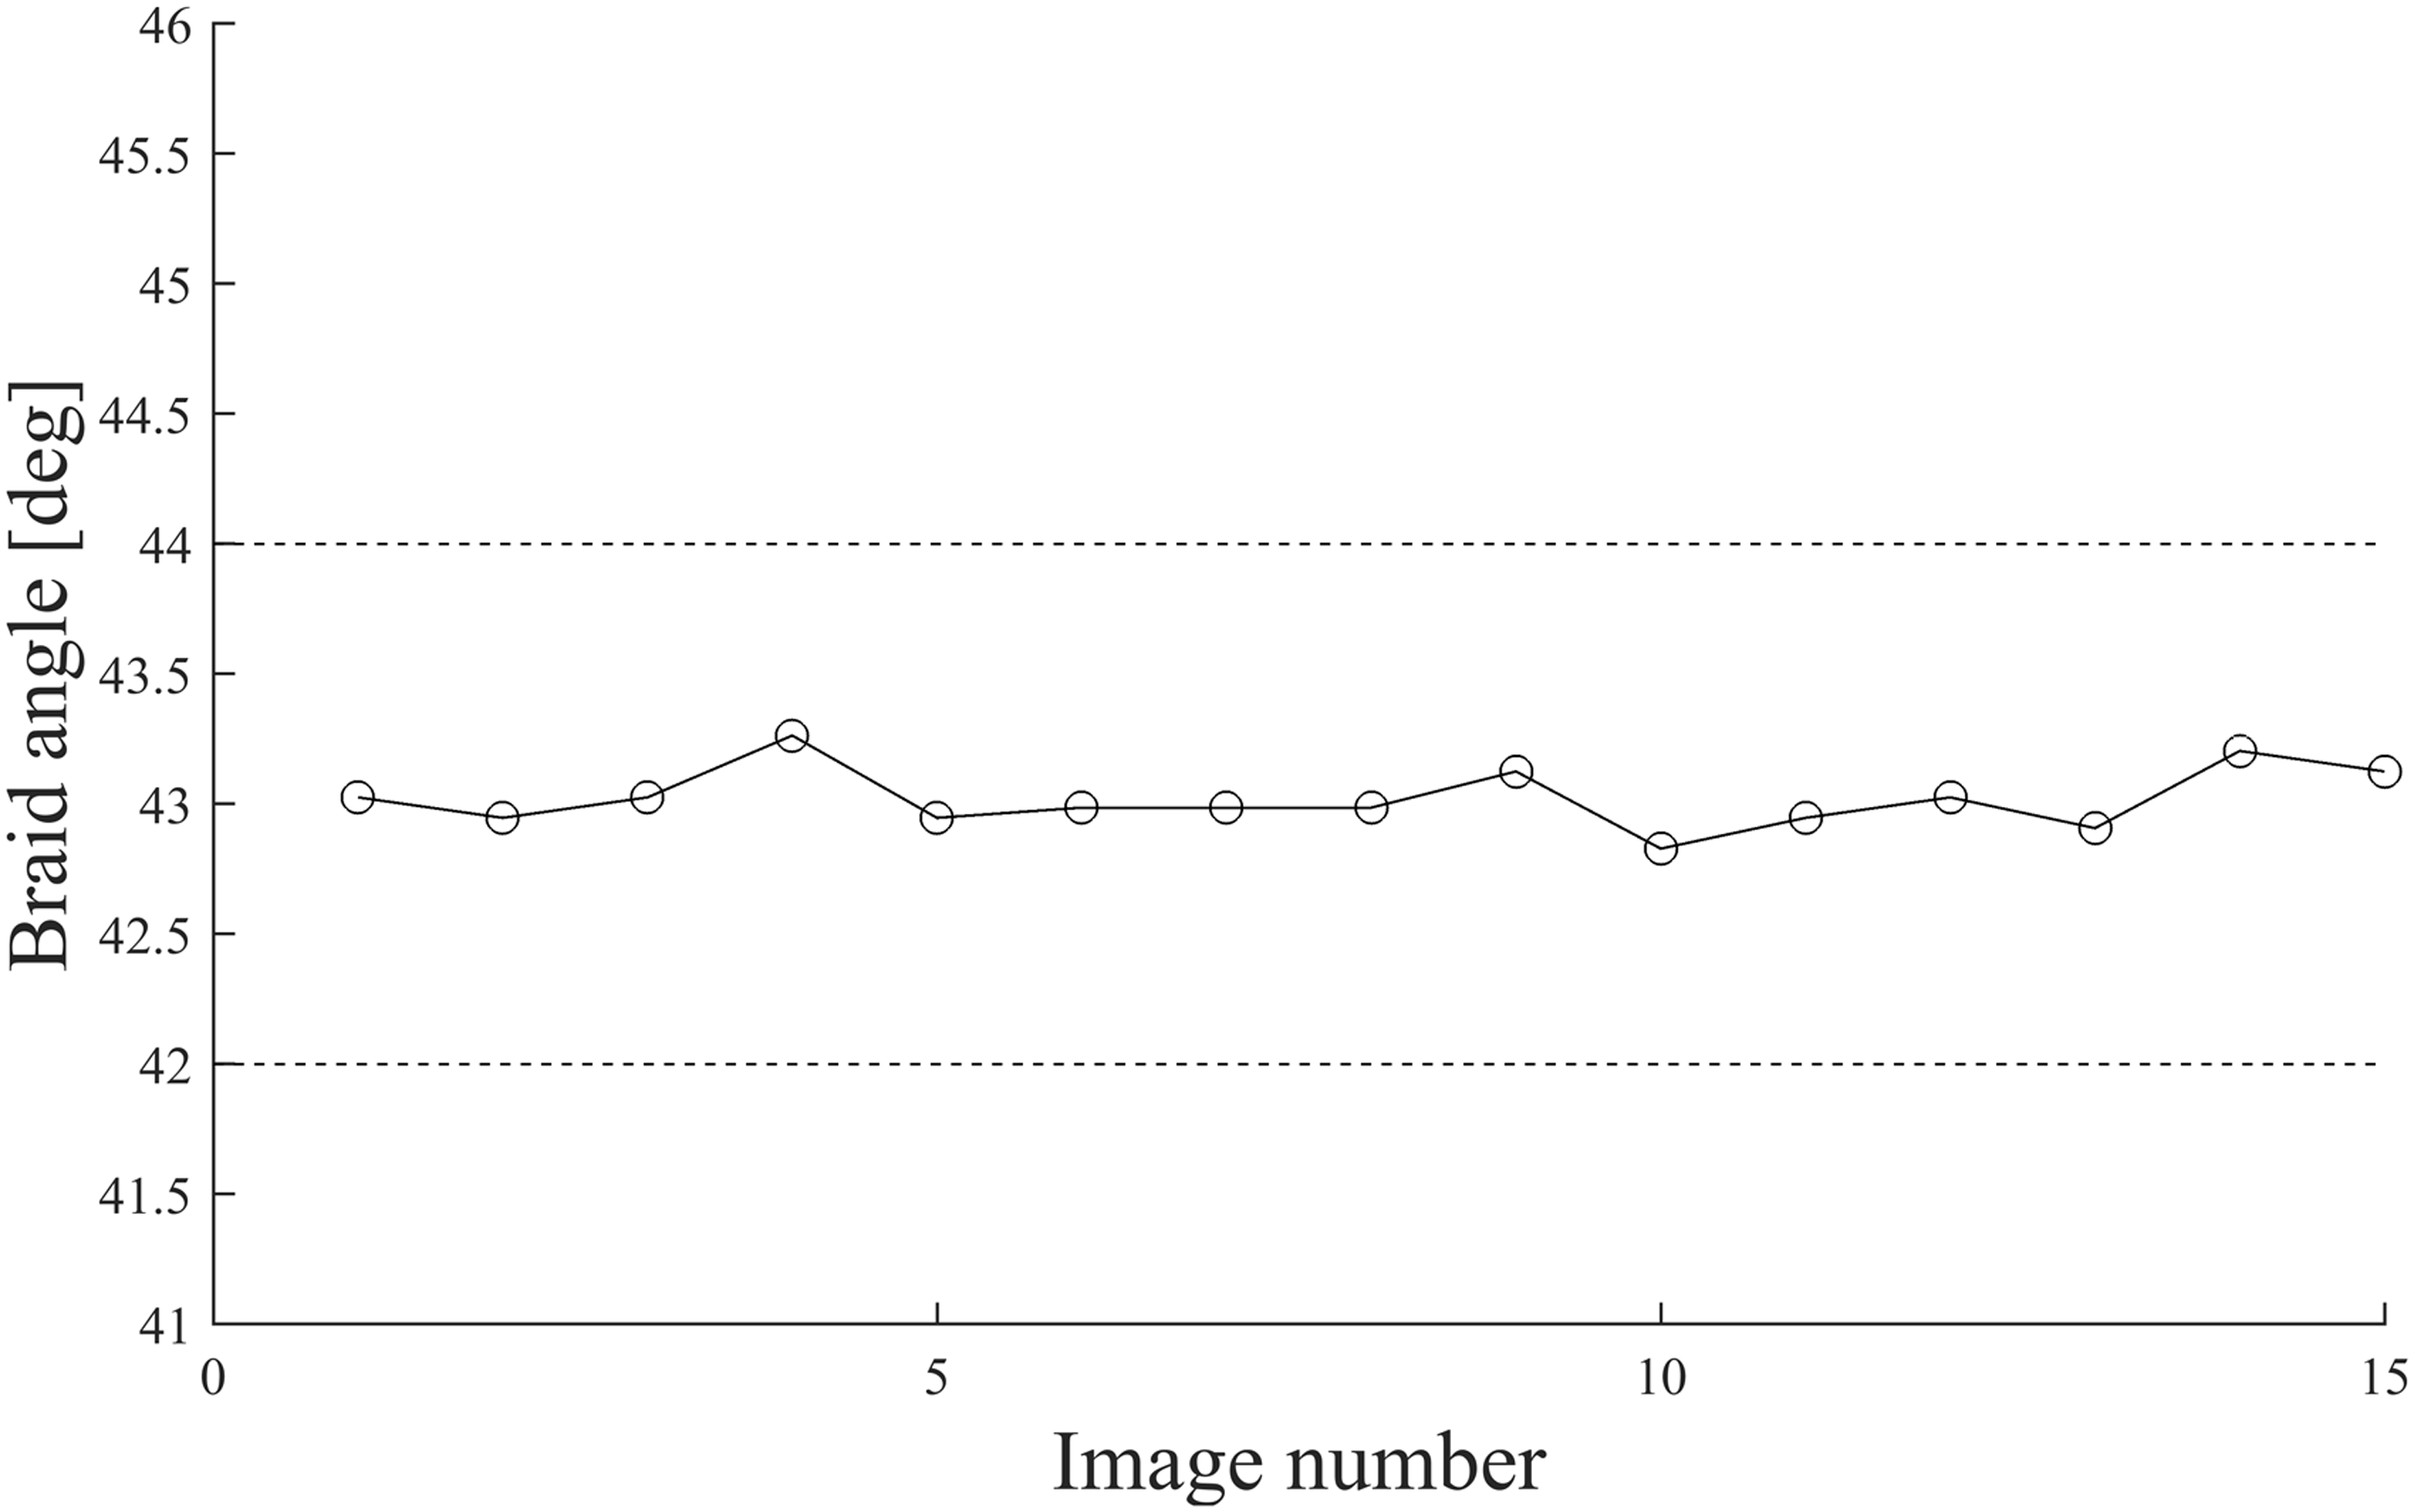
Static braid angle measurements
Machine vision braid angle measurements
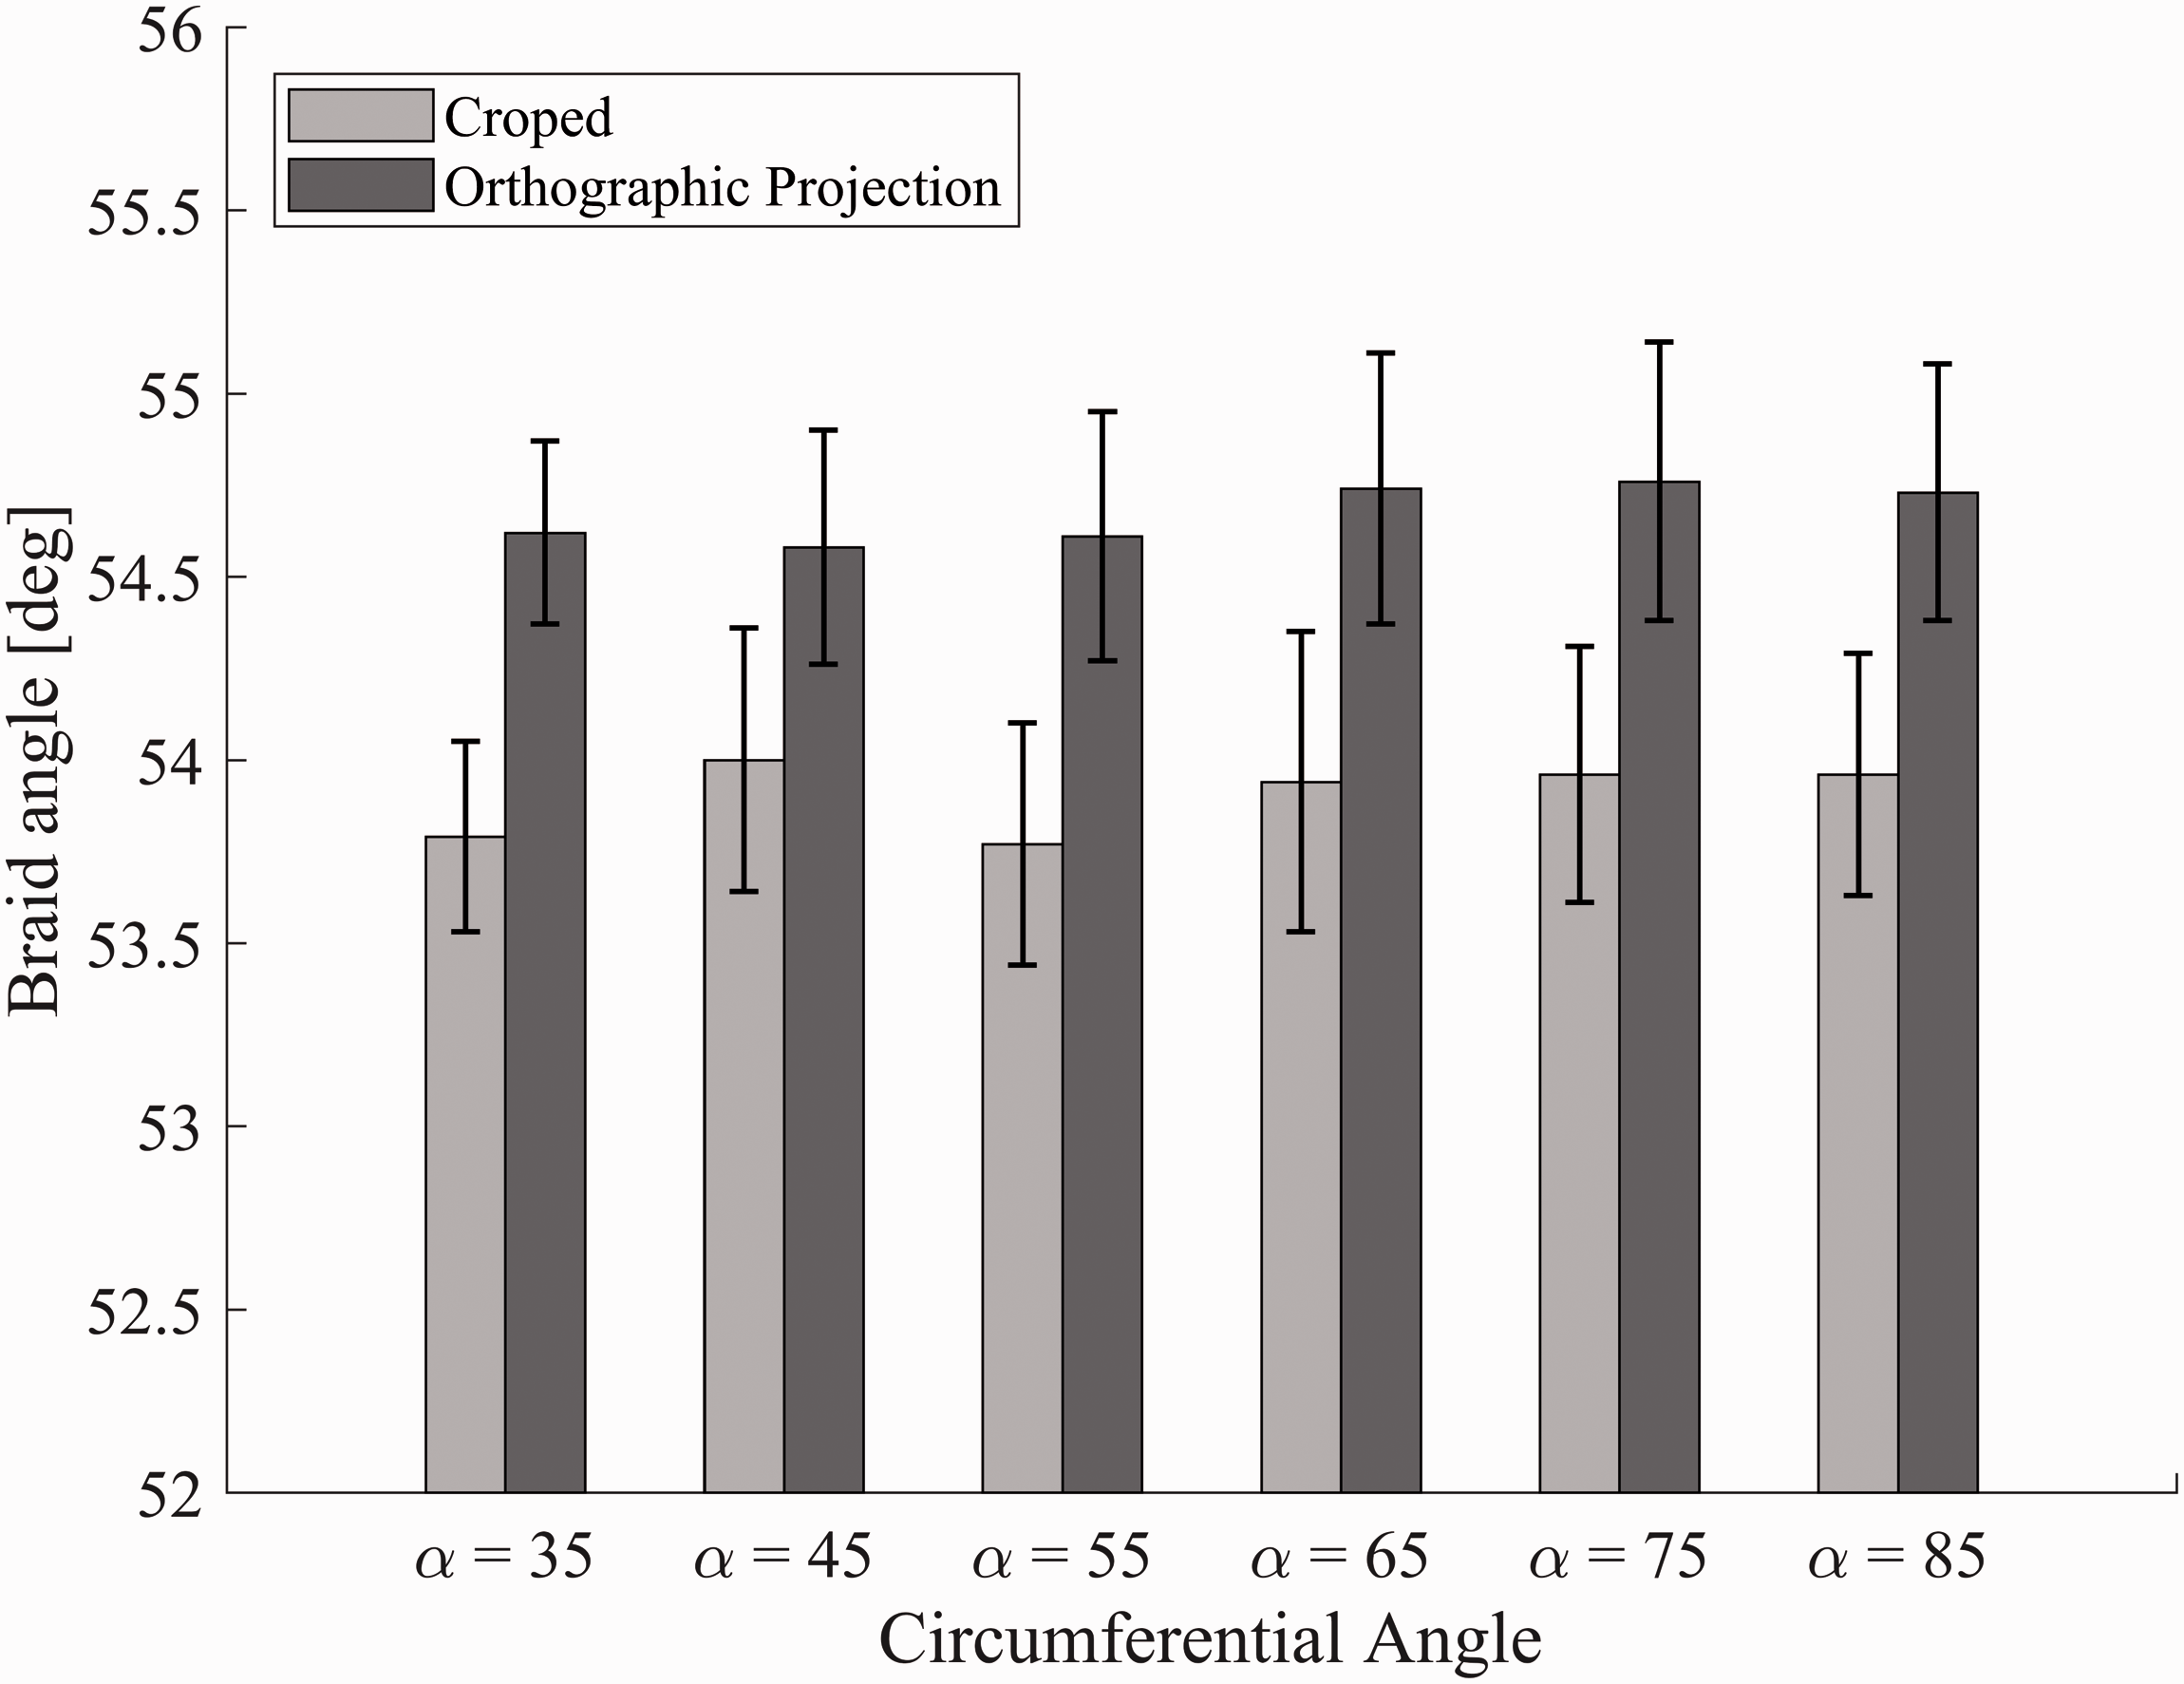
The cropping and unwrapping processes shown in Figure 11 were tested on images collected of static braid samples with braid angles of 30°, 45°, and 55° degrees. Results for both the cropped and orthographically projected images are given in Figures 14–16, for each of the three braid angles, respectively, as a function of the circumferential angle, α. The figures list the average machine vision braid angle measurements and the standard error from the four measurements taken of each sample.
Plot comparing the cropped and orthographically projected images for a 30° braid angle.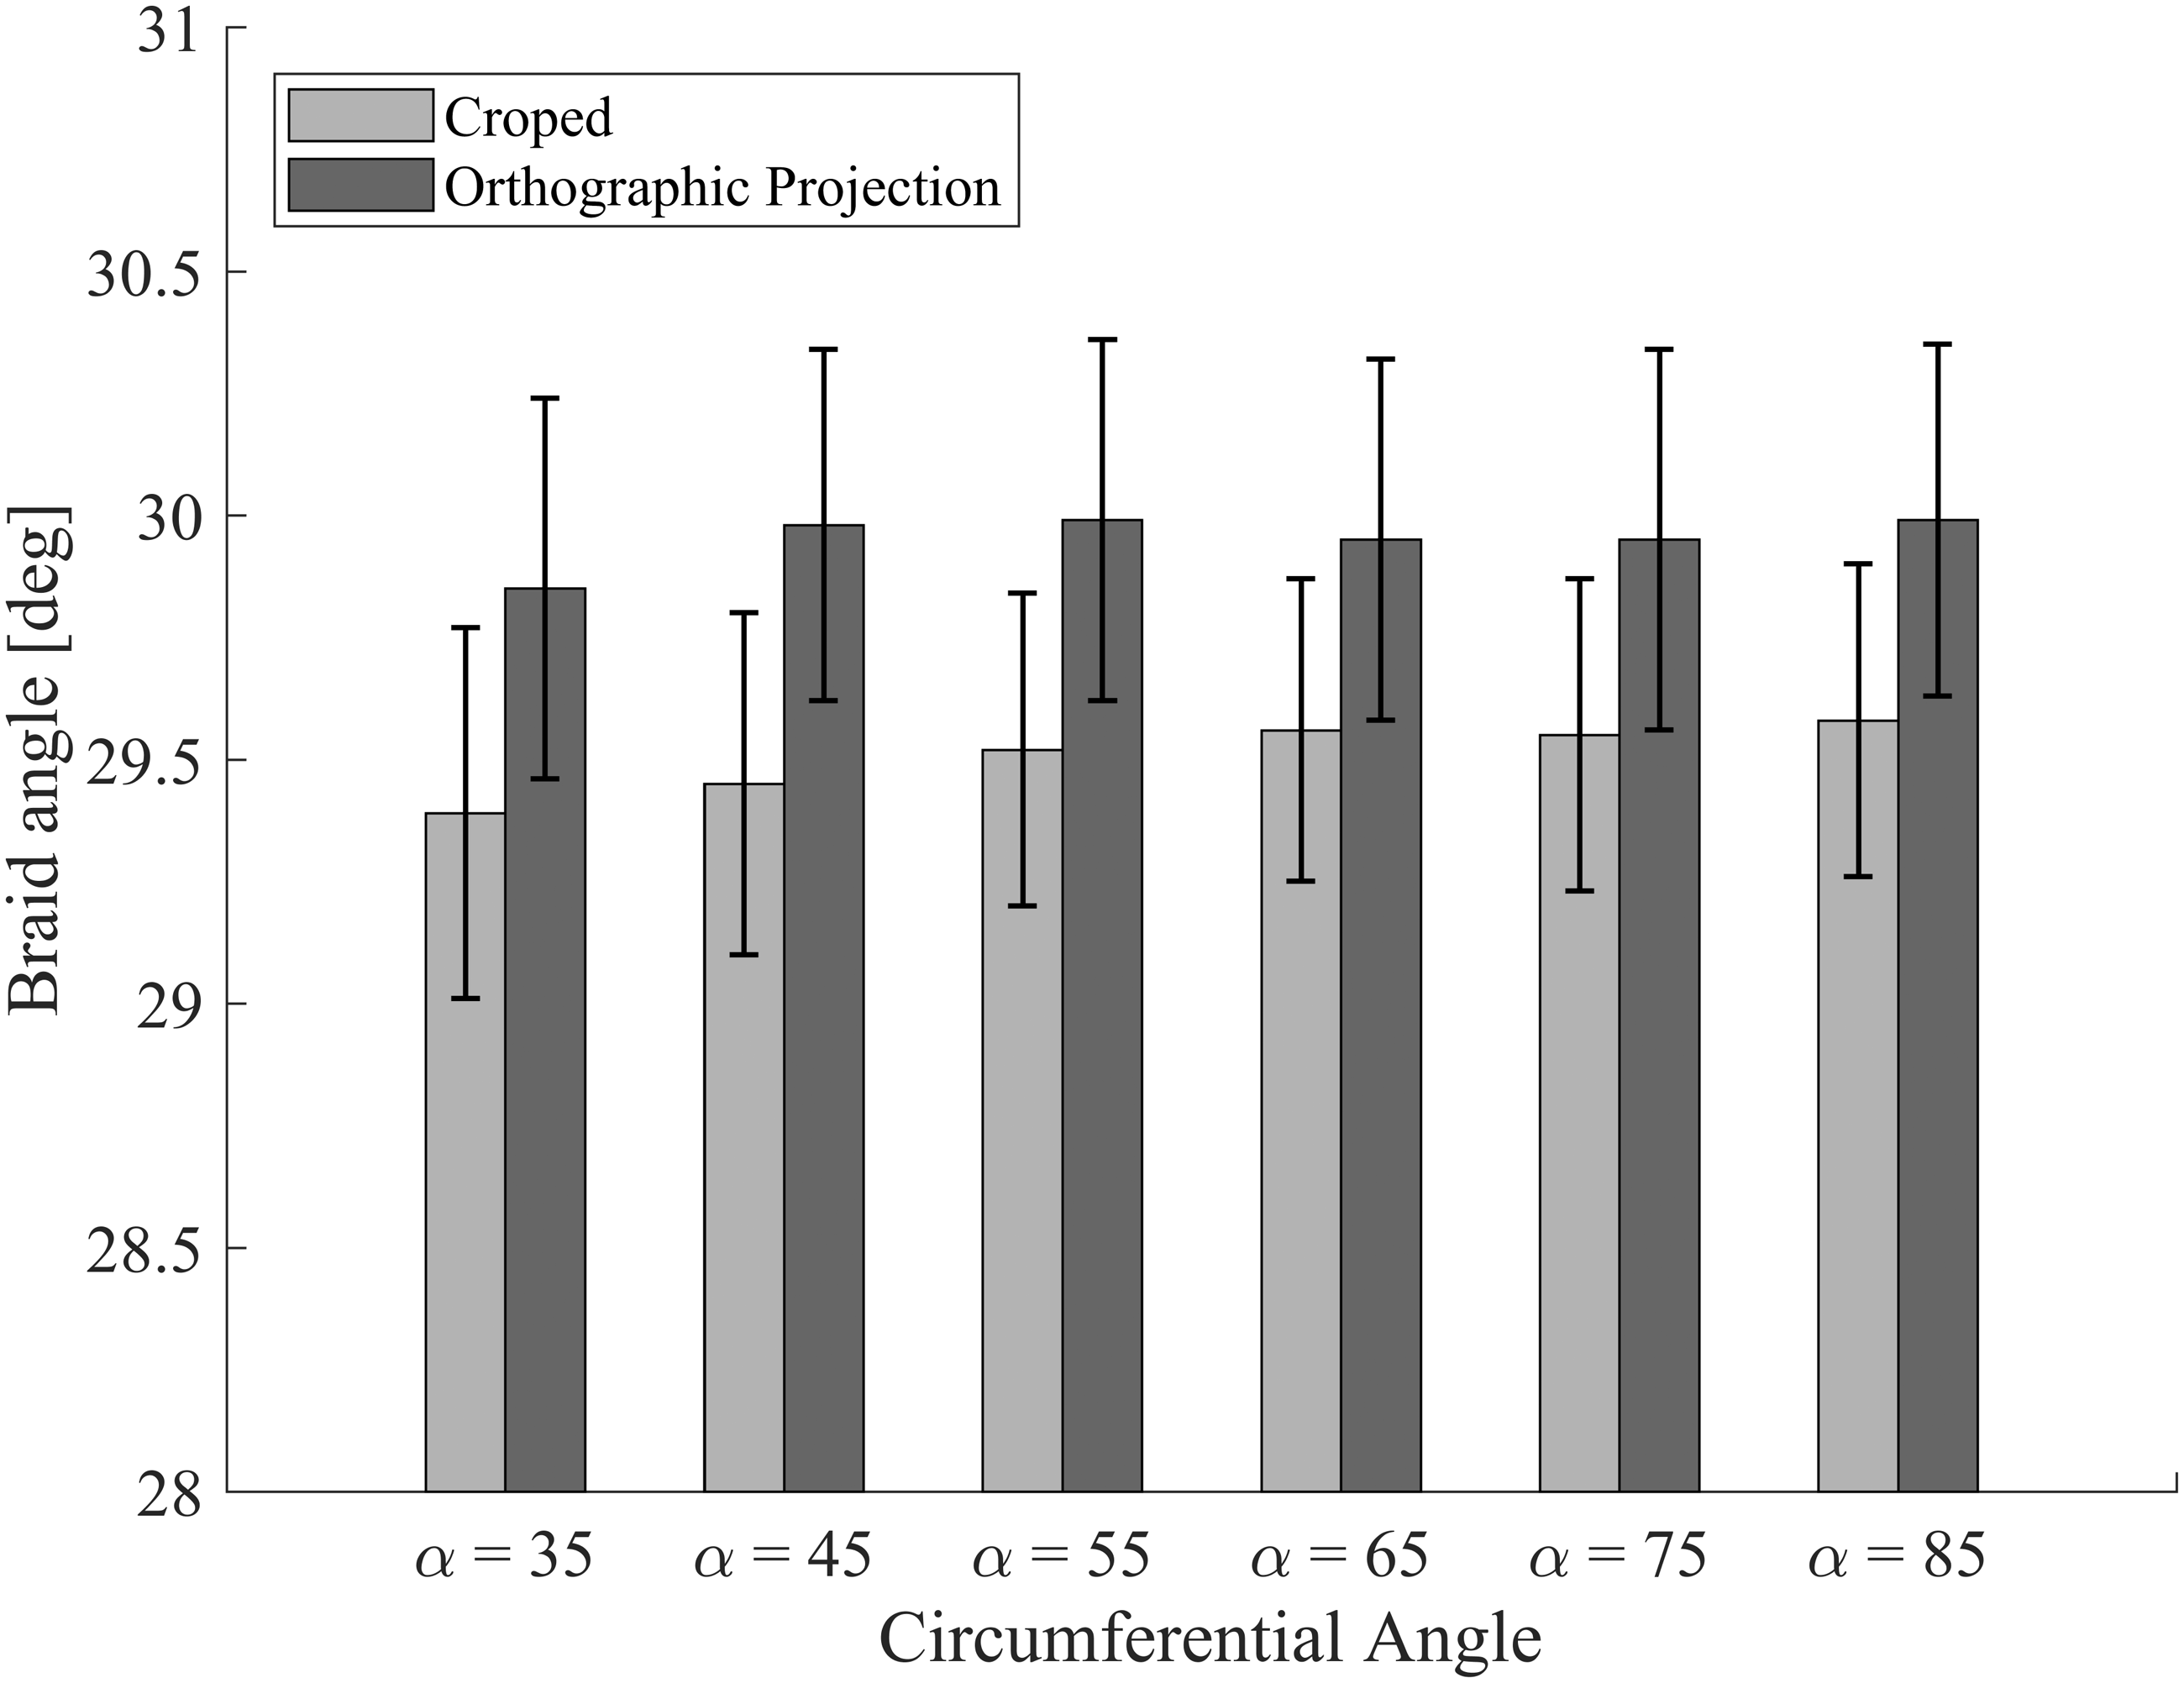
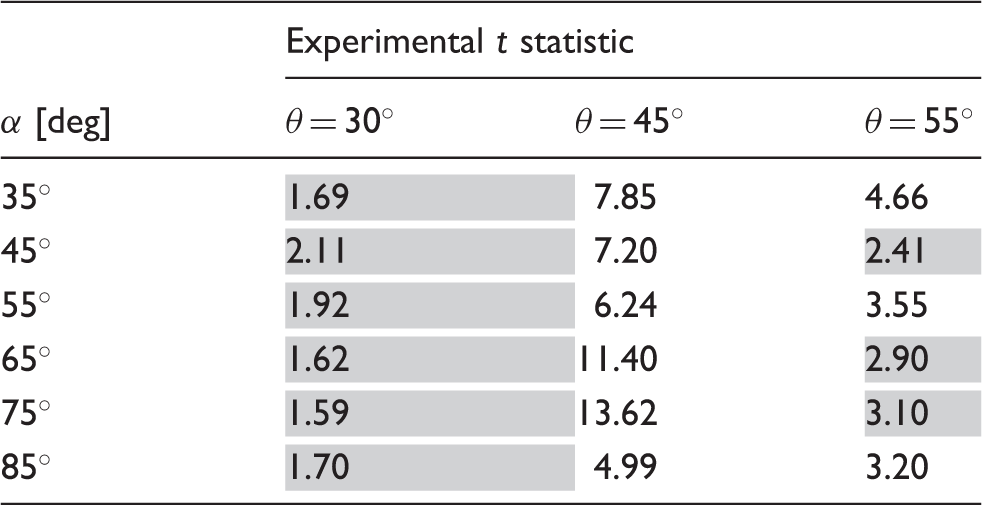
Calculated t statistics comparing the cropped image measurements against the orthographic projection measurements for each braid angle and circumferential angle; gray cells represent statistical insignificance
Frequency spectrum
The effect of the orthographic projection technique is apparent in the frequency spectrum and can be seen when comparing the angular intensity distributions from the cropped and uncropped images. This is shown for a sample with a braid angle of 45° in Figure 17. When comparing the two distributions, the spectrum obtained from the orthographic projection shows a significant reduction of features oriented between 0 and ±45° when compared to the cropped image, obtained from the circumferential angle, α = 35°. This is a result of the straightening of the fibers from the unwrapping process.
Plot comparing the cropped and orthographically projected images for a 45°braid angle. Plot comparing the cropped and orthographically projected images for a 55° braid angle. Angular intensity spectrum comparing the frequency spectrums of a cropped braid region and an unwrapped image.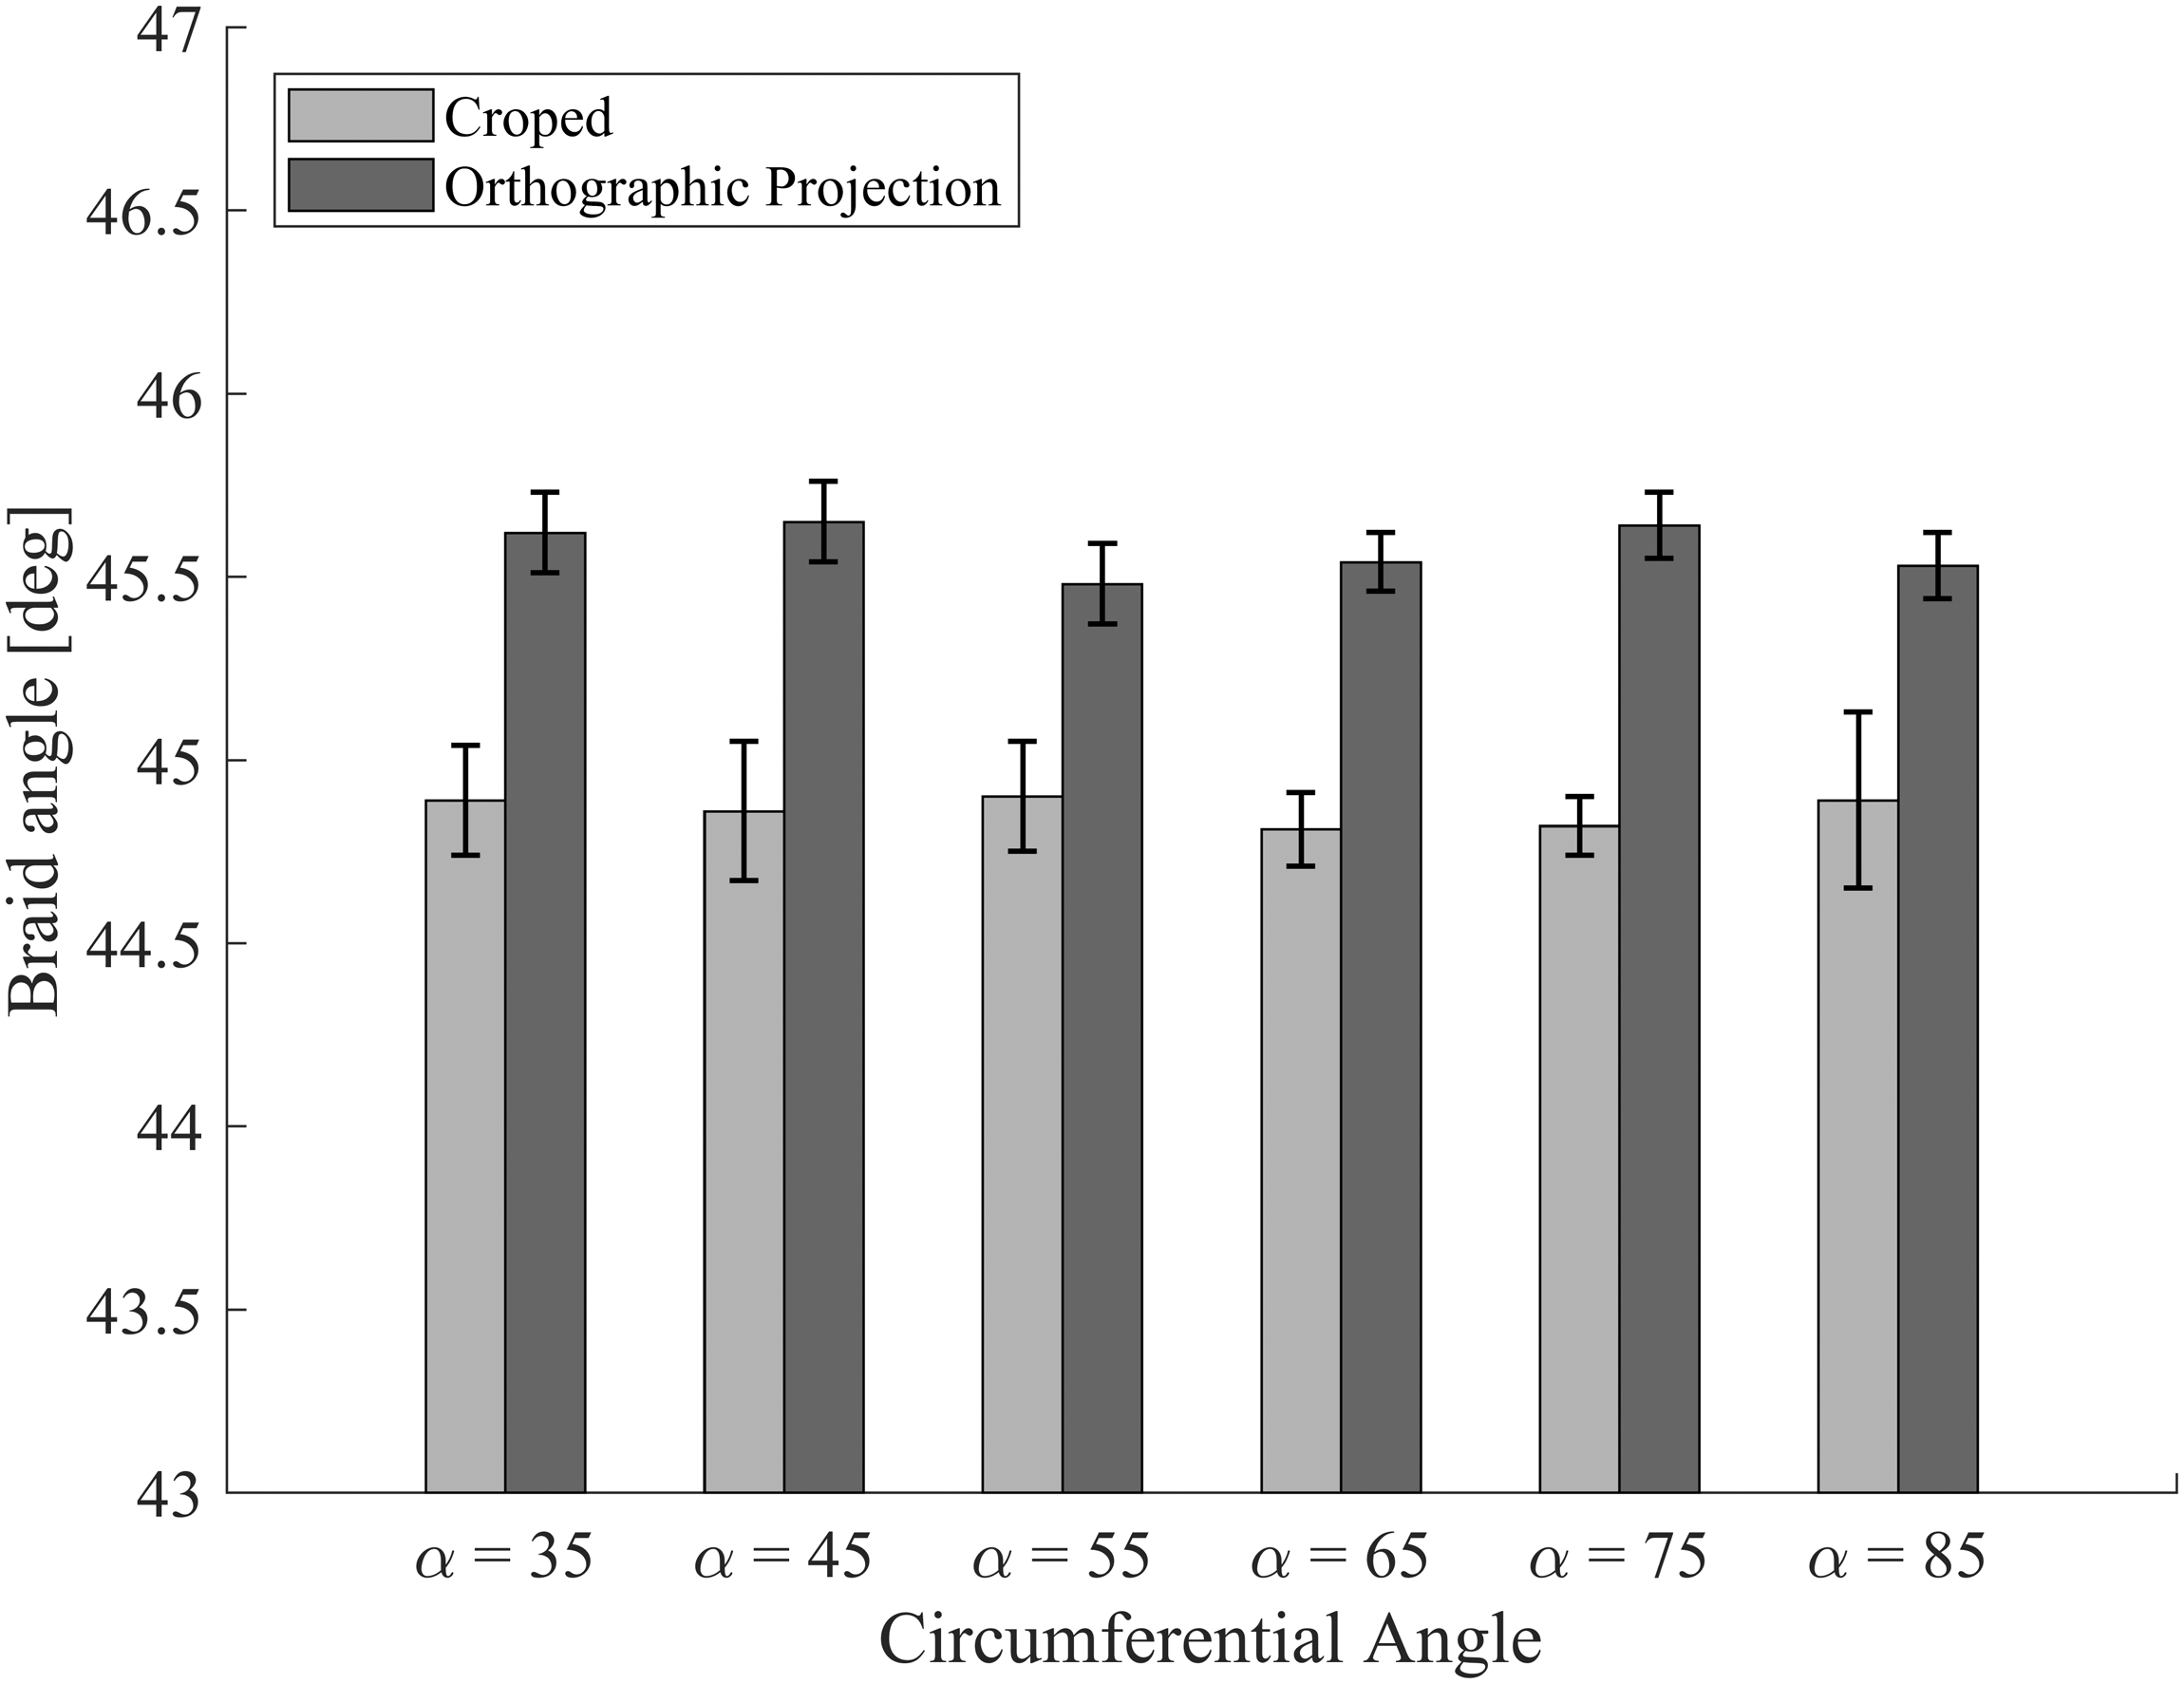

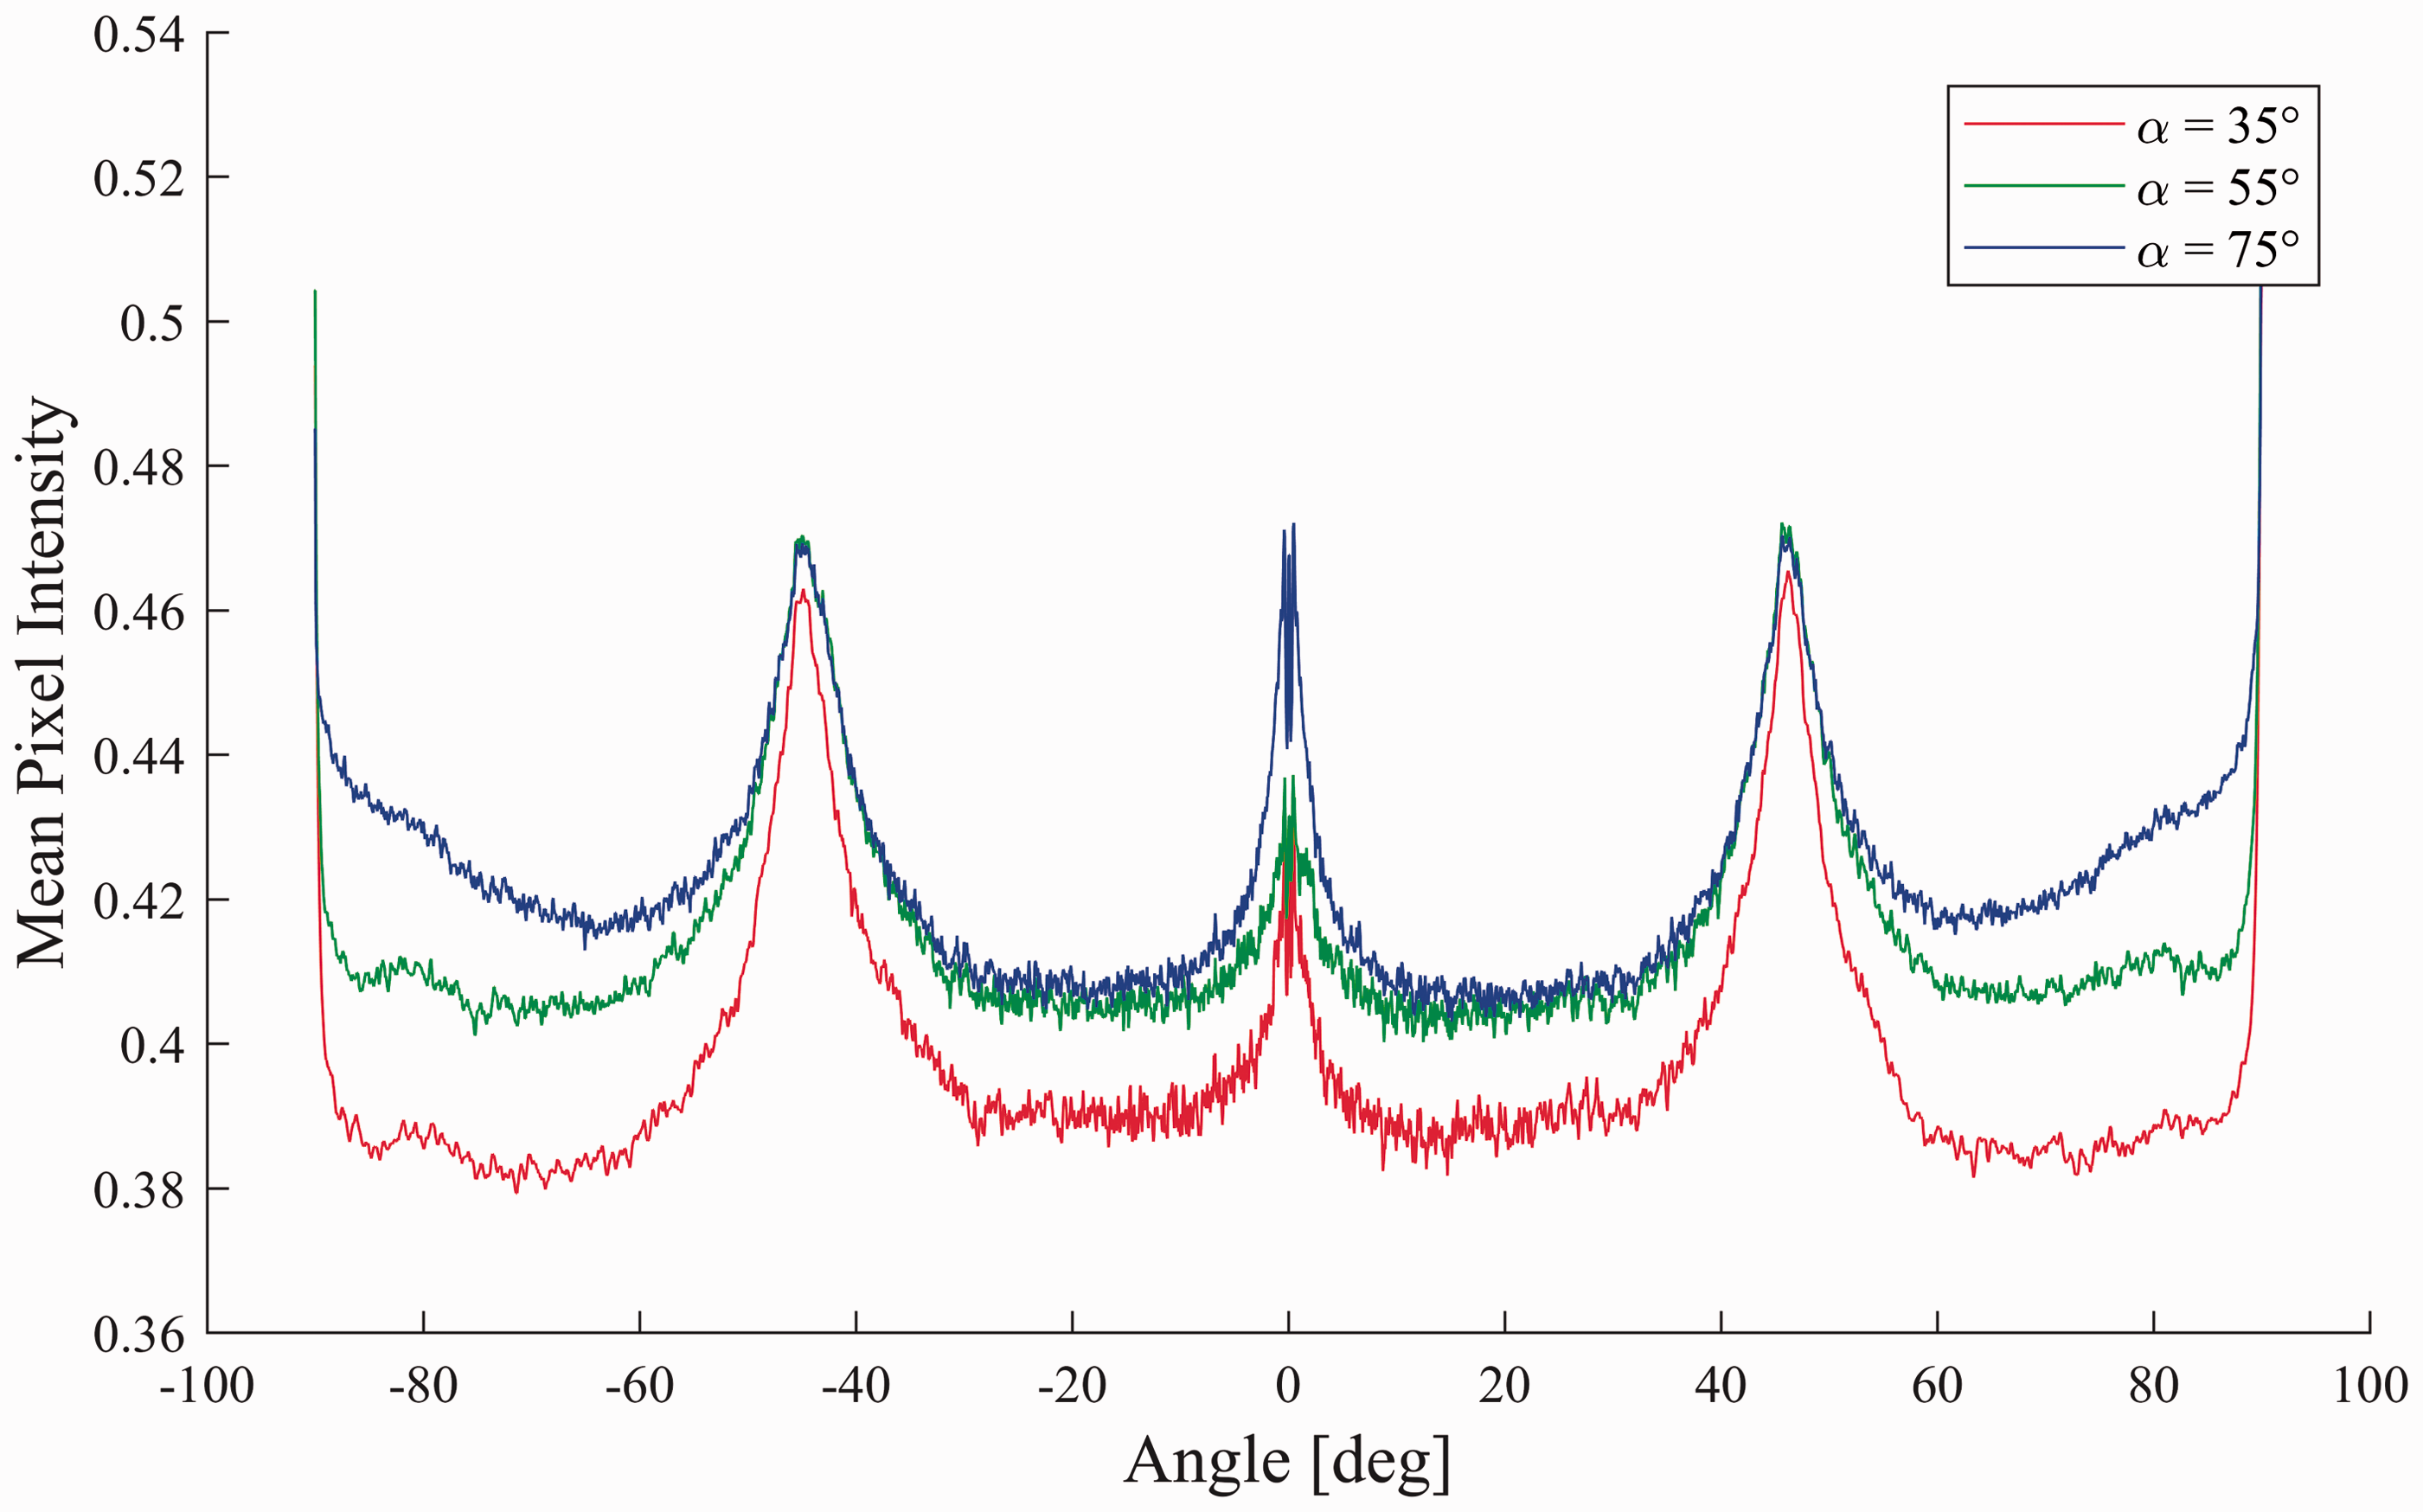
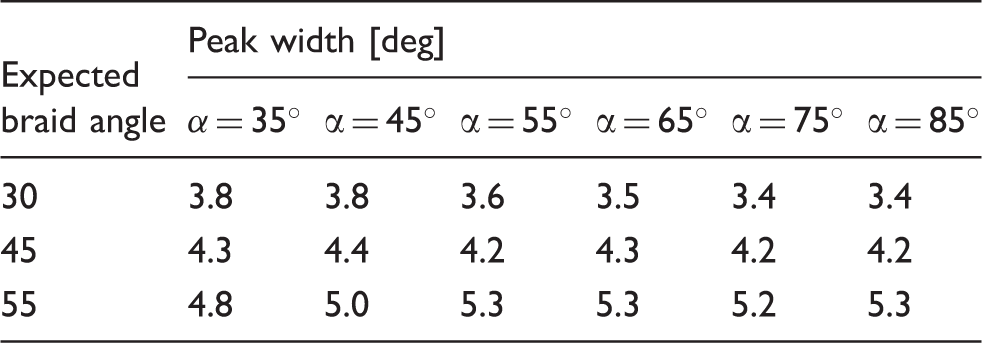
The machine vision measurements, shown in Figures 14–16, were not significantly affected by changing the circumferential angle, α. Although this factor may not affect the braid angle identified by the algorithm, it does influence the frequency spectrum. The angular intensity distributions shown in Figures 18 and 19 demonstrate the effect of α on the raw and unwrapped images. For the raw image results (Figure 18), a larger value of Angular intensity distribution plot showing the effect of the crop amount, α, on the frequency spectrum of the raw images. Angular intensity distribution plot showing the effect of the crop amount, α, on the frequency spectrum of the unwrapped images.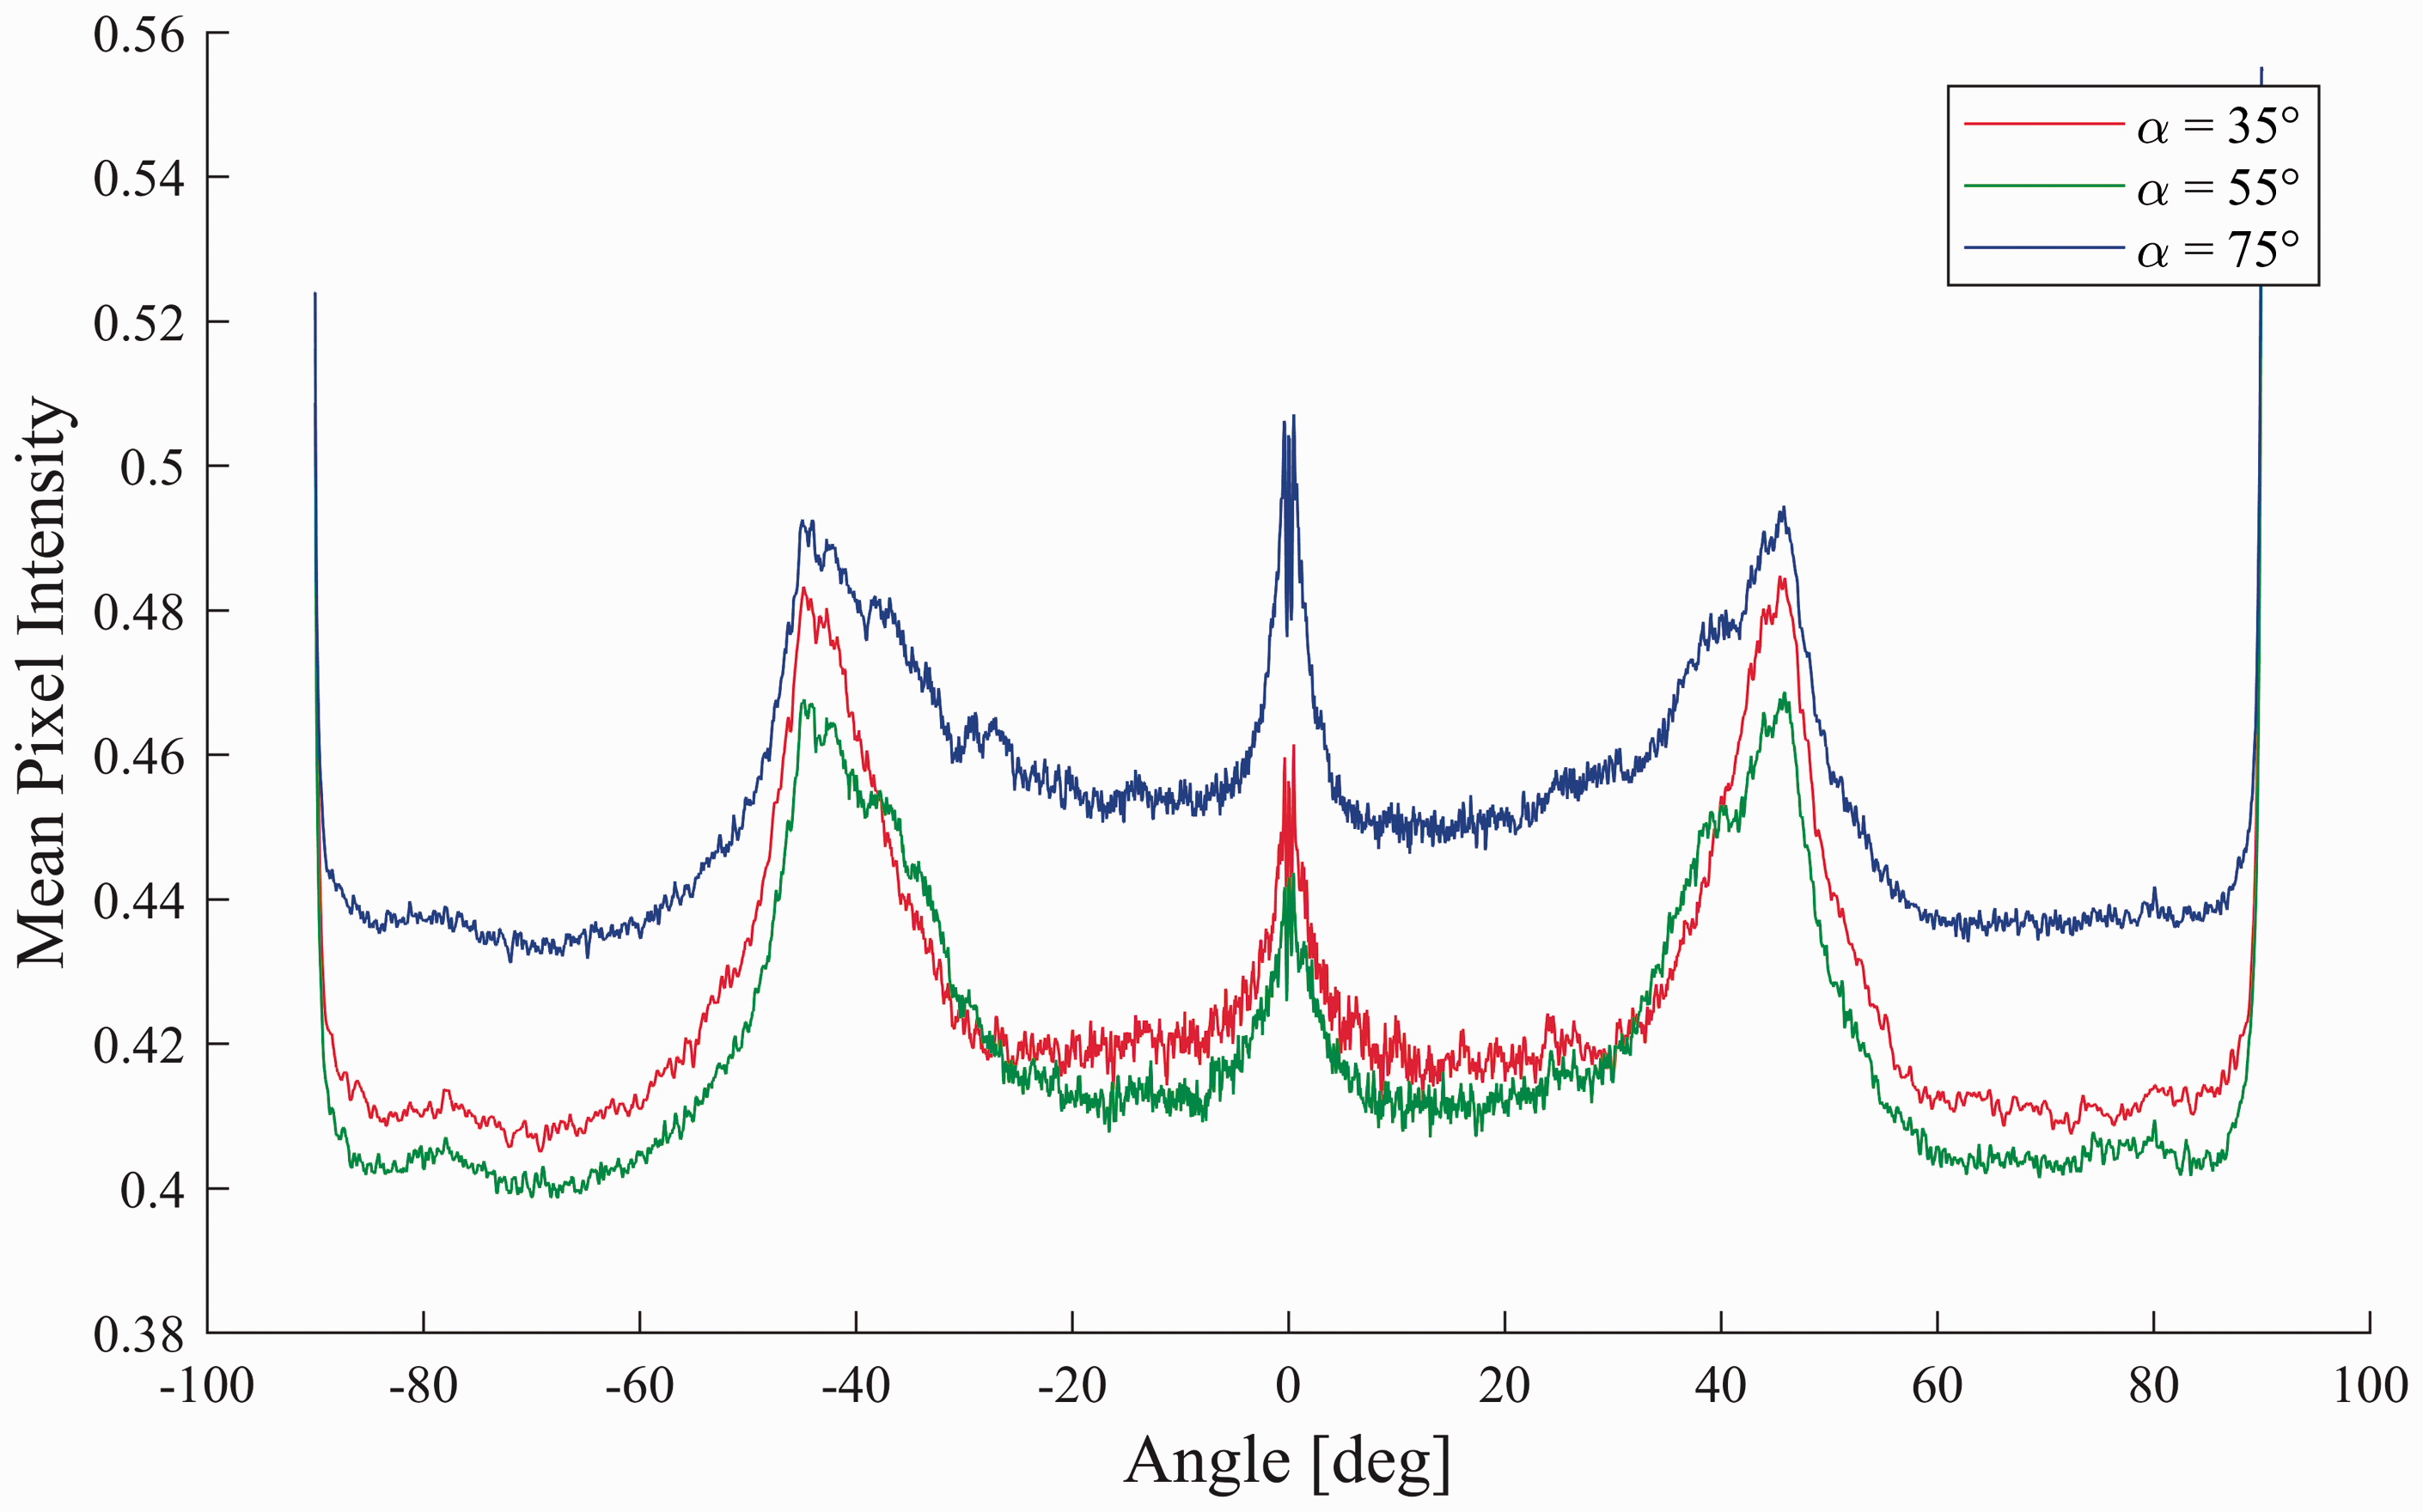
Angular intensity distribution peak width values for raw images for varying regions of interest defined by the circumferential angle, α

Angular intensity distribution peak width values for unwrapped images for varying regions of interest defined by the circumferential angle, α
Dynamic braid measurements
Constant braid angle
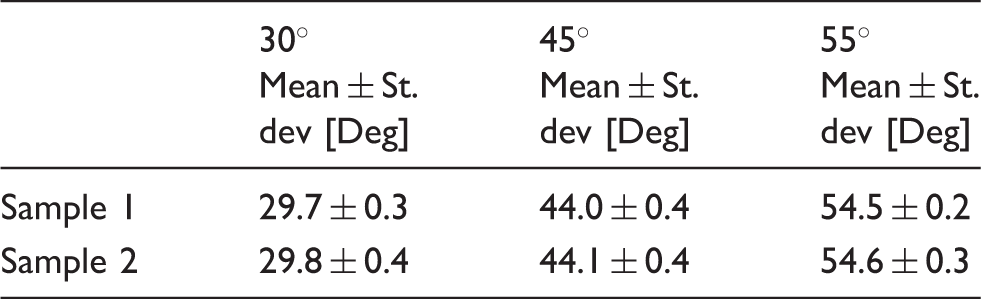
The real-time performance of the machine vision system was first done with the production of constant braid angle samples. Two samples for each braid angle were measured, each of which was between 600 and 1000 mm in length. A plot of the braid angle as a function of mandrel position is shown in Figure 20 for a preform with a braid angle of 30°, which shows that the measurements fall within ± 1° of the measured mean; however, significant measurement fluctuation was observed. The mean and standard deviation for all measurements in each dataset are given in Table 5.
Braid angle plot for a braided preform with a 30° braid angle. The dashed lines indicate ± 1° band surrounding the mean associated with the uncertainty of past measurement methods. Steady-state real-time braid angle measurement results for each of the three braid geometries. Mean and standard deviation values are given in degrees
Transient braid angle
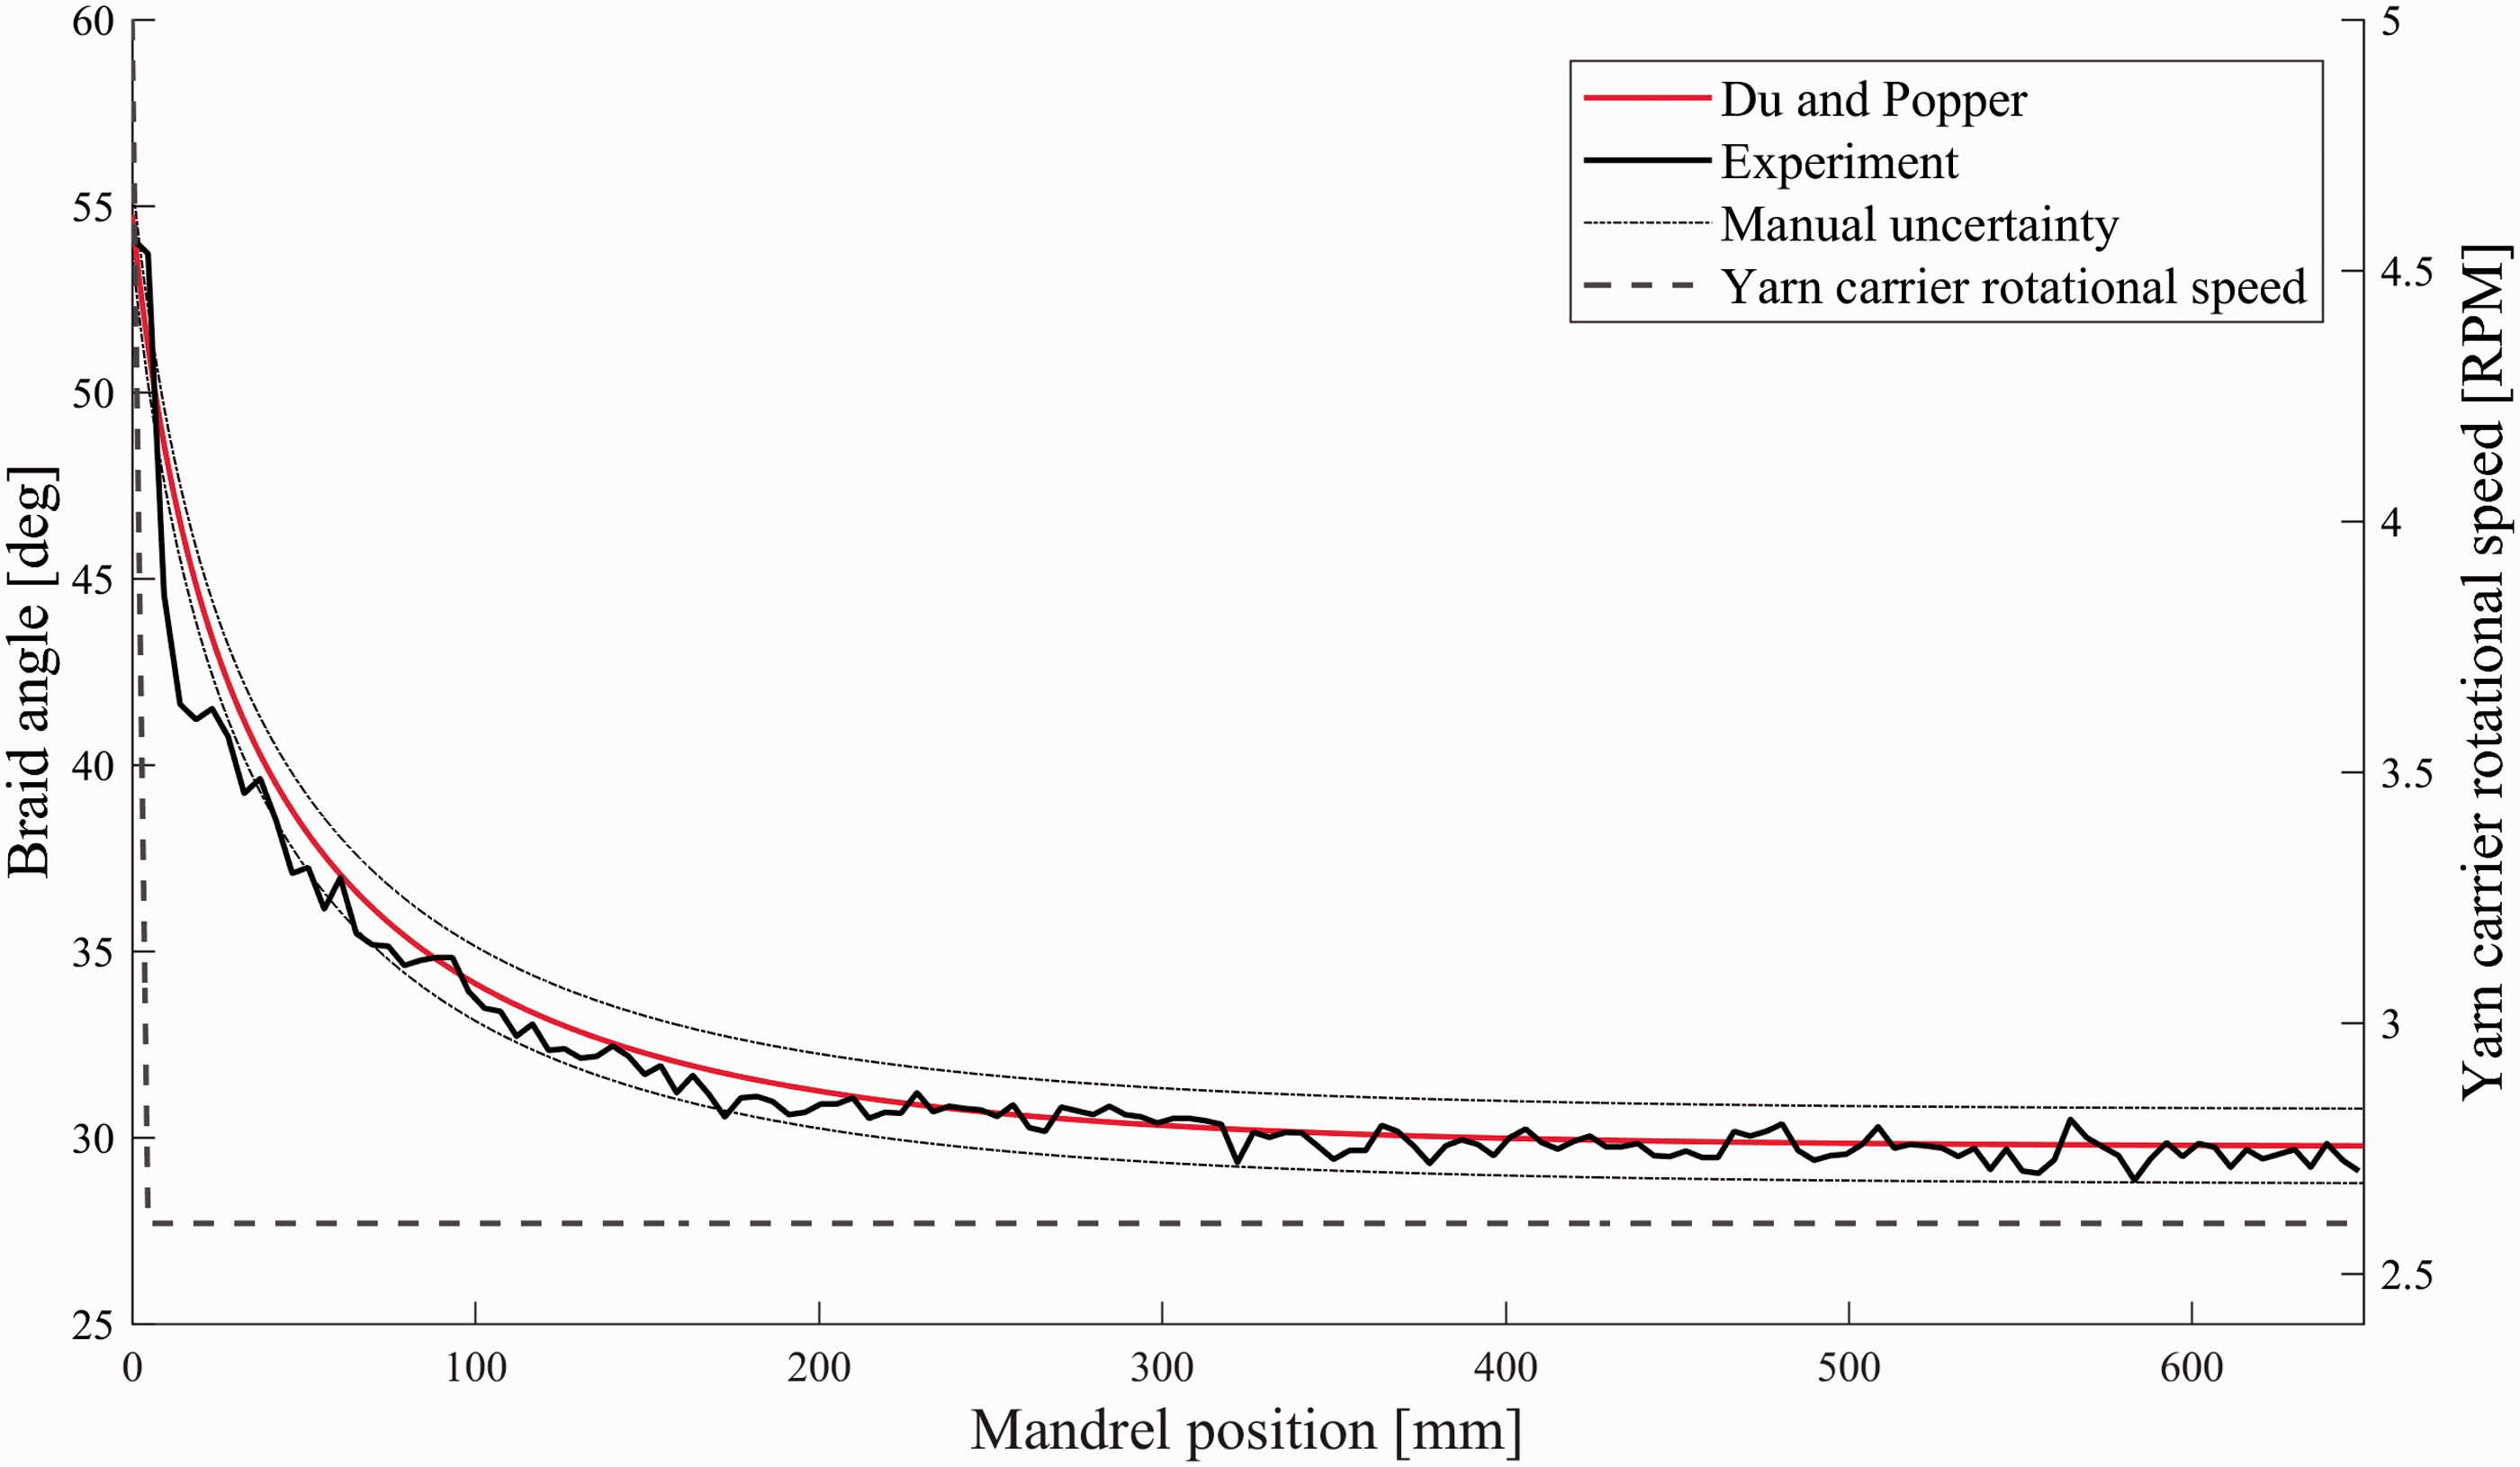
A transient braid pattern was obtained by changing the braiding machine speeds in a stepwise fashion and allowing the pattern to converge. The braiding machine speeds that were used are shown in Table 6. Plots showing the results from the braided preform with an increasing and decreasing braid angle are shown in Figures 21 and 22, respectively. These results were also compared against the Du and Popper model.
8
Braid angle measurement results for a stepwise change in braiding speeds resulting in an increase in braid angle from 30° to 55°. The dotted lines indicate a ±1° band surrounding the mean associated with the uncertainty of past measurement methods. The dashed line shows the stepwise change in rotational speed. Braiding machine process parameters for the transient braiding tests Braid angle measurement results for a stepwise change in braiding speeds resulting in a decrease in braid angle from 55° to 30°. The dotted lines indicate a ±1° band surrounding the mean associated with the uncertainty of past measurement methods. The dashed line shows the stepwise change in rotational speed.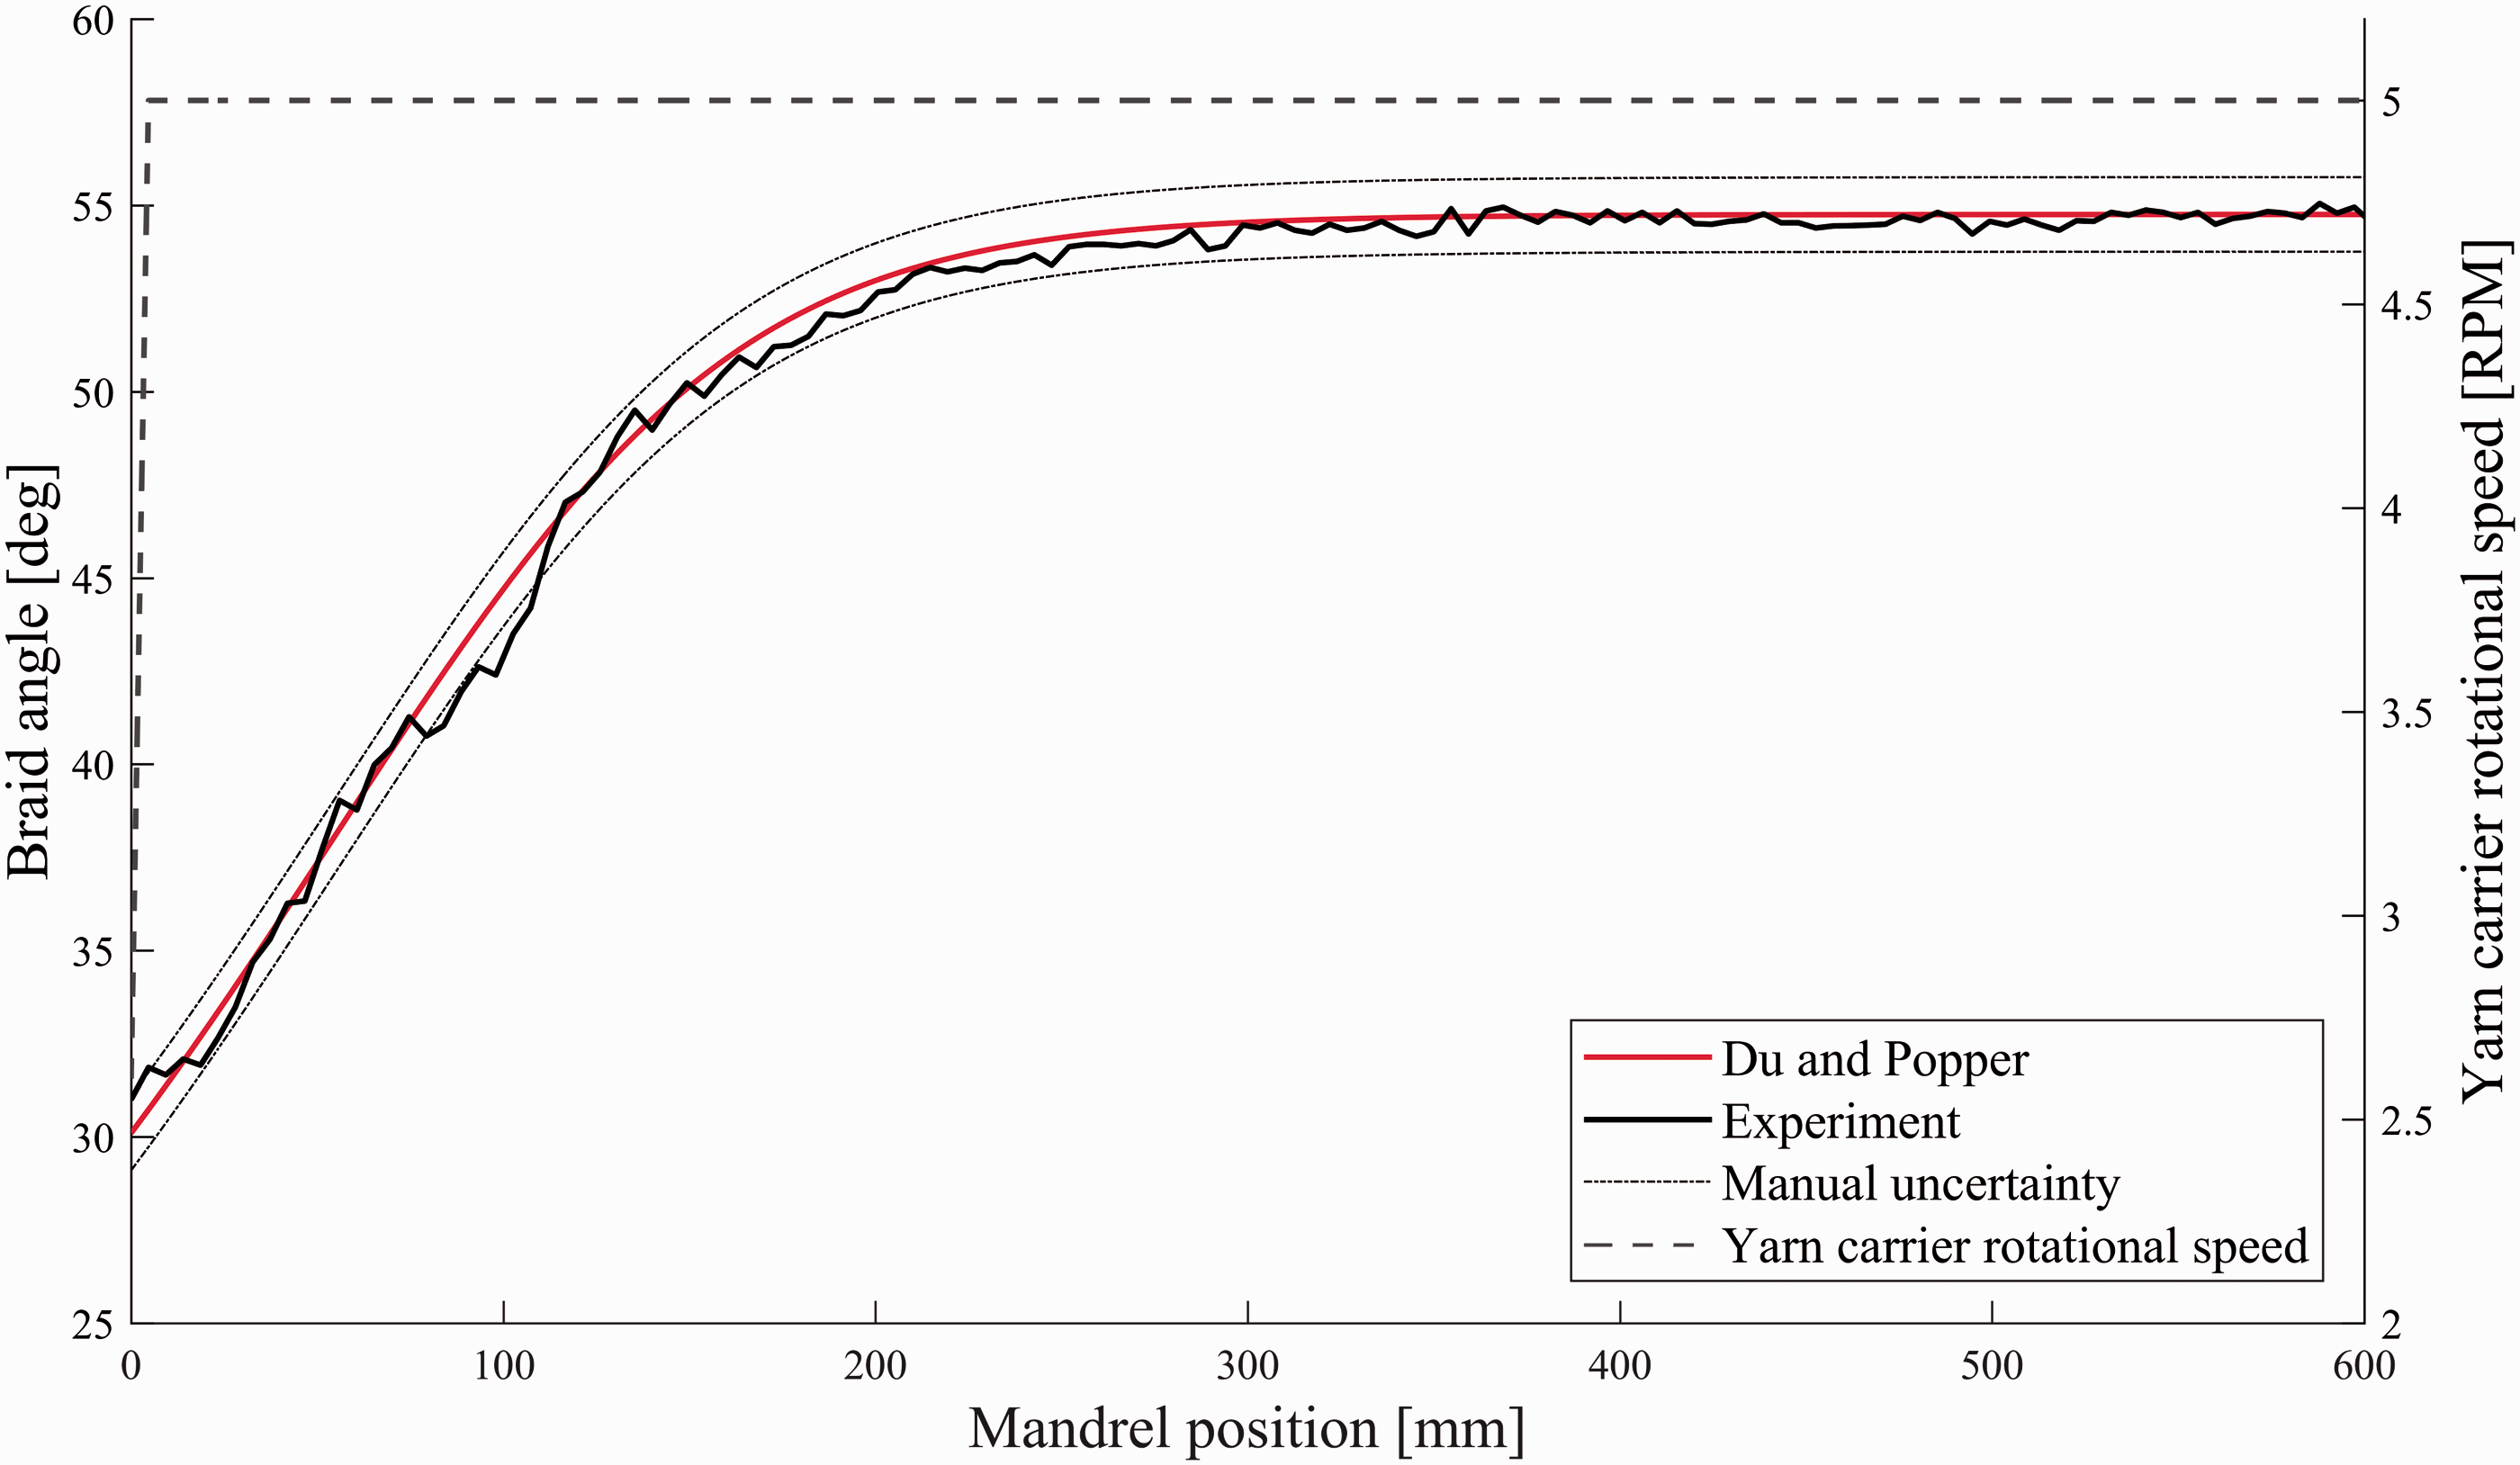

Discussion
The current braid angle measurement process requires the use of manual measurement techniques, which are prone to human error. The objectives of this work were to develop and validate a machine vision measurement technique for automated and real-time braid angle measurement of tubular braided preforms and to explore the effect of the 3D mandrel shape of the angle measurement and frequency spectrum. This system will allow measurements to be made in real-time and will improve the quality assurance braid angle measurements that are currently an important part of the braiding process.
Static braid angle measurements
There are a limited number of fiber measurement techniques for composite material applications. Lian et al. 30 and Wan and Li 31 previously applied measurement techniques to flat braided samples. Measurement techniques for samples with 3D surface profiles, developed by Van Ravenhorst and Akkerman 11 and Leung et al., 21 and Leung, 42 were not suitable for real-time applications due to the need for significant post-processing or user interaction.
Machine vision braid angle measurements
The performance of the 2D-DFT measurement technique was tested by cropping and unwrapping various image regions. Image cropping allowed the distorted regions in the braid image to be removed from the raw image. Image unwrapping used the a priori knowledge that the surface is cylindrical, and compensates for the difference between the projected location of a point and its corresponding arc length through pixel interpolation. The circumferential angle of the tubular surface, α, was used to define the image regions of interest.
Results of cropped image measurements showed good agreement between the expected braid angles (Figures 14–16). The measurement uncertainty values, calculated from the standard error of the mean, were found to be significantly smaller than the ±1–2° associated with manual measurement techniques.11,22 An increased value of α corresponds to a greater expected distribution of fiber directions in the image, shown by the perspective error model in Figure 7. However, changing the value of α did not significantly affect the reported measured braid angle. Although the distribution of fiber orientations in the image increased, the resulting measurement remained unaffected. This suggests that although there is an increasingly wide distribution of fiber angles within the image with increasing α, image features that are least affected by perspective error provide the strongest response in the frequency domain. When considering the sensitive nature of the measurement technique, it is recommended to remove these distorted regions of the image to reduce the likelihood of false measurements, particularly in production settings where lighting may not be constant.
The machine vision measurements previously shown in Figures 14–16 also compare the image cropping and orthographic projection approaches to one another for various values of α. The statistical analysis provided in Table 2 does not show a trend regarding the amount that is removed from the images. There are no changes in significance values for a certain value of α. Statistically significant values were only obtained for the 45° sample, and for certain measurements from the 55° sample. This would indicate that for low braid angles, correcting for perspective error is not as critical. For samples with a low braid angle, the fiber orientation is more closely aligned with the longitudinal mandrel direction, meaning that a single fiber will remain between a range of circumferential angles on the mandrel for a longer length. This leads to an increasing number measurable edges in the image, which are less affected by distortion.
Frequency domain results
A comparison between the machine vision braid angle measurements yields little difference between the two image preprocessing methods when comparing the reported fiber angles alone. However, the angular intensity distribution, shown in Figure 17, showed that unwrapping the image significantly affects the frequency spectrum of the image. The angular intensity distribution of the unwrapped image showed two approximately symmetric peaks centered at ± 45°, whereas the cropped image had two local maximums at the same locations; however, there is also a significant frequency response between ± 45° and 0° from the distorted fiber directions. The orthographic projection technique significantly reduced the fiber angle distribution within the collected images by straightening the yarn paths and compensating for the perspective error.
Lian et al. 30 determined the fiber orientation distribution by studying the width of the peaks in the angular intensity distribution. They determined that the distribution of angles in the spatial image corresponded to the point at which the maximum pixel intensity decreases to 50% of the maximum value. This same approach was taken to determine angular distributions in the raw and unwrapped images for various values of α, shown in Table 3. For the cropped images, an increasing value of α causes a higher angular distribution. This trend was not seen when the unwrapping algorithm was used on the images, as shown in Table 4. The magnitude of the fiber orientation distribution was not found to significantly change the reported braid angles using the measurement technique; however, using the unwrapping process has several advantages regarding the accuracy and robustness of the braid angle measurement. Correcting the perspective error distortion and straightening the fibers in the image allows a greater number of unit cells to be incorporated into the measurement, making the measurement more robust against localized fiber defects. This approach differs from manual techniques where a single unit cell is chosen to represent the fiber orientation of the braided structure. However, it may be valuable to detect these defects for future developments of this technology and it may allow this approach to be used as a real-time fault detection system.
Dynamic braid measurements
Measuring the braid geometry in-line with the braiding process is limited to the work done by Mazzawi, 18 who inferred the braid angle from the convergence length. Using a direct approach with machine vision techniques offers the advantage of directly observing the produced structure, as well as not requiring contact to be made with braid yarns.
Constant braid angle
Figure 20 shows a plot of the braid angle as a function of mandrel position for the 30° braid angle preform. Similar fluctuations were present in the 45° and 55° measurement results. This was an unexpected result and outlines the sensitivity of the measurement approach. When looking at the overall statistics from all measurements in the dataset, shown in Table 5, the measurements show good agreement with the expected braid angle results with a maximum percent error of 2% for the 45° braid angle test.
To investigate the nature of the fluctuations, the images captured during operation of the machine vision system were studied. Images were captured with a region of overlap between consecutive images, as shown in Figure 23. As opposed to measuring the angle of two intersecting fibers, the braid angle is measured by determining the orientation of the most dominant image frequencies by considering all features within the image. The overlapping regions ensure that braid angle measurements are dependent on braided fibers and unit cells, which were measured in previous images, making the rapid fluctuations between consecutive images an unexpected result. The significant overlapping regions between consecutive frames were a result of the chosen sampling rate of the camera and the linear speed of the mandrel. This level of oversampling was not required to monitor the braid angle in real-time. The fluctuations can be linked to the sensitivity of the measurement technique to small changes in pixel value, as was previously shown in the repeat measurement results in Figure 13. This can occur if the dynamic sample is being imaged in the presence of an illumination gradient. This will cause a unit cell of a fixed braid angle to be illuminated at a varying intensity as a function of the position in the region of interest, altering the measurement. This behavior is currently a limitation in the measurement approach and exploring the effect of image processing on the measurement results to remove unwanted image fluctuation would be beneficial to improve measurement consistency.
The overlapping cropped region of interest between consecutive images during real-time measurement tests.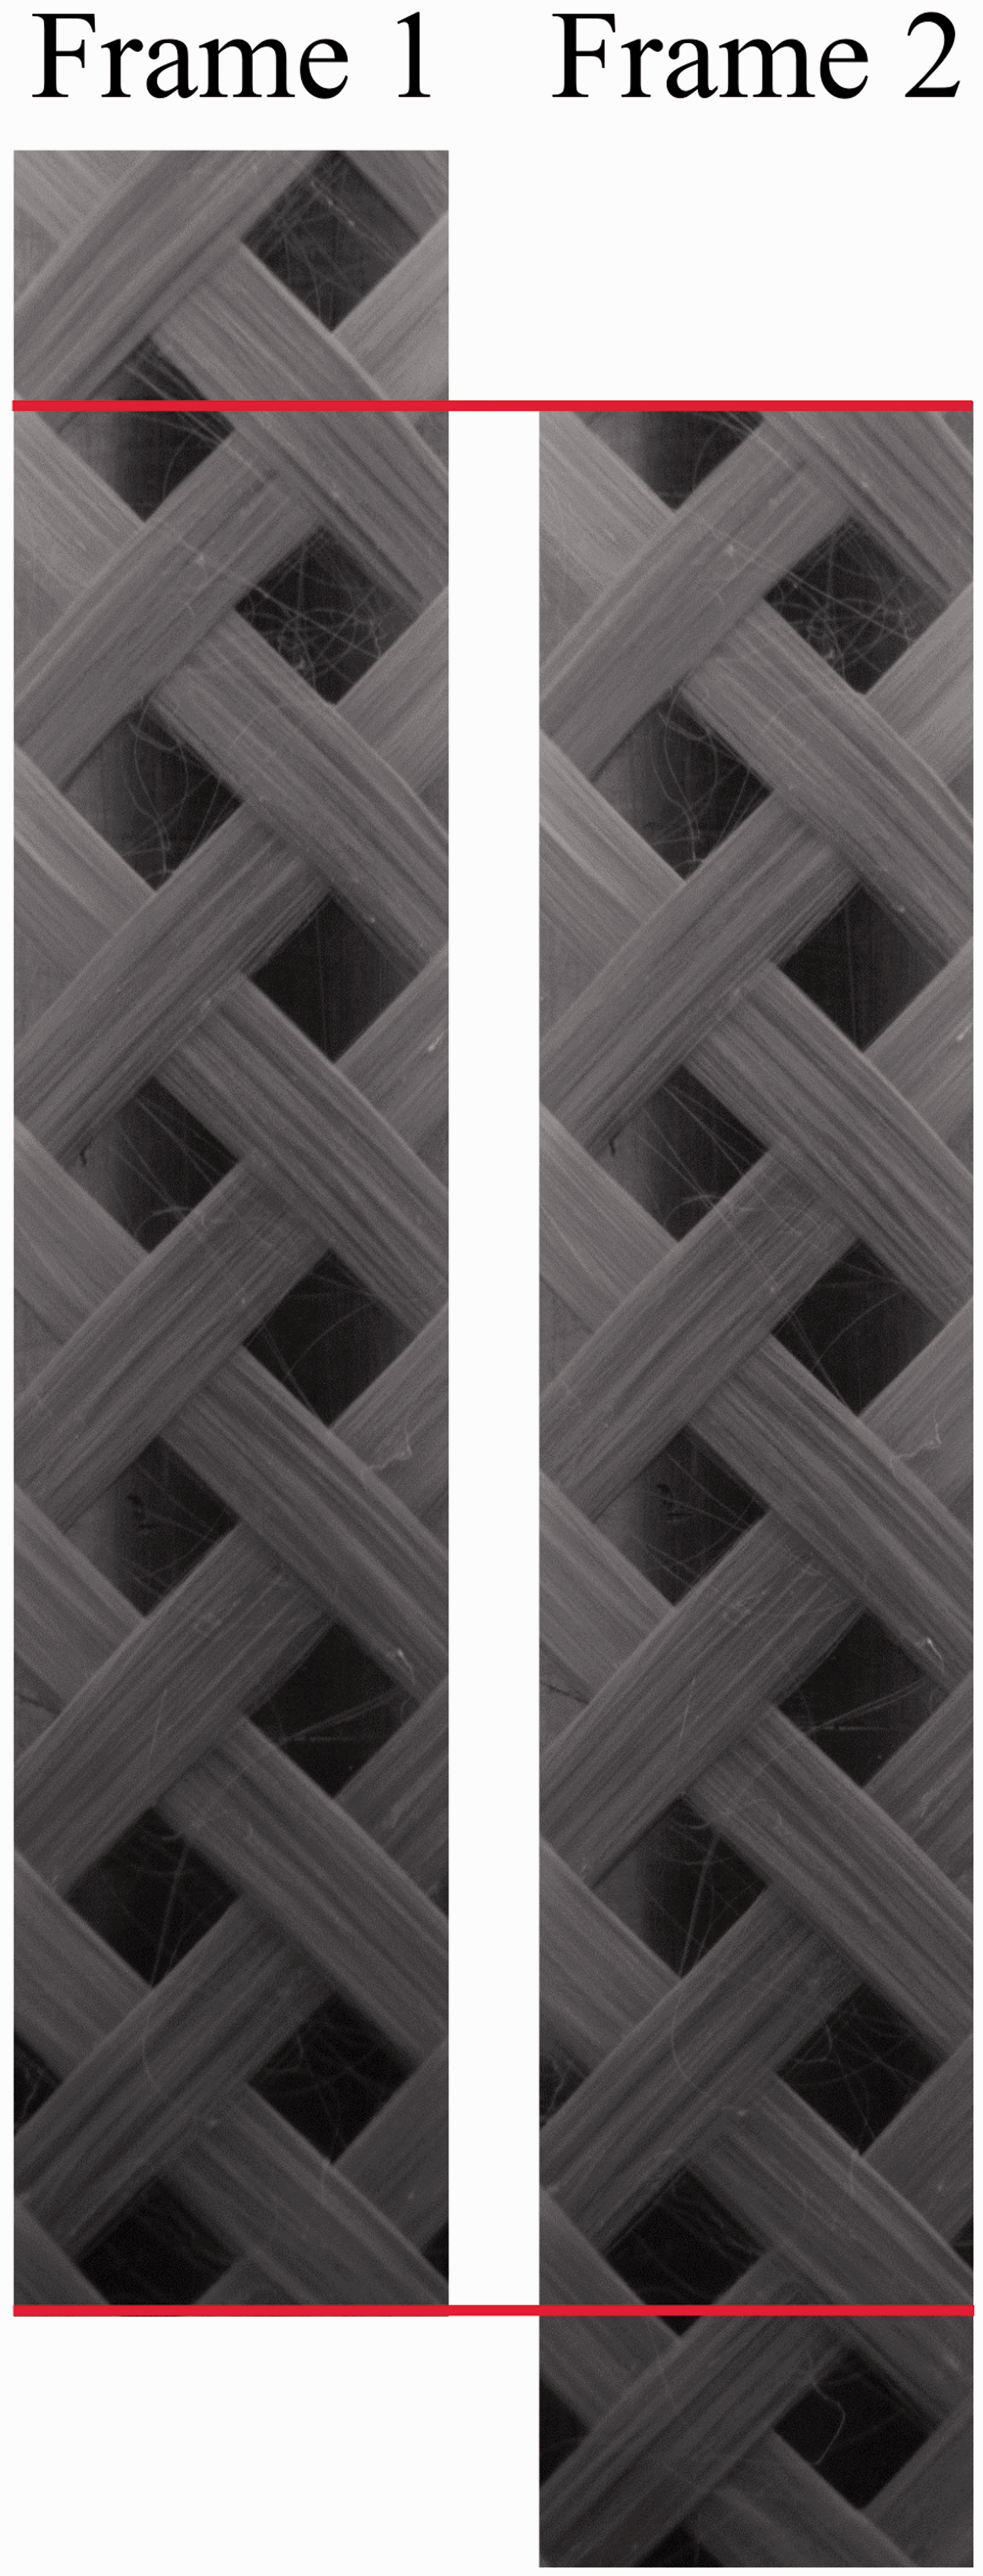
Transient braid angle
The angular speed of the yarn carriers was changed in a stepwise fashion to produce the transient braid pattern used in these tests. The results, shown in Figures 21 and 22, compare the machine vision braid angle measurements for both increasing and decreasing braid angle patterns to the Du and Popper braiding model. 8 This model is valuable due to its simplicity and the ability to provide analytical equations describing the braid geometry. Because of these merits, their work is still the focus of attention for automated braiding, 43 even though Du and Popper 8 showed a 5° error in predicting the braid angle. The results from the transient braid angle tests show a good agreement between the measured and predicted braid angles. The reported error of 5° was not seen in these results.
The error between the predicted and measured results was found to be greater in regions of a rapidly changing braid angle when compared to regions with a constant braid angle. The maximum error was 4.8°, and was seen in the first few millimeters of travel in Figure 22. This error may also be due to the extreme slope in the predicted braid angle during the first few millimeters of travel, and an insufficient sampling rate to characterize that change. In addition, in this region, the carriers slow down for the transition from 55° to 30° braid angle and, by doing so, fibers may slip on the mandrel, which is a phenomenon that is considered in the predictive model.
Rapid measurement fluctuation was also seen during the transient braid angle tests. The amplitude of the fluctuations was comparable to what was seen during the tests described in the Constant braid angle section. For cases where transient braid angles are being measured, the uncertainty associated with the measurement fluctuations cannot be determined through the mean and standard deviation of neighboring measurements and, hence, the difficulty in characterizing the performance of this approach for measuring transient samples is a limitation of the sensitivity of this technique.
Measurement limitations
The previous discussion outlined the ability to measure the braid angle through frequency domain techniques. However, the following limitations are either present when using the technique or are limitations in the scope of this study. Repeat measurement studies showed that the algorithm output varied due to subtle changes in image pixel values from camera noise. Beyond noise, the measurement technique is sensitive to reflections and poor lighting; hence, care must be taken to reduce reflections on both the mandrel and the fibers to ensure good performance. The approach cannot detect local defects in the braiding process and will instead produce a measure of the most prominent angular features in the image. This trait will also leave the measurement unaffected from separation in the fiber tow, if the fibers remain properly oriented. An in-depth study relating mandrel and fiber sizes to measurement accuracy was not performed in this work. However, as long as the primary fiber directions are visible in the image and are unaffected by adverse lighting and reflections, the underlying principles of the measurement technique will work identically to what is shown in the manuscript.
Conclusions
This work focuses on developing an in-line and automated quality assurance system for assessing the braid angle, offering an alternative to current manual measurements. These measurement techniques are time consuming, affected by human error, and have a significant uncertainty in the range of ±1–2 degrees. Such uncertainty is undesirable for material characterization due to the strong relationship between the fiber orientation and the material properties of the braided composite. The solution to these issues is a low-cost machine vision system, capable of accurately measuring the braid angle in real-time. The real-time feedback of the braid geometry can be used to ensure that the desired fiber orientation is being achieved with the selected braiding speeds, which is not possible with current measurement techniques.
A frequency domain measurement technique was used to obtain automated measurements from captured images of tubular braided preforms and the effect of image preprocessing techniques on the resulting frequency spectrum were studied and compared to past works. To compensate for the perspective error from imaging tubular samples, cropping and orthographic projection were tested on tubular preforms with braid angles of 30°, 45°, and 55°. For both image cropping and orthographic projection, the width of the image region of interest had little effect on the machine vision measurements; however, unwrapping the image data was able to significantly decrease the fiber angle distribution in the images. These results also show that the fiber deposition process can be accurately monitored in real-time with a low-cost machine vision system. The fully automated machine vision system can eliminate the need to perform manual quality assurance measurements of the braid angle and has shown to be more accurate than some multi-frame techniques due to the removal of human error associated with landmark selection.
Footnotes
Declaration of conflicting interests
The authors declared no potential conflicts of interest with respect to the research, authorship, and/or publication of this article.
Funding
The authors disclosed receipt of the following financial support for the research, authorship, and/or publication of this article: The authors would like to acknowledge the support of the Natural Sciences and Engineering Research Council of Canada (NSERC).