
Abstract
In the digital optical microscope, the depth of field is limited in the image acquisition of nonwoven fabrics. The image of the fabric under the single focus image cannot achieve a uniform focus in the whole field of vision, which leads to the blurring of some regions. A new method of multi-focus image fusion based on the Geronimo-Hardin-Massopust (GHM) multiwavelet transform is introduced in this article, which realizes the digital image fusion of a sequence of images taken at different focus settings to achieve a clearer focus fusion of the fiber mesh showing the full field of view within a single image. In this article, a self-built nonwovens micro imaging system is used to collect the image sequence of the fabric at different focus images, and the initial image sequence is processed by critical sampling prefiltering. The high and low frequency components of the image are processed by different fusion rules, and the fusion image of the initial fabric is obtained through the fusion of multiwavelets and inverse transformation. Then, the fusion image of the initial fabric and the subsequent focus image are fused, using the above method, and all the fiber areas after the fusion can be clearly shown to end the operating. Experiments show that the fusion method can solve the difficulty of accurate focusing in a single image with full field of vision.
Keywords
Nonwovens are a type of fabric made of a fiber layer that can be either a carded or a fibrous web made directly by a spinning process, with a disorderly or oriented fiber arrangement. The properties of nonwovens depend on the porous structure of the fiber aggregate, which is affected by the forming method and the geometrical parameters of the nonwoven fabrics, such as thickness, fiber orientation, and pore size. In this case, the characterization of these geometrical parameters is very important for the industrial application of nonwoven fabrics. Usually, the geometrical structure analysis of nonwovens is traditional. However, it has the disadvantages of time-consuming and low reliability, and it is difficult to characterize the complexity of the pore structure using traditional manual methods. With the rapid development of computer science and technology, image-based methods have been adopted to investigate the structure and appearance of textile products. In terms of digital evaluation, the image quality is very important for the characterization of textile appearance and morphological analysis.
The depth of field of an optical microscope is insufficient to visualize the full section of nonwoven fabrics through a single image covering the full range of its thickness. A single image of nonwoven fabrics focused regionally is illustrated in Figure 1, the defocused parts of nonwoven fabric are marked by the boxes (in red online), and most of the fibers can be seen to be blurred and distorted. Therefore, measurements based on these incompletely focused images will be inaccurate and some errors would be generated during subsequent processing due to these defocusing phenomenon.
1
In this article a method of multi-focused image fusion is introduced, using fusion technology to merge two or more multi-focused images into a single image, which could be used to identify the full objects at a range of different focus depths. Through this fusing method, a final high-quality image with all the objects across different focus layer could be merged and visualized for further processing.
2
Illustration of single focus image and reference image after fusion: (a) single focus image, and (b) reference image after fusion.
Multi-focus image fusion is usually considered to be one branch of multi-source image fusion technology, and there has been quite a lot of reported research in this field.3–4 Multi-focus image fusion is used to combine two or more single-layer focus images to form a high-quality merged image. 5 In the field of multi-focus image processing, there are many classic multi-source image fusion algorithms, such as Wavelet transform, 6 Laplacian Pyramid (LAP), 7 Gradient Pyramid (GP),8–9 Contrast Pyramid transform (CPT), 10 Shift Invariant Discrete Wavelet Transform (SIDWT), 11 and Spatial frequency algorithm.12–13 All these algorithms are still widely used for image fusion. However, newly developed algorithms are also continually appearing and used for multi-focus image fusion, such as Discrete cosine transform (DCT), 14 Nonsubsampled contourlet transform (NSCT), 15 and Region-based image fusion algorithm.16–18
In this article, we present a novel image fusion method based on the Geronimo-Hardin-Massopust (GHM) multiwavelet transform as a way to merge multi-focus image sequences and visualize the morphological appearance of nonwoven fabrics across multi-depth focus. The method avoids the limitations of single wavelet transform, which can only be used for the fusion of two images.19–20 A set-up for image acquisition and an analysis system are established for the image digitalization of nonwoven fabrics, including hardware and self-developed software embedded with the image fusion algorithms presented, based on multiwavelet transform. Related experimental works are also conducted to validate the feasibility of the method presented; final conclusions are made based on the data analysis.
System set-up
A digital microscope system established by us in the laboratory is used for image digitalization and analysis of nonwoven textiles, consisting of a digital camera, an optical microscope, a three-axis movable platform, and a computer, as shown in Figure 2. High-quality images could be captured with a resolution of 2592 × 1944 pixels, the maximum magnification of the optical microscope was 1000X, and the sample holder could be fixed on the adjustable platform, which can be driven by step motor or manual operation.
Image acquisition system.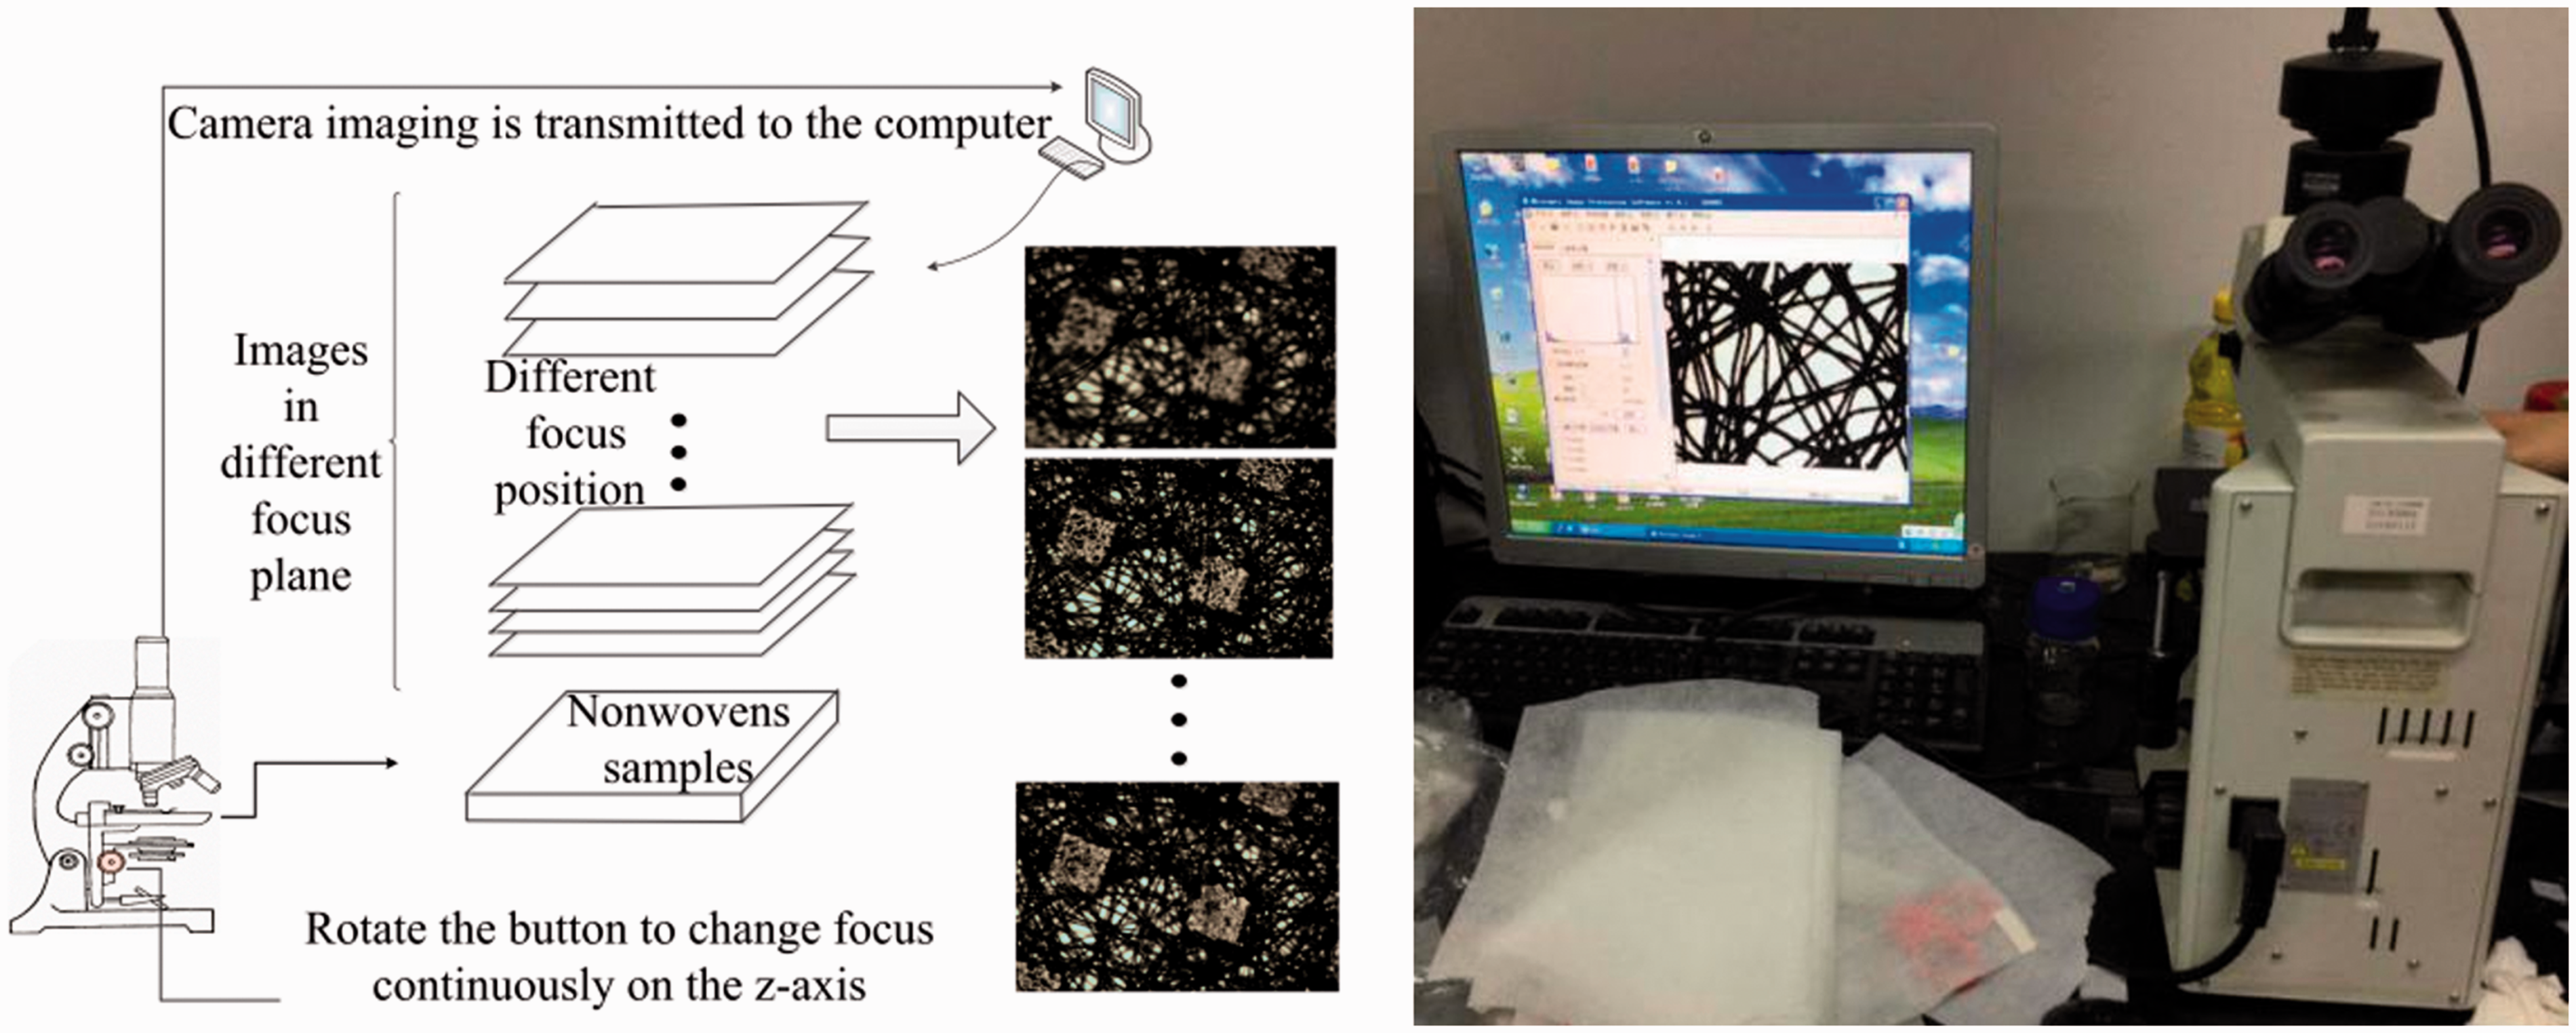
The nonwoven sample slide is fixed on the sample holder platform of the microscope, which can be moved in the x and y direction. The image sequences could be digitalized at each x,y position with different focus depths through the movement of the sample in the z direction.
Each nonwoven sample was cut into several 1 × 1 cm specimens, and the selected specimen was then placed on the slide for imaging. Between 15 and 30 single-focus images are captured at different focal planes or layers, the number of images being related to the thickness of the sample. The resolution of each captured image is 2592 × 1944 pixels. The fiber clarity varies with focus, as shown in Figure 3; nine representative images are selected from 20 single-layer focused image sequences to demonstrate the image variance.
Sample image sequences of nonwoven fabrics digitalized at different focus planes: (a) image1, (b) image3, (c) image5, (d) image7, (e) image9, (f) image11, (g) image13, (h) image15, and (i) image17. The image number is the serial number of the acquisition.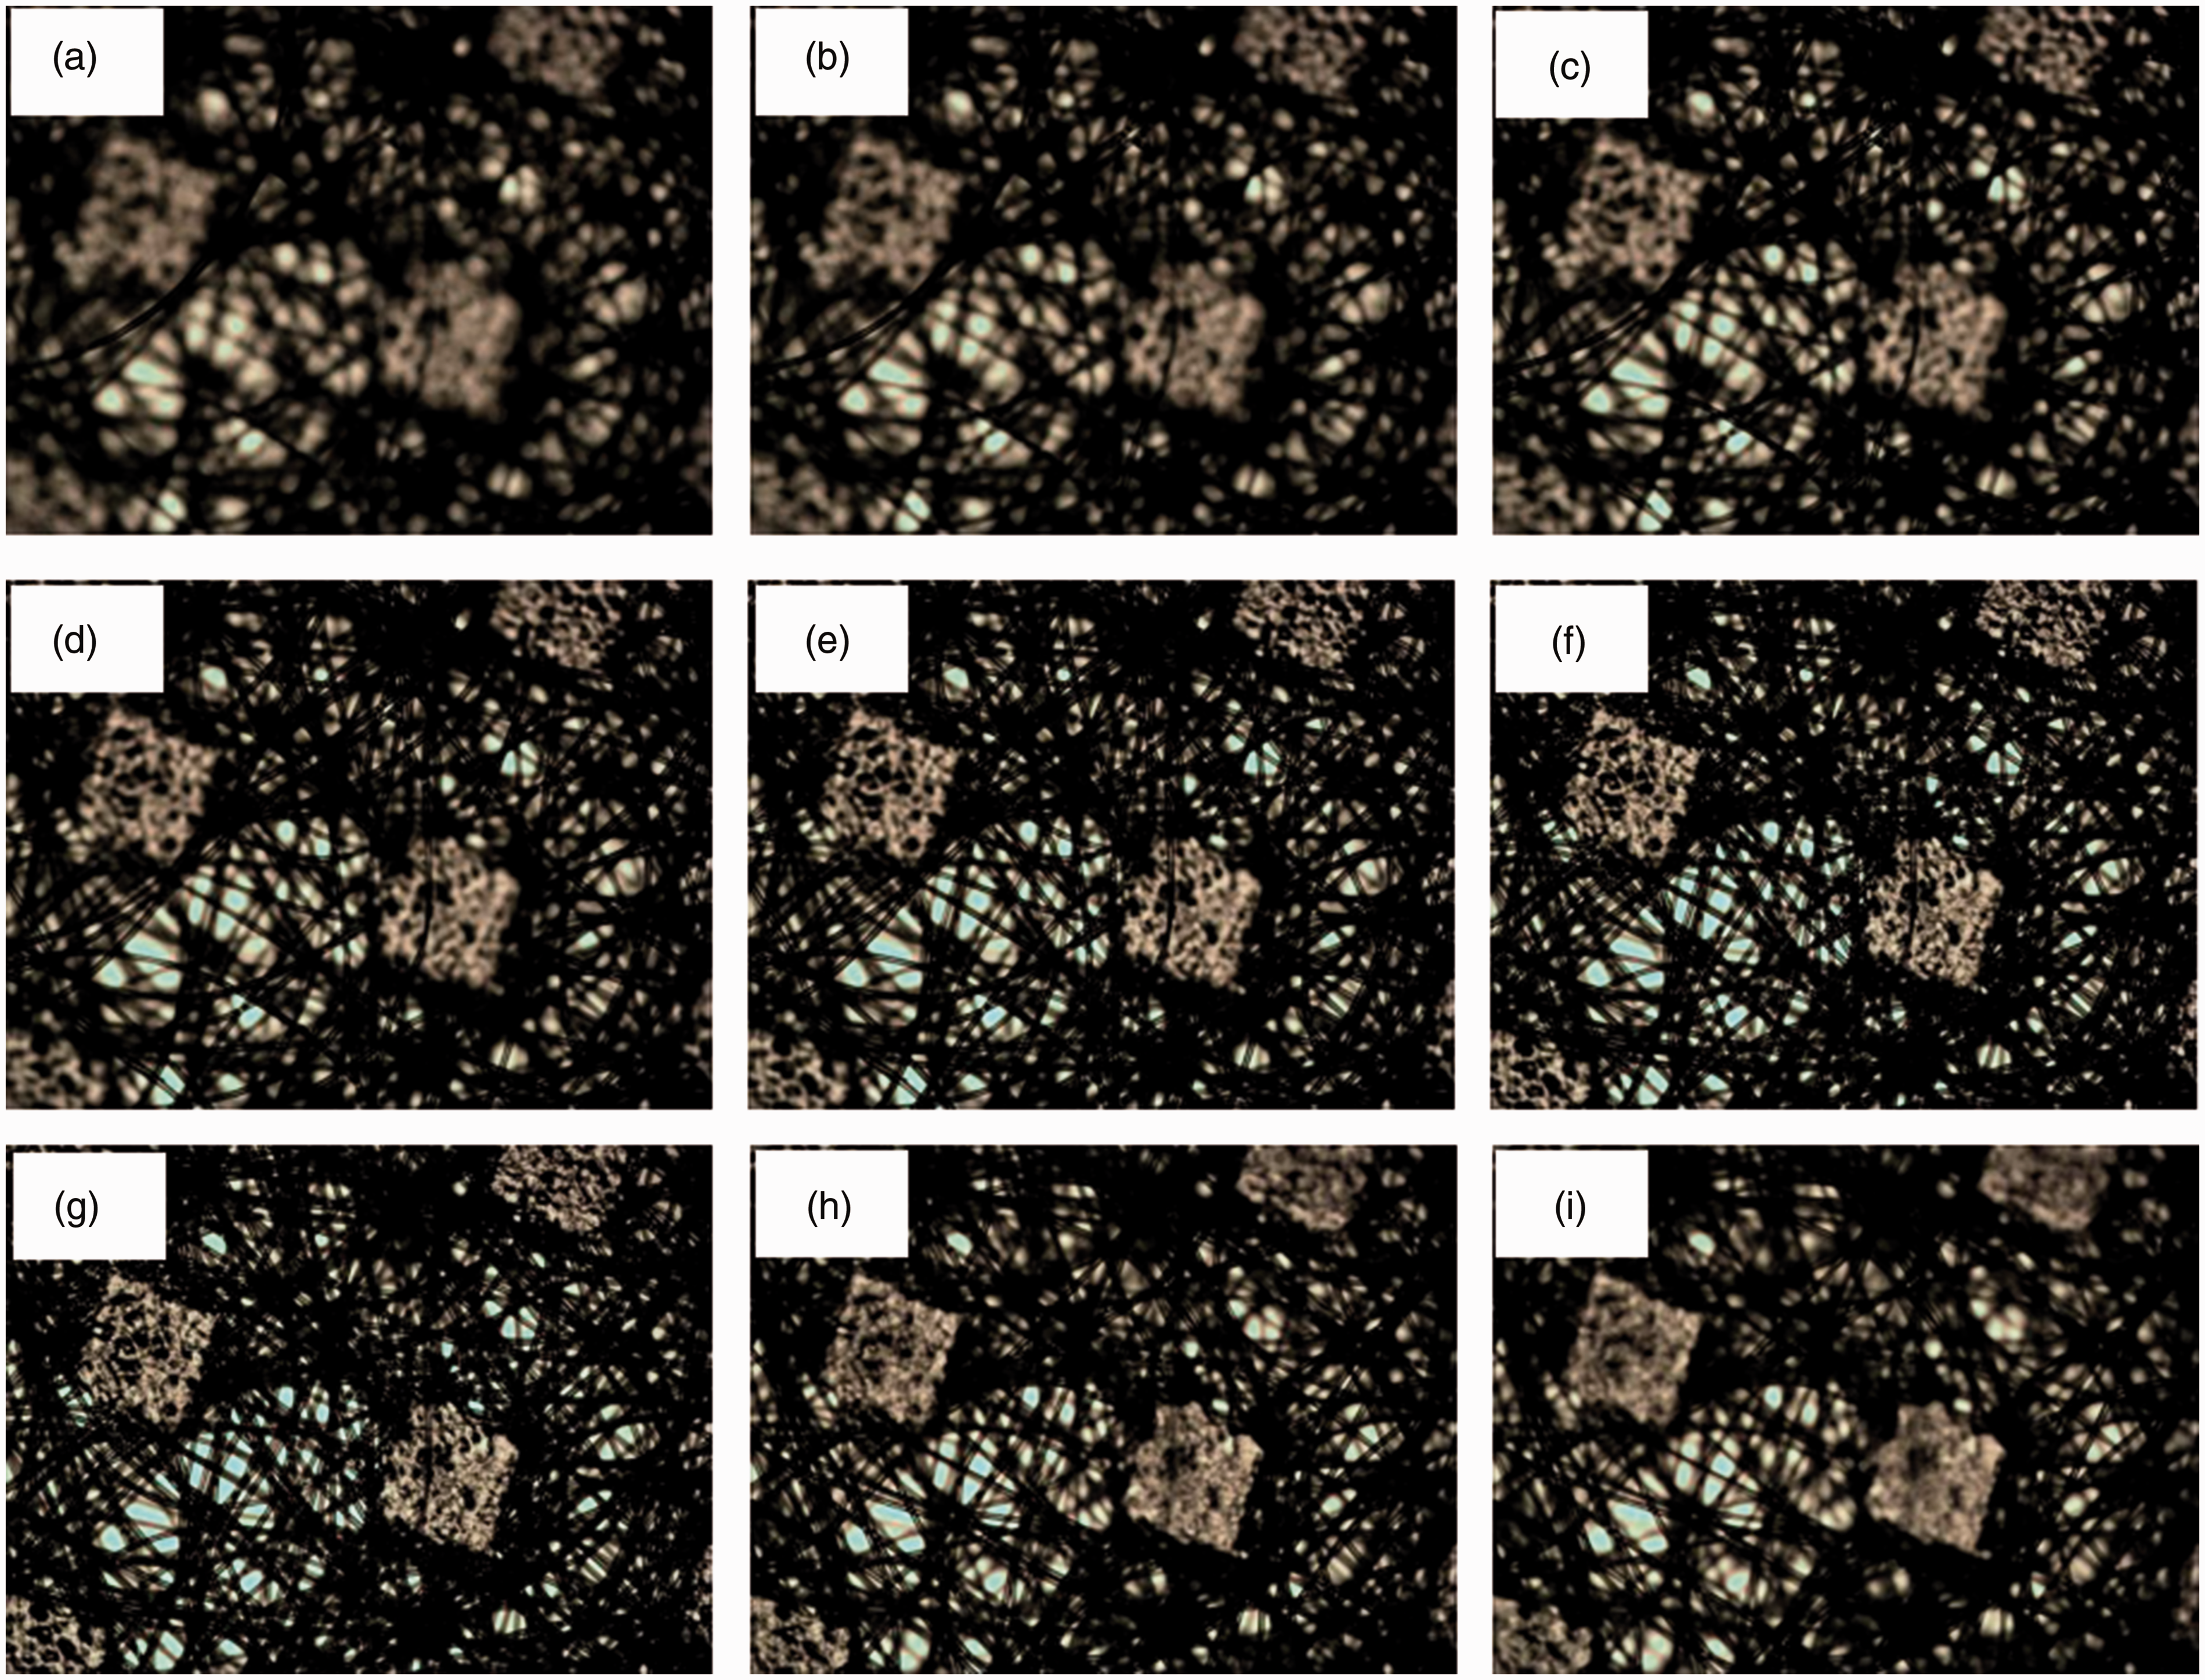
Methodology
Image filtering
Source images should be pre-filtered before multiwavelet decomposition to make sure the object of multiwavelet decomposition is a vector signal. Therefore, the critical sampling pre-filtering was used to process the original images in this research, in order to reduce the computational complexity and improve the convergence rate of the system compared with the traditional method.
After M × N original images were pre-filtered, h sub-images could be determined. The final fused image could be reconstructed by inverse filtering of these sub-images after pre-filtering and wavelet decomposition.

GHM multiwavelet transform
GHM multiwavelets have unique properties, such as symmetry and a lower computation cost. After translation, the multiwavelets and multi-scale functions are symmetrical, giving the filter a linear phase or generalized linear phase, thus avoiding error generated by the reconstruction. The general single wavelet does not possess these properties, while the multiwavelet has more advantages than the single wavelet in terms of these properties and is therefore faster and more precise than the single wavelet in practical applications.21–22
Multiwavelets are generated by a scaling function and corresponding wavelet function translation. If


Where
It was possible to obtain p sub-bands images after L-level multiwavelet decomposition (r is the order of the filter). In this case, taking r = 1 as an example, 3-level multiwavelet decomposition of an original image after reorganization is shown in Figure 4.
3-layer wavelet decomposition examples.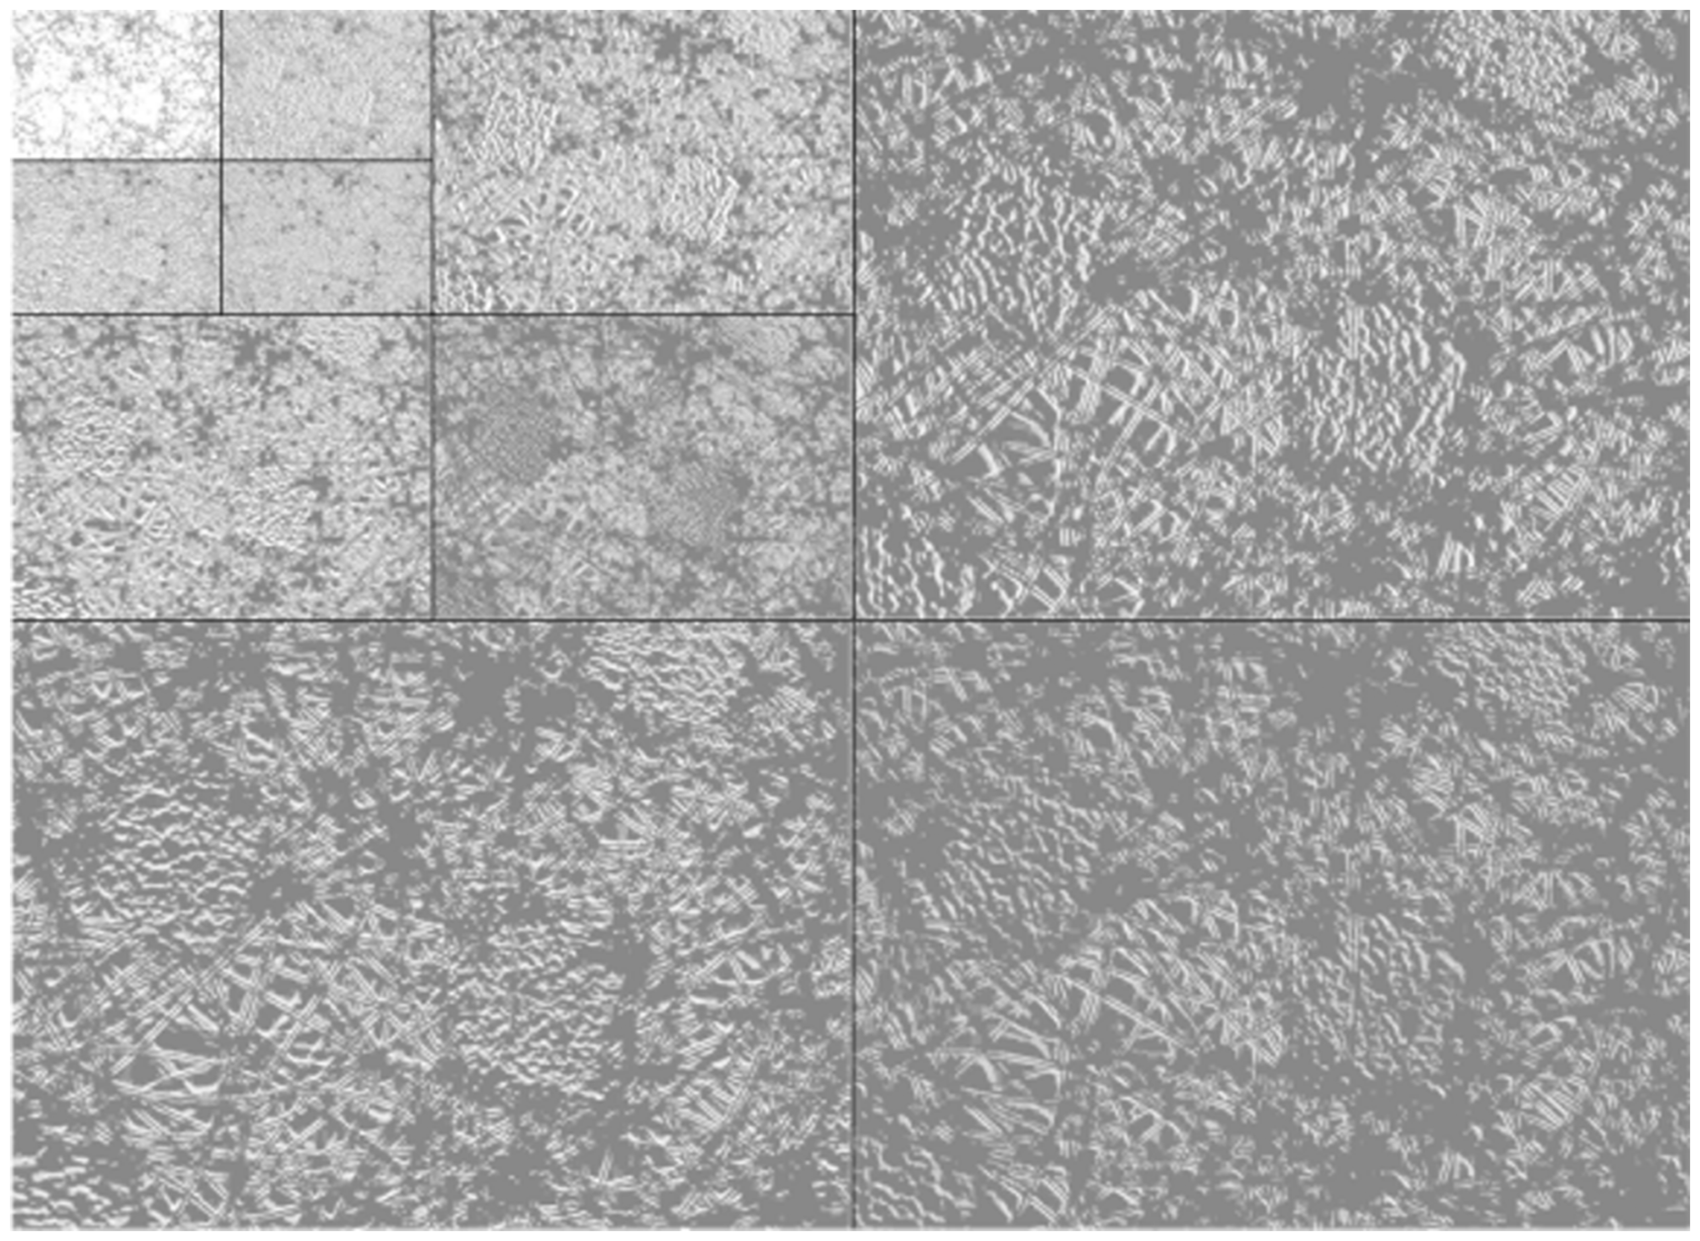

Multi-focus image fusion
The image fusion process is based on the non-redundant and directional features of wavelet transform. There are several steps to the process: (1) the original image is re-sampled to reduce the algorithm or calculation cost by r × r order critical sampling. The image scalar information is transformed into a vector signal by pre-filtering; (2) the high and low frequency components could be determined respectively after the first (A) and second (B) original single-focus images have been decomposed; (3) the fusion method based on region direction and energy weighting is conducted on the high frequency component and the larger energy of the region is selected; (4) the regional variance fusion method based on interlayer correlation is conducted on the low frequency component, and the region with the larger correlation, consistent change degree, and a low degree of dispersion is selected; and (5) the initial fused image can be obtained after the inverse transform. Finally, supposing A now represents the initial fused image merged by 1st single-focus image and 2nd single-focus image, and B now represents the 3rd single-focus image, then steps (1) to (5) are repeated until all the fiber regional sections can be clearly presented in the final fusion image with good contrast. The specific flowchart is illustrated in Figure 5.
Flowchart of self-developed algorithm.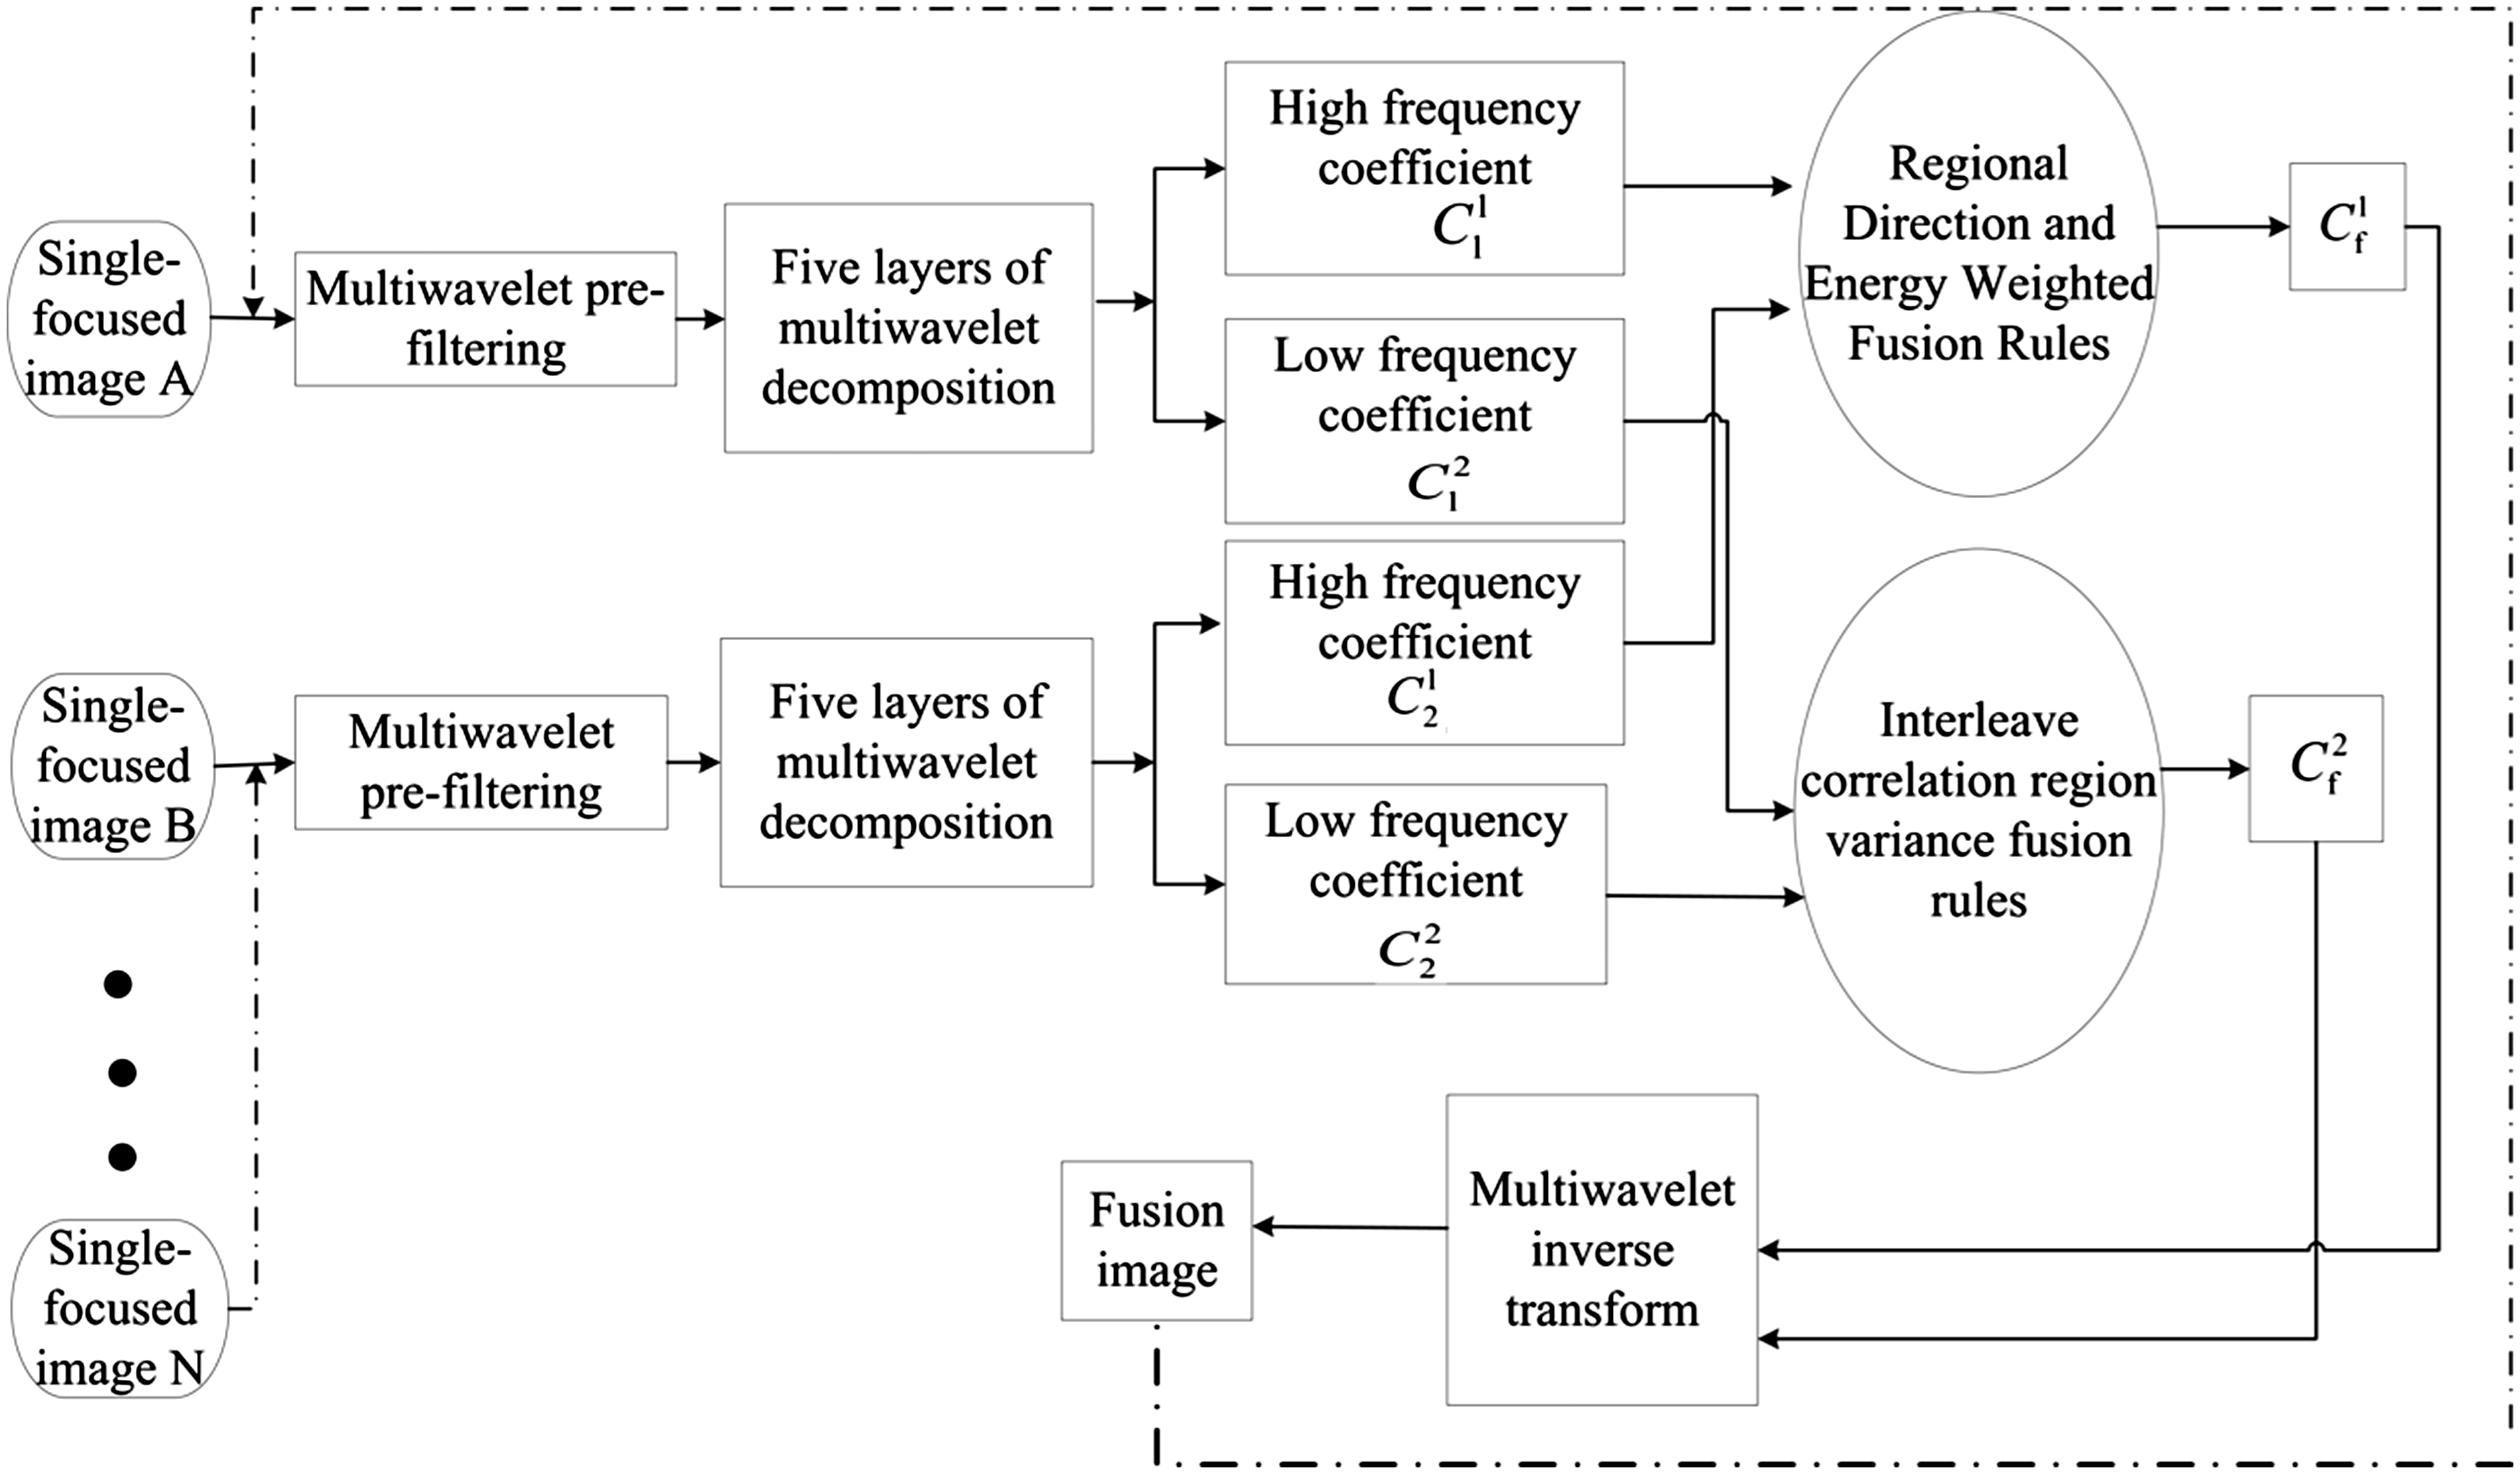
High frequency coefficient processing
The fusion rule of regional energy works better than the traditional rule; brightness could be enhanced significantly and more information could be obtained, so that the fusion effect could be improved effectively.
Regional energy
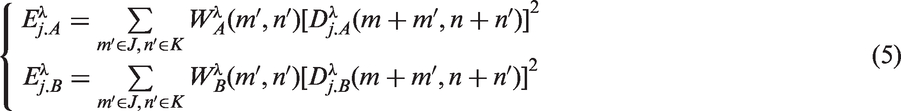
Energy matching degree

When

When
High frequency fusion rule

Low frequency coefficient processing
The brightness and smoothness information of images could be presented in the low frequency component. The method based on interlayer correlation is adopted to find the position of the useful image information in the target image.
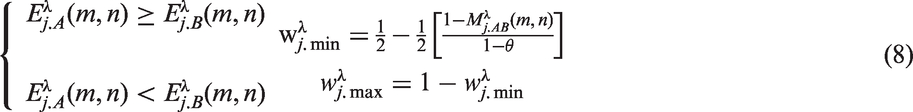
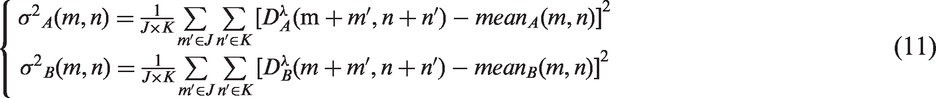
Sub band mean
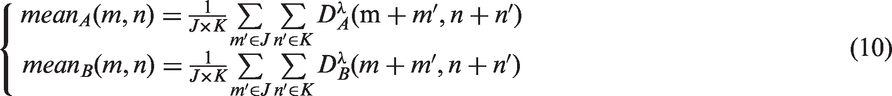
Sub band variance
Sub band correlation coefficient

Low frequency fusion rule

When

In all the above,
Experimental analysis
The multiwavelet fusion algorithm achieved good effects in the nonwovens multi-focus image fusion. The robustness of the multiwavelet algorithm is verified by different fusion algorithms and different nonwoven samples.
Quality evaluation
Image fusion quality evaluation is an important index of an image processing system. Existing image quality assessment is divided into two categories: subjective evaluation and objective evaluation. Subjective assessment is easily influenced by the environment, so the current research focuses on objective evaluation. In this article, the average entropy, mean gradient, mutual information, root mean square error, and peak signal-to-noise ratio are used to evaluate the quality of fusion from five aspects.
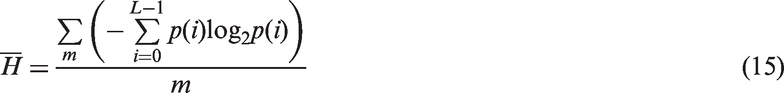
Average information entropy
Information entropy is the measure of the average amount of image information, and the average information entropy (AIE) is the mean value of it. The larger the entropy value, the more information the image has, and the better the fusion effect. The AIE is defined as
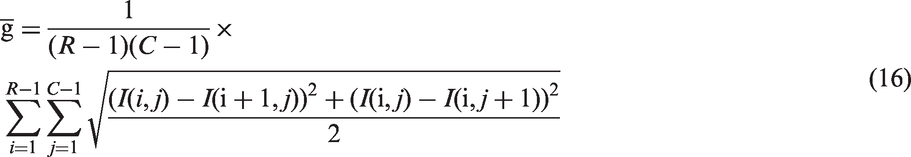
Average gradient
The average gradient is the rate of change of the gray scale, and the rate of change can be used to express image definition. The larger the average gradient value, the better the image fusion effect. The average gradient (AG) is defined as
Mutual information
Mutual information indicates the strength of the relationship of X and Y. Mutual information (MI) is defined as:

Root mean square error
The root mean square error is used to measure the deviation between the observed value and the true value. The larger the root mean square error value, the better the image fusion effect that can be achieved. Root mean square error is defined as

Peak signal-to-noise ratio
The higher the peak signal-to-noise ratio, the better the fusion effect and quality. The peak signal to noise ratio is defined as

Data display
Fusion image quality evaluation form
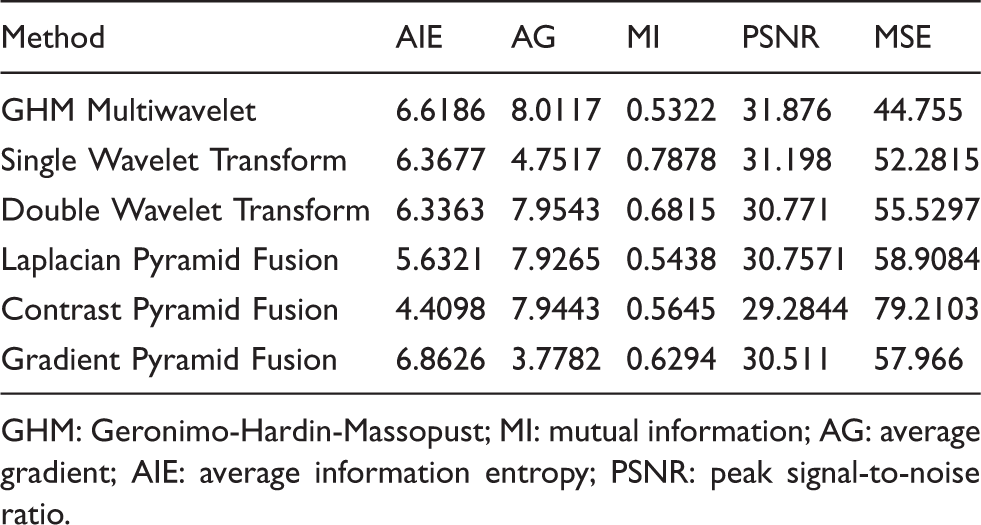
GHM: Geronimo-Hardin-Massopust; MI: mutual information; AG: average gradient; AIE: average information entropy; PSNR: peak signal-to-noise ratio.
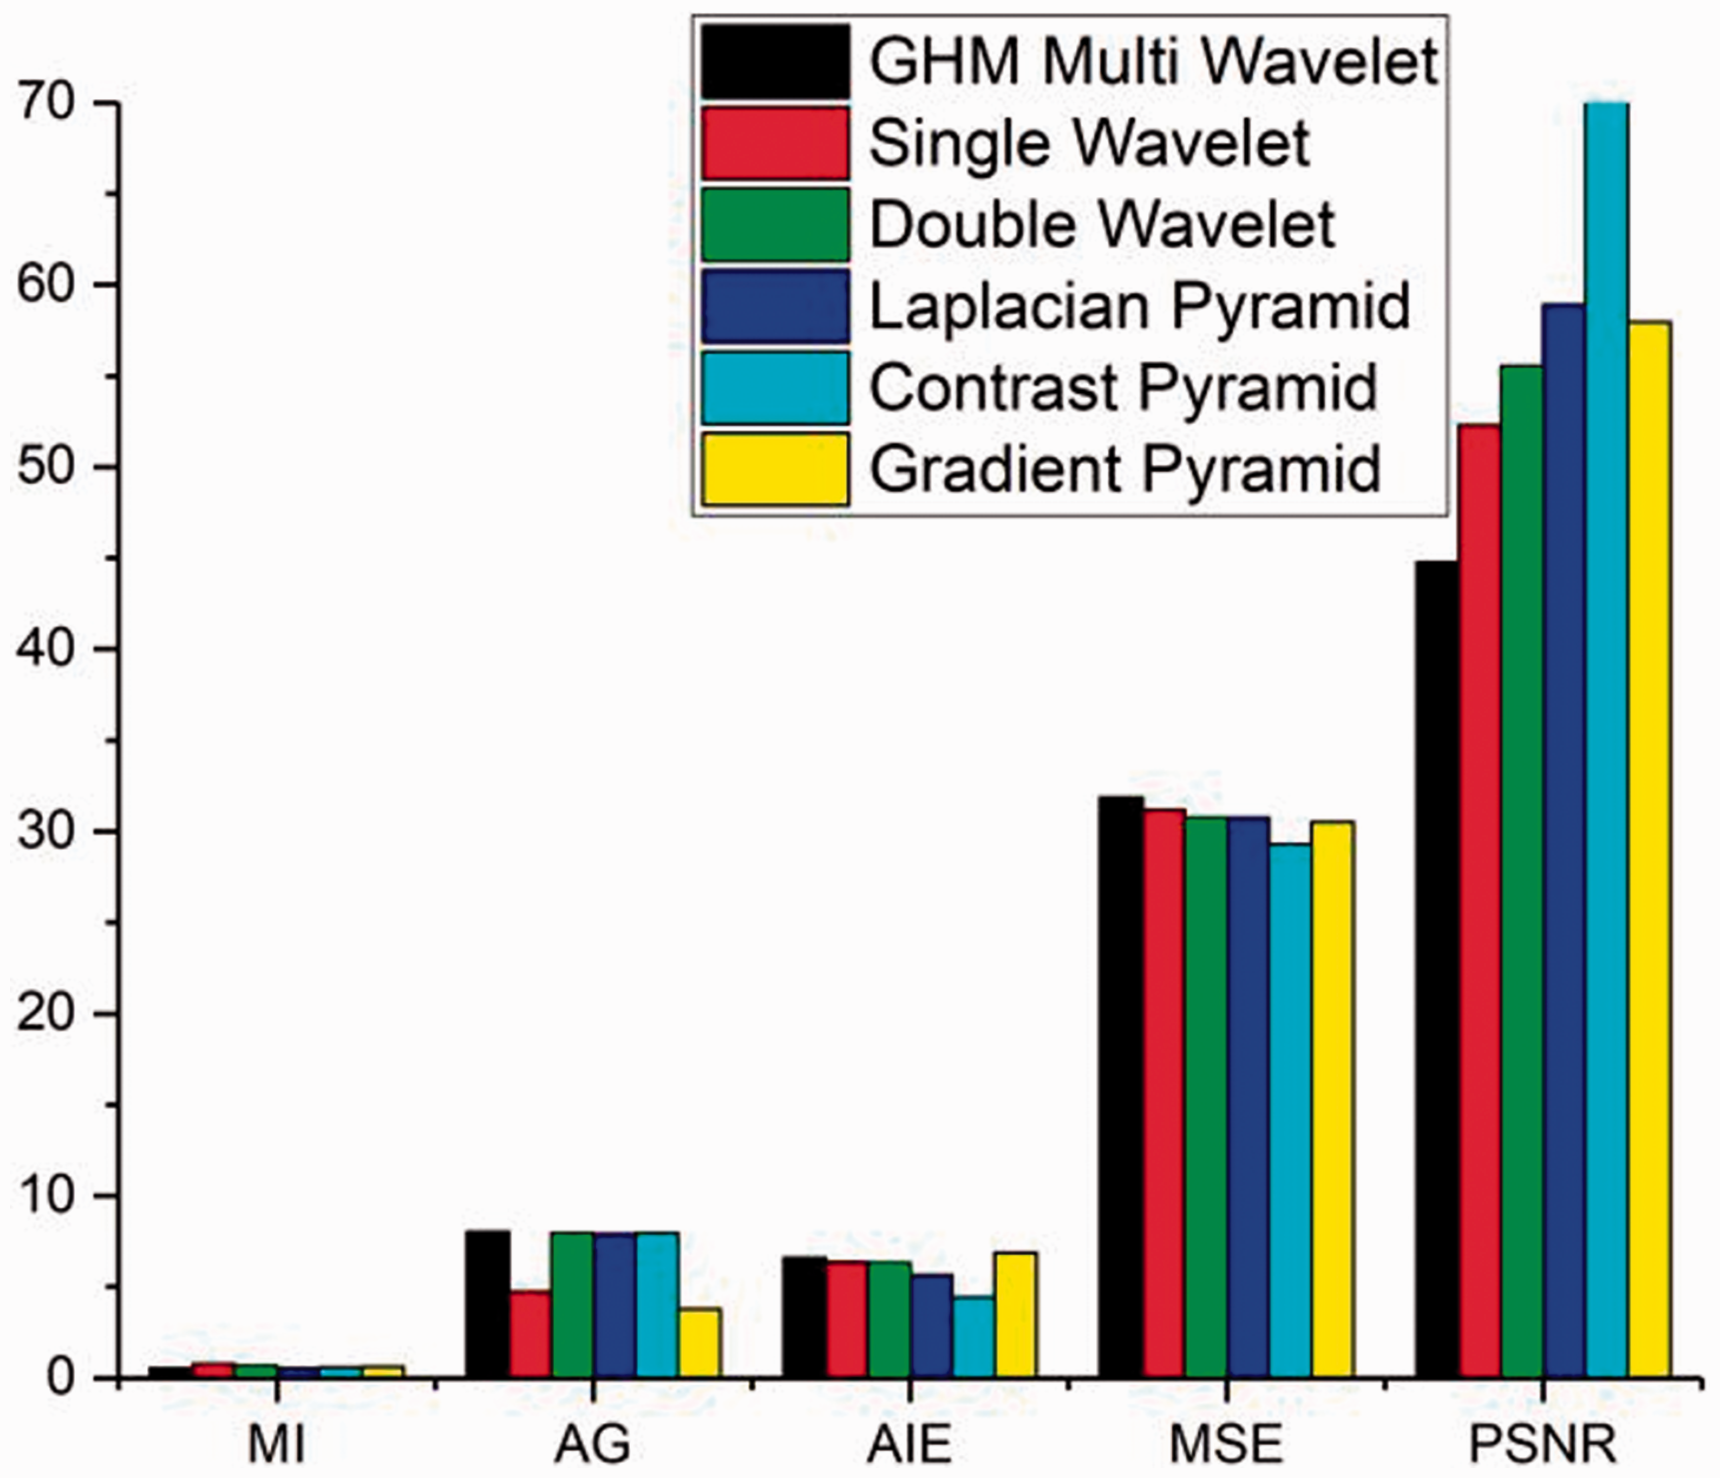
Quality evaluation diagram of 6 fusion methods.
Result comparison
Six kinds of fusion diagrams with different fusion algorithms are presented to show the fusion effect more intuitively, in Figure 7. The multiwavelet fusion algorithm used in this article is intuitively a good fusion effect. It can be found that the multiwavelet-based method has the best fusion effect and the gradient pyramid has the worst fusion effect in this research. The fusion of Contrast Pyramid and Laplacian Pyramid are also good, but the brightness is lower than the Multiwavelet transform, the amount of information is smaller, and the edge retention is lower.
Fusion effect of each method:(a) Multiwavelet, (b) Single Wavelet, c) Double Wavelet, (d) Contrast Pyramid, (e) Laplacian Pyramid, and (f) Gradient Pyramid.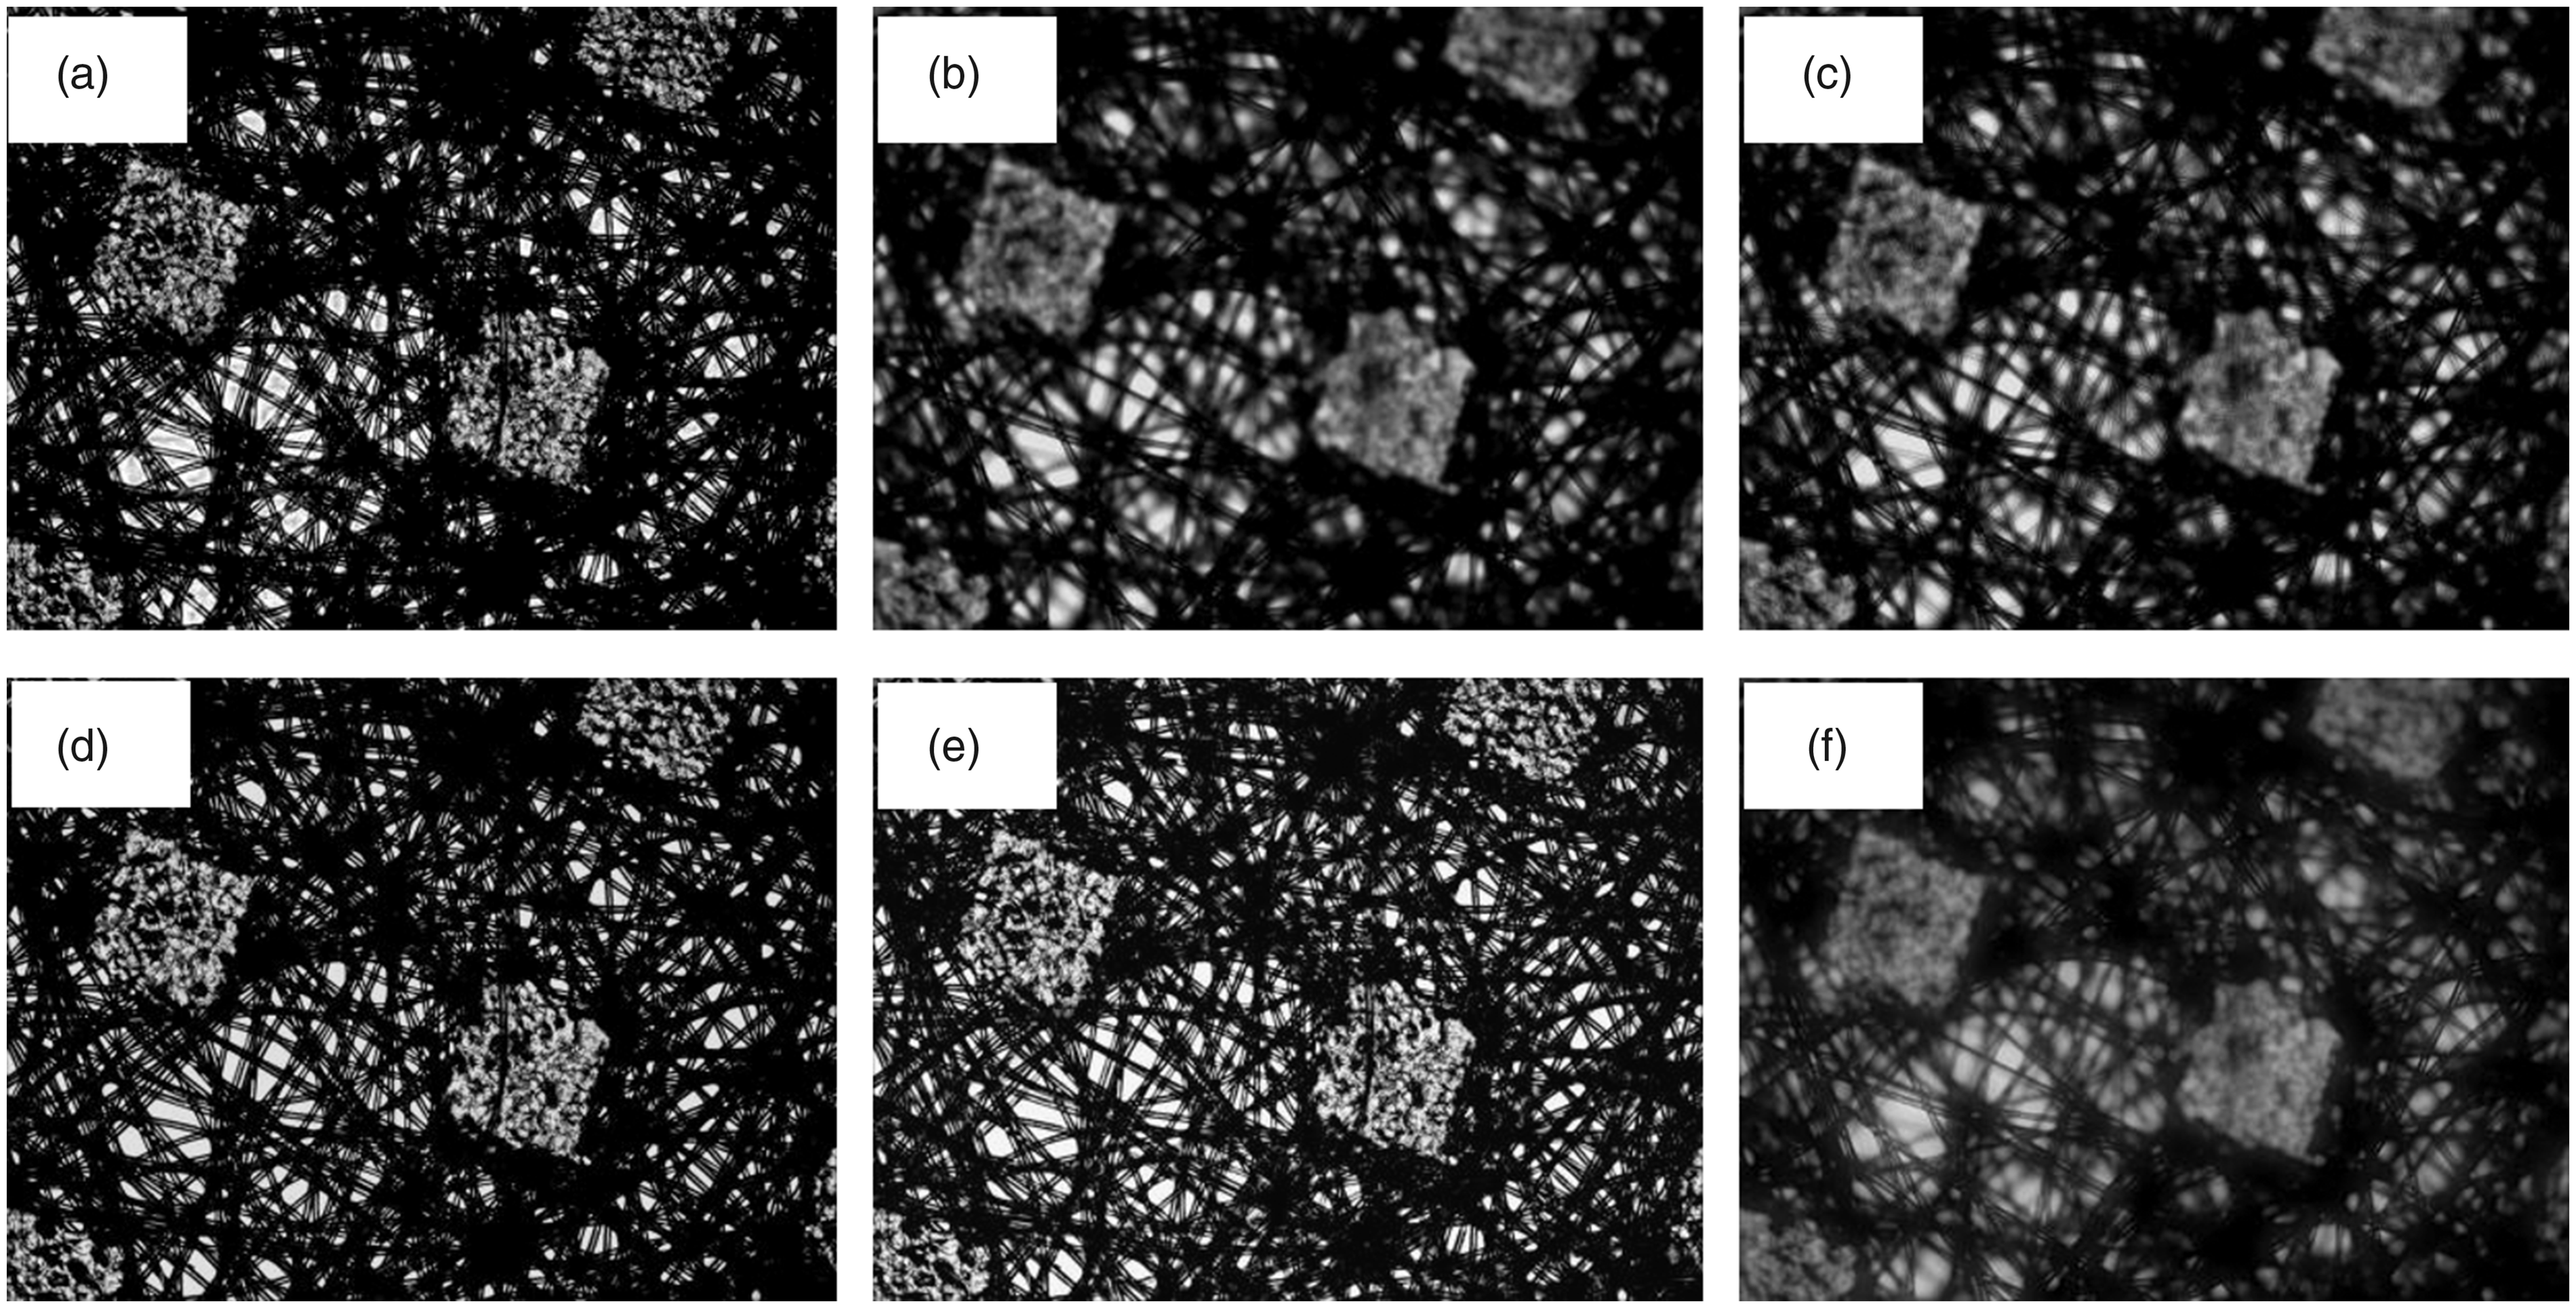
Experiments with other nonwoven fabrics
Different nonwoven samples can be well fused by the multiwavelet algorithm described in this article. One of the single focus images for each sample and its fused image are given in Figure 8. Comparing these, it is easy to see the obvious improvement in the clarity of the fused image.
Comparison of the original and fusion effect diagrams of six samples: Sample I: a mixture of polypropylene (PP) and polyethylene terephthalate (PET), 25 g; sample II: PET, 30 g; sample III: PP, 30 g; sample IV: anti-aging, 30 g; sample V: fire retardant, 30 g; and sample VI: a mixture of PP and PET, 27 g. Panels (a), (b), and (c): original image of samples I (f25w), II, and III; panels (d), (e), and (f): fused image of samples I (f25w), II, and III; panels (g), (h), and (i): original image of samples IV, V, and VI (f27w); panels (j), (k), and (l): fused image of samples IV, V, and VI (f27w). The fused images are compared with the six original images, it is found that in the original image the fiber is not clear enough to be used as the basis for subsequent measurement of fiber diameter and orientation, while the fused image is acceptable.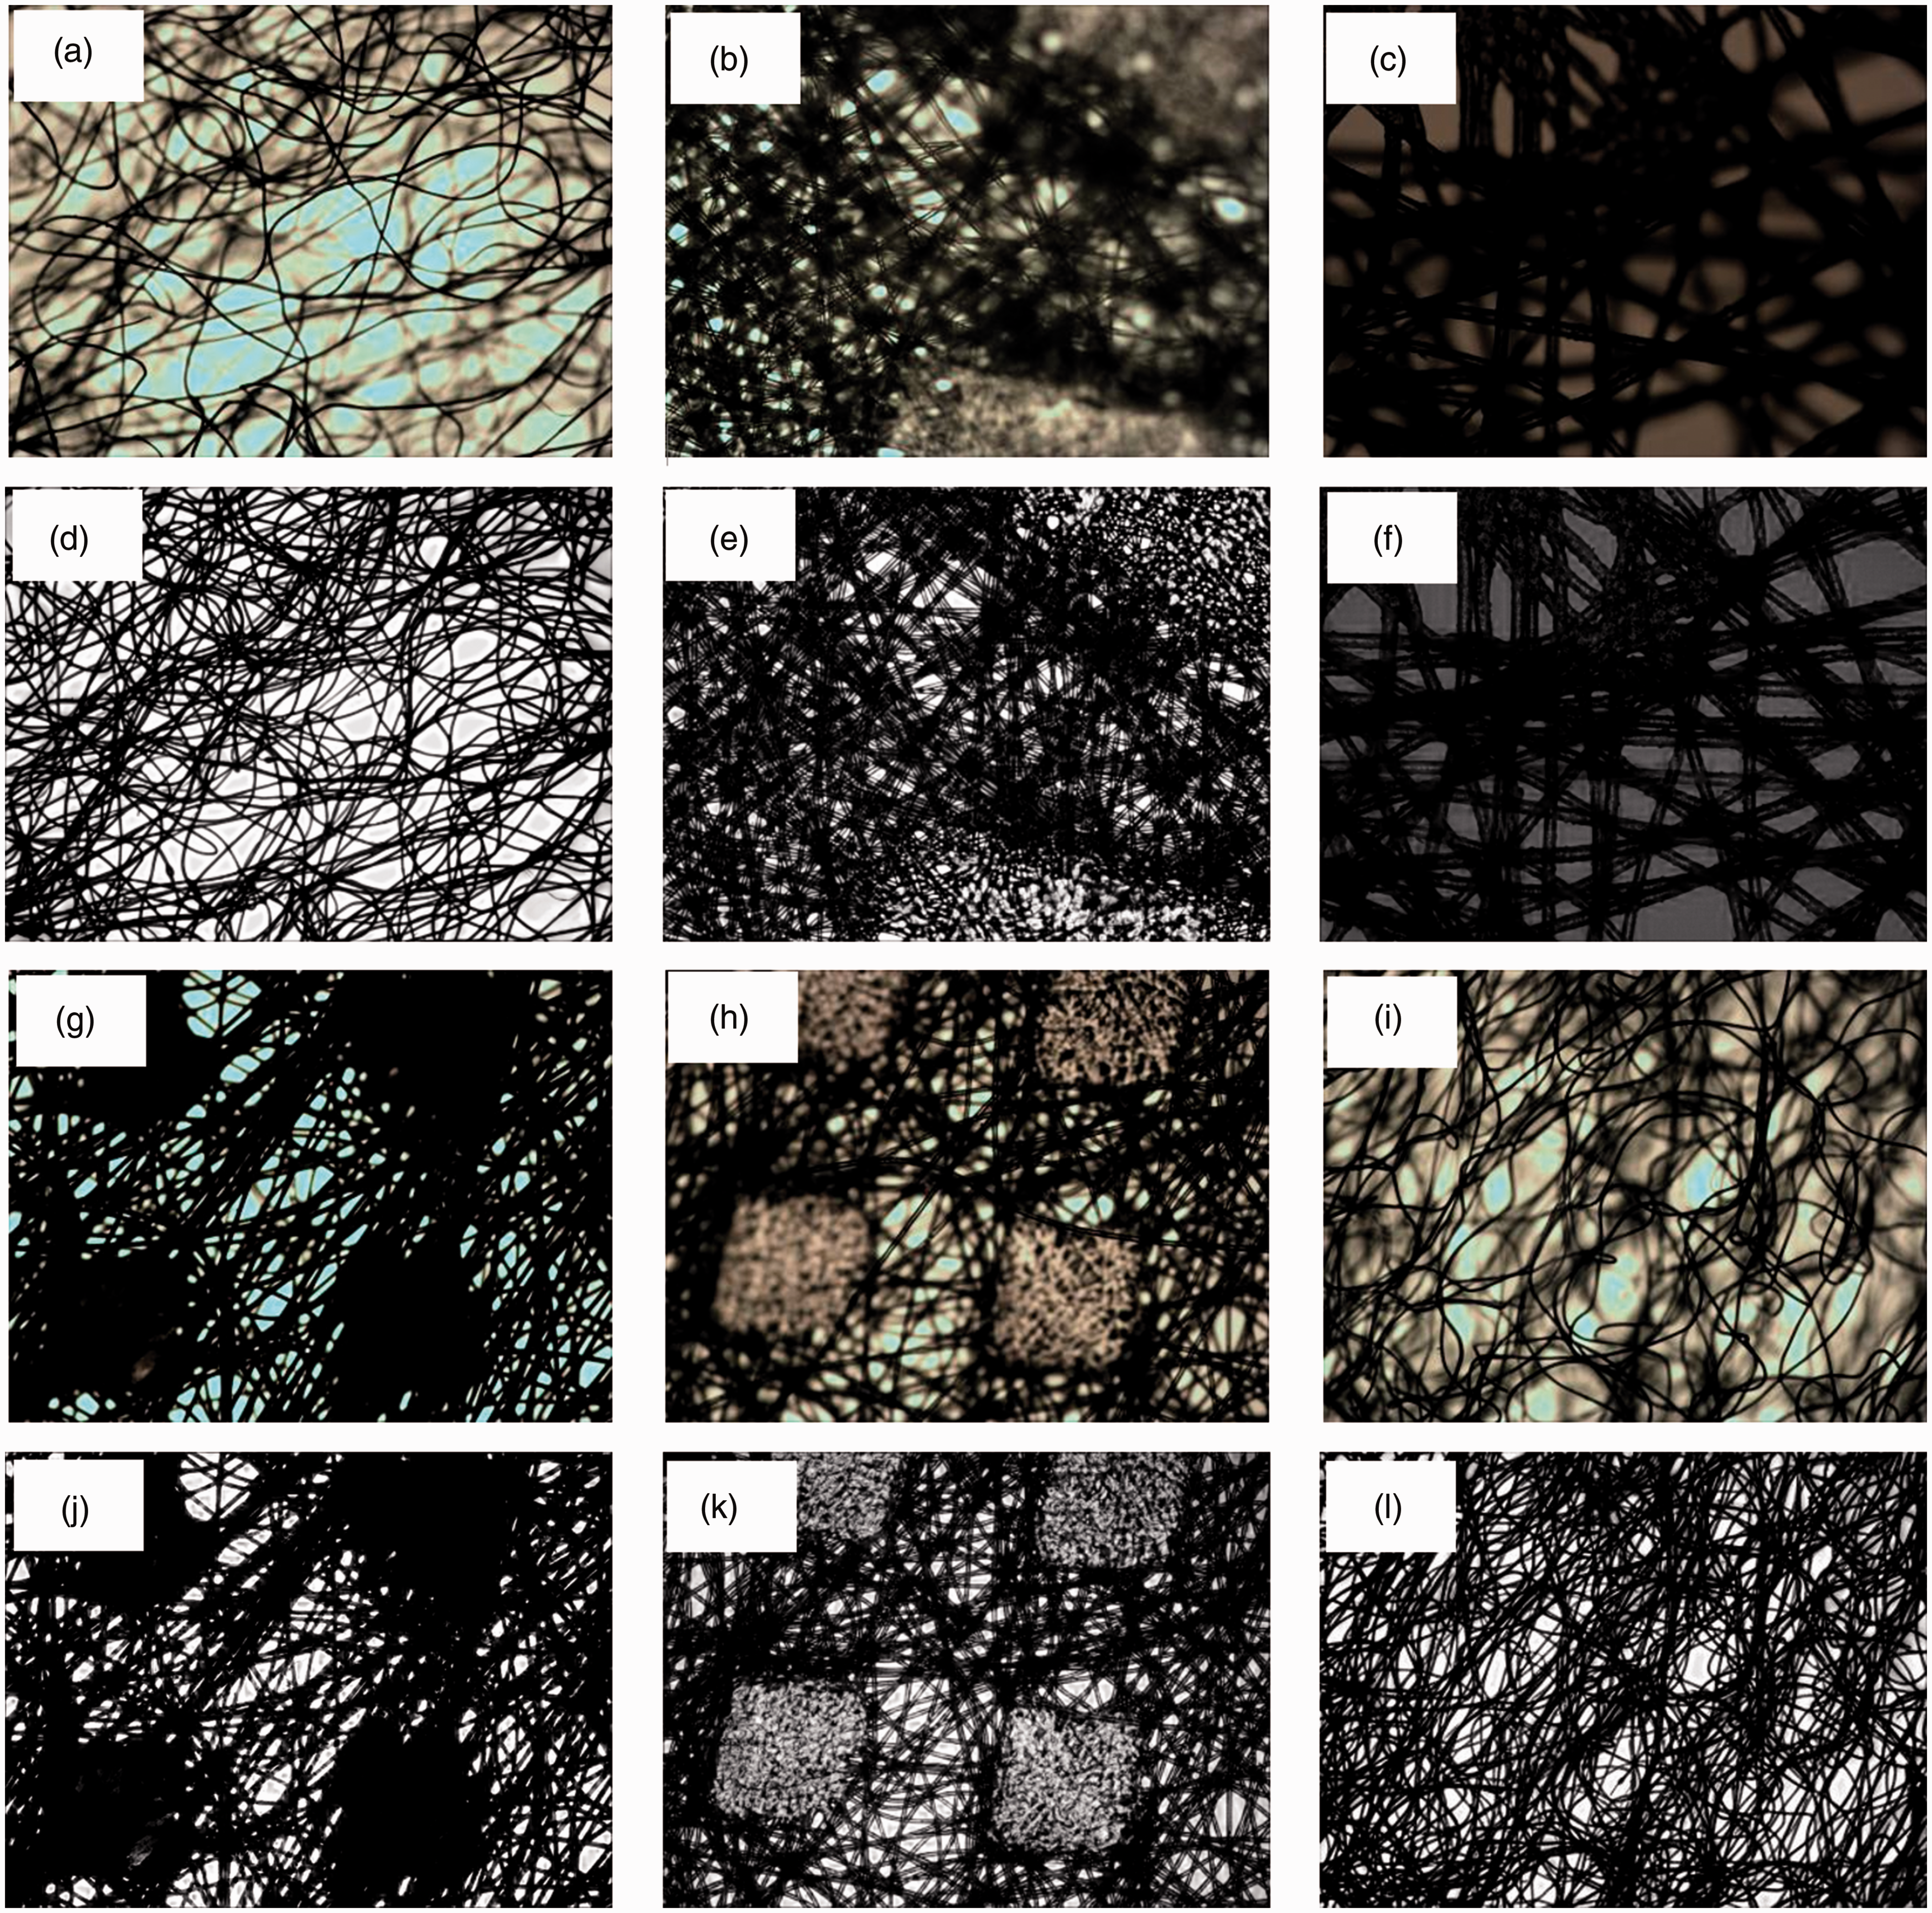
Conclusions
In this article, multiwavelet based fusion algorithm is used to merge multi-focus image sequences of nonwovens. Different fusion rules are designed and used for the sub-images decomposed at different frequencies, to achieve the final merged image. Compared with a single focus image, the accuracy of fiber thickness measurement can be greatly improved by using the image fusion technology. Our experimental results show that the image obtained can be fused directly without preprocessing, the computing cost of the fusion algorithm is relatively reduced, so improving the efficiency of the image analysis. The new research presented in this article provides a new and efficient method for the future morphological analysis and structural measurement of nonwovens.
Footnotes
Declaration of conflicting interests
The authors declared no potential conflicts of interest with respect to the research, authorship, and/or publication of this article.
Funding
The authors disclosed receipt of the following financial support for the research, authorship, and/or publication of this article: The project is sponsored by the Shanghai Natural Science Foundation (18ZR1416600), SUES (Shanghai University of Engineering Science) Talents action program (2017RC432017), and National Natural Science Foundation (61876106), SUES research project (2018xk-B-09).