



Abstract
This paper outlines research on polyurethane (PU) nanowebs with enhanced electrical conductivity by applying single-walled carbon nanotubes (SWCNTs) with silver nanowire (AgNW) for use as a textile sensor. The objectives of this study are as follows: (1) to find out how electrical conductivity changed as the amount of SWCNT dispersion increased; (2) to investigate how electrical conductivity improved as the amount of AgNW dispersion increased; (3) to examine the effect of heat post-treatment and ethanol pre-treatment on the conductivity; and (4) to characterize the surface and chemical properties to verify whether the specimens were successfully treated with SWCNTs and AgNW. The PU nanoweb was treated with three different amounts of SWCNT dispersion by using the dip-coating method, and three different amounts of AgNW dispersion was mixed with SWCNT dispersion to increase electrical conductivity. The electrical resistance was analyzed by four-point probe equipment. The surface and chemical properties were characterized by field emission scanning electron microscopy, high-resolution X-ray diffraction, Raman, and Fourier transform infrared spectroscopy analysis. As a result, the resistance decreased when the amount of SWCNT dispersion increased. However, the resistance increased as the amount of AgNW dispersion increased. After the heat and ethanol treatments, the resistance reduced rapidly so that specimens SA1-H, SA1-E, and SA1-HE had much lower resistance. The results of surface and chemical properties showed that the SWCNT and AgNW formed electrical networks, which might improve electrical properties. Also, it confirmed the presence of the SWCNT and AgNW, which meant that the conductive materials were successfully coated on the PU nanoweb.
Smart clothing has lately evolved in response to the significantly increasing demand for wearable devices in the emerging hyper-connected society. As wearable technologies have been developed,1,2 smart textiles have become one of the most important topics in the field of smart clothing for bio-monitoring, including electrocardiography (ECG), electromyography (EMG), electroencephalography (EEG), electrical impedance tomography (EIT), blood pressure, movement, gesture, and respiration. Bio-monitoring textile sensors have attracted much attention with the advance of smart textiles. Electronic textiles (E-textiles) are highly interdisciplinary, combining textile science, design, electrical, chemical, and biomedical engineering. Current E-textiles mainly concentrate on smart sensing functionality, so the development of smart textile sensors is essentially required to detect electrophysiological signals, such as heart rate. Materials employed in the development of textile sensors have mainly focused on metallic yarns and fibers, such as copper and silver, combined with techniques in nanotechnology.3–9 Recently, however, a variety of non-metallic materials have been employed, including graphene, carbon nanotubes (CNTs), and intrinsically conductive polymers (ICPs).8–16
Many studies have searched for alternatives to overcome the limitations of the currently developed textile sensors and, in particular, diverse conductive materials have been used, not being restricted to just one material type.17–21 Electrically conductive nanomaterials can be usually classified into two categories: metallic and non-metallic materials. The synergistic effects of metallic and non-metallic nanomaterials are expected; thus, this study introduced electrical conductivity in textiles by using a mixture of carbon nanomaterials and metallic nanomaterials. CNTs are widely used to introduce electrical conductivity to textiles. Due to their outstanding electrical performance (e.g., high electrical conductivity) over other non-metallic conductive materials,8–12 CNTs have been considered as a filler material. Almost all the properties of single-walled carbon nanotubes (SWCNTs), including their electrical conductivity and strength, are superior to those of multi-walled carbon nanotubes (MWCNTs) and are considered suitable characteristics for electronic textiles.22,23 Silver nanowire (AgNW) has also recently been used because of its outstanding conductivity and simple treatment process. 8
Nanoweb is a nonwoven, consisting of randomly positioned nanofibers. To impart the enhanced electrical conductivity on the textiles, there have been attempts to apply conductive materials to the nanoweb, and it makes the efficiency of sensors increase thanks to its high surface-to-volume ratio24,25; for instance, the skin–electrode interference improves and the contact resistance may reduce, and also noise or motion artifacts as well. 26 While there are many types of nanofibers with different polymer structures, polyurethane (PU) is one of the most commonly utilized materials due to its availability and outstanding flexibility. Therefore, this study aims firsty to examine the effect of the amount of SWCNT dispersion on the electrical conductivity of PU nanoweb, second to find the effect of the amount of mixture of AgNW dispersion on the electrical conductivity of PU nanoweb, third to investigate how electrical conductivity improves with post-treatment (heat) and pre-treatment (ethanol), and finally to analyze the surface and chemical properties of the SWCNT/AgNW-treated PU nanoweb. This study is expected to be a meaningful and significant research on the PU nanoweb treated with the SWCNT and AgNW to impart electrical conductivity in textile sensor applications, because there have been lack of studies on the CNT/AgNW or AgNW applied to textiles including nanofiber or nanoweb.
Experimental details
Materials
Specifications of the polyurethane (PU) nanoweb


Chemical structures of polyurethane and field emission scanning electron microscopy (×1000) image of polyurethane nanofibers.
Sample preparation
First, to find out the most appropriate coating method, the PU nanoweb was treated by the SWCNT dispersion via three different coating methods: brush-painting, dip-coating, and pour-coating. The PU nanoweb was cut to 10 cm × 10 cm and 5 g of the SWCNT dispersion was used.
In the brush-painting process (Figure 2(a)), the PU nanoweb was laid on top of the PVC film and the SWCNT dispersion was applied onto the PU nanoweb with a flat painting brush, and this was repeated three times to cover the surface uniformly. In the dip-coating process (Figure 2(b)), the PU nanoweb was dipped in the SWCNT dispersion for 10 min in a glass bath to have a complete adsorption of the dispersion. In the pour-coating process (Figure 2(c)), the dispersion was poured onto the PU nanoweb from the center to each edge. In addition, the specimen, which was laid on top of the PVC film, was tilted at 20° toward each edge for 5 s each so that the dispersion spread to the edges and uniformly covered the surface. After the coating processes, the three specimens treated with SWCNT dispersion were fully dried at 21℃ for 24 h.
Schematic of the coating process: (a) brush-painting; (b) dip-coating; (c) pour-coating.
To find the best coating method, the electrical sheet resistance of the specimens was measured by using a four-point probe. Based on the results, the dip-coating process was chosen because the specimens treated by the brush-painting and the pour-coating methods did not show any conductivity. This implied that the methods were not suitable for the SWCNT dispersion applied to the PU nanoweb. Kim et al. 8 reported that the pour-coating method was suitable for the AgNW dispersion applied to the PU nanoweb. According to a previous study of graphene paste, 15 the doctor-blading method was suitable because the sheet resistance of the specimens decreased from 150 to 117 Ω/sq. Thus, it turned out that the coating method would be applied differently depending on the type of conductive materials.
Treatment conditions of the specimens

SWCNT: single-walled carbon nanotube; AgNW: silver nanowire.
To investigate the effect of AgNW dispersion on electrical conductivity, three different amounts of AgNW dispersion were added to 15 g SWCNT dispersion: 5, 7.5, and 10 g m−2. In addition, the AgNW dispersion and SWCNT dispersion were mixed, and the 10 cm × 10 cm cut specimens were each dipped in the SWCNT/AgNW dispersion for 10 min in a glass bath to adsorb enough dispersion. After 10 min, the specimens were taken out and dried at 21℃ for 24 h. As presented in Table 2, the specimens were named SA1, SA2, and SA3.
To investigate the effect of heat treatment on electrical conductivity, the temperature and duration of heat treatment were chosen as variables. The specimen was usually treated at around 500℃ for a short time to improve electrical conductivity. However, in this study, the physical property of the specimens was damaged and they even melted under high temperature, making them unsuitable for textile applications. Thus, several trials were conducted to find the optimal conditions. Accordingly, the temperature and time combination were set up at 50℃ for 24 h. The heat treatment was conducted by using a vacuum oven (Jeio Tech Lab Companion, Republic of Korea). The specimens were named SA1-H, SA2-H, and SA3-H, as given in Table 2.
To examine the effect of ethanol pre-treatment on the electrical conductivity, the specimen was treated with ethyl alcohol before the conductive dispersion treatment. The untreated PU nanoweb was dipped in a bath containing 5 g of ethyl alcohol for 10 s. After this, the specimen was taken out using tweezers and the ethanol-treated specimen was dipped in another bath containing the SWCNT/AgNW dispersion. The specimens were named SA1-E, SA2-E, and SA3-E, as given in Table 2.
To examine the effect of heat and ethanol treatment on the electrical conductivity, the PU nanoweb was treated with both heat and ethanol treatments. The specimens were named SA1-HE, SA2-HE, and SA3-HE, as given in Table 2. A total of 15 specimens were prepared for this study; the process of the specimen preparation is presented in Figure 3.
Schematic of specimen preparation. SWCNT: single-walled carbon nanotube; AgNW: silver nanowire.
Electrical resistance test
After coating the PU nanoweb with the conductive dispersion, the sheet resistance was measured by using a four-point probe (CMT-SR1000N, AIT Co., Ltd, Korea) at the 0.01 mA range. Before measuring the electrical resistance of the specimens, the resistance of a sample (VLSI Standard wafer) was measured to calibrate the four-point probe system. The Correction Factor (C factor) was set up at a 0.45 value to automatically measure the sheet resistance by using the four-point probe. The operating environment was set up as follows: temperature at 23° ± 1℃; relative humidity 30–70%. The electrical properties of the specimens were repeatedly measured five times.
Microstructure and morphology of the coated specimens
FE-SEM (JSM-6701F, JEOL Ltd) was used to inspect the changes surface appearances of the specimens after treatment.
Characterization of the coated specimens
High-resolution X-ray diffraction (HR-XRD) analysis was carried out on an XRD diffractometer (SmartLab, Rigaku) with Cu Ka radiation. The scanning was performed in the range of 2θ = 20–80° with a step of 0.02° and 2 s/step to examine the presence of SWCNTs and AgNW. 27 In addition, Raman analysis is the most powerful tool for nondestructive analysis and is usually used to analyze carbon content and relative amounts of carbon impurities. 28 In this study, to verify whether the specimens are treated with SWCNTs and AgNW successfully, Raman spectra were collected using a Raman spectrometer (LabRam Aramis, Horriba Jovin Yvon). A Raman shift spectral range of 1200–2000 cm−1 was obtained by using 532 nm laser excitation and exposition time of 60 s. Fourier transform infrared spectroscopy (FT-IR) spectra were recorded on a FT-IR spectrometer (Vertex 70, Bruker) by using the attenuated total reflectance (ATR) technique. The spectra were all scanned at a resolution of 0.4 cm−1, range from 500 to 4000 cm−1, to investigate effect of heat and ethanol treatments on the chemical structures of PU, SWCNTs, and AgNW.
Results and discussion
Electrical resistance with respect to the concentration of conductive materials
Electrical sheet resistance of the specimens
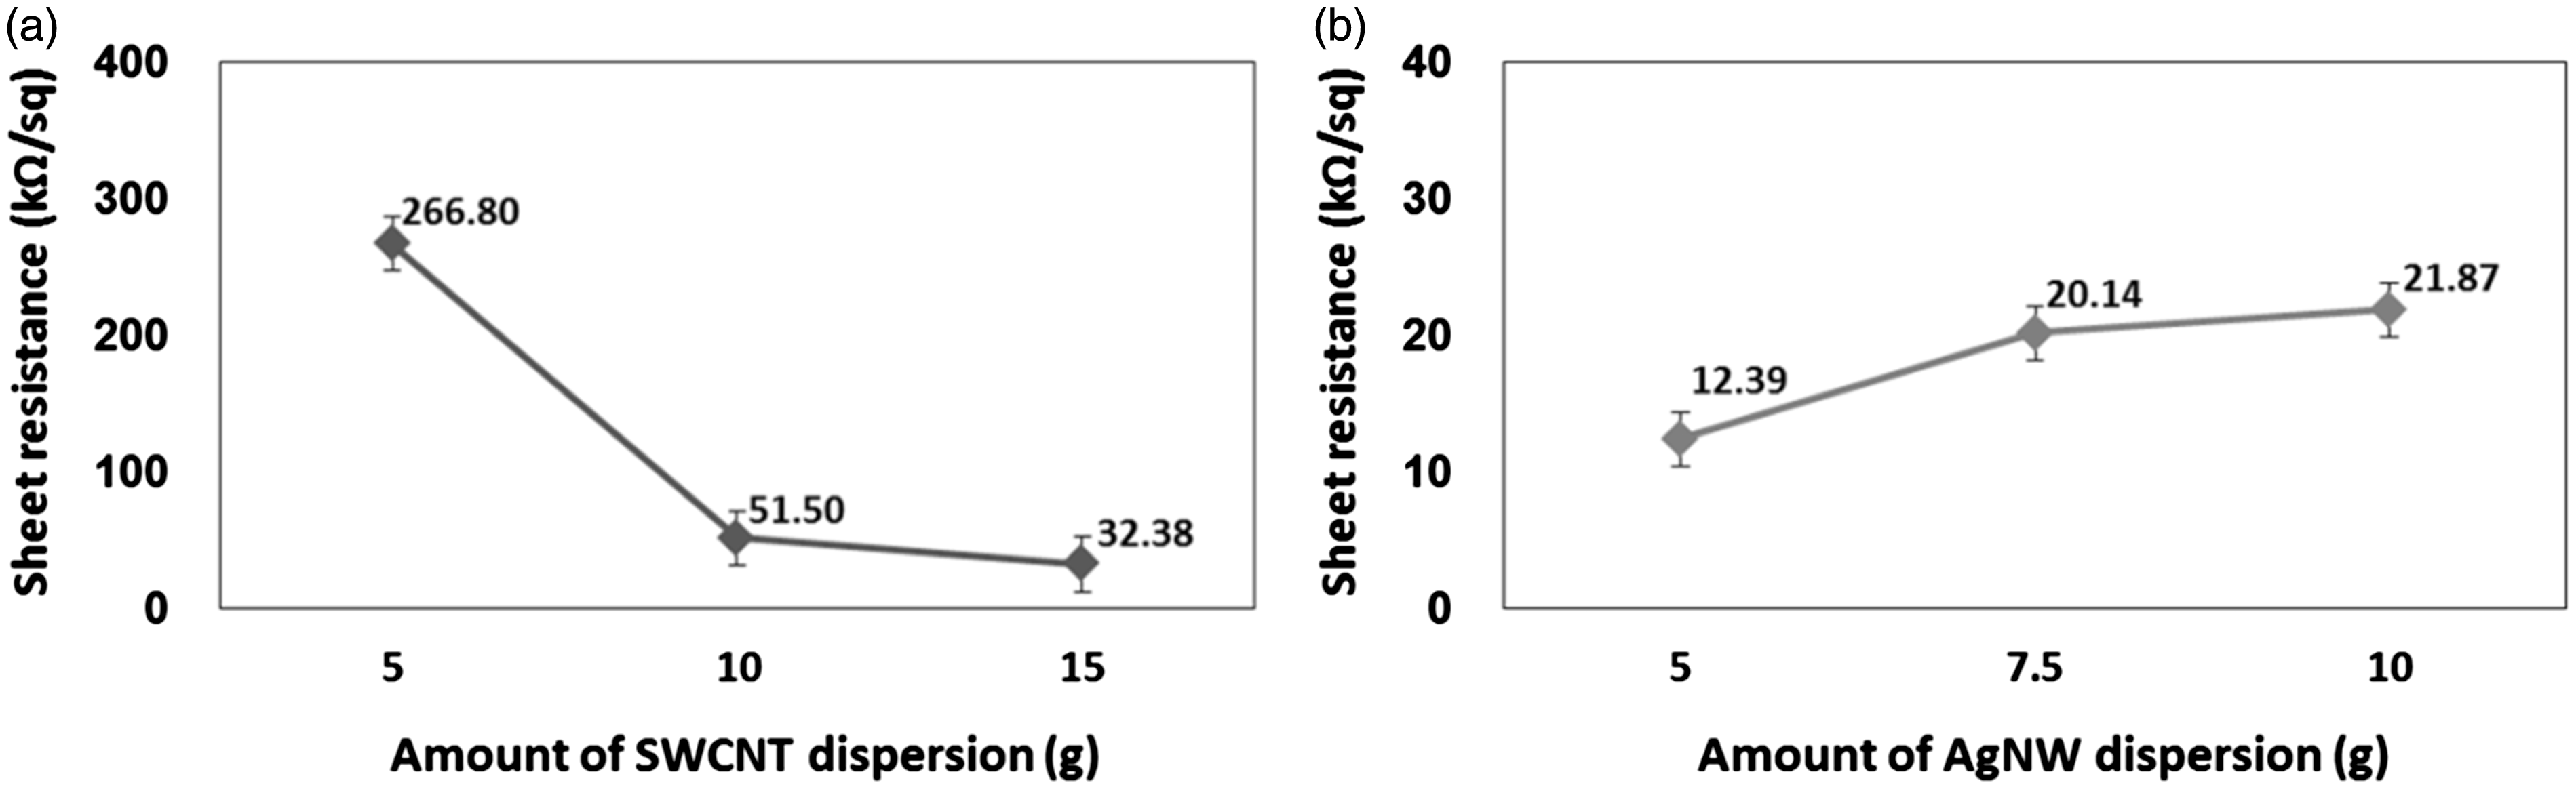
Changes of electrical sheet resistance: as the amount of single-walled carbon nanotube (SWCNT) dispersion increased (a); as the amount of silver nanowire (AgNW) dispersion increased (mixing with 15 g of SWCNT dispersion) (b).
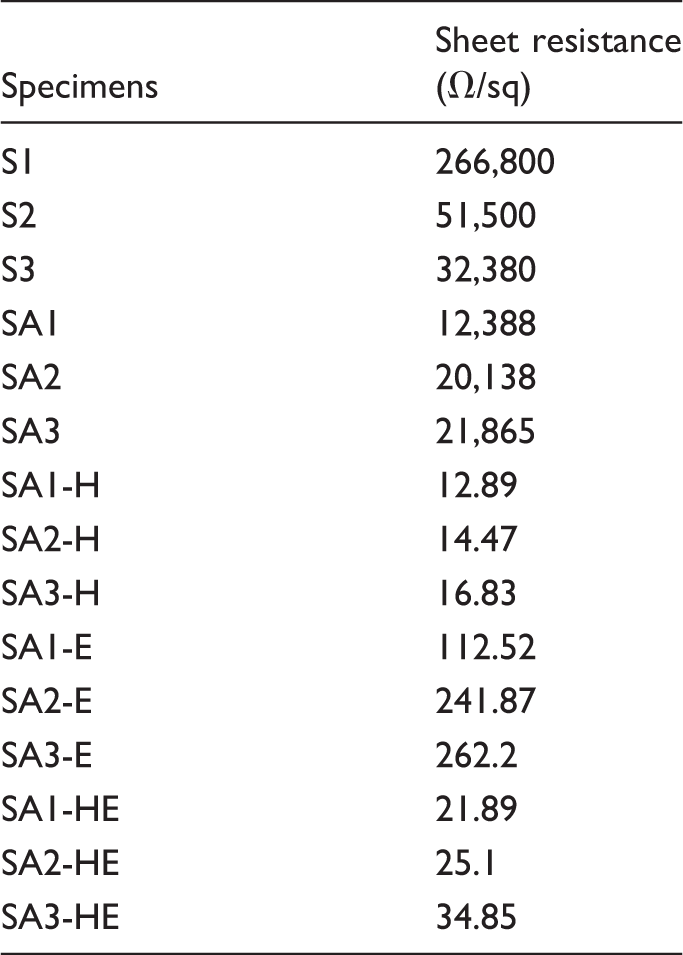
To find the effect of the amount of mixture of AgNW dispersion (5, 7.5, 10 g m−2) and SWCNT dispersion (15 g m−2) on the electrical conductivity of the PU nanoweb, the electrical sheet resistance of specimens SA1, SA2, and SA3 showed lower values than those of S1, S2, and S3 (Table 3 and Figure 4). The specimens had lower resistance values than those of S1, S2, and S3; however, as the amount of AgNW dispersion increased, the resistance also increased from 12.39 k to 21.87 k Ω/sq. The result that specimen SA3 showed the highest and specimen SA1 showed the lowest sheet resistance meant that specimen SA1 turned out to have the best conductivity. This might be related to add-on, which is the amount of SWCNT/AgNW applied when the textile is coated.
29
The add-on can be calculated from the change of weight before/after treatment (or coating). The formula of the add-on is as follows

Add-on of the specimens

PU: polyurethane.
Also, the add-on might be affected by the coating methods. There are many methods for applying CNTs and AgNW to impart electrical conductivity, including dip-coating, brush-painting, and doctor-blading. Different coating methods are applied based on various coating conditions, such as type and concentration of conductive material, type of textile, temperature and time of heat treatment, and number of coatings. 32 It is important to choose the optimum coating method because it reduces the resistance of the conducted specimen by using the least amount of conductive material, which results in the least material cost. In this study, dip-coating was chosen because it was the simplest method to immerse textiles in the conductive material dispersion.11,15 Although dip-coating was suitable for the carbon 11 and the silver 33 nanomaterials, the resistance of the mixture of SWCNT and AgNW dispersion did not decrease as the amount of AgNW dispersion increased. Due to the Van der Waals force of the nanoparticles and the surface energy of the nanoweb, the SWCNTs and AgNW did not adhere to the surface of the nanoweb, which was why the add-on decreased although the amount of AgNW increased. Therefore, the electrical resistance of the specimens increased although the amount of AgNW dispersion increased.
Change in electrical resistance after heat and time combination and ethanol treatments
After the heat treatment, the sheet resistance of the specimens decreased drastically from several K to tens Ω/sq, as presented in Table 3. The results showed that the specimens improved the electrical conductivity, because the water solvent was fully evaporated and dried by the heat treatment, and the results showed that the electrical resistance of the specimens highly decreased. This might be explained relating to the microscopic surface appearance discussed in this section. After heat treatment, SWCNTs and AgNWs generated numerous SWCNT/AgNW networks on the surface of the PU nanoweb, and each network functioned as a small electrical circuit at the micro-scale. 8 Therefore, the heat post-treatment affected the enhanced electrical conductivity so that the resistance of specimens SA1-H, SA2-H, and SA3-H rapidly decreased.
After the ethanol treatment, the sheet resistance of the specimens also decreased from several K to hundreds Ω/sq, as presented in Table 3. Because the ethanol was used as a kind of surfactant, the ethanol pre-treatment made a van der Waals interaction of CNTs, resulting in aggregation as well as the surface energy of the PU nanoweb lowering, in accordance with the results of Ahn et al.
5
The PU nanoweb has poor wettability due to its large surface tension. Its contact angle increases and it develops a hydrophobic surface because the nanoweb consists of individual fibers that reach hundreds of nanometers. This is why the conductive dispersion could not spread on the surface and immerse into the fibers. So, the nanoweb was treated with ethanol pre-treatment not only to make the surface energy of the nanoweb lower but also to improve uniformity and conductivity. Therefore, the ethanol pre-treatment also affected the enhanced electrical conductivity so that the resistance of specimens SA1-E, SA2-E, and SA3-E rapidly decreased. As presented in Table 3, SA1-HE, SA2-HE, and SA3-HE also had lower electrical sheet resistance. In each treatment, the electrical sheet resistance of SA1, SA1-H, SA1-E, and SA1-HE had the lowest values; the results are presented in Figure 5.
Electrical sheet resistance of specimen SA1 according to the treatment conditions.
Morphology of the coated nanofibers
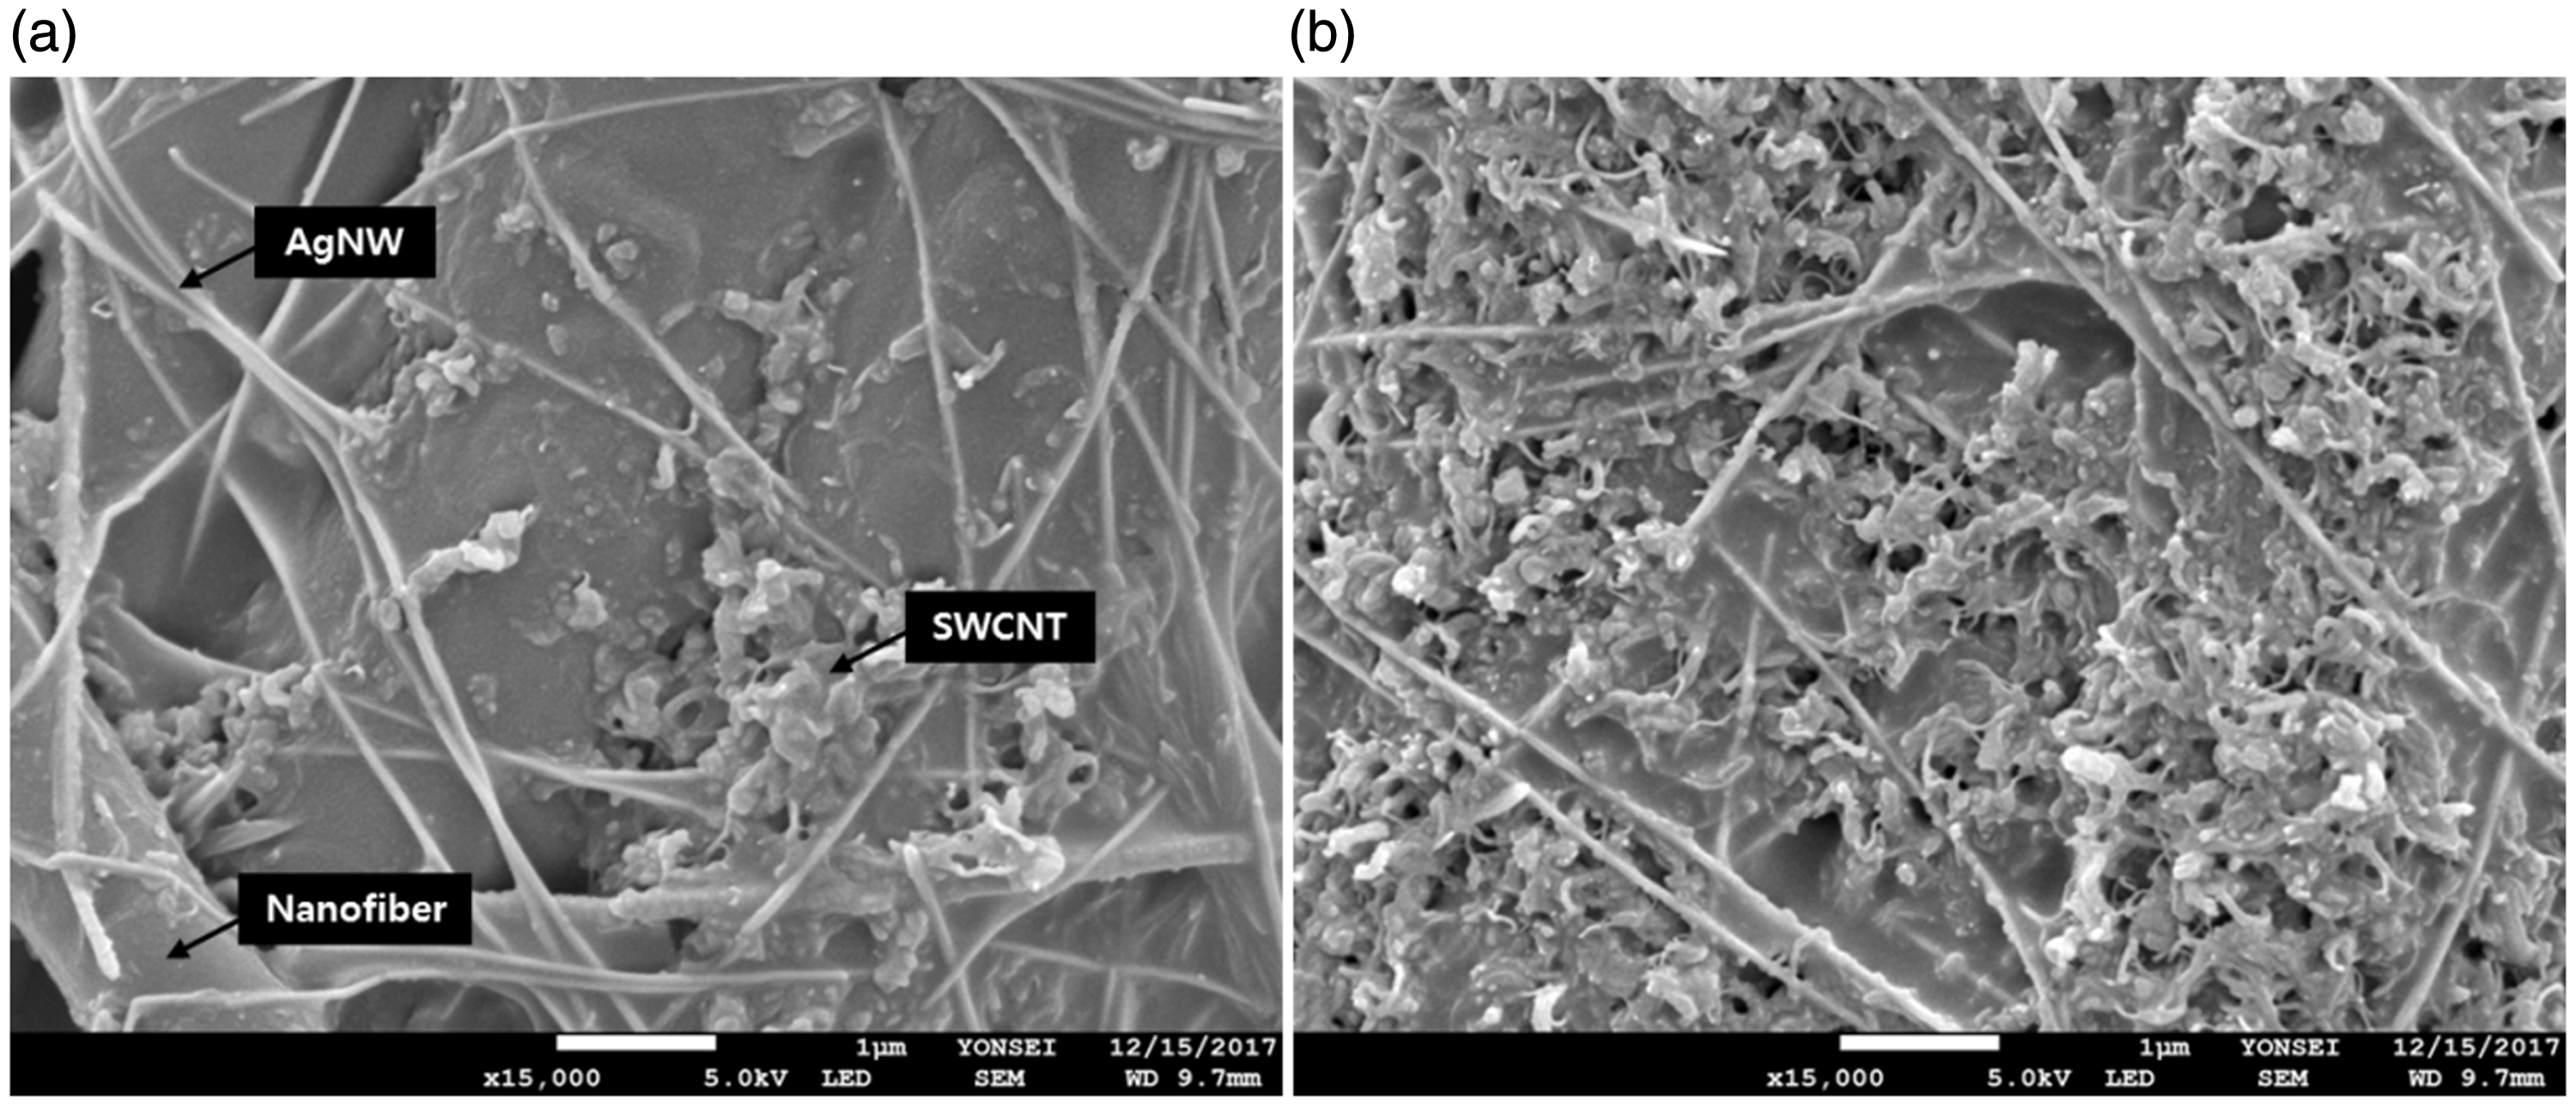
FE-SEM images of the treated specimens are presented in Figure 6. SA1-H, SA1-HE, SA2-H, and SA2-HE showed that the SWCNTs and AgNW formed an electrical network that looked like a film, densely covered on the surface of the PU nanoweb. The results indicated that the specimens treated with heat treatment and ethanol treatment were well immersed uniformly, which might affect lower electrical resistance of the specimens. It was inferred that the SWCNT/AgNW networks were formed onto the web surface with the evaporation of the water and ethanol, and only the conductive materials remained due to the moderate temperature (50℃) of heat. Also, the mechanical properties of the specimens treated with a moderate temperature for a long time (24 h) were expected to be better than those treated with a higher temperature (more than 500℃) for a shorter time. In addition, ethanol treatment helped to increase wettability of the nanoweb, so the SWCNT/AgNW dispersion could spread on the surface and immerse into the fibers. Thus, the heat and ethanol treatment effect on the specimens will result in better electrical conductivity as well as a uniform surface. However, SA3, SA3-H, SA3-E, and SA-HE barely showed the electrical networks, as presented in Figure 6. This indicated that the specimens were not covered with the conductive materials by the dip-coating method. In a higher power observation (Figure 7), SA1 and SA1-H were observed to have many conductive particles attached on the nanofiber.
Field emission scanning electron microscopy (×1000) images of the specimens. Field emission scanning electron microscopy (×15,000) images of SA1 (a) and SA1-H (b). AgNW: silver nanowire; SWCNT: single-walled carbon nanotube.
In summary, SA1 turned out to have the best conductivity among the three specimens treated with SWCNT and AgNW dispersions. As with the heat and ethanol treatments, the electrical resistance of the specimens decreased. To discuss the effect of the treatments on the specimens, the chemical elements, structures, and properties of specimens SA1, SA1-H, SA1-E, and SA1-HE were analyzed and compared.
HR-XRD analysis of the coated nanofibers
To examine the presence of SWCNTs and AgNW, HR-XRD analysis was conducted. The X-ray diffraction patterns of the specimens were observed as presented in Figure 8. According to the previous studies, PU did not generate peaks under 2θ = 40°.
34
When it came to XRD analysis, the observed diffraction peaks of the SWCNT dispersion were found at 26(100), 32(110), 47(200), 61(211),
35
although the peaks could not be clearly observed, which seemed to be because the material was a liquid type. The peaks of four treated specimens SA1, SA1-H, SA1-E, and SA1-HE were observed at only 2θ = 32(110), which verified the presence of SWCNT.
35
However, the intensity of other peaks, including at 26(100), were diminished and could even barely be observed, which might be due to the defection of the tube wall structure by the heat, alcohol treatments, or both.36–38 Also, the peaks of the treated specimens were observed at 2θ = 38(111) planes of AgNW assigned by using JCPDS card No. 04-0783. Therefore, the presence of SWCNTs and AgNW on the PU nanoweb was confirmed, which indicated that the nanoweb was treated with SWCNTs and AgNW successfully.
High-resolution X-ray diffraction patterns of the specimens. SWCNT: single-walled carbon nanotube.
Raman spectroscopy analysis of the coated nanoweb
To verify whether the specimens were treated with SWCNTs and AgNW successfully, Raman analysis was performed. The Raman spectra of specimens under 532 nm excitation were over the Raman shift interval of 1200–2000 cm−1. The Raman spectra of the untreated and treated specimens are shown in Figure 9. The Raman spectra of the SWCNT dispersion showed the D- and G-bands at ca. 1350 and 1582 cm−1. The untreated specimen (UT) did not show any bands. Compared to the spectra of the UT, the D- and G-bands were observed in the spectra of the treated specimens similar to those of the SWCNT, which confirmed the presence of SWCNTs in specimens SA1, SA1-H, SA1-E, and SA1-HE. However, the peaks of the specimens showed broader D- and G-bands37,39 than those of the SWCNT, which might have been caused by the addition of the AgNWs,
40
and this confirmed that the AgNW was also presented. Therefore, the specimens were treated with SWCNTs and AgNW successfully.
Raman spectra of the specimens. SWCNT: single-walled carbon nanotube.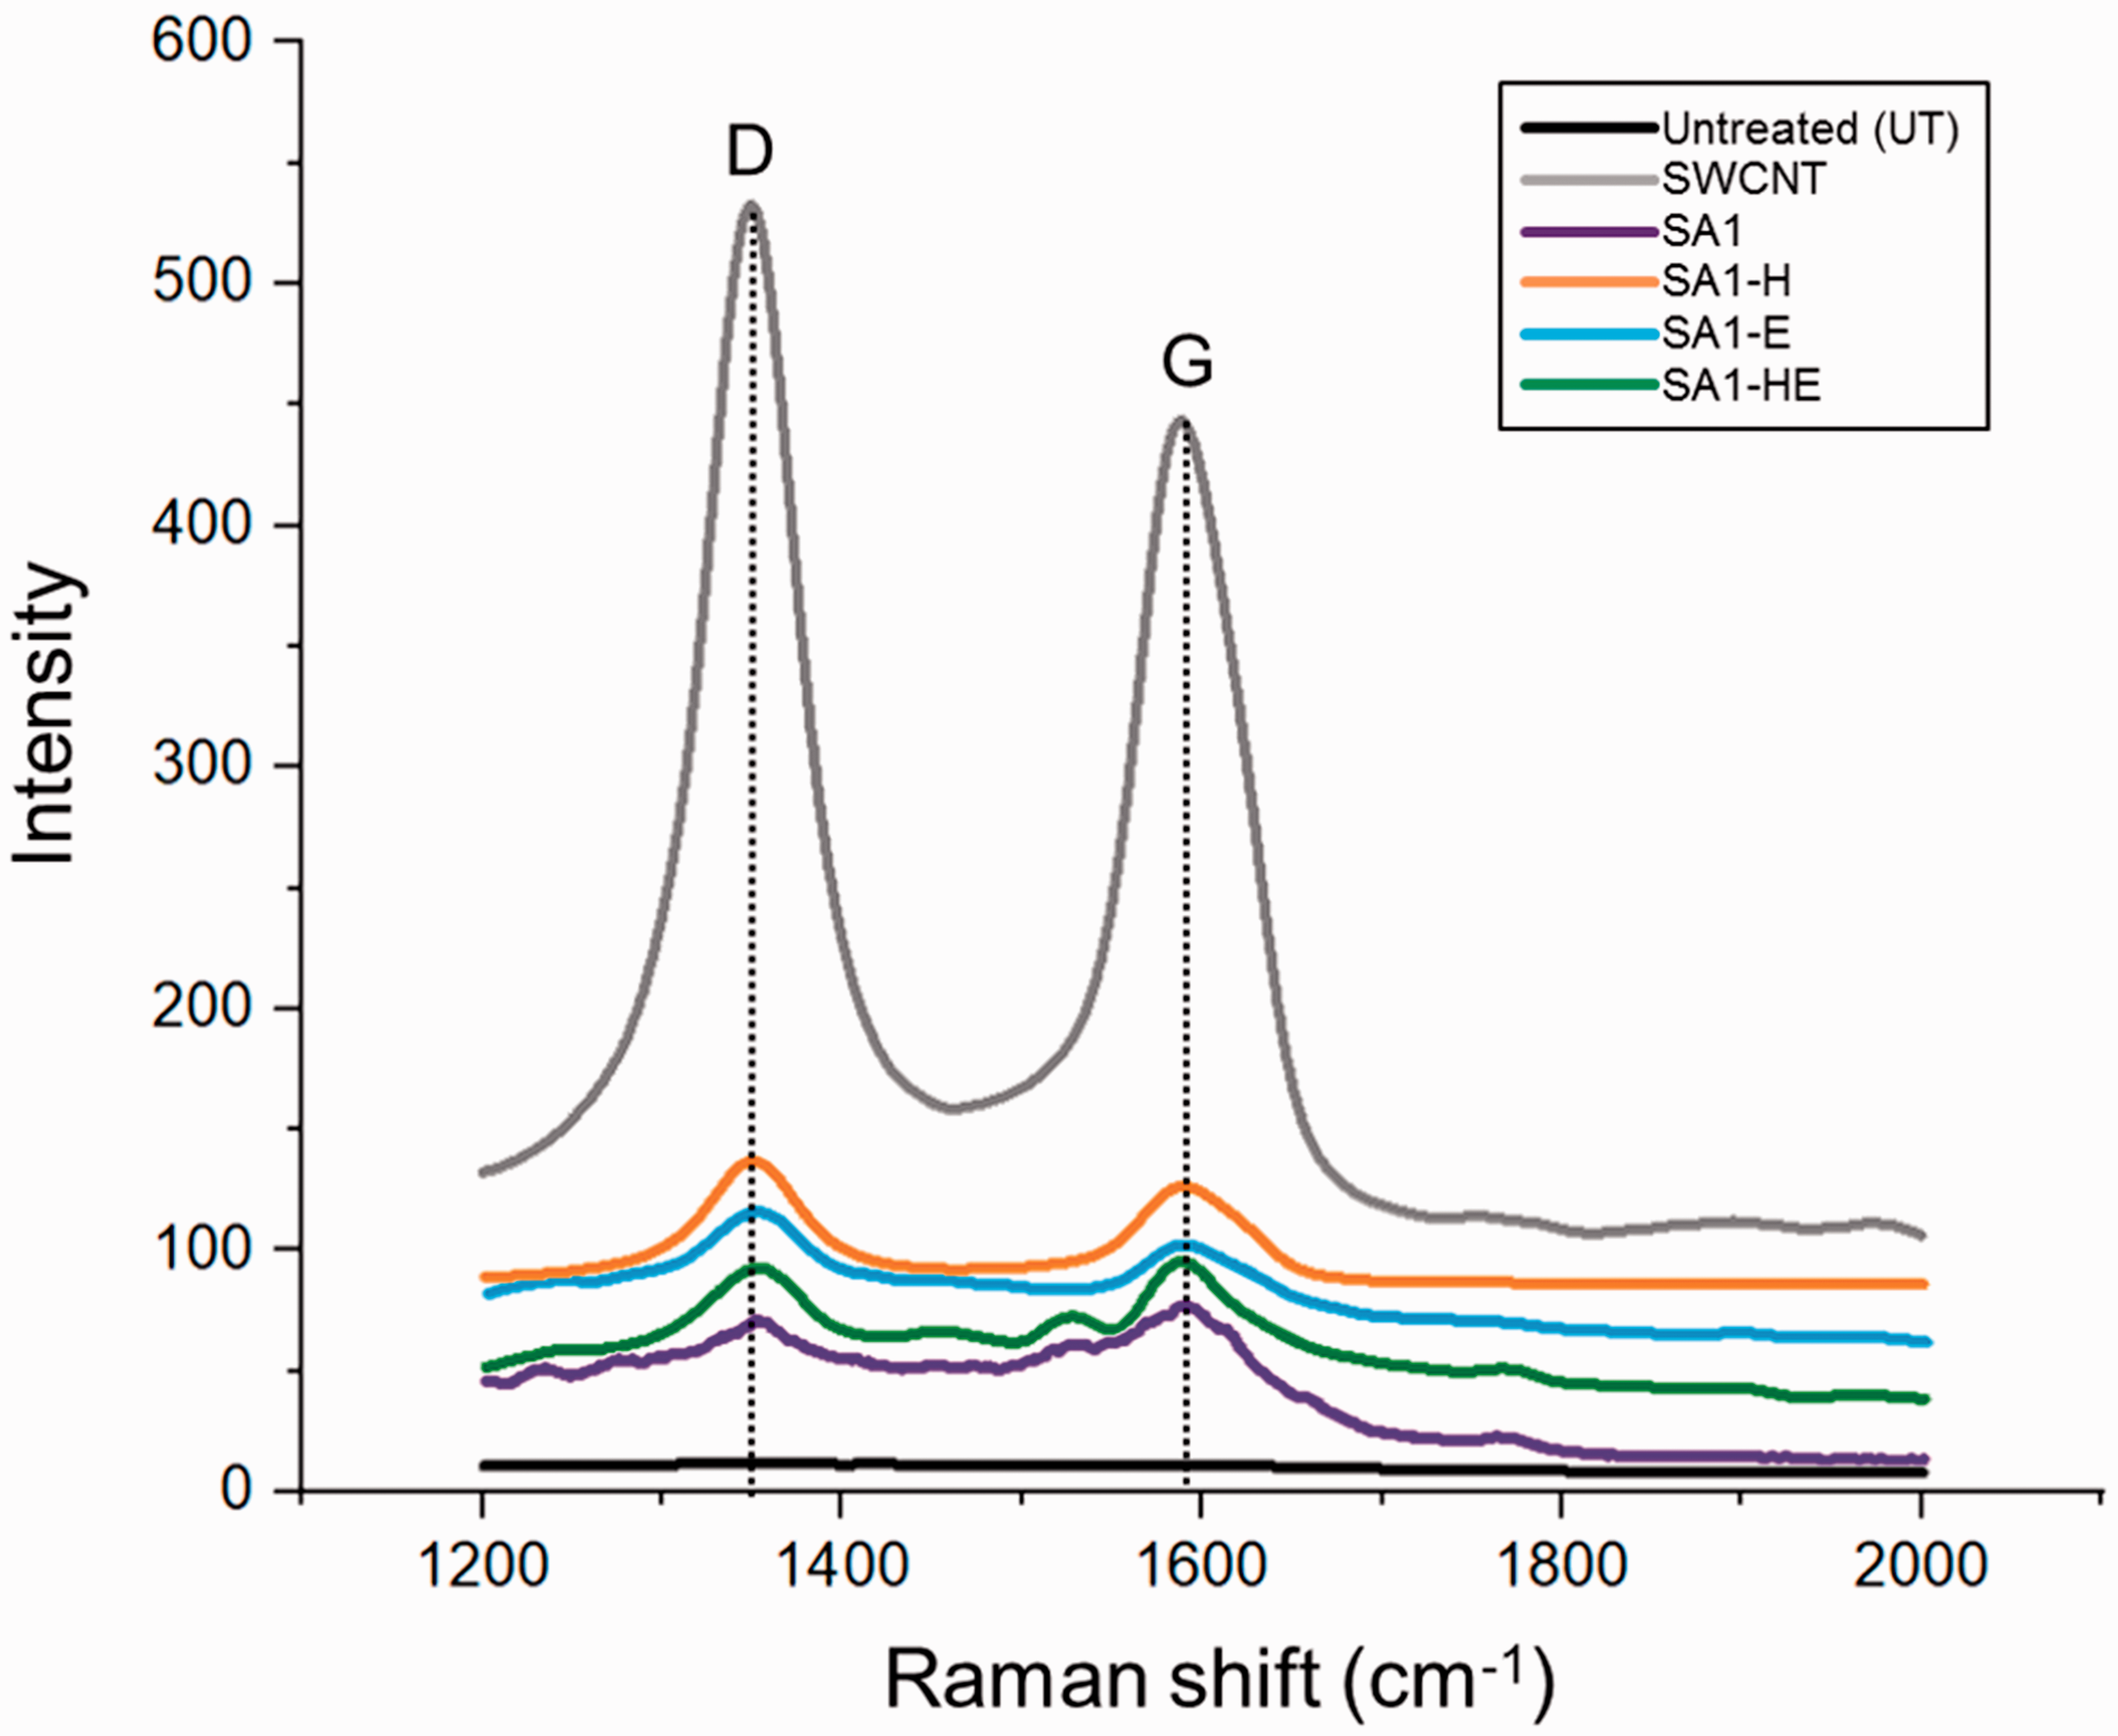
FT-IR analysis of the coated nanoweb
To investigate the effect of heat and ethanol treatments on the chemical structure of PU, SWCNT, and AgNW, FT-IR analysis was carried out. The results of the FT-IR analysis are shown in Figure 10. The characteristic band of the untreated PU nanofiber of the hydroxyl group (-OH) was obtained in the 3338 cm−1 region. The band observed at 2920 cm−1 was attributed to the stretching of the carbonyl group (C-O). Also, the isocyanate group (-NCO) was obtained at 2381 cm−1. The most obvious change is the band position of the hydroxyl group (-OH). Compared to the untreated specimen, the hydroxyl group (-OH) band peak of specimen SA1 was just shifted in the 3852 cm−1 region, but specimen SA1-H showed new peaks at 3749 and 3674 cm−1. Specimens SA1-E and SA1-HE showed that many more new peaks appeared at 3902, 3744, 3675, 3649, and 3566 cm−1. They might have been affected by the heat or ethanol treatment.8,40 In particular, specimen SA1-H seemed to have activated the amorphous regions of its PU structure, due to having been under the moderate heat temperature (50℃) for 24 h. According to a previous study,
16
the transition temperature of the same PU nanoweb used in this study was confirmed to 50℃. As the amorphous regions were activated, there were spaces where the liquid could be permeated into the fibers, and the conductive dispersions were immersed uniformly.
40
This may have affected the electrical conductivity and accordingly the electrical resistance, as discussed previously, was rapidly decreased. In addition, in the case of specimens SA1-E and SA1-HE, their hydroxyl group (-OH) band peaks appeared more with ethanol treatment. Therefore, specimens SA1-H, SA1-E, and SA1-HE had lower electrical resistance because the SWCNTs and AgNW were treated on the PU nanoweb uniformly due to the heat and ethanol treatments.
Fourier transform infrared spectroscopy spectra of the specimens.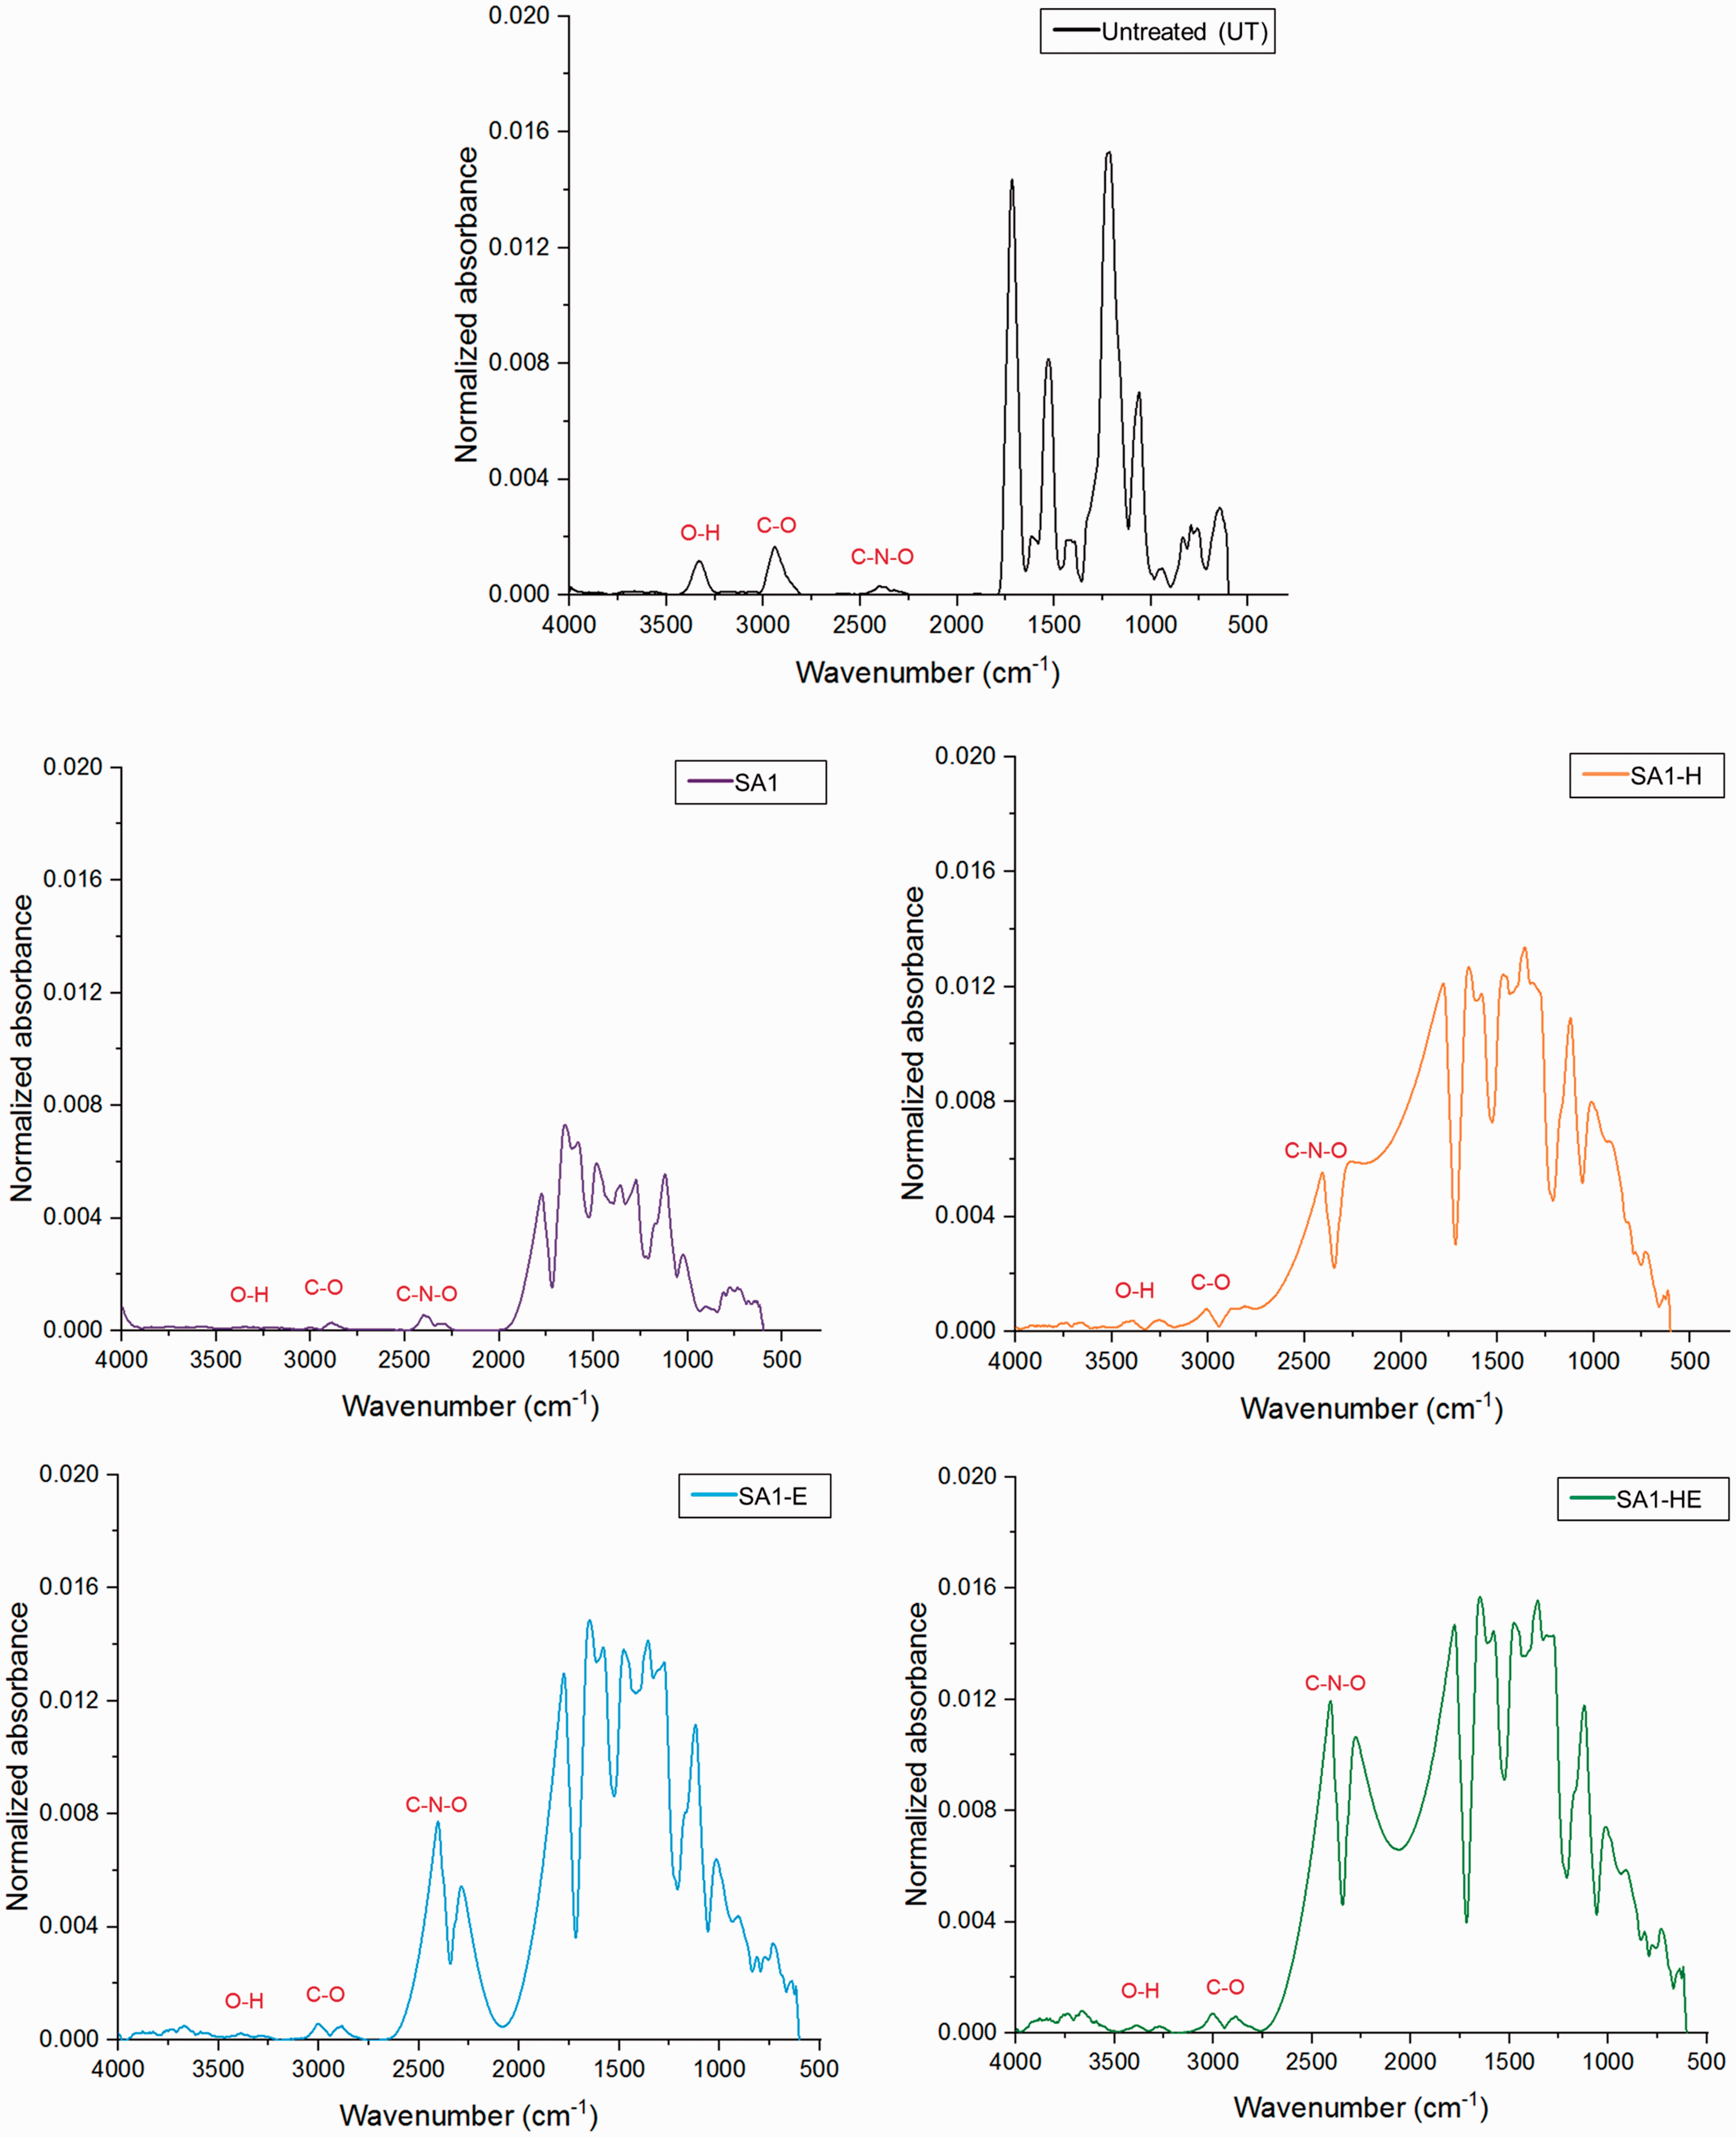
Conclusion
In this study, the PU nanoweb was treated with SWCNT dispersion with AgNW dispersion. For enhanced electrical conductivity, the specimens were also treated with heat post-treatment and ethanol pre-treatment. The electrical, surface, and chemical properties of the specimens were investigated. As a result, the electrical sheet resistance decreased as the amount of SWCNT dispersion increased. However, the resistance was still so high that the AgNW dispersion mixed with the SWCNT dispersion. Although the amount of AgNW dispersion increased, the resistance did not decrease. That was why the add-on of the specimens decreased as the amount of AgNW dispersion increased. After the heat or ethanol treatment, the resistance reduced rapidly. The result of the surface property 41 showed that SWCNTs and AgNW formed an electrical network, covered densely on the nanoweb surface, which may have affected the improved electrical conductivity, especially the specimens treated with heat, ethanol, or both.42–44 The presence of SWCNTs and AgNW on the nanoweb was confirmed by HR-XRD and Raman analysis. Due to the heat and ethanol, the most obvious changes were the band position of the hydroxyl group (-OH), and the SWCNTs and AgNW could be immersed uniformly in the PU nanoweb, which might affect the electrical conductivity of specimens SA1-H, SA1-E, and SA1-HE. In this study, the PU nanoweb was treated with SWCNTs and AgNW to impart the enhanced electrical conductivity. It suggested an important database for development in smart textile applications and explored the applicable potential for bio-monitoring textile sensors, because there is a lack of studies on CNT/AgNW or AgNW applied to textiles including nanofiber or nanoweb.
Footnotes
Declaration of conflicting interests
The authors declared no potential conflicts of interest with respect to the research, authorship, and/or publication of this article.
Funding
The authors disclosed receipt of the following financial support for the research, authorship, and/or publication of this article: This work was supported by the Basic Science Research Program through the National Research Foundation of Korea (NRF) funded by the Ministry of Education, Science and Technology (No. NRF-2016R1A2B4014668) and the Brain Korea 21 Plus Project of the Department of Clothing and Textiles, Yonsei University in 2018. This work was also supported (in part) by the Yonsei University Research Fund(Yonsei Frontier Lab. Young Researcher Supporting Program) of 2018.