




Abstract
Reported in this paper are the effects of tip-to-collector distance, voltage, deposition time and solution concentration on the fiber size distribution and filter quality factor of electrospun cellulose acetate (CA)-based nanofibers. Nanofibrous filter samples were produced by electrospinning in a laboratory setting. The CA solutions were prepared by diluting various concentrations of CA in a 2:1 (w:w) ratio of N,N-dimethylacetamide (concentration 10–20 wt.%). The electrospinning voltages ranged from 8–12 kV, with distances from 10–15 cm and deposition times of up to 30 minutes. The produced nanofibrous filter samples were then analyzed in terms of fiber size distribution and filter quality factor using nanosized sodium chloride particles ranging from 4–240 nm in diameter. The maximum filtration efficiency measured was 99.8% for filter samples obtained with an overall deposition time of 30 minutes. The maximum filter quality factor was 0.14 Pa−1 for a CA concentration of 20 wt.% and a tip-to-collector distance of 15 cm. The average fiber diameters of the fibers were between 175 and 890 nm, and CA concentrations below 15% led to the formation of beads.
Keywords
Nanofibers have been used for air filtration for a few decades. Nanofibers find applications in many industries including textiles, clean energy and environment, medicine and defense. 1 Interest in the research and development of nanofibers by electrospinning has been growing in recent years due to their potential in producing sub-100 nm nanofibers. Among several methods that are available for nanofiber production, electrospinning is considered superior over others due to its ability to produce fine fibers from a variety of materials, 2 for example, poly(vinyl alcohol) (PVA), 1 polyurethane, 3 polypyrrole-poly(acrylonitrile-co-vinyl acetate), 4 polyacrylonitrile (PAN) and dimethylformamide, 5 polypropylene, 6 alumina, 7 activated carbon 8 and polyamide-6. 9 A review of multifunctional polymer nanocomposites for multifunctional finishing of textiles is also available. 10
Electrospinning has found its way into industrial applications over the last 8 years. A typical electrospinning process is used to fabricate nanofibers with diameters in the order of 100 nm. The electrospinning process depends on multiple parameters, including polymer properties (concentration, viscosity, surface tension, etc.), applied voltage, tip-to-collector distance, nozzle diameter, and ambient conditions such as temperature and relative humidity. Beaded fibers may be produced when the tip-to-collector distance, solvent flow rate or polymer concentration is high. 11 Furthermore, a high-viscosity polymer leads to larger fibers. Thinner fibers are produced at a higher temperatures, high electrospinning voltages and small flow rates for single jet electrospinning processes.
Nanofibers can be produced for the filtration of airborne nanoparticles (1–100 nm in diameter) for the protection of human health and the environment.12–16 Researchers believe that the features of nanofibers include high filtration efficiency and low pressure drop. PVA-, nylon 6-, cellulose acetate (CA)- and PAN-based nanofibers have been successfully fabricated in laboratories for air filtration purposes.
Within the area of air filtration, there is a growing interest in biodegradable nanofibers, which is mainly driven by the global promotion of sustainability and related policies.17,18 Technical challenges arise in the quest to produce biodegradable polymers in a cost-effective manner, with performance comparable to synthetic polymers. 19 Biodegradable nanofibers can be made of CA, which is a natural polymer that can potentially replace synthetic polymers. Cellulose is one of the most widely available organic compounds on Earth. CA nanofibers offer relatively high modulus, flexible and tensile strength. The properties of CA nanofibers can also be tuned for certain contaminants by functionalizing the nanofibers with chemical groups. CA nanofibers have been shown to be biocompatible, non-toxic and biodegradable, thus making them ideal candidates for filtration applications. 20
Researchers have started to investigate the performance of CA nanofibers on the filtration of airborne nanoparticles. 19 Chattopadhyay et al. 21 investigated the effects of the fiber diameter, solidity and membrane thickness of electrospun CA fibers on nanoparticle filtration. Their CA fibers were produced by electrospinning. In their study, the tested aerosols were NaCl particles in the size range of 40–270 nm and diethyl hexyl sebactate at a face velocity of 45 cm/s, which is considered to be high. They found that the filtration performance of electrospun nanofibers was higher than that of thin commercial filtration materials. Matulevicius et al. 22 tested the effects of operating parameters on the fiber size and filtration performance of electrospun polymers, including CA. They used monodispersed particles with sizes of 100 and 300 nm in diameter, which are not nanoparticles. However, the available data for CA-based materials is still insufficient, especially for their application in the filtration of airborne nanoparticles. In addition, there is limited information available on the air filtration performance of biodegradable filters at lower face velocities. 22 Most of the works published to date only focuses on morphology and other physical properties of the filters.
The primary objective of this work is to better understand the effects of key parameters that affect the filtration quality factor of CA nanofibrous filters for nanoparticles. The key parameters include solvent concentration, voltage, tip-to-collector distance and deposition time in electrospinning. The electrospun CA nanofibers were characterized, and tested for filtration efficiency and quality factors to determine the optimal conditions for the fabrication of CA nanofibers that aim to achieve nanoparticle filtration. This paper contributes to the parameter studies of CA and polymer nanofibers in general. Additionally, it provides practical knowledge of air filtration, which determines the potential usability of these nanofibers. The main contribution of this paper lies in the information provided regarding the production of CA with various parameters. It also enriches the available data concerning the filtration mechanics of CA nanofibrous materials.
Experimental details
Cellulose acetate was purchased from Sigma Aldrich, USA (average Mn ≈ 30,000). CA solutions were prepared by diluting various concentrations of CA at a 2:1 (w:w) ratio of N,N-dimethylacetamide (Sigma Aldrich, 99.8%) and acetone (Sigma Aldrich, 99.7%). The resultant mixtures were stirred at 35℃ on a magnetic stirring heating plate for approximately 2 hours to completely dissolve CA into the solvent mixture. The polymer molecules were assumed to be adequately dissolved in the solvent for the electrospinning process. As is typical practice in this field of research, complete dissolution was confirmed through visual inspection when the solvent turned to a clear liquid. Similar formulations of the solvent have been reported to work well for producing CA nanofibers in the literature.23,24 Three different concentrations of CA were tested for this study: 10, 15 and 20 wt.%.
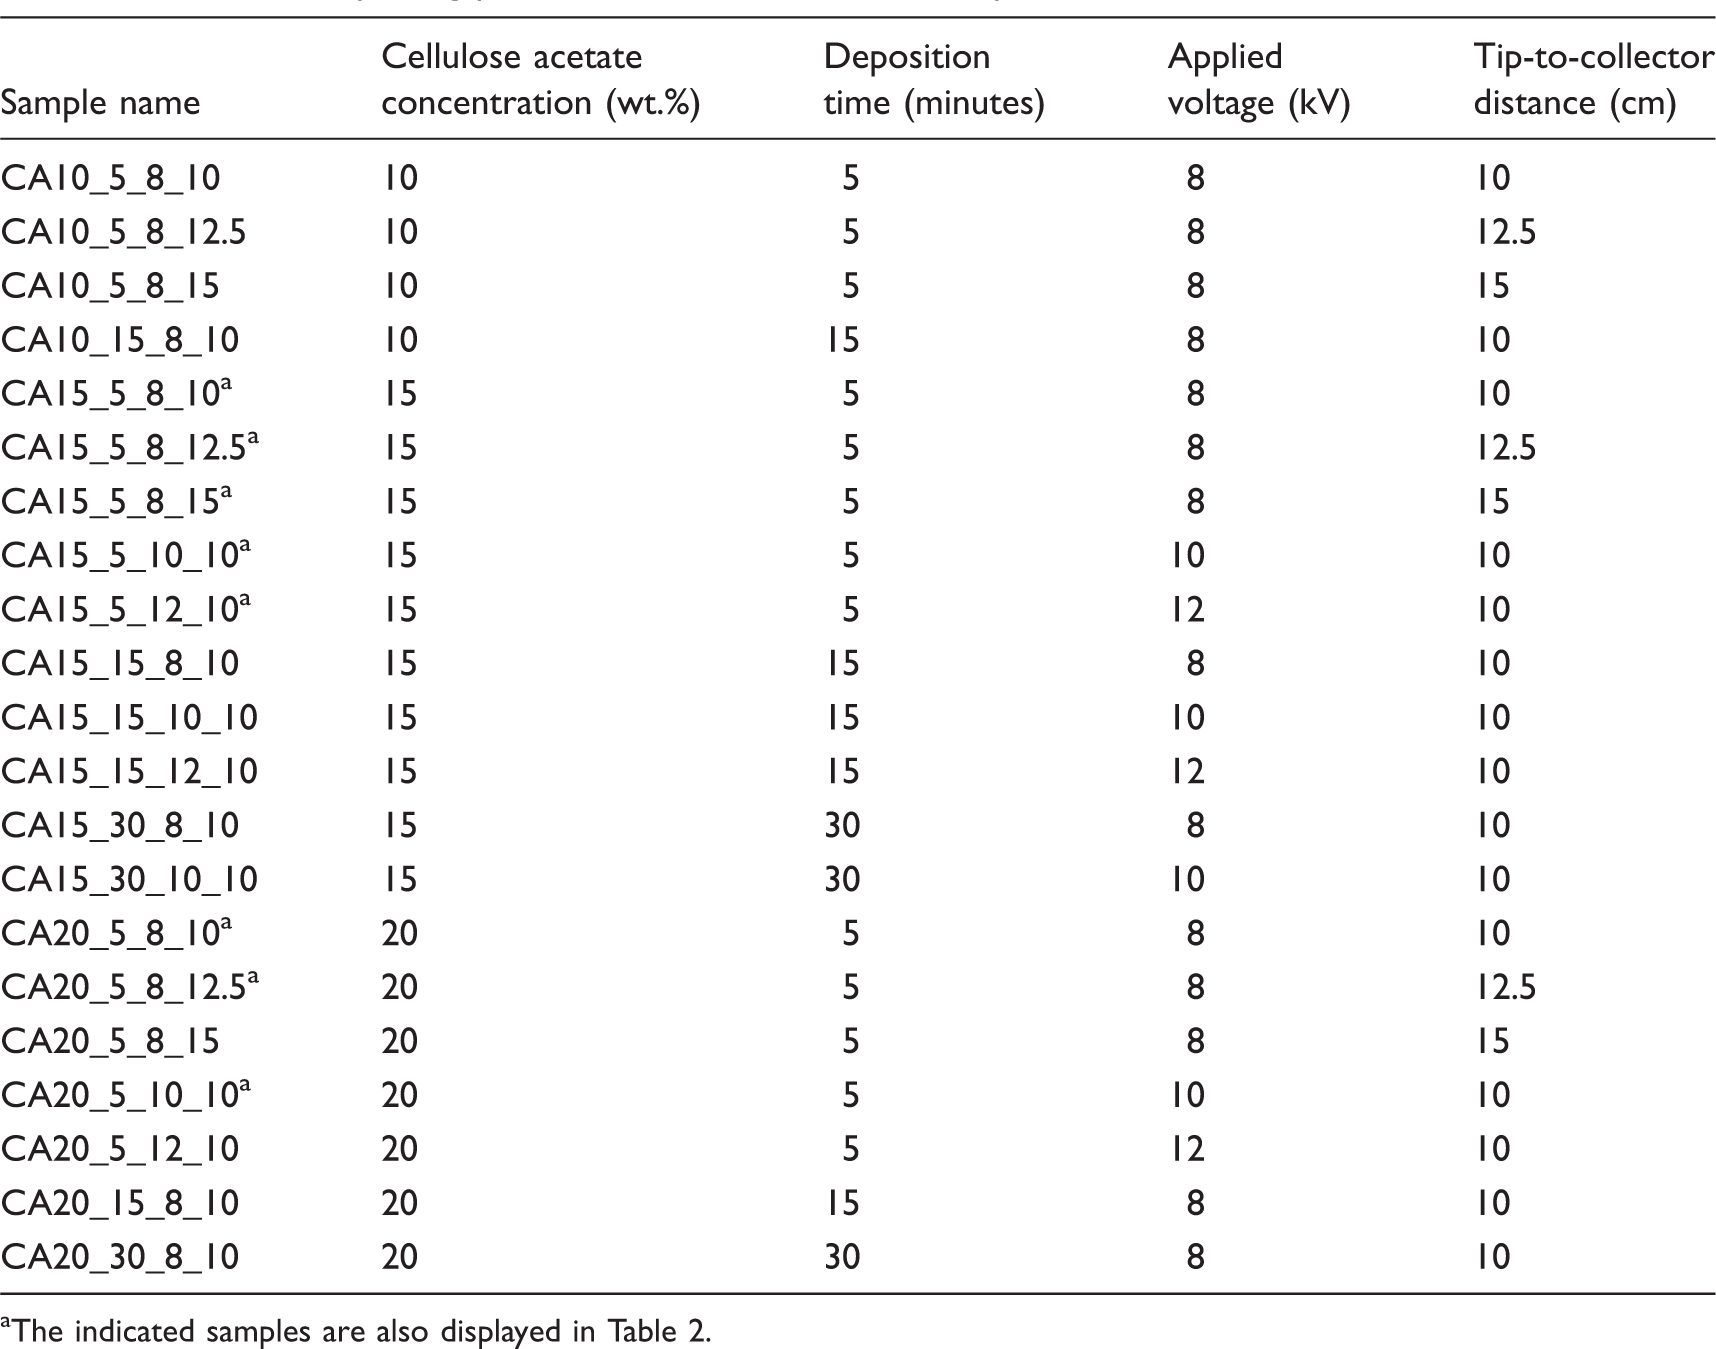
The CA solution was then placed in a 5 mL syringe and connected to a capillary tip (gauge 22); this solution was pressed through the tube and capillary with a syringe pump at a constant feed rate of 0.6 mL/h. The capillary needle was connected to a high-voltage supply (maximum voltage ± 30 kV). The voltage varied from 8–12 ± 0.1 kV and the distance between the needle and collector from 10–15 cm ± 0.1 cm. The nanofiber samples were deposited onto a stainless steel screen with a wire diameter of 140 µm and opening size of 368 µm. The screens were placed on aluminum foil that covered the grounded collector. A schematic of the setup can be found in Figure 1. The test conditions for the filter samples are listed in Table 1.
Schematic of electrospinning setup. The electrospinning parameters for the nanofiber samples The indicated samples are also displayed in Table 2.
As described in our earlier work, 15 the nanofibrous filter samples were first analyzed by scanning electron microscopy (SEM) (Zeiss Gemini Model Leo 1550) to observe their morphology. Then, fiber size distribution was analyzed using a MATLAB code. More details can be found the supplemental materials of our earlier paper. 15 The same samples were tested in terms of filtration efficiency. The analysis steps are introduced below.
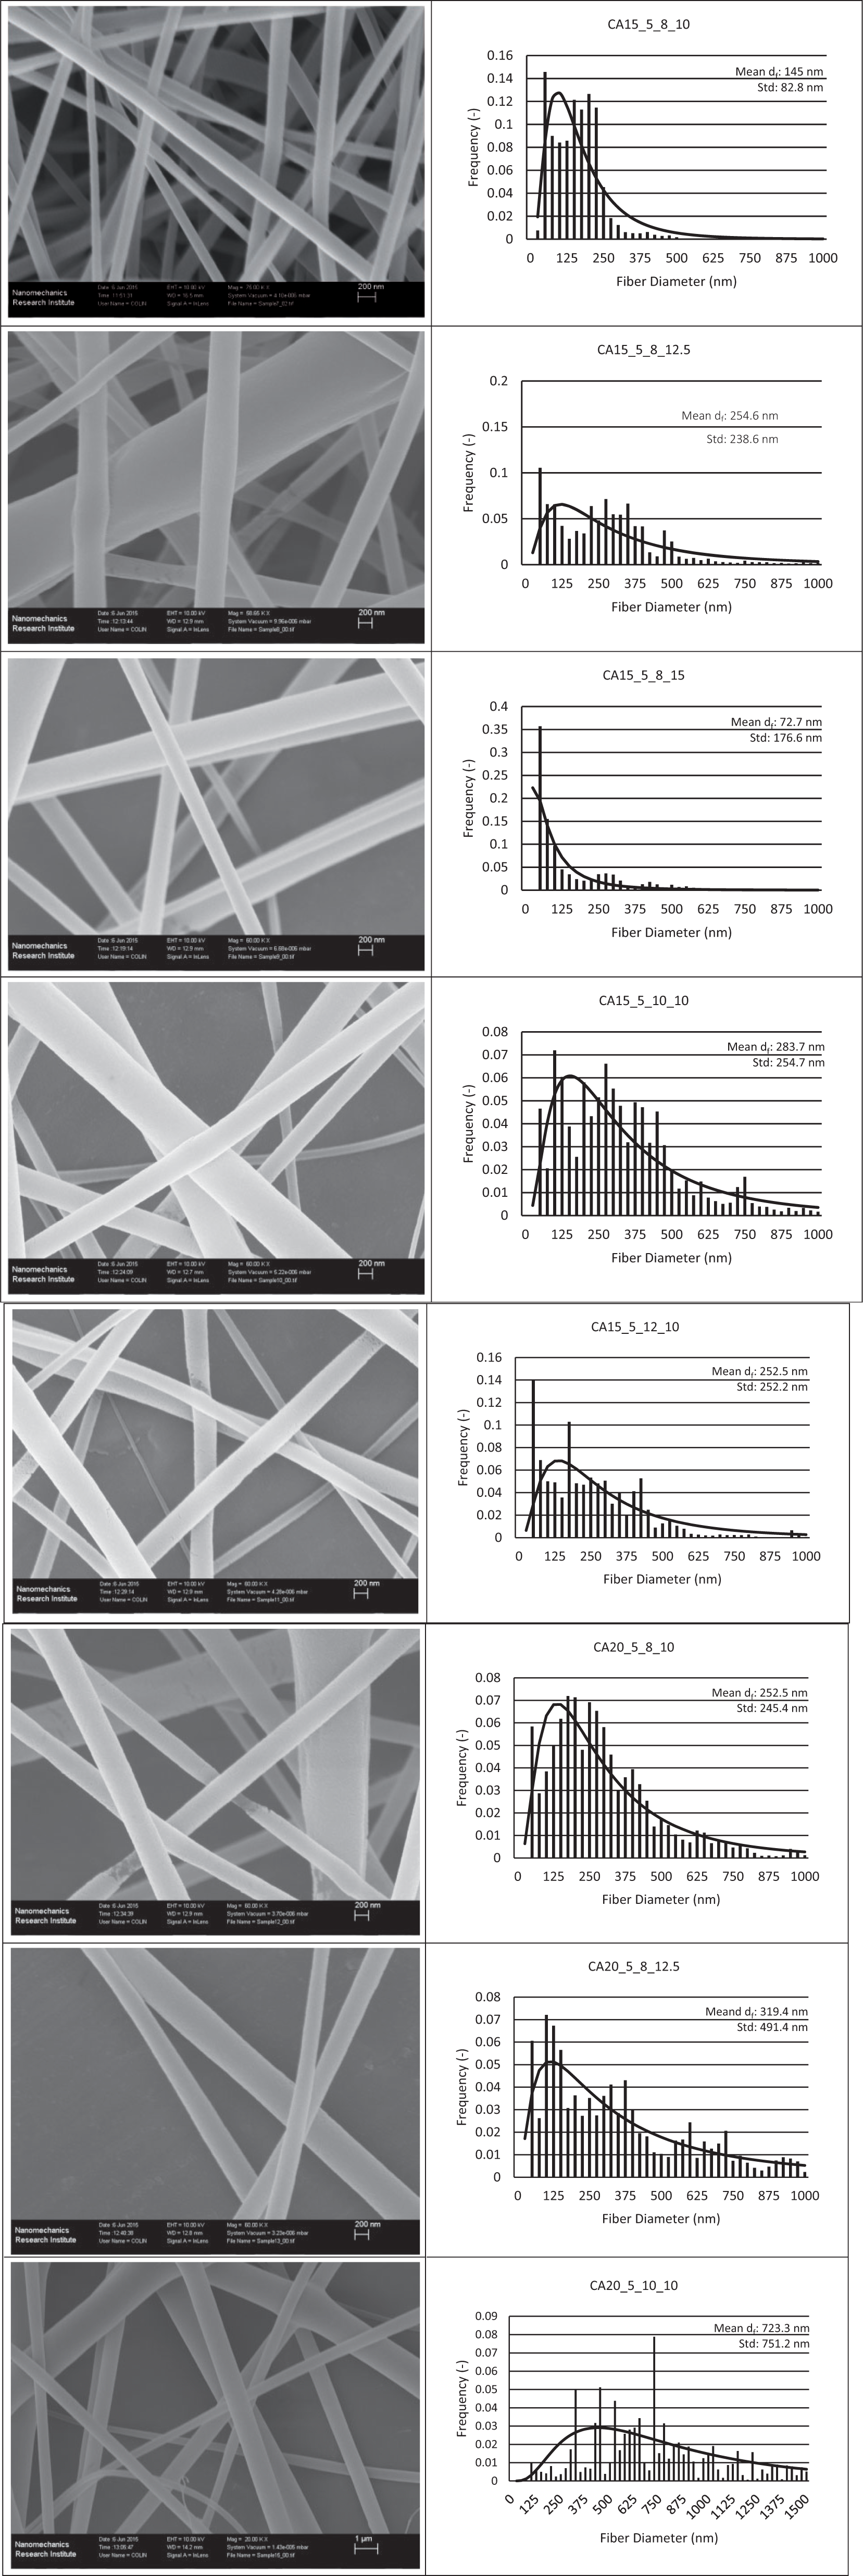
In preparation for the SEM analysis, a conductive gold coating was sputtered onto the nanofiber surfaces for 120 s to better visualize the nanofibers. Representative SEM images were obtained at magnifications from 5000–21,000. MATLAB code developed in-house was used to quantify the diameter of the fibers. The algorithm used for this process included image pre-treatment, local threshold, smoothness, edge detection and skeletonization. 15 A Euclidean distance transform matrix was used to obtain fiber diameters by determining the separation between fiber edges and centerlines. Multiple images were obtained at each magnification and from different locations to get more representative samples. An equal number of low (factor 5000) magnification and high (factor 20,000) magnification images were averaged out for each sample in order to get a more representative value for average fiber diameter.
The filter testing apparatus is the same as the one that was reported in our previous studies.15,16 The same setup is shown in Figure 2. The testing setup is comparable to those used by Chattopadhyay et al.
21
and Matulevicius et al.
22
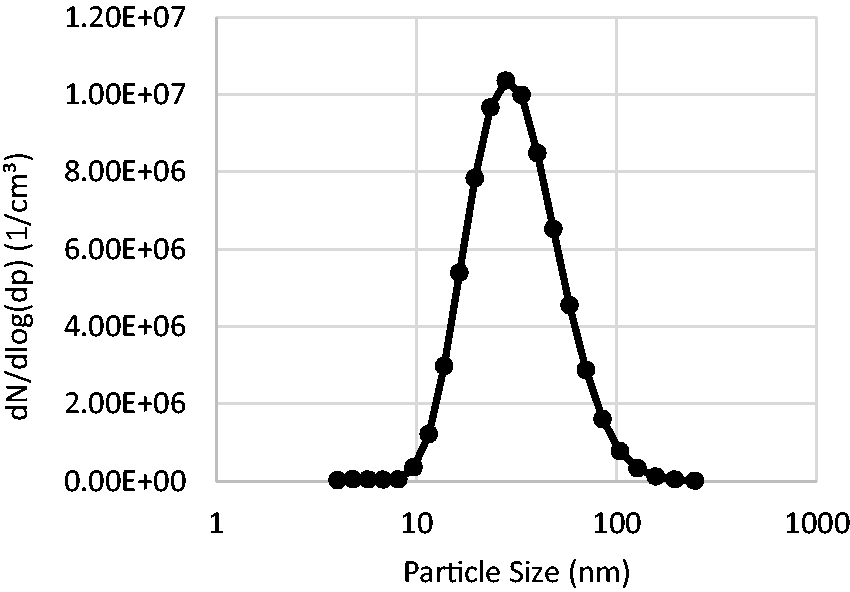
A constant output atomizer (TSI model 3076) was used to generate aerosol particles from a solution composed of 0.1 g/L sodium chloride (NaCl) in distilled water. In this case, compressed air was used to form a high-velocity jet that atomizes the solution into polydispersed NaCl aerosol particles. The aerosol particles were then passed through a diffusion drier (TSI Model 362) to remove water vapor from the generated aerosol.
Schematic diagram of the filtration setup. Particle size distribution of the NaCl particles.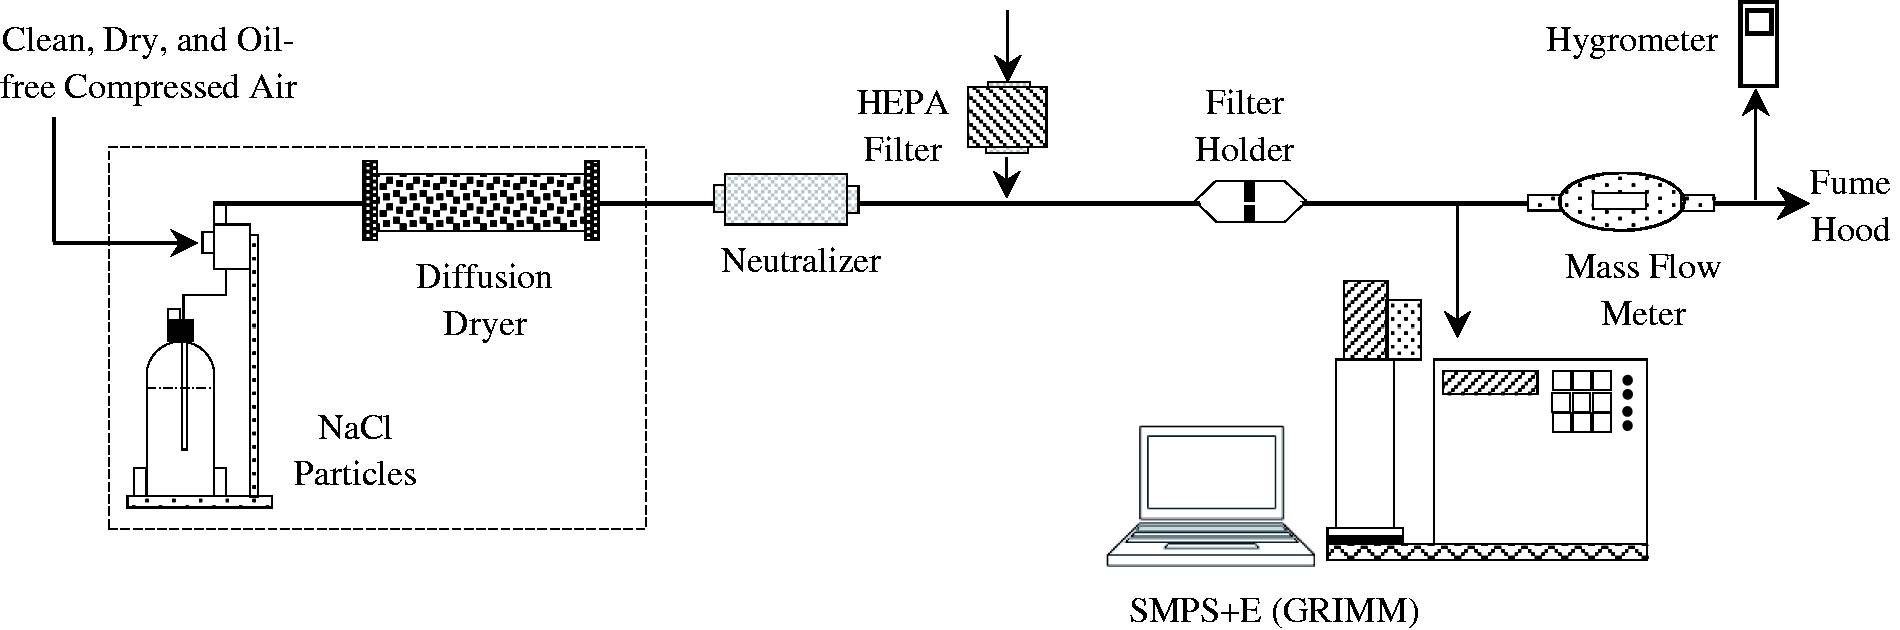
The aerosol particles were then passed through the filter medium at an air flow rate of 1.5 L/minute. The filter medium was placed on a filter holder (BGI Inc., Waltham, MA). The filter sample and the filter holder have a diameter of 25 mm. With a flow rate of 1.5 L/minute, the face velocity on the filter is 5.1 cm/s. The pressure drop across the filter medium (
The fractional filtration efficiency was calculated using the concentrations of particles measured with and without the presence of the nanofibrous filter (see equation 1):
15


Results and discussion
Fiber size distributions
Sample scanning electron microscopy images and determined fiber size distributions
Effects of CA concentration on the sizes and morphologies of the nanofibers
The SEM images in Figure 4 are for samples with 10 wt.% CA. They clearly show the beading of polymers. Droplet formation was observed when the polymer concentration was below a certain point or a critical chain entanglement concentration, ce.
25
Such defects were not observed above this critical concentration. Similar findings have been reported by others.
21
It has been reported that the magnitude of c
e
is dependent on solvent–polymer interactions.
24
Bead-free nanofibers are expected at high CA concentrations, that is, over 15 wt.%. Higher DMAc content in the solvent leads to strong hydrogen-bonding interactions between the solvent and the CA molecules. For the 2:1 DMAc/acetone formulation, the evaporation of the solvent is expected to be slower, resulting in a wet jet landing on the collector. In order to minimize surface tension, the solution on the collector forms spherical beads.
Scanning electron microscopy images of the nanofibers produced with different cellulose acetate concentrations. (a) 10 wt.%, (b) 15 wt.% and (c) 20 wt.%.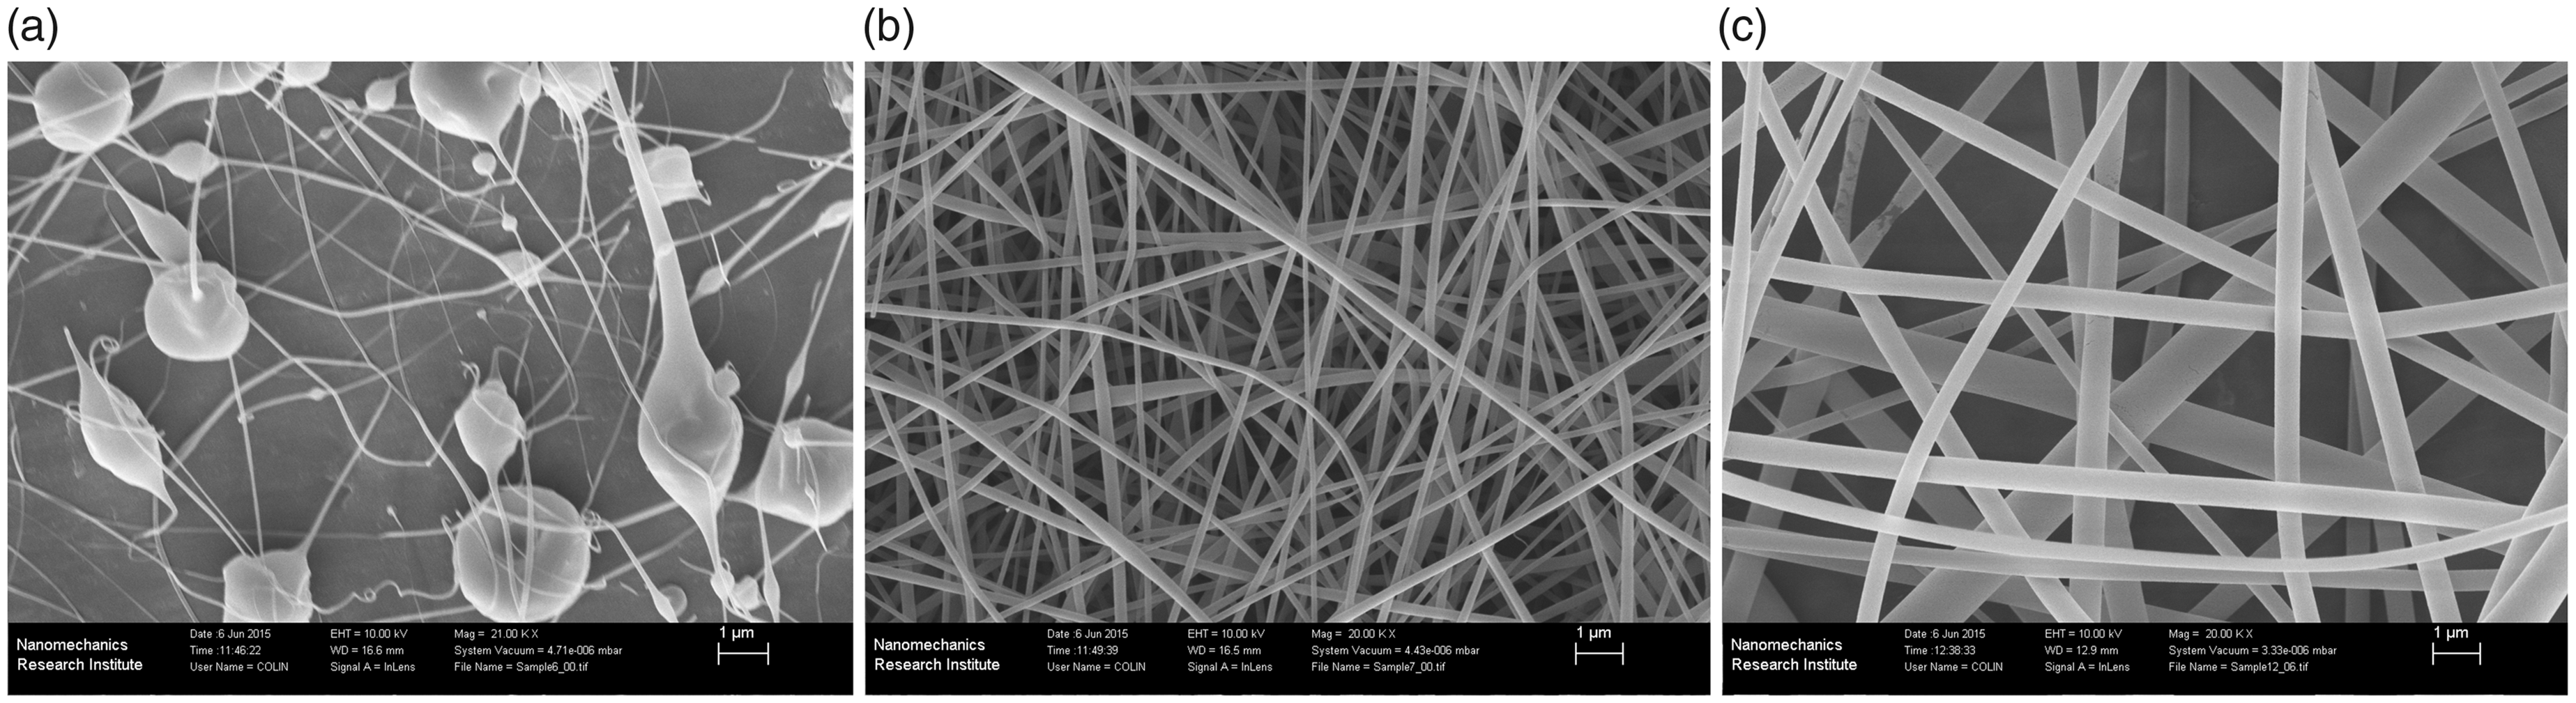
Note that, in an earlier study 24 using a 2:1 DMAc/acetone solvent solution, the beading phenomenon was observed at concentrations as high as 20 wt.%. Bead-free nanofibers were only obtained at a CA concentration of 25 wt.%. 24 In the current work, the absence of droplets in the 15 wt.% micrographs indicates that the critical chain entanglement concentration for the 2:1 DMAc/acetone solvent mixture is somewhere between 10 and 15 wt.% of CA. This also indicates that other factors may have played an important role in bead formation. It is likely that the relative humidity or temperature of the air have an impact, since both parameters can influence the conductivity or surface tension of the solution. Based on the qualitative observations above, only 15 and 20 wt.% samples were analyzed from this point on for fiber diameter, filtration efficiency and filtration quality.
A higher CA solution ultimately leads to higher viscosity of the solution, and consequent higher resistance of the liquid being precipitated by the electric field. This resistance leads to lower bending instabilities and ultimately thicker nanofibers. Similar trends have been observed for CA nanofibers by other researchers.20,23,24,26 The increased range of fiber sizes is also common for increased polymer concentrations. 21 In the study by Chattopadhyay et al., the concentration of 15% CA resulted in a fiber diameter of 302 ± 127 nm, whereas the fiber diameters corresponding to 20% CA were 669 ± 341 nm.
Effects of tip-to-collector distance on fiber diameter
Tip-to-collector distance can impact the quality of the fibers; beads can be observed if the tip-to-collector distance is either too short or too long. 27 Tip-to-collector distances of 10, 12.5 and 15 cm were considered for the following study. No beading was observed for these three tip-to-collector distances.
Fiber size distributions at different concentrations and tip-to-collector distances

The increased range of fiber diameters could also be attributed to the increase of bending instability. The whipping continuously alters the traveling distance of the fibers, which has a direct impact on the final fiber size. However, a similar study concluded that the diameter size and morphology of the fibers were not significantly influenced by the deposition range between 5 and 15 cm. 20 Similarly, another study saw a minimal impact of the tip-to-collector distance of 15–30 cm on the corresponding SEM images. 20 It would be desirable to have some data at a shorter distance, but no fibers could be formed and collected at distances of 10 cm. An advanced experimental setup shall be developed for nanofiber fabrication at short distances. It is worth noting that it is very normal to have a wide range of fiber sizes. The fiber sizes depend not only on the operation of the setup (voltage, distance and concentration), but also on the experimental setup itself. Chattopadhyay et al. 21 used a drum collector, and Christoforou et al. 20 used a horizontal setup with a plate sized 24 × 24 cm. They all demonstrated that collector size directly impact the strength of the electric field and the final fiber morphology.
Effects of applied voltage on fiber size
Samples were produced at different applied voltages with two CA concentrations of 15 and 20 wt.% CA, but with the same deposition time of 5 minutes and same tip-to-collector distance of 10 cm. These two groups of samples were used to study the effects of applied voltage, which were 8, 10 and 12 kV, on the fiber diameter.
Fiber diameters at different concentrations and applied voltages

The effects of the applied voltage on fiber diameter were not conclusive based on earlier studies.20,21 In a separate study on CA nanofibers, other researchers found an inverse effect of applied voltage on the mean fiber diameter. 27 This was attributed to stronger electrostatic forces at higher voltages, which caused the fibers to stretch more and become thinner. Another study showed that voltage had a negligible effect on the diameter of CA nanofibers. 28 Increasing the applied electric field resulted in a slight decrease in mean fiber diameter for ethylcellulose nanofibers. However, an increase in fiber diameter may also be attributed to a stronger electric field, which can result in the solution being ejected more quickly from the capillary tip.
Fiber diameters and production parameters of other research

Air filtration performance
Effect of CA concentration on filtration performance
Figure 5 shows the effects of CA concentration on the filtration efficiencies and quality factors corresponding to deposition times of 5–30 minutes. The tip-to-collector distance and applied voltage were kept constant at 10 cm and 8 kV, respectively. Since obvious beading of the polymer was observed for 10 wt.% CA, only samples for the concentrations of 15 and 20 wt.% are considered in this paper. At all deposition times, except for 15 minutes, filtration efficiency and quality factor increased when the CA concentration increased from 15 to 20 wt.%. For example, in the case of 30 minutes of deposition time, increasing the CA concentration from 15 to 20 wt.% led to an increase in average filtration efficiency from 14.8 to 60.4%. Under the same conditions, the quality factor increased from 0.0214 to 0.027 Pa−1.
(a) Filtration efficiencies and (b) quality factors at different cellulose acetate concentrations.
The higher filtration efficiency can be explained by the increased mass deposition of fibers due to the higher polymer concentration of the solution. A higher concentration of polymer in the solution leads to relatively less volatile solvent in the jet, which results in a higher polymer mass deposition rate and solidity of the produced filters. The higher filtration quality is connected to the higher filtration efficiency with an equal pressure drop or less. The slipping effect enabled by the very fine fibers enables a better filtration performance with a lower pressure drop. Slip flow occurs when the size of the fiber approaches the mean free path of the air. As a result, the air molecules “slip” over the fiber surface, which leads to a lower pressure drop. As a result, the deposited mass does not impact the pressure drop significantly.
Effects of tip-to-collector distance on filtration performance
Figure 6 shows the effects of tip-to-collector distance on the filtration efficiency and quality factor of filter samples obtained with 15 and 20 wt.% CA. The deposition time and applied voltage were kept constant at 5 minutes and 8 kV, respectively. For both CA concentrations, positive trends are observed for filtration efficiency and quality factor with increasing tip-to-collector distance. There was generally an increase in average fiber diameter with increasing tip-to-collector distance. Typically, thinner nanofibers correspond to higher filtration efficiency. However, this trend was not observed in the study herein. As seen in Table 2, although the mean sizes of certain samples were relatively large, these samples have many fibers that are smaller than the measured fiber diameter. Therefore, the effects of nanosized fibers can be observed for samples with a high mean fiber size. In a separate study using PVA nanofibers,
15
a similar correlation was obtained between tip-to-collector distance and both filtration efficiency and filter quality factor.
(a) Filtration efficiencies and (b) quality factors at different tip-to-collector distances.
Effects of deposition time on filtration performance
The effects of deposition time on the total filtration efficiency and quality factor are shown in Figure 7 below. All data points were for 15 and 20 wt.% CA solutions with a tip-to-collector distance of 10 cm when the applied voltage was 8 kV. It was observed for both concentrations that both the filtration efficiency and quality factor increased with deposition time. The filtration performance was relatively poor when the deposition time was 5 minutes for all tested samples. As shown in Figure 6(a), the filtration efficiency hovered around 10% for all samples. However, an increase in deposition time obviously promoted the filtration performance. Increasing the deposition time from 5 to 30 minutes led to a jump of average filtration efficiency from 1.8 to 60.4%. As discussed above, slip flow regime was observed when nanofiber diameter was less than 1 µm. Thicker nanofibers may be one factor that led to low filtration efficiency.
(a) Filtration efficiencies and (b) quality factors at different deposition times.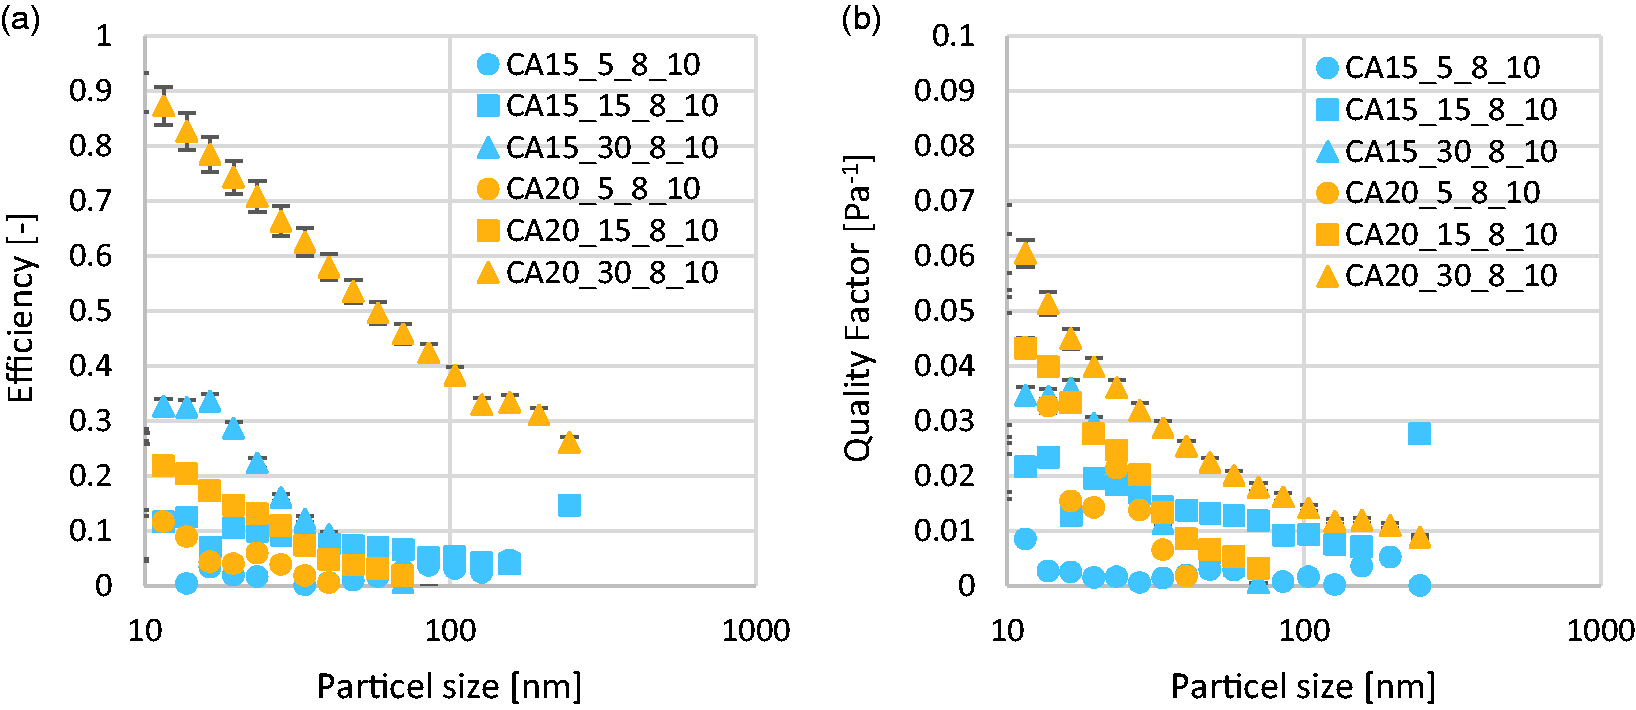
It can be seen from Figure 7 that the filtration qualities corresponding to the 15% CA sample and 20% CA concentrations are close to each other. Table 3 and Table 4 show that a lower concentration resulted in finer fibers. Thinner fibers can be deposited for a longer time than thick ones without restricting the air flow to a point that the pressure drop overcomes the gain in filtration efficiency.
Effects of applied voltage on filtration performance
Figure 8 shows the effects of applied voltage on the total filtration efficiency and quality factor. For a given deposition time, the filtration efficiency increases with increasing applied voltage. The corresponding concentration was 15 wt.% with a tip-to-collector distance of 10 cm. A similar trend was also observed in terms of the quality factor of the media. This trend in filtration efficiency is clearly observed for all deposition times. As the voltage increased from 8 to 12 kV, the filtration efficiency approached 100%. For example, for the deposition time of 15 min, the filtration efficiency for the 10 kV sample was 36.7% and was 99.3% for the 12 kV sample. As seen in Figure 8, higher applied voltages require shorter deposition times to make filters with filtration efficiencies > 99%. The local maximum filtration quality factor was 0.06 Pa−1, while the maximum quality factor for all was 0.027 Pa−1. Commercial filters have been found to have a quality factor as high as 0.007 Pa−1.
30
Thus, the nanofibers in this study outperformed these commercial products.
(a) Filtration efficiency and (b) quality factor depending on applied voltage.
Figure 8 illustrates the relationship between the filtration efficiency and the pressure drop. The pressure drop increased so much for 10 kV that the rise of the filtration efficiency was negligible. From the results in Table 4, we knew that a higher voltage led to a greater average fiber diameter. It also led to the increase in pressure drop. The same was true for 12 kV, which showed a sharp increase in filtration efficiency but a relatively small increase in filter quality factor. On the other hand, the increase in the filtration efficiency of the thinner fibers for 8 kV led to an equivalent increase of the filtration quality factor. All these results suggest that the filter with thicker fibers may be more efficient in capturing nanoparticles, but they also have high solidity, which led to a high pressure drop. Furthermore, the slipping effect reduces the pressure drop for finer fibers. This finding matches the theory described by the models summarized by Hinds.29,31 Notable differences are samples CA15_5_12_10 and CA15_15_12_10, which show consistently high filtration efficiencies with only a minor dip at 100 nm.
Figures 6 to 8 also show the effects of deposition time on filtration performance. The circles, squares and rectangles stand for short, medium and long deposition times, respectively. All three graphs show that a short deposition time corresponds to low filtration efficiencies, while a long deposition time corresponds to high filtration efficiencies. The higher filtration efficiency is attributed to the thicker filter resulting from a longer electrospinning time. However, as expected, the increased amounts of deposited fibers lead to a higher pressure drop. Nonetheless, the overall filtration quality is still the highest for all samples made with a long deposition time.
Conclusions
The results of this paper show that applied voltage, tip-to-collector distance, CA concentration and deposition time in electrospinning affects the size of the resulting nanofibers and the consequent filtration quality factors. With CA concentrations of 15% or less, beads were formed during the electrospinning process, regardless of other electrospinning parameters. A higher CA concentration resulted in larger fiber diameters, likely due to the increased viscosity.
Furthermore, a longer tip-to-collector distance and higher applied voltage also led to larger fiber diameters. The impacts of the tip-to-collector distance and voltage are comparable with respect to the increase in fiber diameter.
Finally, the larger the fiber diameters the higher the filtration efficiency. The increased filtration efficiency did not necessarily mean a higher filtration quality factor, especially for filters obtained via a longer deposition time. The maximum filtration efficiency was 99.8% for filters made with an overall deposition time of 30 minutes. The maximum filter quality factor was 0.05 Pa−1 for a filter corresponding to a CA concentration of 20 wt.%, a tip-to-collector distance of 12.5 cm, a voltage of 8 kV and a deposition time of 5 minutes.
Footnotes
Declaration of conflicting interests
The authors declared no potential conflicts of interest with respect to the research, authorship and/or publication of this article.
Funding
The authors disclosed receipt of the following financial support for the research, authorship, and/or publication of this article: This work was supported by the Natural Sciences and Engineering Research Council of Canada, the Canadian Foundation for Innovation, the International S&T Cooperation Program of China (Grant No. 2015DFG61910) and the Ontario-China Research and Innovation Fund (OCRIF-2014).