
Abstract
To investigate the drying characteristics of thin cotton fabric for reducing the energy consumption during the heat setting process, a two-dimensional heat and moisture transfer model considering lateral heat and moisture transmission under the impingement drying condition was developed in this study. The curves of the variation in fabric temperature and moisture content over time were obtained and the results indicate that the drying rate increases with the decrease in the moisture content in the fabric. In addition, non-uniform distributions of temperature and moisture on the fabric over time were obtained. The drying time per unit area on the fabric was found to increase with time. Further, experiments were conducted to test the heat and moisture transfer performance of the fabric, and the experimental results agree reasonably well with the calculations.
Heat setting machines are very important equipment in the printing and dyeing industry. They are widely used to dry the textile material among the textile finishing operations1,2 and directly affect the final characteristics of the textile. However, the structural design of air duct, nozzle layout and process parameter settings for heat setting machines currently in the textile industry are basically based on manual experience that has many shortcomings, 3 which lead to huge energy consumption and serious energy waste in the heat setting. Statistically, only about one-third of the total input energy is used for drying the textile, and a large amount of heat is wasted.
Study of the fabric drying in the textile enables scientific process design and optimization of the operating conditions, 4 providing guidance for the structural design of the air duct and process parameter optimization of the heat setting machine. It can also minimize the power consumption and cost of the heat setting process. 5 In recent years, studies have attracted great attention at home and abroad on the fabric drying in the textile. Several empirical models have been proposed for investigating fabric drying within the fabric.5–7 But these models did not address the heat and moisture transfer mechanisms in the fabric, having some limitations when being used. Several researchers have developed some mathematical models to study the heat and moisture transfer process for the fabric drying. Ye et al. 8 investigated the heat and moisture transfer characteristics in four types of clothing assemblies via numerical simulation. The results obtained by their developed mathematical model agreed well with the experiment and their proposed model was more realistic than those in previous studies. Wei et al. 9 developed a mathematical model to describe the processes of coupled heat and mass and momentum transfer occurring in the convective drying of 100% porous cotton fabric inside the domestic air-vented drum dryer. The model validated by the experiments can be used to improve the design and operation of the existing dryer. The key parameters on fabric drying efficiency can be investigated using this one-dimensional transient heat and mass transfer model but the moisture and temperature distribution on the fabric surface cannot be obtained. Neves et al. 10 proposed methodologies and experimental procedures for determining the textile parameters required in numerical approaches of the heat and mass transfer through textiles. Zhu et al. 11 and Tian et al. 12 investigated the heat transfer performance through fabric via numerical simulation. The thermal insulation of fabrics under the heat convection or heat loss of the human body under different conditions was obtained by their simulations. However, these models in the existing studies are heat and moisture transfer models of fabric under natural drying or airflow drying. The heat and moisture transfer process of fabric under the heat setting process cannot be described by the models developed above because the drying method used extensively in the heat setting process is impingement drying due to its inherent characteristic of a high heat transfer rate.13–19 Nevertheless, Etemoglu et al. 17 developed a heat and moisture transfer model of fabric under impingement drying and their results indicated that the heat and mass transfer theory coupled with empirical data can reasonably predict the vapor evaporation rates. But the study mainly focused on the change in the average moisture content and average temperature of the fabric with time. The moisture and temperature distribution of the fabric cannot be obtained by the model.
The air duct structure and nozzle layout of heat setting machines can be designed and optimized according to the moisture content and temperature distribution of fabric. However, the established models in previous literature are always one-dimensional models, and cannot obtain the moisture content and temperature distribution of the fabric. Thus, a two-dimensional heat and moisture transfer model of thin cotton fabric with impingement drying for obtaining the moisture content and temperature distribution of the fabric was established in this study. Then, a series of experiments was carried out for validating the theoretical model. The drying characteristics of the thin cotton fabric were discussed and the experimental results were compared with the calculated ones. Finally, the effects of the initial moisture content on the drying performance of the fabric were investigated using the proposed model in this paper, and the temperature and moisture distribution of the fabric over time were obtained.
Theoretical modeling
Description of fabric drying process under impingement drying
A schematic of the drying process of a thin cotton fabric under impingement drying is illustrated in Figure 1. Hot air provided by a heat source blows on the fabric at a certain flow rate through hot air nozzles to dry the fabric. Heat is transferred from the hot air to the wet fabric which causes the water to vaporize. Then, the water vapor migrates to the hot air, which transports it away from the fabric.
Schematic of impingement drying process of the thin cotton fabric in the heat setting machine.
Modeling of drying process of a single point
There are two equations governing the heat and moisture transfer performance of the fabric in the drying process based on the above analysis: the heat transfer equation to express the heat transfer from the hot air to the wet fabric; and the mass transfer equation to express the vapor evaporation from the wet fabric to the hot air.
Heat transfer equation
Thin cotton with a low thermal conductivity was analyzed in this study. The thickness of the fabric was less than 300 μm. Therefore, it is assumed that the temperature and moisture content along the thickness of the fabric was consistent.
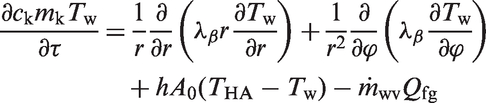
Thus, the heat transfer equation20,21 in cylindrical coordinates can be expressed as
It has been found from several studies that the temperature is concentric mode distribution under impingement drying,
22
so it is assumed that the partial derivative of the fabric temperature with respect to the angle is zero, so

Thus, equation (1) can be rewritten as


Thus, the evaporation rate
20
of water vapor,

Mass transfer equation
The mass transfer equation20,23 in cylindrical coordinates can be expressed as

In addition, in equation (7),

Thus, it can be found that

Boundary conditions
The initial and boundary conditions should be set for solving the heat transfer equation (equation (3)) and mass transfer equation (equation (9)). In this study, the initial conditions are

The boundary conditions are
Experimental study
A two-dimensional heat and moisture transfer model considering lateral heat and moisture transmission under the impingement drying condition was developed in the study. The convection heat transfer coefficient used in the model should be obtained by experiments and the feasibility of the theories and methods should be validated, thus a series of experiments was carried out to study the heat and moisture transfer performance of the thin cotton fabric under impingement drying. Then the experimental results were compared with the numerical results in the next section.
Experiment
Figure 2 shows a schematic of the experimental system for the impingement drying of the fabric. The experimental setup mainly consists of a hot air machine, a nozzle with a diameter of 10 mm, the fabric, infrared (IR) camera, and experimental aluminum frame. The hot air was supplied by the hot air machine, travelled through the silicone pipe and the nozzle, and then blew on the fabric surface to dry the fabric vertically. The temperature and velocity of the hot air were controlled by the hot air machine according to the experimental requirements. The metal outlet pipe of the hot air machine and the silicone pipe were coated with asbestos fiber for heat isolation. Furthermore, sealing gaskets were used to avoid air leakage. In the experimental setup, the IR camera (Hangzhou Meisheng Infrared Optoelectronic Technology Co., Ltd) was used to record the temperature variation and transmit the temperature data to a computer by an RJ45 data cable. The variation in the surface temperature of the fabric over time during the drying process of the fabric would be obtained by the IR camera.
Schematic of the experimental system for impingement drying of thin cotton fabric.
Experimental procedures
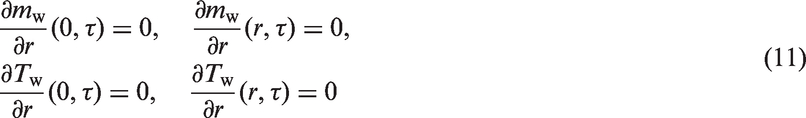
Detailed material and experimental parameters
Dfabn, δfab, Vn, and ρfab represent the distance between the nozzle outlet and fabric surface, the fabric thickness, nozzle outlet velocity, and fabric density, respectively. H0 is the initial moisture content.
Calculated and experimental results and discussion
Experimental analysis
Figure 3 presents the temperature distribution contour of the dry fabric in a steady state under the condition that the air velocity and temperature at the nozzle outlet were 21.5 m·s−1 and 135℃, respectively. In this study, the point corresponding to the nozzle center is set as the center of fabric. It can be seen that the temperature was the highest at the center of the fabric and lowest at the edge of the fabric. This meets the rule of impingement drying.
22
Also, the temperature is concentric mode distribution under impingement drying, which validates the assumption in equations (2) and (8) that the partial derivatives of the fabric temperature and water mass with respect to angle are zero. Furthermore, it can be obtained by analysis that the convection heat transfer coefficients between the hot air and fabric are basically concentric mode distribution centered on the center of the fabric. Thus, if the convection heat transfer coefficients on a line segment emerging from the center of the fabric (such as line Lr in Figure 3) are obtained, the convection heat transfer coefficient distribution of the fabric for the theoretical model will be obtained.
Temperature distribution contour of dry thin cotton fabric in a steady state under the condition that the air velocity and temperature at the nozzle outlet are 21.5 m·s−1 and 135℃, respectively.
Figure 4 presents the temperature distribution contour of wet thin cotton with various drying times under the condition that the air velocity and temperature at the nozzle outlet are 21.5 m·s−1 and 135℃, respectively. The temperature distribution of the fabric was uniform with no heating at τ = 0 s (Figure 4(a)). When the hot air started to blow on the fabric, the temperature of the fabric rose. However, the temperature distribution of the fabric became non-uniform. When τ = 58 s, the center temperature of the fabric was 128℃ indicating that the fabric in this region was dry, whereas the temperature at the edge was only 25.5℃ (Figure 4(c)). Even the temperature at the edge was still 25.5℃ when τ = 175 s. This demonstrates that under the impingement drying of a single nozzle, the temperature rise is rapid at the center of the fabric but very slow far from the center of the fabric. The low fabric temperature on the edge increases the drying time and decreases the drying efficiency. It is also found that the temperature contour is basically a series of concentric circles during the drying process of the wet fabric, implying that equations (2) and (8) are reasonable as well.
Temperature distribution contours of wet fabric at various times τ: (a) 0, (b) 38, (c) 58, and (d) 175 s under the same conditions as Figure 3.
Comparison between experimental and theoretical results
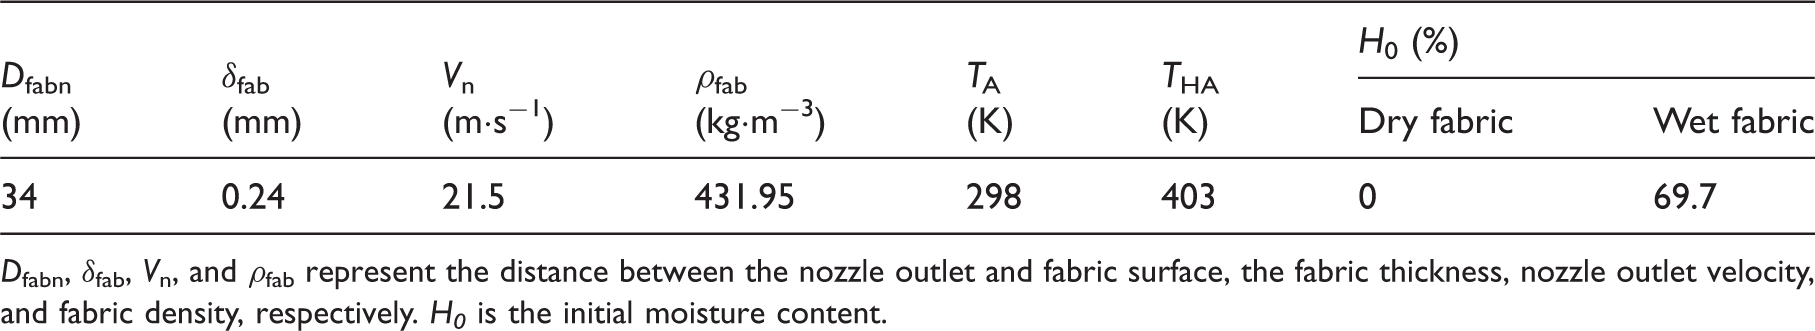
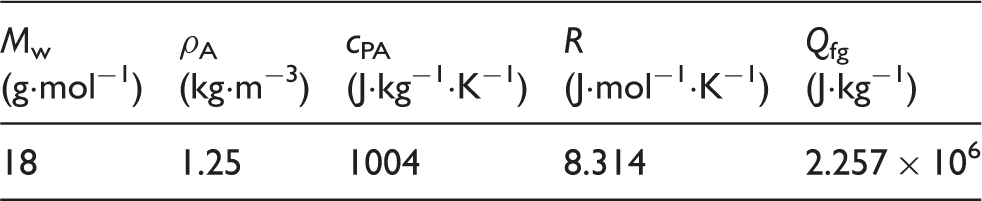
Calculated thermodynamic parameters used in this study
The calculated temperature variation at various points on the fabric was obtained via the theoretical model and experiments. Figure 5 shows a comparison of the temperature at different points on the fabric between the experimental and simulated results under the condition that the temperature and velocity of the hot air at the nozzle outlet are 135℃ and 21.5 m·s−1, respectively. It was found that the temperature of the fabric rose slowly when the fabric contained liquid water, whereas the fabric temperature rose very rapidly after all the water in the fabric was evaporated. It took about 50 s to reach the maximum temperature at the fabric center (r = 0 mm), whereas it took about 110 s to reach the maximum temperature when r = 16.6 mm. This demonstrates the large difference in drying time.
Comparison of the temperature variation curve over time at different points on the fabric between the experimental and simulated results under the condition that the nozzle outlet temperature and velocity are 135℃ and 21.5 m·s−1, respectively.
From Figure 5, it can be seen that the experimental results are reasonably consistent with the simulated results. The rapid rising segment of the fabric temperature obtained from the present model agrees well with that from the experiment. The drying time obtained from the present model also agrees well with that from the experiment. However, some inconsistencies can be found between the experimental and calculated results. For example, the constant temperature drying stages between the experimental and calculated results are inconsistent. The temperature differences between the experimental and calculated results come from the following aspects. First, the mass diffusion is very complex in the fabric, so the mass diffusion equation proposed in this paper cannot exactly describe the mass diffusion process in the fabric. Second, the heat transfer coefficient changes with the decrease in moisture content in the fabric, but in this study, the heat transfer coefficient at each point of the fabric from the hot air to the fabric is set as constant. In addition, the differences are also caused by measurement errors in the experiments.
Figure 6 shows a comparison of the temperature distribution of the fabric center line at different times between the experimental and theoretical results under the condition that the nozzle outlet temperature and velocity are 135℃ and 21.5 m·s−1, respectively. It was found that the temperature distribution of the fabric obtained by the experiments and theoretical model is non-uniform and symmetric basically based on the characteristics of impingement drying. Moreover, a reasonable agreement between the experimental and theoretical results was found, which validates the feasibility of the theoretical model.
Comparison of temperature distribution of the fabric center line at different times between the experimental and theoretical results under the same conditions as Figure 5.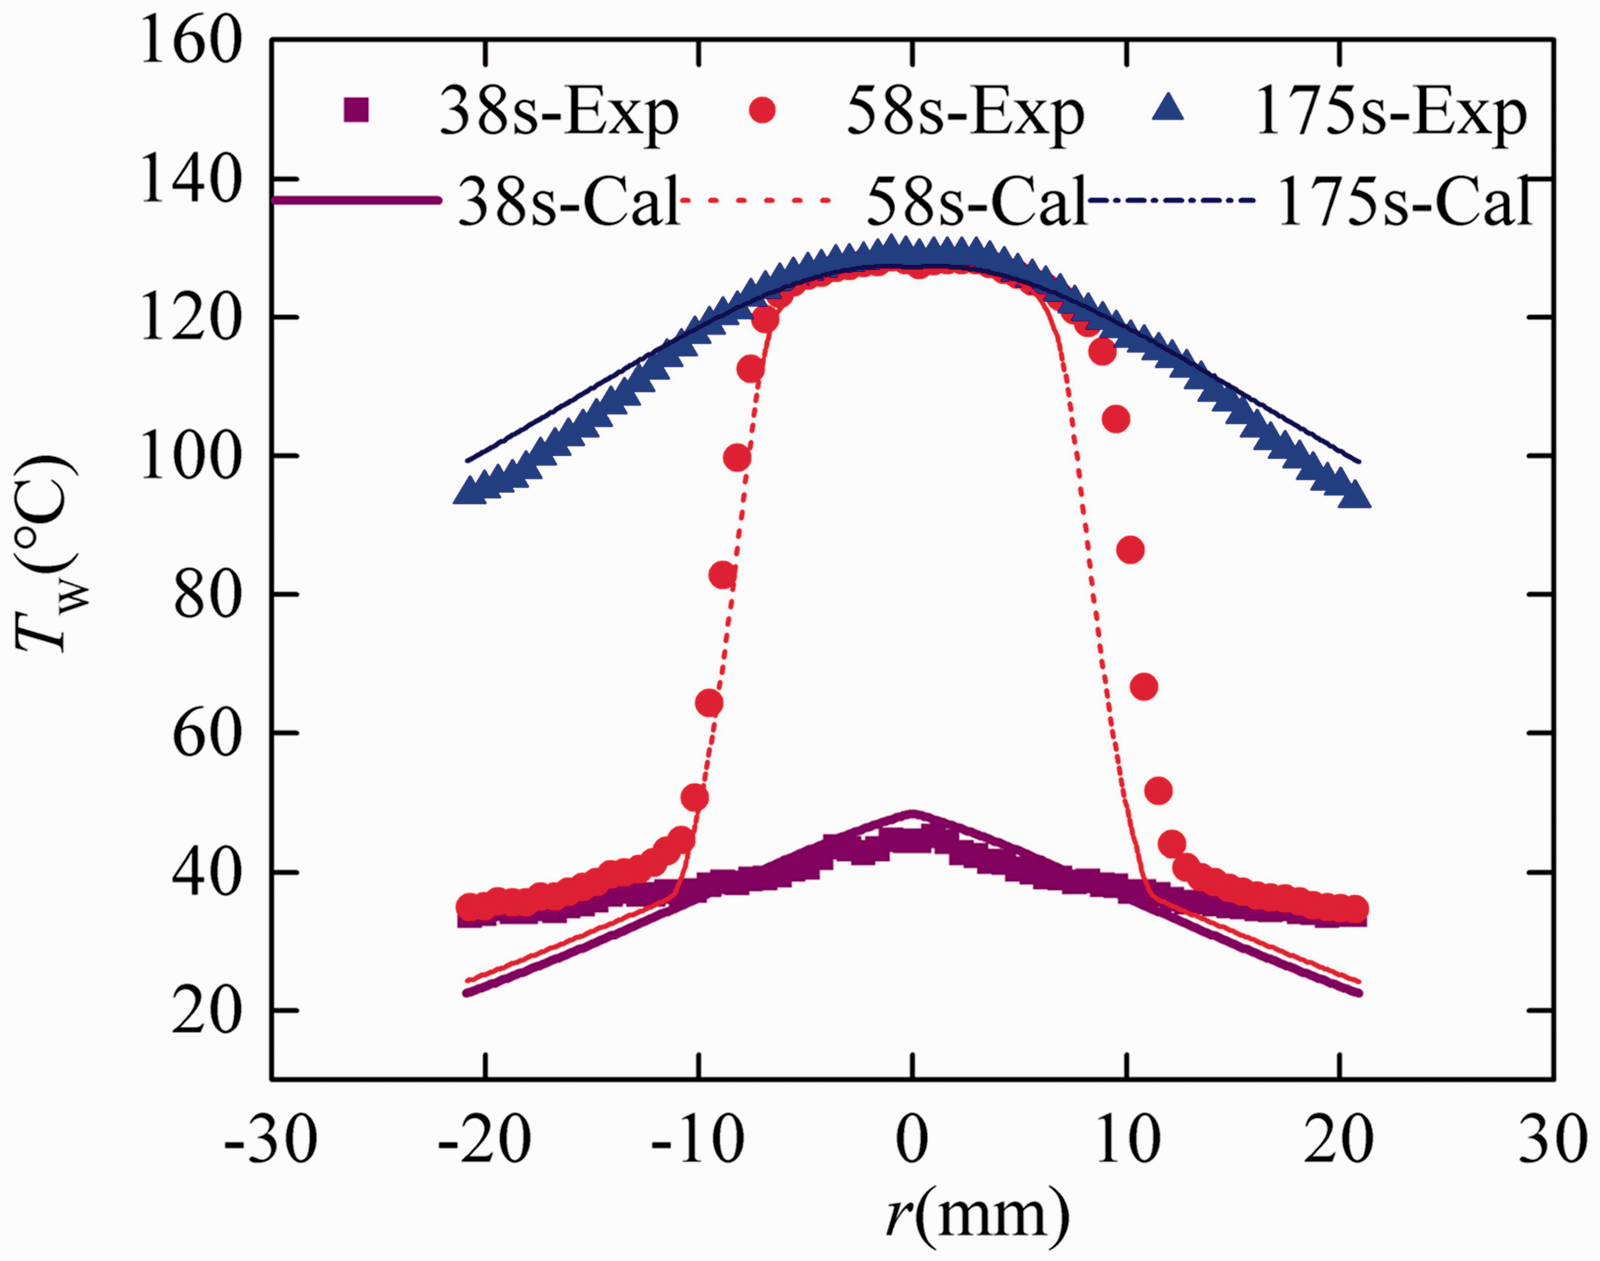
Theoretical analysis of the drying characteristics of the fabric
Moisture content at the center point of the fabric
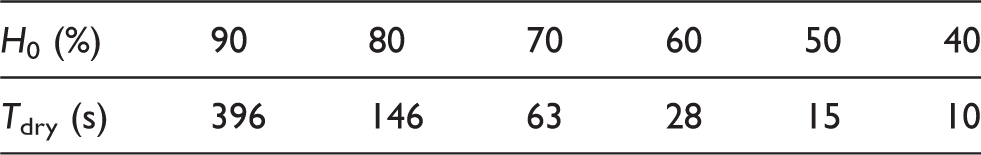
The changes in moisture content of the wet fabric over time were obtained via the present model. Figure 7 presents the variations in the temperature and moisture content at the center of the fabric over time with various initial moisture contents of the fabric. In the initial period, the fabric temperature is so low that the water in the fabric did not evaporate, so the temperature of the fabric rises quickly until the water begins to evaporate. Because a lot of energy is used to evaporate water, the rise of fabric temperature occurs slowly. When the fabric has almost dried out, the fabric temperature rises sharply again to the temperature of the hot air. During the drying process, the time is spent mostly evaporating the water in the fabric. Also, with the increase of the initial moisture, more water is needed to be evaporated, which results in the increase of the drying time. When the initial moisture content is 90%, it takes 396 s to dry the fabric, whereas when the initial moisture content is 50%, it takes only 15 s.
Effect of the initial moisture content of the fabric on (a) temperature and (b) moisture content at the center point of the fabric.
Effect of initial moisture content H0 on the drying time Tdry with hot air temperature of 135℃
Temperature and moisture distribution contours on the fabric
Figure 8 presents the calculated fabric temperature distribution contours at different times under the condition that the hot air temperature and initial moisture content at the nozzle outlet are 135℃ and 67.4%, respectively. At the beginning of the drying process, the initial temperature on the fabric is uniformly distributed. Then the temperature of the fabric increases and becomes non-uniform over time, and the difference between the center temperature and edge temperature becomes large. The center temperature and edge temperature are 127℃ and 66℃, respectively, when the drying time is 400 s. The center temperature of fabric increases more quickly to the temperature of the hot air than the edge temperature. This is because the heat transfer coefficient is much large in the center of the fabric which meets the impingement heat transfer characteristic.
13
Due to the low drying temperature at the edge, the fabric drying time will be prolonged dramatically. The result can also be found from the calculated fabric moisture content distribution contours at different times under the same conditions as Figure 8, as shown in Figure 9. When the drying time is 15 s, the moisture content decreases from 67.4% to about zero because of the high drying temperature at the center of the fabric, whereas the moisture content is only reduced by about 3% at the edge. The center of the fabric is already dry at about 15 s, whereas the fabric moisture content at the edge is not dry until 182 s. This greatly reduces the drying efficiency of the fabric. Thus a big distance between two nozzles for nozzle layout in the heat setting machine should not be designed, because it will take more time to dry the fabric.
Calculated fabric temperature distribution contours obtained under the condition that the hot air temperature and initial moisture content are 135℃ and 67.4%, respectively, at different times: (a) 0, (b) 10, (c) 50, (d) 150, (e) 300, and (f) 400 s. Calculated fabric moisture content distribution contours at different times under the same conditions as Figure 8.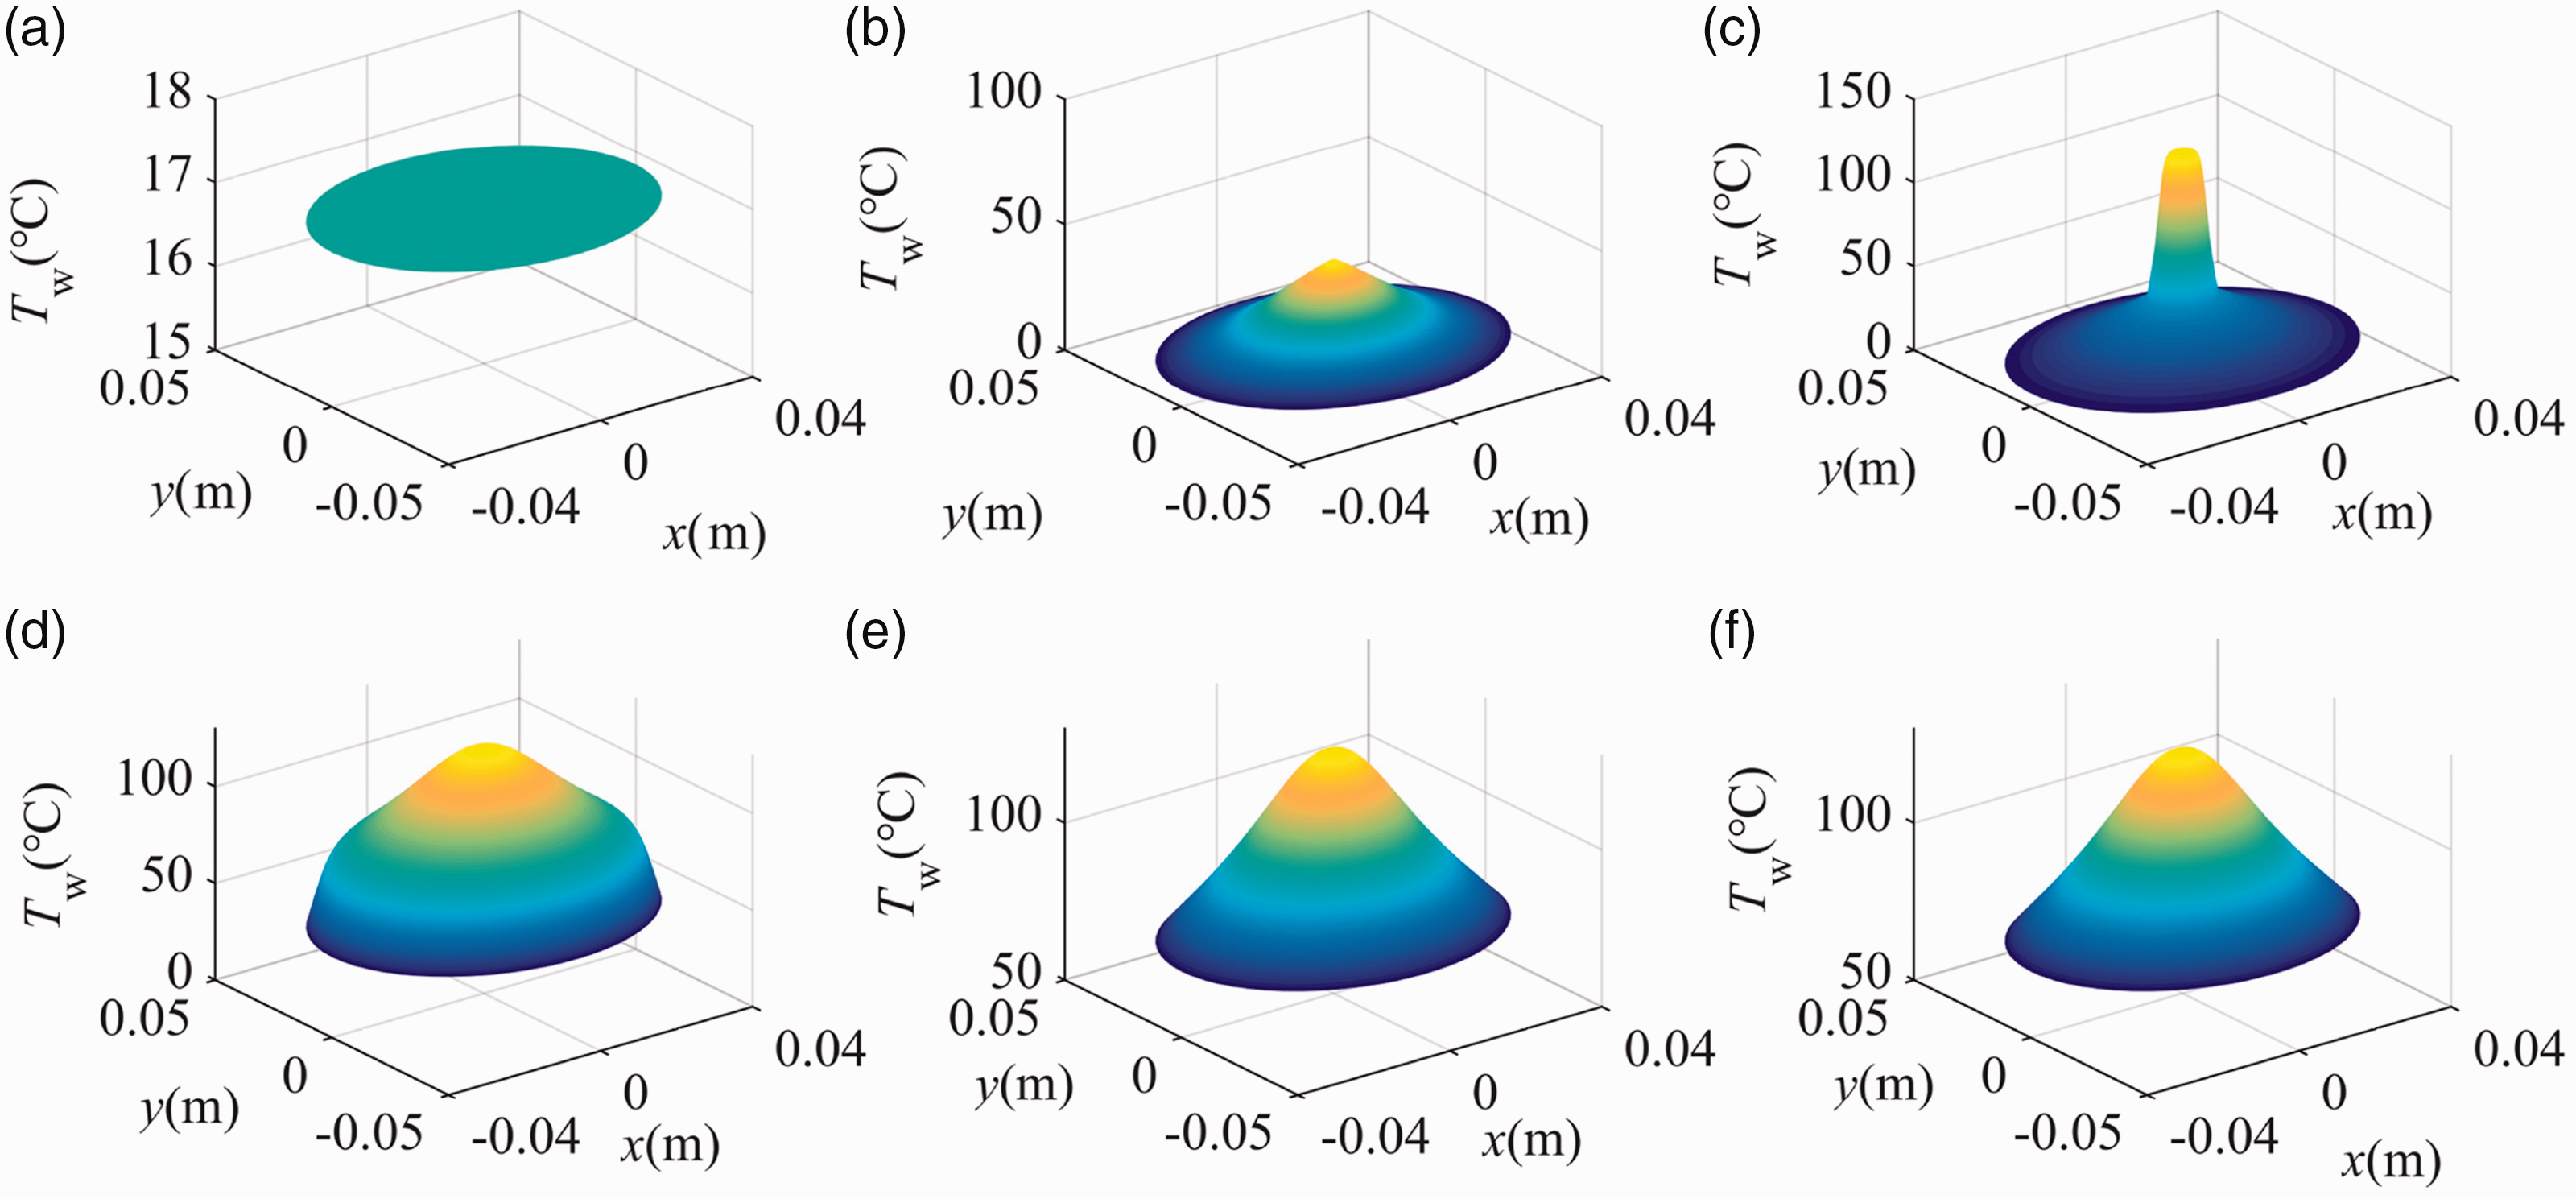

Figure 10 shows the dry area of the fabric over time under the same conditions as Figure 9. The dry area of the fabric increases with the drying time. The dry fabric area per second also increases with the drying time. This implies that the increase in drying time can improve the drying performance. However, the increase in drying time also reduces the production efficiency of the heat setting process. Thus, there is an optimum drying time in the drying process taking into account the production efficiency and energy utilization.
Dry fabric area Af and dry fabric area per second with different drying times under the same conditions as Figure 8.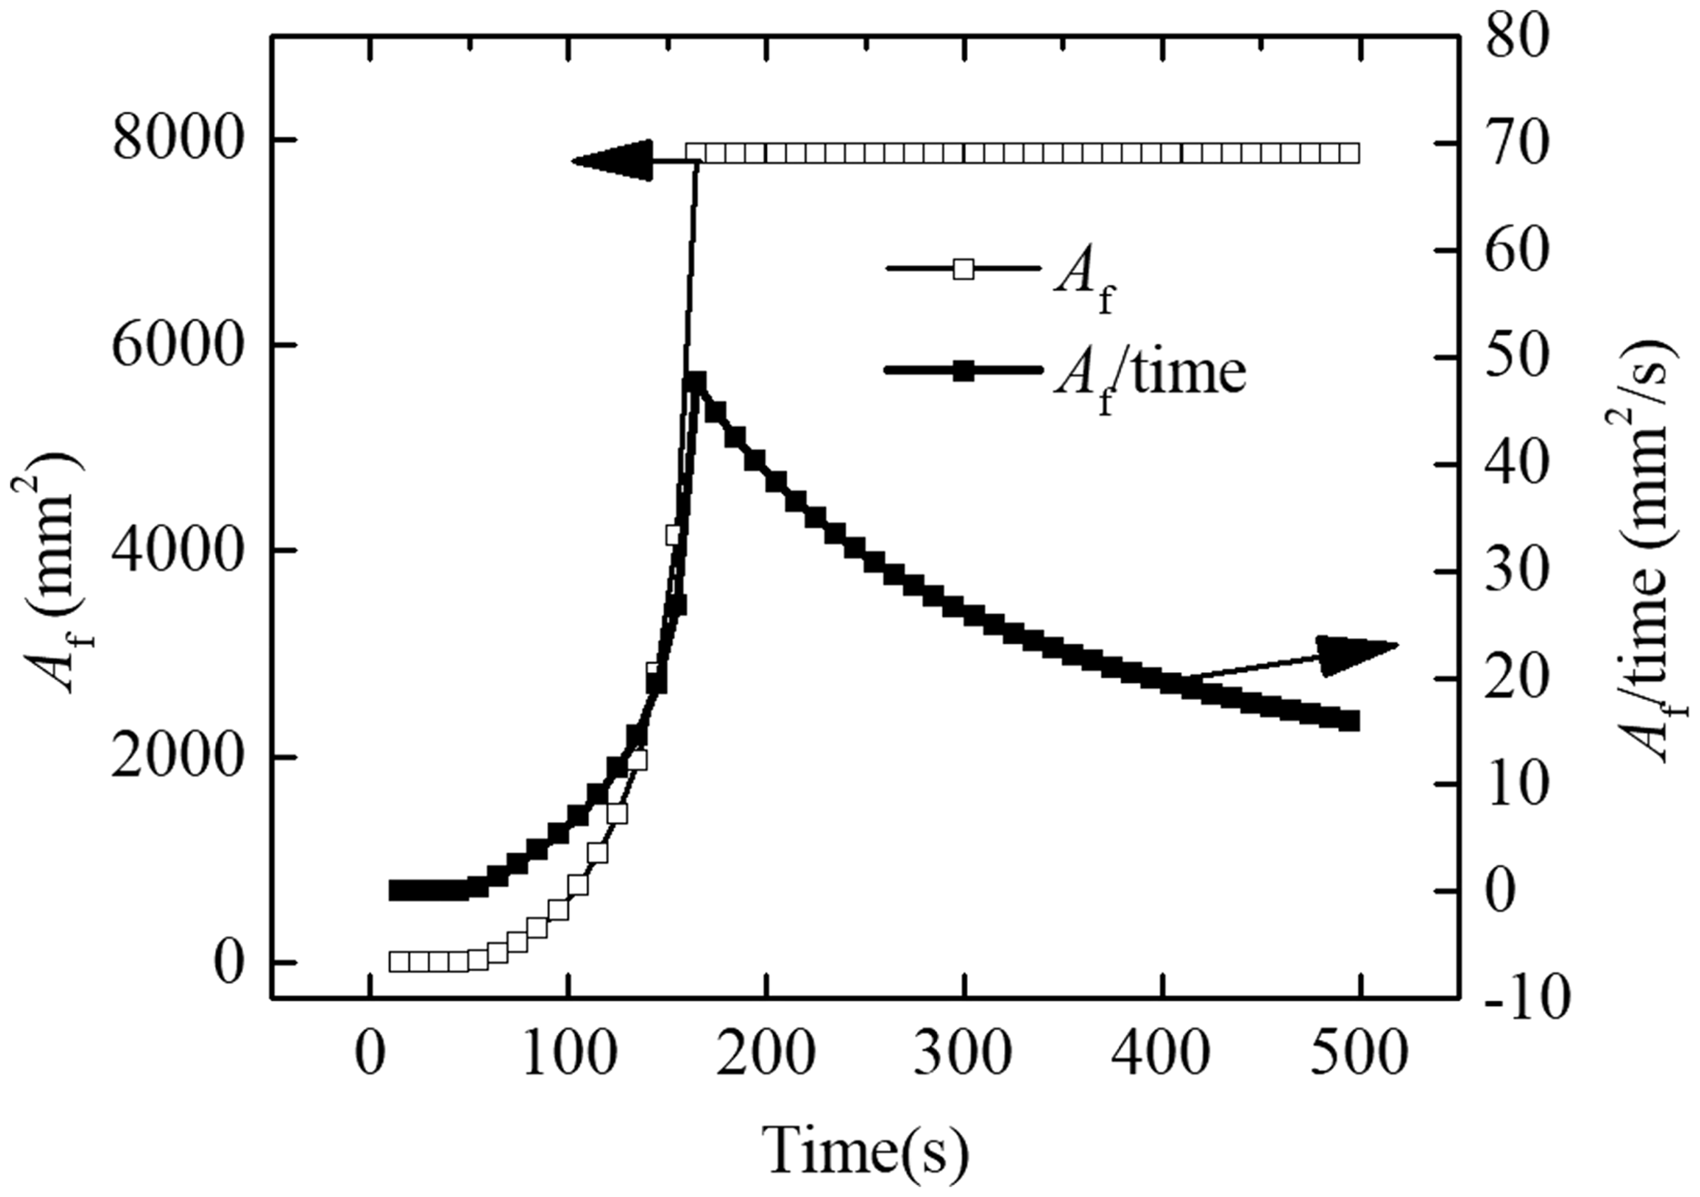
Conclusions
The two-dimensional heat and moisture transfer model of thin cotton fabric considering lateral heat and moisture transmission under the impingement drying condition for obtaining the moisture content and temperature distribution of the fabric was developed in this study. Variation curves of the temperature and moisture content over time are obtained using the theoretical model. From the study, it is concluded that:
The fabric temperature rises slowly when the fabric contains liquid water, whereas it rises very rapidly after the water in the fabric is all evaporated. During the drying process, the time is spent mostly evaporating the water in the fabric; The moisture content decreases nonlinearly over time. Thus, it can be deduced that the drying time can be reduced if the drying of fabric can be designed to be carried out in steps: the large drying rate is used for the high moisture content in the fabric, and the small drying rate is used for the low moisture content; The temperature distribution of the fabric becomes non-uniform over time. The temperature is the highest at the fabric center and lowest at the edge of the fabric; The increase in drying time can increase the dry area of the fabric and dry fabric area per second, improving the drying efficiency but reducing the production efficiency of the heat setting process. Thus, there exists an optimum drying time in the drying process; The experimental results to test the heat and moisture transfer performance of the fabric in the drying process agree reasonably well with the calculated results, which validates the feasibility of the simulation model.
The research in this study can provide a theoretical basis for the continuum design, manufacture and optimization of the heat setting machine. This model is only used for thin fabric because the difference of the temperature and moisture content along the thickness of the fabric is not accounted for. In the future, the heat and moisture transfer model will be improved to expand the application and more experiments will be carried out to study the heat and mass transfer performance in the fabric with various materials and structures in detail.
Supplemental Material
Supplemental material for Heat and moisture transfer performance of thin cotton fabric under impingement drying
Supplemental material for Heat and moisture transfer performance of thin cotton fabric under impingement drying by Miao Qian, Jinghan Wang, Zhong Xiang, Zhewei Zhao and Xudong Hu in Textile Research Journal
Footnotes
Declaration of conflicting interests
The authors declare that there is no conflict of interest with respect to the research, authorship, and/or publication of this article.
Funding
The authors disclosed receipt of the following financial support for the research, authorship, and/or publication of this article: This work was supported by the National Natural Science Foundation of China (Grant No.s U1609205, 51505420, 51605443), the Zhejiang Provincial Public Projects of China (Grant No. LGG18E050022), and the Young Researchers Foundation of Zhejiang Provincial Top Key Academic Discipline of Mechanical Engineering of Zhejiang Sci-Tech University (Grant No. ZSTUME02B13).
References
Supplementary Material
Please find the following supplemental material available below.
For Open Access articles published under a Creative Commons License, all supplemental material carries the same license as the article it is associated with.
For non-Open Access articles published, all supplemental material carries a non-exclusive license, and permission requests for re-use of supplemental material or any part of supplemental material shall be sent directly to the copyright owner as specified in the copyright notice associated with the article.