



Abstract
In order to further understanding of the research status and fronts, a novel method was adopted in the textile and apparel field to perform knowledge mapping of protective clothing research over the last 20 years. The database of 1735 articles was built based on records retrieved from the Web of Science. Visualization software, CiteSpace, combined with Google Earth was applied to determine intellectual basis and research fronts for the protective clothing domain. Research area analysis indicated that the top ranked field was the “Materials Science” with a number of articles of 427. Publication distribution revealed that the Textile Research Journal was the most popular cited and citing journal of the protective clothing articles. The USA and China were the two primary countries contributing to the protective clothing research evidenced by the frequency, bursts and centrality. Donghua University, North Carolina State University and the University of Alberta, with a high publication frequency and centrality, were identified to be the main research drivers. The intensity of red nodes in the geographical visualization map proved the core status of Europe and America in the global cooperation network. According to the co-occurrence analysis, the three keywords of exposure, performance and heat stress were detected to be the most popular research topics over the last 20 years, corresponding to the study of exposure environment, performance evaluation and thermal physiology. The keywords in recent years suggested the research trend of enhancing the mechanism and fundamental investigation of the heat transfer process and fabrics.
Functional clothing is determined as clothing or assemblies that are specifically engineered to deliver performance or functionality to users. 1 Protective clothing is considered as one branch of functional clothing, providing protection for individuals who are exposed to the life threatening or hazardous environments. 1 A variety of research directions on protective clothing have been investigated during recent decades, including heat stress and heat balance,2–4 clothing ventilation, 5 thermal insulation, 6 thermoregulation, 7 air gaps, 8 the application of phase change materials, 9 heat and moisture transfer modeling, 10 etc. The performance evaluation of protective clothing by developing novel test methods has also been a key research direction in the last few decades.11–13 Considering that the advances of the edge of knowledge and theories of academic disciplines rely on theoretical and empirical contributions made by individual studies, the review of previous research is essential and valuable. 14 Scholars from the research area of protective clothing have reviewed the literature, focusing on the specific topics of thermal ergonomics, 15 ventilation, 16 thermal sensors, 17 air gaps, 18 service life 19 and so forth. These literature reviews performed in-depth analysis in terms of research background, methodology and achievements, and predicted the development trends of a specific subject in the study of protective clothing, which is of great meaning for further research from a common intellectual base. However, the interactive relationship of diverse research directions under a main category was seldom mentioned, probably leading to potential development patterns being ignored. Moreover, to explore the research area of authors and institutions would provide more possibilities for academic communication and collaborations, generating dramatic creativity and innovation.
A new approach is required to conduct a systematical analysis of the intellectual basis and trend of protective clothing. Bibliometrics is a method used to evaluate and predict academic status and development tendencies by exploring the characteristics of publications, 20 which has been applied in a number of research fields21–23 for pattern identification in terms of countries, institutions, journals, authors and keywords. 24 In order to further understanding of the research status and fronts for the large category of protective clothing, it is necessary to apply the approach of bibliometric analysis.
Knowledge visualization is a branch of visualization technologies, which conveys information by creating images, diagrams or animations. 20 Developing the scientific knowledge map is contributing to the data mining of scientific literature. According to Chen, 25 the primary goal of knowledge visualization is to detect and monitor the evolution of a knowledge domain. Knowledge visualization has been adopted to explore the trend of such fields as medical science, management science, information science, library science, etc. 26 CiteSpace, 27 Jigsaw 28 and Carrot 29 are three of the visualization analysis software systems used for text analysis. 30
In particular, CiteSpace is a Java application developed at the College of Computing and Informatics in Drexel University, which is the birthplace of author co-citation analysis (ACA), 27 which aims to detect and visualize emerging trends and transient patterns in scientific literature. 31 The publications could be divided into two types, where the articles with persistently high citations are the classic ones and those with citations that peaked in the short-term are the transient ones. Most of the publications are transient,31,32 and are essentially related to the research front at different time periods. 33 To build a complete article database is the foundation for visual analysis of a specific topic. In general, there are two methods to construct a database. One is to search the articles by relevance, such as matching terms from the title, topic, abstract or keywords. The other is to search records with a seed article, to reconstruct the structural representations prior to and after it. 33 Co-citation, co-authorship and co-occurrence analysis are three of the significant functions of knowledge mapping software.
In this study, the visualization method was applied to perform knowledge mapping for protective clothing research. By using the source of the Web of Science, the literature database was built. The co-citation footprint in the scientific literature was explored to determine the knowledge basis of protective clothing. Co-authorship was investigated in terms of countries, institutions and authors. Dual-map overlay and geographical visualization were adopted to illustrate the cooperation network. The keywords at different stages were exhibited to provide the intellectual base of research fronts for the protective clothing domain.
Methodology
Database building for visual analysis
In the present study, protective clothing was selected as the research subject, which was regarded as the topic searched in the Web of Science Core Collection. The document types in the Web of Science include articles, abstracts of a published item, art exhibit reviews, bibliographies, etc. In this study, only articles were retrieved as the document type in order to restrict the numbers of documents, avoid unnecessary duplication and control the quality of the target documents. The publication time ranged from 1999 to 2018 (updated to May), which contained records for the last 20 years. To construct the knowledge map and evolution footprint completely for protective clothing research, the record content of full record and cited references were saved in the file format of plain text, which met the format and processing requirements of the visualization analysis software. All documents should at least contain the elements of document type, paper title, keywords, abstract, author name, institution, cited reference, total citation, etc. These elements will contribute to the co-citation (cited reference, cited author, cited journal), co-authorship (author, institution, country) and co-occurrence (term, keyword, category) analysis.
The download operation was performed four times to retrieve the records of 1735 articles, since the download limit of the Web of Science is 500. In order to understand the database for knowledge mapping comprehensively, the data of the sum of times cited per year were obtained from the Web of Science by the function “Create Citation Report.” Research areas were summarized by the function “Analyze Results” in the Web of Science as well.
Analysis method for knowledge mapping
CiteSpace (Version 5.2.R2) was applied as the main analytical tool to perform knowledge mapping for protective clothing research. Google Earth (Google Inc., 2018) was utilized with CiteSpace to generate the geographical collaboration network.
Three visualization views are provided by CiteSpace, which are the cluster view, timeline view and timezone view. The cluster view emphasizes the knowledge structure of different research directions. Illustrating the research basis for a certain topic during a period of time and the relationship between different topics are the features of the timeline view. The timezone view describes the evaluation and interaction of various research topics in the time dimension. CiteSpace adopts several structural and temporal metrics of co-citation networks and subsequently generated clusters, including modularity, silhouette, burstness and betweenness centrality. 34
Modularity and silhouette metrics provide quality indicators of clustering and network decomposition. 34 The value of modularity ranges from 0 to 1. A low modularity suggests a network that cannot be reduced to clusters with clear boundaries, whereas a high modularity indicates a well-structured network. The silhouette is a value with which to evaluate the homogeneity of a cluster, ranging from −1 to 1. The larger value implies higher inter-cluster connectivity, namely consistency.34,35 In CiteSpace visualizations, clusters are labeled by candidate terms selected from the title, keywords and abstract of the documents by ranking algorithms. The cluster ID is the number after clustering, where a smaller number indicates a larger cluster.
Besides the citation counts, burst and centrality are two critical indicators to substantially reduce the complexity of a visualized network. Li et al. 14 demonstrated that the burst referred to a significant change of the value of a variable in a relatively short time, which was considered by CiteSpace as an approach to identify the emergent research front concepts. Kleinberg’s burst detection algorithm 36 was adapted and embedded in CiteSpace. The centrality metric is defined for each node in a network. 34 Freeman’s betweenness centrality metric 37 was used to highlight potential pivotal points of paradigm shift over time. 38 In CiteSpace, the purple circle represents a record with high centrality (≥0.1).
Parameters setting for knowledge mapping
In this study, the retrieved publications were filtered and duplicates were removed in CiteSpace so as to identify that each article was unique in the database. Secondly, the co-citation of the protective clothing publications was processed to determine the knowledge basis. The knowledge clusters were categorized and major clusters were identified. The publication distribution and core scholar study were also conducted based on the cited journal and cited author. Thirdly, the co-authorship network was constructed in terms of countries, institutions and authors. Finally, the co-occurrence analysis of keywords for the different stages of the last 20 years was performed, which indicated the knowledge evolution of the past, hot topics and research fronts in the protective clothing field.
Different parameters were set for certain types of analysis in CiteSpace. The time span of this study was from 1999 to 2018, and it was separated into four parts for the co-occurrence analysis. All of the time slices were 1 year, and the term sources were the title, abstract, author keywords and keywords plus. The node type was chosen for a specific knowledge map, such as cited reference, institution or keyword. As for the selection criteria, the top 50 levels of most cited or occurred items from each slice were selected. The results were visualized by the cluster view and timezone view after computing. In addition, the term, article or cluster was displayed by frequency, bursts and centrality as well.
Results and discussion
Database analysis based on the Web of Science
Total publications and sum of times cited from 1999 to 2018 according to the Web of Science are depicted in Figure 1. A total of 1735 publications were retained. The number of published papers remained stable from 1999 to 2007; meanwhile, the citation counts dramatically increased by nearly 45 times. After the year 2008, the growth rate of publications for protective clothing increased, with smaller reductions in 2009, 2013 and 2017 than the previous years. The average increase rate of publications was 5.7% from 1999 to 2017, which was in accordance with the estimation of the scientific literature to grow at a rate of 6% per year.
39
A continued growth could be detected for the citation counts. There were 206 times more citations in 2017 than there were in 1999, and 3.6 times more citations in 2017 than 2007. The records for 2018 were not compared since they were only updated to May.
Total publications and sum of times cited from 1999 to 2018 according to the Web of Science. Note: Data updated to May 2018.
The top 20 research areas of the 1735 publications for protective clothing are presented in Figure 2. The top ranked area was the “Materials Science” with an article number of 427, which accounted for 24.6% of the total publications, closely followed by the area of “Public Environmental Occupational Health” with a proportion of 24%. The other three of the top five areas were “Engineering,” “Environmental Sciences Ecology” and “Dermatology.” The number of publications in the areas of “Dermatology,” “Polymer Science” and “Sport Sciences” were quite close with numbers of 98, 97 and 93, respectively. The results indicated that a considerable number of articles published in the protective clothing domain aimed to improve occupational health, while the methods probably emerged in the materials science field.
Top 20 research areas of the protective clothing publications retrieved from the Web of Science.
Co-citation analysis for protective clothing research
Knowledge basis determination based on cited references
The visual analysis of the cited references reflects the citation and co-citation footprint in scientific literature.
31
The co-citation analysis has been extensively adopted to explore the intellectual base, which is the collection of scholarly works that have been cited by the corresponding research community.
40
Taking advantage of the visual analysis, a map of co-citation clusters of protective clothing was obtained, which is depicted in Figure 3. The top 50 most cited publications in each year were used to construct a network of references cited. The synthesized network contained 36,082 references. A high modularity (0.8846) of the co-citation network demonstrated that the specialties in science mapping were well defined by clusters. Numerous small clusters were regarded as the main reason for a relative low average silhouette value of 0.3056. However, the silhouette scores of the major clusters that were focused on in the review were sufficiently high.
Co-citation clusters for protective clothing.
Since the number of merged network nodes was more than 350, the function of compute centrality in metrics was performed to carry out the computation of betweenness centrality. The outlines and the colors of the area indicate the range of the cluster and the time when co-citation links appear, respectively. The cluster labels could be defined by term frequency–inverse document frequency (TFIDF), log-likelihood ratio (LLR) and mutual information (MI) algorithms. Labels selected by TFIDF weighting tended to represent the most salient aspect of a cluster, whereas those chosen by LLR tests and MI tended to reflect a unique aspect of a cluster. 34 The cluster labeled as #0 indicates that this cluster was cited by articles on air gaps, and cluster #1 was cited by articles on mechanical performance.
Details of the largest four knowledge clusters

TFIDF: term frequency–inverse document frequency; LLR: log-likelihood ratio; MI: mutual information.
The top ranked item by bursts was detected in cluster #2 with a value of 7.21. This reference investigated the passive cooling method during work in warm environments while wearing firefighting protective clothing. 4 The study of Song 44 ranked in second place with bursts of 7.05 for the theme of air gaps. The third is Aoyagi et al., 45 to investigating heat tolerance during exercising while wearing protective clothing in cluster #6. The air gap, thermal ergonomics and compensable heat stress were the three most active topics in the protective clothing research field. Both of the citations on air gaps and thermal ergonomics emerged almost at the same time around 2001. The topics of air gaps and mechanical performance were still the co-citation focuses until 2018.
Publication distribution study based on cited journals
Before using CiteSpace, the Web of Science was applied to analyze the source titles of the publications of protective clothing research for the last 20 years. The results demonstrated that the 1735 articles were published in 637 journals, suggesting that the study of protective clothing was extensive in a variety of fields. The Textile Research Journal was the first choice for these publications with a proportion of 4%, followed by Fibres & Textiles in Eastern Europe (2.9%) and Annals of Occupational Hygiene (2.3%). Among the top 10 ranked source titles, four journals (the Textile Research Journal, Fibres & Textiles in Eastern Europe, the International Journal of Clothing Science and Technology and the Journal of Industrial Textiles) were in the field of textile and clothing research, and the other six were in the fields of occupational hygiene and ergonomics.
The function of cited journals was adopted to explore the co-citation network in CiteSpace. The result is displayed in Figure 4, where the color represents the publication year, larger circles reflect a higher citation frequency and purple circles represent key journals with high betweenness centrality. Table 2 shows top five cited journals by citation counts and centrality. The top ranked item by citation counts was the Textile Research Journal, with a citation count of 363. The second was Ergonomics, with a citation count of 272, followed by the Journal of Applied Physics. In terms of centrality, the Textile Research Journal was behind Science and reached second place with a centrality value of 0.18. The other three journals of the top five were in the domains of medicine and environmental sciences.
Cited journal network for protective clothing research. (Color online only.) Top five cited journals by citation counts and centrality
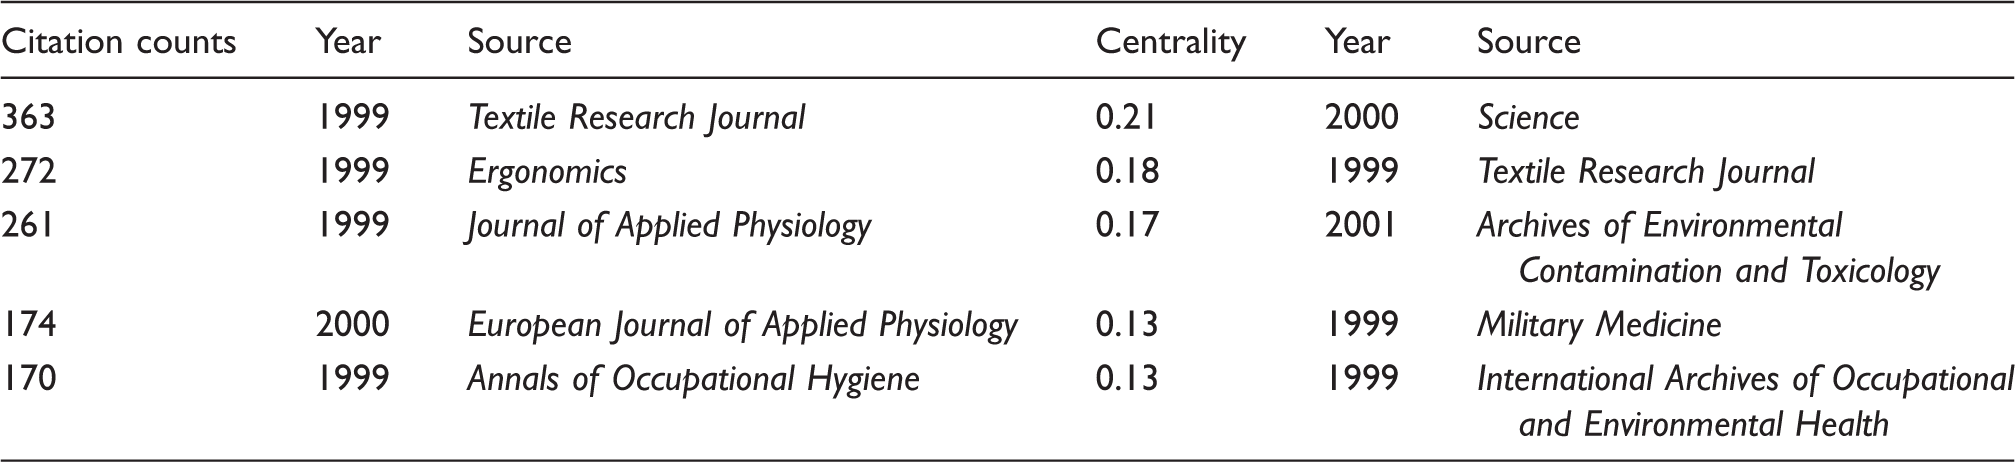
From the perspectives of publication (Web of Science) and citation distribution (CiteSpace), the Textile Research Journal provided a great space for protective clothing research. The research was closely related to individuals’ safety, health and well-being; hence, the investigations covered a large number of areas, such as medicine, environmental sciences, occupational hygiene and textiles. This also drove protective clothing to be a highly multi-interdisciplinary field.
A dual-map overlay of the science mapping literature represents the entire dataset in the context of a global science map, which is generated from over 10,000 journals indexed in the Web of Science.38,40 To explain the network of cited and citing scientific fields for protective clothing research more adequately, a journal dual-map overlay visualization on a global map of science was performed and is illustrated in Figure 5. The function of Journal Citation Reports (JCR) journal maps under the overlay maps was used based on the 1735 articles retrieved from the Web of Science. There are two base maps in the same figure, where the left is the map of citing journals and the right is the map of cited journals.
38
The spline waves in the figure reflect the citations made by source articles, and each spline curve starts from a citing journal and points to a cited journal.
46
All journals on the base map are assigned to clusters and major clusters are labeled by terms chosen from the titles of journals in corresponding clusters.38,46
Dual-map overlay visualization for protective clothing research.
The largest disciplines of the citing articles were physics, materials and chemistry, followed by medicine, medical and clinical in this study. The representative journals of these two disciplines were the Textile Research Journal and Annals of Occupational Hygiene, respectively, which was in accordance with the results of the publication distribution. The majority of the citations were directed toward disciplinary areas such as chemistry, materials and physics, and sports, rehabilitation and sport in the cited base map. The corresponding journals of these two disciplines are the Textile Research Journal and Ergonomics, which were confirmed by analyzing the results of the top two cited journals by the citation counts displayed in Table 2.
Core scholar study based on cited authors
The knowledge map of cited authors based on the publication references could provide information on influential research groups and potential collaborators.
24
The function of cited authors was used in CiteSpace to detect the remarkable scholars in the protective clothing research domain. Major clusters were obtained and are shown by cluster view in Figure 6, where different colors represent corresponding clusters. Liquid cooling, kidskin intervention and thermal protective performance were the three largest clusters, with silhouette scores of 0.704, 0.855 and 0.905, respectively. The contributing scholars of clusters #0 and #2 were magnified and are presented in Figure 6. Havenith G, Holmer I and McLellan TM were three of the core scholars for liquid cooling research. As for thermal protective clothing, the publications of Torvi DA, Song G and Barker RL gained extensive attention. Stoll AM and Henriques FC made great contributions on skin burn injury prediction, providing indicators and approaches for thermal performance evaluation of protective clothing.
Cited author network for protective clothing research. (Color online only.)
Top 10 cited scholars by citation counts, bursts and centrality

Co-authorship analysis for protective clothing research
Contributing countries
Top 10 contributing countries by frequency, bursts and centrality

The top ranked item by bursts was the USA with a value of 23.58, from 1999 to 2001. The second was China with bursts of 15.01, starting from 2013 to 2018. The third was Finland and one of their research focuses was developing a smart clothing prototype for the arctic environment. 51 The top ranked item by centrality was also the USA, with centrality of 0.40. The analysis indicated that the cooperation of countries and regions was intensive and extensive for the research of protective clothing. According to the collaboration network acquired by Cite Space, the USA cooperates closely with China, Canada, England, and so on. The cooperation countries covered Asia, America, Europe, Oceania and Africa, which indicated the openness and cooperation of the USA. The academic achievements of the USA further validated the energy and creativity inspired by collaboration.
Contributing institutions
An analysis in terms of contributing institutions, shown in Figure 7 and Table 5, indicated that Donghua University ranked first with 85 articles, followed by the USA (38) and the University of Alberta (28). The highest centrality value of 0.19 also evidenced the strongest collaboration of Donghua. The cooperation institutions of Donghua included the prestigious universities and institutions domestic and overseas, for instance, Hong Kong Polytechnic University and Soochow University in China, the University of California-Davis, Cornell University and Iowa State University in the USA, the University of Alberta in Canada, Lund University in Sweden, and Empa in Switzerland, etc. One of the major reasons for the domestic academic cooperation was that the young scholars receiving a doctor’s degree in Donghua will usually find employment with other domestic universities, promoting cooperation between these two institutions. Except for the joint education programs with universities abroad for Donghua, the most important reason for international cooperation was the support of the China Scholarship Council.
52
As for centrality, the other two institutions with centrality values over 0.1 were North Carolina State University and the University of Georgia.
Contributing institutions network. Top 10 contributing institutions by frequency, bursts and centrality NIOSH: National Institute of Occupational Safety and Health.

The ranking in terms of bursts was different from frequency and centrality. The top ranked item by bursts was the USA with a value of 14.66, and the burst period was from 1997 to 2007. The second one was the University of Alabama (5.93), with a burst period from 1999 to 2001. The Defence and Civil Institute of Environmental Medicine ranked third. Clustering was performed for institutions and cluster labels are shown in Figure 7. The National Institute of Occupational Safety and Health (NIOSH) was one of the promoters for the research of protective behavior, and Donghua University was the main contributor for cluster #1 of steam exposure. However, an institution will not be inclined to focus on one topic in general, and the clustering results could provide a frame of reference for one of the primary research topics of these institutions.
Contributing authors
Figure 8 presents the largest cooperation group of contributing scholars of protective clothing research, which demonstrated the mutual cooperation of the prolific academic authors. Li J made a large number of academic achievements on clothing thermal comfort,
53
thermal protective performance54,55 and clothing ergonomics
56
after 2012. The publication of Song G could be detected around 2004 and his articles that attracted the most attention were published in 2011.57,58
Contributing scholars of the largest group.
Top 10 contributing authors by frequency, bursts and centrality

Geographic visualization of co-authorship
A geographical visualization was performed of the collaboration network based on Google Earth, so as to exhibit the cooperation for protective clothing globally (Figure 9). The curves were colored by a spectrum that ranges from cold colors, such as blue, to warm colors, such as red, to represent different years. The globally cooperative relationship was represented by dividing the 20 year into five time periods, to clearly illustrate the collaboration among different countries and continents. Only a few instances of cooperation were found from 1999 to 2002 due to the limited research of protective clothing. As for the time span from 2003 to 2006, the collaborations within the Europe and Europe with the USA were significant. More relations emerged after 2007, and the collaboration of Europe and the USA continued and deepened from 2007 to 2018. The cooperation between Europe and Australia during 2007 and 2010 was noticeable. A greater relationship was established between China and South Korea from 2011 to 2014, and intensive collaboration within India after 2015 was discovered from the geographical visualization.
Geographical visualization of the collaboration network based on Google Earth. (Color online only.)
The collaboration of scholars from the world was expanded and deepened over time. The local area views of Europe, America and Asia displayed cooperation nodes from 1999 to 2018. The densest red nodes evidenced the broad and intensive cooperation in Europe, followed by America. Relatively fewer cooperation nodes were found in Asia. In the context of globalization, it is predictable that the cooperation of protective clothing research will be more thorough.
Co-occurrence analysis for the research topics and trends
Top 10 keywords by frequency, bursts and centrality

In order to determine the protective capacity of the clothing, performance evaluation was critical. Quantities of academic achievements on thermal protective performance, 61 radiant protective performance 62 and steam protective performance 63 could be found, contributing to the high frequency of the keyword of performance. The keyword of mannequin with a burst value of 6.91 was a significant test technique for protective clothing, 64 including the thermal manikin, 65 sweating manikin 66 and flame manikin. 67
Heat stress was also a popular topic for the protective clothing domain,68,69 which ranked top 10 in frequency as well as in centrality lists. The actual wear trial was an effective approach for heat stress investigation. An exercise (frequency, 89) procedure that was required in general and rectal temperature (bursts, 6.03) was a critical evaluation indicator. Moreover, the subjective assessment of tolerance (bursts, 5.99) was regularly considered as well.
The keywords of protective clothing at different stages are shown by centrality in Figure 10. The timezone view was used to illustrate the keywords; however, plenty of elements overlapped. In order to display the keywords for different stages distinctly, the function of minimizing overlaps of the node labels were applied. The labels were depicted by centrality and the larger label indicated higher centrality. It was apparent that exposure was the keyword with the highest co-occurrence centrality during the period of 1999–2003, followed by response and heat stress. During the period 2004–2008, heat stress was also a popular topic, along with exercise and environment. In the third stage from 2009 to 2013, the terms behavior and injury became hot topics, as well as epidemiology and electrospinning. For the last few years, the keyword textile ranked first for protective clothing research. Heat transfer and thermal insulation were also research focuses.
Research keywords at different stages exhibited by centrality.
Integrating the results of Table 7 and Figure 10, the keywords of performance (2014–2018), fabrics (2015–2018), surface (2016–2018), heat transfer (2015–2018), and air gap (2015–2018) had high bursts in recent years. Performance, heat transfer and air gap could be classified together by investigating the heat transfer mechanism in air gaps and clothing systems in order to improve protective performance. The other branch of the study on optimizing clothing performance was to conduct fundamental research on fabrics. Surface treatments, such as coating or finishing, could provide the functions of being waterproof, wind resistant and gas leak-proof and increasing reflectivity to reduce radiation heat transfer. These keywords provided perspective for the research frontiers of protective clothing research.
Conclusions
The function of protective clothing is to provide protection for people entrapped in dangerous or extreme environments. A variety of studies have been performed during recent decades, and literature reviews have been published focusing on specific topics. Developing the scientific knowledge map was a novel method in the textile and apparel area, which was adopted to further understanding of the research status and fronts of protective clothing over the last 20 years. The database of 1735 articles related to protective clothing was built based on records retrieved from the Web of Science. The visualization software, CiteSpace, combined with Google Earth was adopted to determine intellectual basis and research fronts for the protective clothing domain.
Bibliometric analysis indicated that publications increased from 63 in 1999 to 144 in 2017, and there were 206 times more citations in 2017 than there were in 1999. According to the research area analysis, the top ranked field was the “Materials Science” with an article number of 427, which accounted for 24.6% of the total publications, closely followed by the area of “Public Environmental Occupational Health” with a proportion of 24%. Co-citation analysis demonstrated that the air gap, mechanical performance and thermal ergonomics were the three major clusters for protective clothing research, and all of the silhouette values were greater than 0.8. Publication distribution revealed that the Textile Research Journal was the most popular cited and citing journal for protective clothing articles. Ergonomics and the Annals of Occupational Hygiene were two representative journals in the ergonomics and occupational fields, driving protective clothing to be a highly multi-interdisciplinary field.
The USA and China were the two primary countries contributing to protective clothing research, evidenced by the frequency, bursts and centrality. The cooperation countries of the USA covered Asia, America, Europe, Oceania and Africa. The academic achievements of the USA further validated the energy and creativity inspired by collaboration. Donghua University, North Carolina State University and the University of Alberta, with a high publication frequency and centrality, were identified to be the main research drivers. The cooperation institutions of Donghua, with the highest centrality value, included prestigious universities and institutions both domestic and overseas. Havenith G from Loughborough University, Holmer I from Lund University and Song G from Iowa State University were the most cited scholars. Li J from Donghua University, Song G from Iowa State University and McLellan TM from the Defence and Civil Institute of Environmental Medicine were the top three contributors for protective clothing research. The collaboration of scholars from the world was expanded and deepened over time. The intensity of red nodes in the geographical visualization map proved the core status of Europe and America in the global cooperation network.
According to the co-occurrence analysis, the three keywords of exposure, performance and heat stress were detected to be the most popular research topics over the last 20 years, corresponding to the study of exposure environment, performance evaluation and thermal physiology. The keywords in recent years suggested the research trend of enhancing the mechanism and fundamental investigation on the heat transfer process and fabrics. Limitations still existed by using professional software for knowledge mapping. However, this study provided a new approach to perform a literature review, identifying the intellectual milestones and predicting research frontiers.
Footnotes
Declaration of conflicting interests
The authors declared no potential conflicts of interest with respect to the research, authorship and/or publication of this article.
Funding
The authors disclosed receipt of the following financial support for the research, authorship, and/or publication of this article: This work was supported by the National Nature Science Foundation (Grant Number 51576038), the Fundamental Research Funds for the Central Universities (Grant Number 2232018G-08), the Shanghai Municipal Natural Science Foundation (Grant Number 17ZR1400500), Start-up Research Funding for Young Teachers of Donghua University (Grant Number 107-07-0053017) and the Shanghai Summit Discipline in Design.