



Abstract
This study introduced multi-quality optimization using the Taguchi method combined with response surface methodology (RSM) and the particle swarm optimization (PSO) method for synthesizing pressure sensitive adhesives (PSAs) of ultraviolet curing optically clear adhesives (OCAs). The process parameters used in this study included 2-ethylhexyl acrylate (2-EHA) monomer content, the photoinitiator content and the oligomer content using N,N-dimethylacrylamide and acrylic acid. The quality responses included the peel strength, the transmittance, the haze and the refractive index. The Taguchi method was adopted because it could reduce the number of experiments and cost, as well as effectively arriving at a single optimum parameter. The results from the Taguchi method were combined with RSM and PSO to obtain a single composition that has the optimum response for all qualities. The results of the confirmation experiment showed that the optimum parameters were 80 wt% of 2-EHA content, 4.32 wt% of photoinitiator content and 45 wt% of oligomer content, which could obtain the peel strength at 720.3 g/25.4 mm, transmittance up to 97.94%, haze of only 1.93% and refractive index at 1.48. All of qualities meet the industrial requirement of OCA PSAs.
Keywords
Coating and laminating are leading techniques in the development and improvement of functional textiles. Cheaper and ordinary fabric structures may be coated or laminated to provide a specific function or added with some unique properties for higher values and profits. 1 Adhesives play a key role in the transformation and assembly of various materials in coating and laminating techniques. 2 Adhesion is the foundation to the coating and laminating processes. If the adhesion fails, the product ceases to perform adequately at the user end. Adhesion failure is a common customer complaint, reflected in poor product performance and adverse aesthetics. 3 Pressure sensitive adhesives (PSAs) are one of the most important bonding systems in the textile industry.4–6 Acrylic-based PSAs are superior in optical performance, as compared with other adhesives, offering such advantages as high transparency and resistance to the yellowing phenomenon caused by sunrays. 7 With preferential optical properties, acrylic-based PSAs could be a promising adhesive that does not affect aesthetic value.
The current manufacturing technique for PSAs is to use ultraviolet (UV) polymerization, which is characterized by being free of specific temperature requirements, fast curing and having no volatile organic compounds. 8 UV polymerization is commonly used for optically clear adhesive (OCA) PSAs. 9 In previous experimental work, 10 UV curing OCAs were successfully synthesized from 2-ethylhexyl acrylate (2-EHA) and oligomer acrylic acid (AA) and N,N-dimethylacrylamide (DMA). The product showed excellent performance as PSAs, such as high peel strength and good optical properties.
The processing parameters of UV curing OCAs are complicated. Oligomer, photoinitiator and monomer content all affect the properties of OCAs. Oligomer, which consists of low-acid functional monomers, was added to enhance cohesion and reworkability. 10 The photoinitiator provides reactive species for the UV polymerization technique and affects the degree of crosslinking and conversions. 11 An acrylate-based monomer, such as 2-EHA, provides good optical and high peel strength of PSAs. 12 A different combination of processing parameters offers different properties of OCAs. The traditional experimental methods include trial and error, one factor at a time, fractional-factorial experiments and full-factorial experiments, which are time-consuming and demand substantial computing resources. In order to deal with the issue, optimization with a statistical approach was introduced to improve product quality, time and cost. 13 Kisiel 14 used the Taguchi orthogonal array L16 method to investigate the influence of adhesive composition on the peel strength and shear strength of the adhesive system. Mekonnen et al. 15 applied the Taguchi method to optimize lap shear strength under the dry and wet conditions of waste protein-based adhesive. The parameters varied by the Taguchi experimental design and transformed the response using the signal-to-noise ratio (S/N). Barto and Mach 16 conducted a comparison study of the optimization method, by performing full-factorial experiments of the 23 type and using an L4 type Taguchi orthogonal array to examine the processing parameters of electrically conductive adhesive. The results showed that the Taguchi method is very precise for the main factors, but is insufficiently precise for processes with a significant number of interactions. In the above studies, the Taguchi method was adopted to determine the optimum process parameters for a single quality in the adhesive system. However, the Taguchi method is not suitable for determining the optimum parameter setting with continuous values, as well as multi-quality process parameters. 17
In order to deal with the multi-quality problem, the Taguchi method needs to be combined with other methods. Paiva et al. 18 used the Taguchi method and an artificial neural network (ANN) to develop a model for predicting and optimizing the creep rate of the adhesive joints in the footwear industry. The Taguchi design points as input/output patterns and the ANN were developed based on supervised evolutionary learning using the general algorithm. The results showed the sensitivity of each process parameter to the property. Pervez et al. 19 explored the influence and optimization of the factors of a non-formaldehyde resin-finishing process on cotton fabric using a Taguchi-based gray relational analysis. An L27 Taguchi orthogonal array was selected for the design of experiments and coupled with a gray relational analysis for evaluating multiple responses. Kuo et al. 20 conducted multi-quality analysis using the Taguchi method and the elimination and choice translating reality (ELECTRE) method in the optimization process of hot-melt PSAs. The optimization parameters for a single quality taken from an L9 Taguchi orthogonal array were substituted in the ELECTRE method as the base. The worst parameters were eliminated and multiple advantageous process parameters remained for multiple attribute decision-making analysis. As seen from the above studies, the Taguchi method can be combined with other optimization methods to form multi-quality optimization.
In summary, this paper introduces multi-quality optimization of OCA synthesis. The quality characteristics that are optimized are the peel strength, transmittance, haze and refractive index. The Taguchi method was introduced for experimental design with response surface methodology (RSM), and the particle swarm optimization (PSO) method was used for optimization of the process parameter combination. RSM can establish an approximation function, known as the response surface, according to the relation between variables and output with only a small point.
21
PSO use multiple input variables (experimental parameters) and corresponding output quality to establish a multi-dimensional space. The particle migrates randomly in the space for iterative computations to search for the optimum output quality.
22
Using the response surface of RSM as the fitness function can provide PSO with a particle migration path effectively, so as to reduce the computation time and it can quickly and efficiently find the optimum solution. The multi-quality process for the parameter optimization of OCAs is shown in Figure 1.
Multi-quality process flow chart for parameter optimization. OCAs: optically clear adhesives; S/N: signal-to-noise ratio; PSO: particle swarm optimization; RSM: response surface methodology.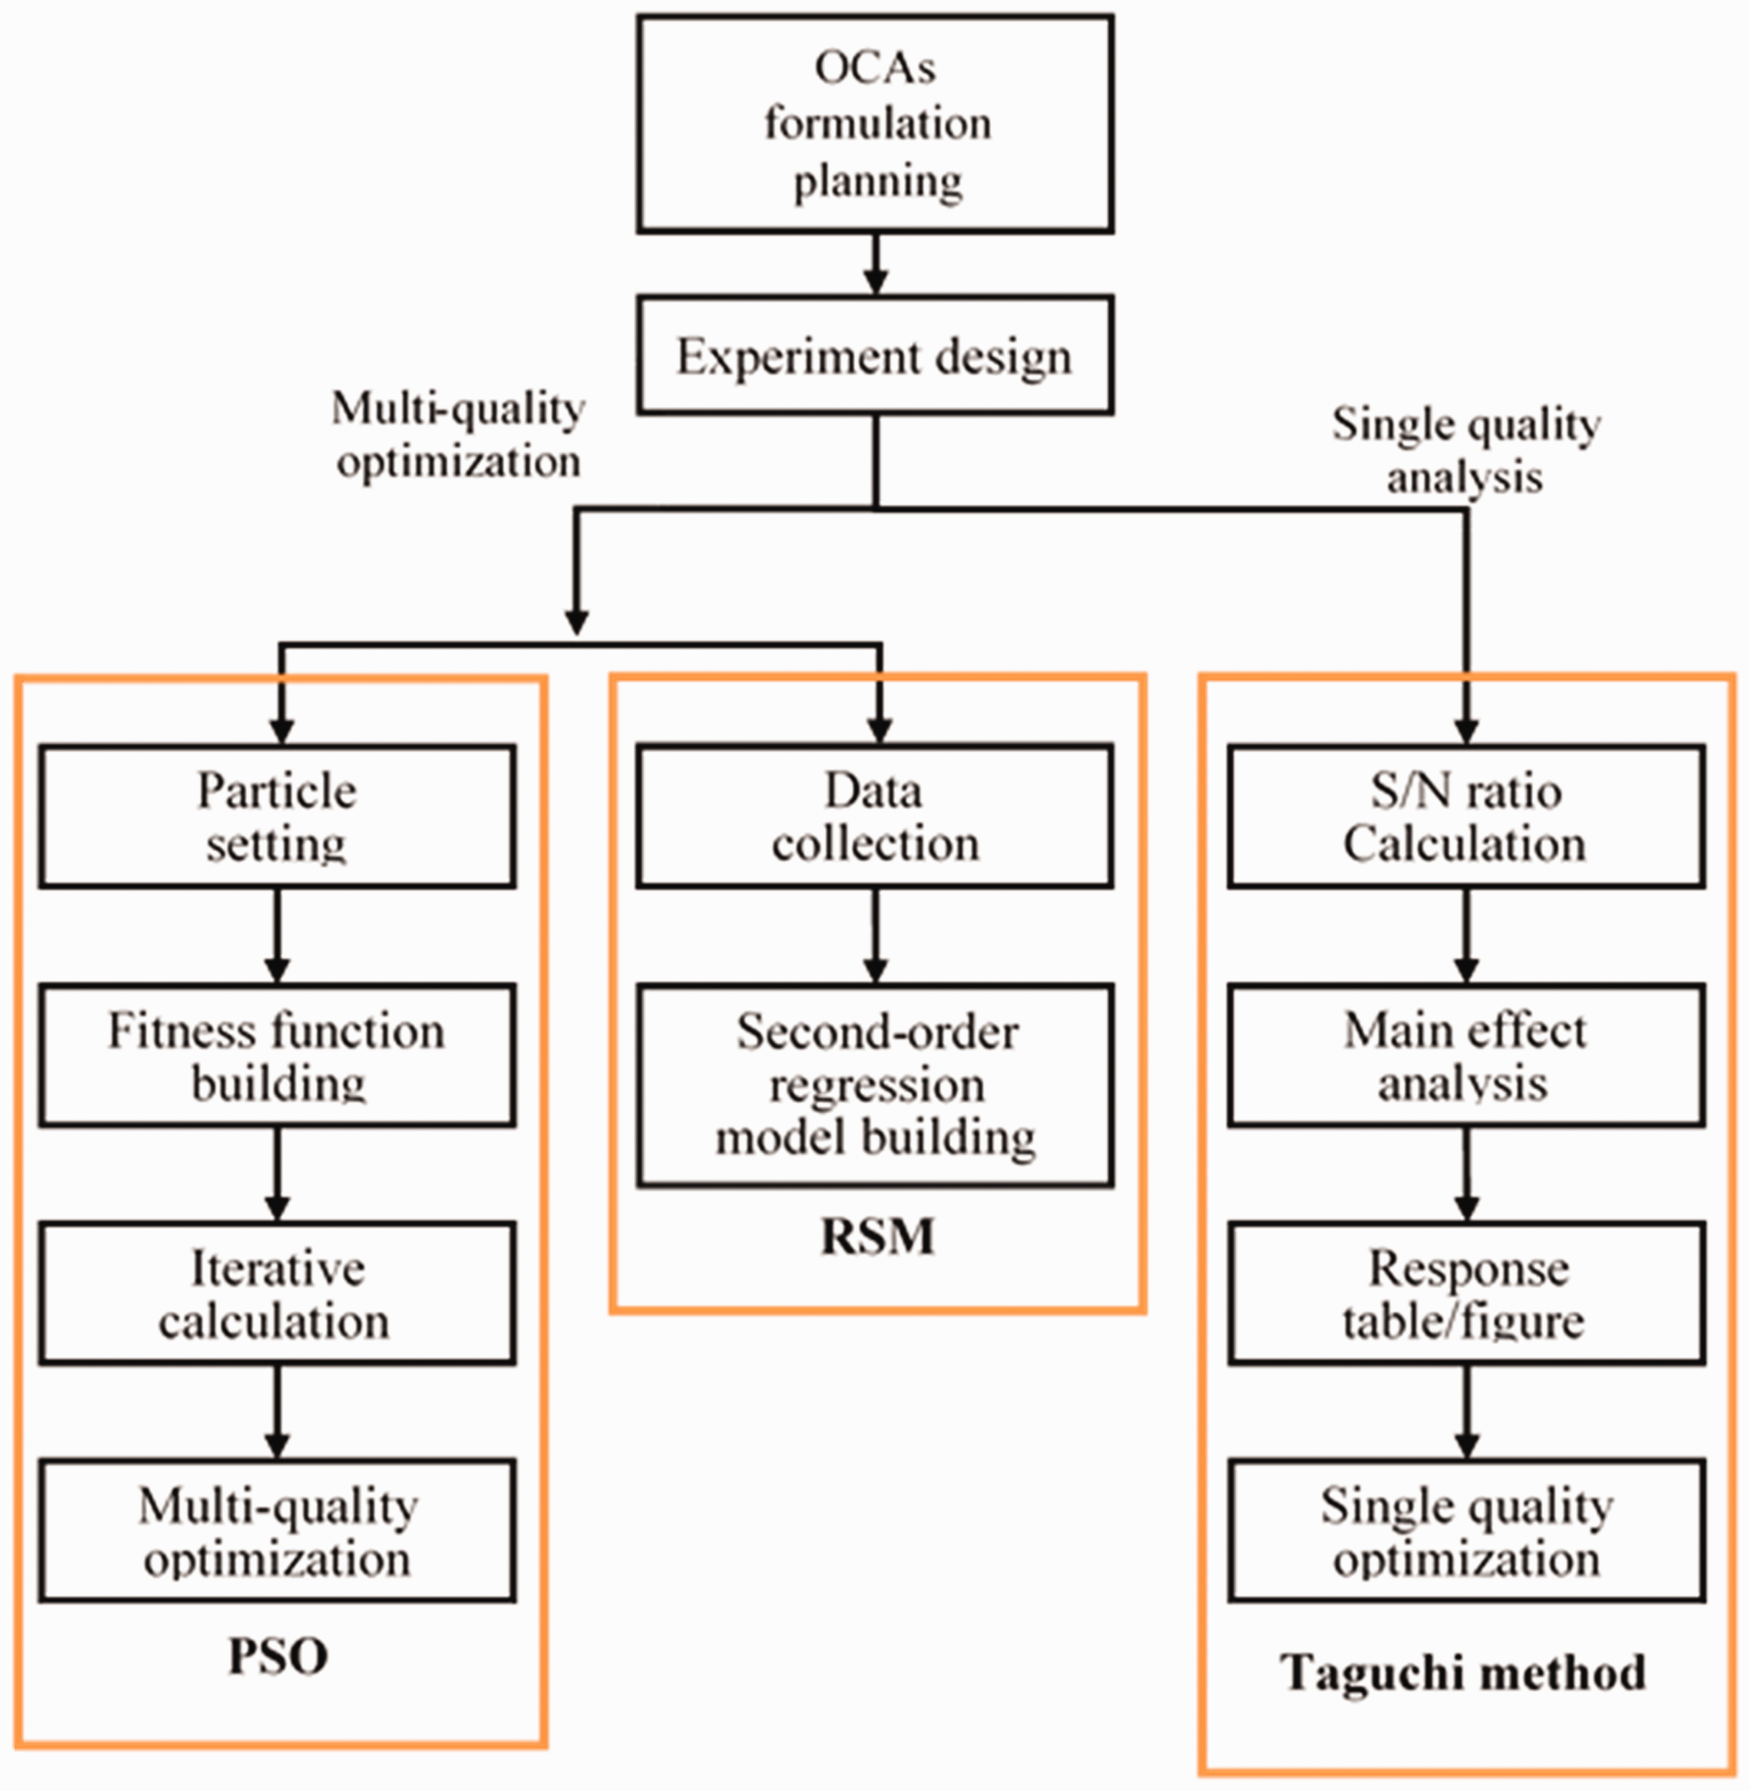
Methodology
Synthesis route of OCAs
This study synthesized OCA PSAs from a 2-EHA, AA, DMA and glycidyl methacrylate (GMA) using the UV polymerization technique. 2-EHA as soft monomer provided flexibility, high peel strength and a good optical property. AA and DMA were combined as a functional oligomer to enhance the cohesion property. GMA as a hard monomer provided good bonding strength. The synthesis route of OCAs is shown in Scheme 1. As shown, there are two steps in the synthesis of OCA PSAs. The first step is the synthesis of a pre-polymer using UV polymerization with 1-hydroxycyclohexyl phenyl ketone photoinitiator. The second step is a reaction between the pre-polymer and GMA using UV polymerization to form acrylic PSAs.
Synthesis route of optically clear adhesive pressure sensitive adhesives (PSAs).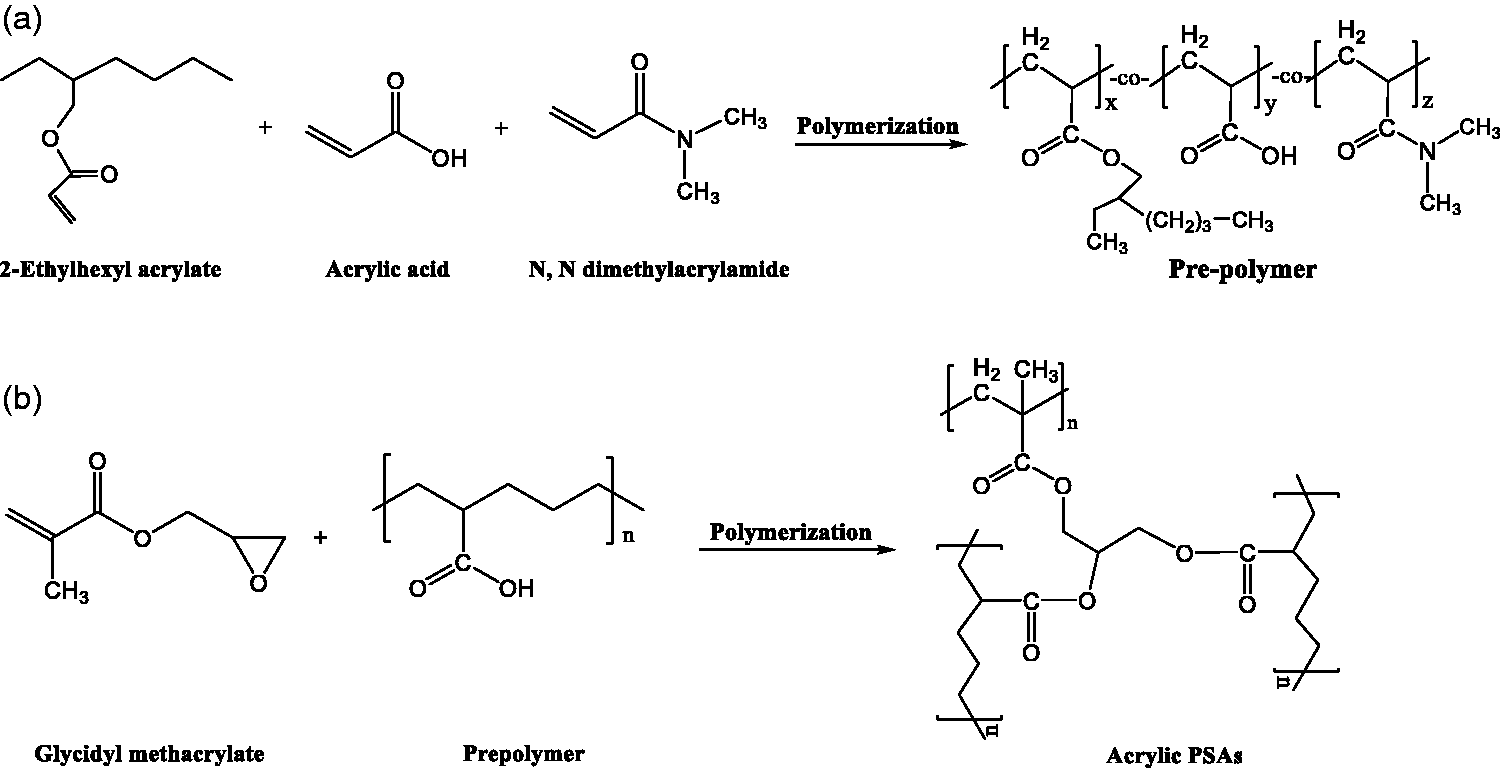
To validate the synthesis process, Fourier Transform Infrared spectroscopy (FTIR) was performed to analyze the chemical structure of OCAs. Figure 2 shows the FTIR spectra of the pre-polymer and OCA PSAs. As shown, the characteristic peak of C=C at 1600 cm−1 and epoxy at 910 cm−1 of the GMA chemical structure disappeared from the spectrum of OCAs after UV curing.
23
The phenomenon indicates that polymerization occurs.
Fourier Transform Infrared spectra of the pre-polymer and optically clear adhesives (OCAs).
Taguchi method
L9 orthogonal array

Levels of control factors

2-EHA: 2-ethylhexyl acrylate.
The level selection of 2-EHA monomer content and the oligomer content proportion were based on previous work, 10 and the photoinitiator was based on the composition recommended by the manufacturer.
Signal-to-noise ratio
A higher S/N represents a lower standard deviation, less variation and better quality stability. This study used four quality characteristics, namely peel strength, transmittance, haze and the refractive index. Afterwards, these qualities were calculated using three kinds of S/N equations: nominal-the-better, larger-the-better and smaller-the-better, as expressed in Equations (1)–(3).
Equation (1) nominal-the better

Equation (2) larger-the-better

Equation (3) smaller-the-better

Analysis of variance
As the statistical model of experiment design data, the analysis of variance (ANOVA) uses F-test to check the significance of the control factors effect in the Taguchi method on the overall experiment, so as to judge the influence of the experimental parameters on the quality characteristics. The ANOVA uses the sum of the square, the degree of freedom (DOF) and the mean of the square to estimate the F-value. The equations of the ANOVA are expressed as follows.
The total sum of the squares, SS
T
, is expressed as Equation (4)


The sum of the square, SS
factor
, is expressed as Equation (6)

The error sum of the square, SS
E
, is expressed as Equation (7)

The DOF includes the factor of DOF, error DOF and total DOF and is the measure of the experimental information.
The factor DOF is expressed as Equation (8)

The DOF of error (DOF
E
) is expressed as Equation (9)

The total DOF (DOF
T
) is expressed as Equation (10)

The mean square, MS, is expressed as Equation (11)

The error mean square, MS
E
, is expressed as Equation (12)

The F-ratio is expressed as Equation (13)

The percent contribution, CN, is expressed as Equation (14)

Response surface methodology
The experimental design can allocate the parameters of specific experimental areas systematically and estimate the effect of design parameter X on target value Y rapidly and accurately. When the required response value is collected, the relation between the response value and the variable is found by regression analysis. A regression model is built to obtain the optimum solution in the experimental area. 24 The regression models are divided into the linear- and second-order. When the linear regression model cannot describe the relationship between the response value and the regressor variable accurately, the order number of the regressor variable in the regression model shall be increased. This study used the second-order regression model, as described below.
The quadratic regression model built using k regressor variables is expressed as Equation (15)


Particle swarm optimization
PSO determines the search direction with the individual and group optimum experience, but it is likely to fall into local optimum for fast convergence; therefore, the global optimum must be obtained by parameter tuning and random values.
26
The search mode is expressed as Equations (17) and (18)


Based on PSO, this study used the weighting method to give different weights for multiple fitness functions. The fitness functions were converted into the single fitness function, F, as shown in Equation (21)



Results and discussion
Single quality optimization analysis of OCAs
Four quality characteristics experimental average data and signal-to-noise ratio (S/N)

Peel strength optimization
The peel strength response table

According to Table 4 and Figure 3, the optimum factor levels were A3, B3 and C3. The 2-EHA, photoinitiator and oligomer content proportions were 80, 6 and 45 wt%, respectively. The main effect response table shows the single quality optimum parameter combination and relative factor effect importance. The ANOVA results in Table 5 display the influence of various factors on the experimental results. C (oligomer content) was the largest controlling factor and had the most significant influence, followed by A and B. When the oligomer content increase, the pre-polymer has more reactive functional groups.
10
Therefore, the polymerization degree is higher and the peel strength is increasing.
Graph of the peel strength response of optically clear adhesives. S/N: signal-to-noise ratio. Analysis of variance of the peel strength DOF: degree of freedom.

Transmittance optimization
The transmittance response table

According to Table 6 and Figure 4, the optimum factor levels were A3, B1 and C3. The 2-EHA, photoinitiator and oligomer content proportions were 80, 4 and 45 wt%, respectively. The transmittance quality of the ANOVA is given in Table 7, showing that the largest controlling factor that had the greatest effect was the C or oligomer content proportion, followed by A and B. In PSAs, the oligomer content affects the degree of crosslinking. A more crosslinked structure gives a higher degree of penetration,
27
providing the largest contribution in the transmittance.
Graph of the transmittance response of optically clear adhesives. S/N: signal-to-noise ratio. Analysis of variance of the transmittance DOF: degree of freedom.

Haze optimization
The haze response table

According to Table 8 and Figure 5, the optimum factor levels were A3, B1 and C3. The 2-EHA, photoinitiator and oligomer content proportions were 80, 4 and 45 wt%, respectively. The haze quality of the ANOVA is given in Table 9, showing that the largest controlling factor and that had the greatest effect was the C or oligomer content proportion, followed by A and B. The oligomer content affects the degree of crosslinking of OCA PSAs. More crosslinked structures give a higher the degree of penetration,
28
and lower the haze property.
Graph of the haze response of optically clear adhesives. S/N: signal-to-noise ratio. Analysis of variance of the haze DOF: degree of freedom.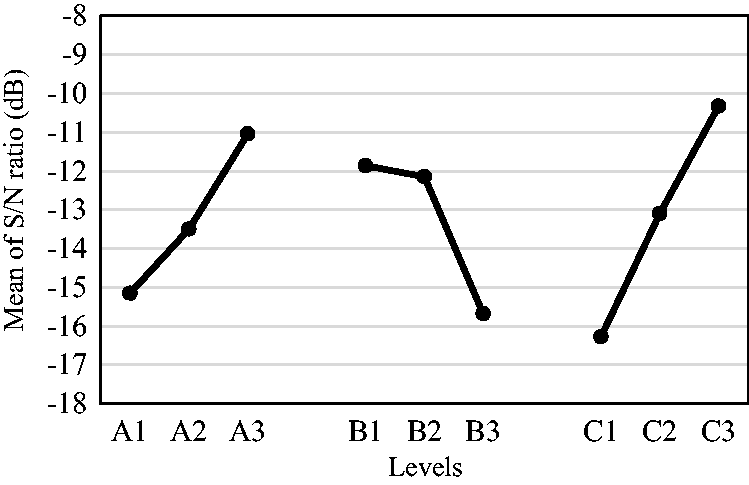

Refractive index optimization
The refractive index response table

According to Table 10 and Figure 6, the optimum factor levels were A1, B3 and C3. The 2-EHA, photoinitiator and oligomer content proportions were 60, 6 and 45 wt%, respectively. The refractive index quality of the ANOVA is shown in Table 11, showing that the largest controlling factor that had the greatest effect was A or 2-EHA, followed by C and B.
Graph of the refractive index of optically clear adhesives. S/N: signal-to-noise ratio. Analysis of variance of the refractive index DOF: degree of freedom.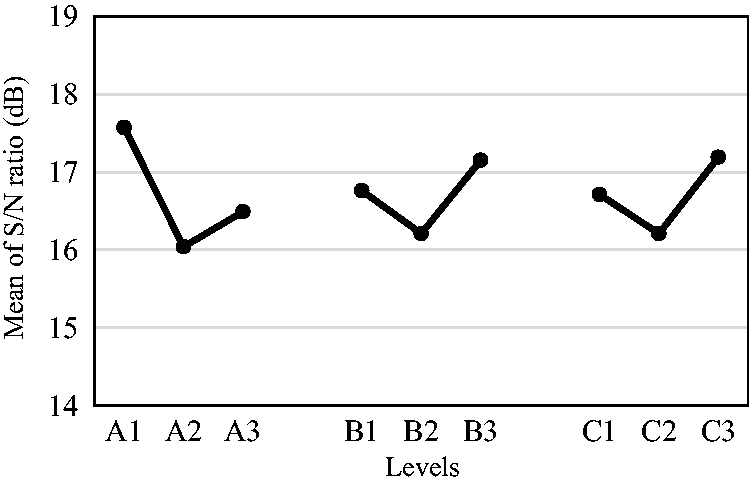

Multi-quality optimization analysis of OCAs
This study used the 2-EHA, photoinitiator and oligomer content proportion as the input factors. The peel strength, transmittance, haze and refractive index were taken as the output qualities. The second-order regression model of various quality characteristics was built. The regression model of the various quality characteristics established the fitness function of the PSO through Equation (21), expressed as Equation (22)

The constraint is
The result showed that the optimum parameters were 80 wt% of 2-EHA content, 4.32 wt% of photoinitiator content and 45 wt% of oligomer content.
Experimental verifications
Optimum qualities of optically clear adhesives compared with industrial requirements and general synthesis

Use larger-the-better.
Use smaller-the-better.
Use nominal-the-better.
The results showed that all of the qualities satisfy the industrial requirements of OCAs. The peel strength is larger than the requirements, thus providing an excellent bonding system. For the optical properties, transmittance is higher than the requirement, haze is smaller than the requirement and the refractive index is in the acceptable range, thus providing a clear adhesive system and not affecting the aesthetics when applied in coating and laminating technology. The comparative results showed that the proposed system could effectively develop the best process parameter settings, which could not only increase product qualities remarkably but also reduce the variability of the process.
Conclusion
This study introduced multi-quality optimization using the Taguchi method combined with RSM and the PSO method in the synthesis of UV curing OCA PSAs. The OCA PSAs can be applied in coating and laminating techniques in the textile industry. The OCAs, in addition to providing a good bonding property, also provide a much better optical property than other adhesives, not affecting the aesthetic value of the products. The process parameters used in this study were 2-EHA monomer content, with the photoinitiator content and the oligomer (DMA–AA) content in proportion with different compositions. The quality responses were the peel strength, the transmittance, the haze and the refractive index. The Taguchi method using an L9 orthogonal array could reduce the number of experiments and cost, as well as effectively arriving at a single optimum parameter. The S/N and ANOVA were applied to investigate the response of different OCA compositions for each quality. The results from the Taguchi method were combined with RSM and PSO to obtain a single composition that has optimum response for all qualities. The results of the confirmation experiment showed that the optimum parameters of 80 wt% of 2-EHA content, 4.32 wt% of photoinitiator content and 45 wt% of oligomer content can obtain peel strength at 720.3 g/25.4 mm, transmittance up to 97.94%, haze of only 1.93% and the refractive index at 1.48. All of the qualities satisfied the industrial requirement of OCA PSAs.
Footnotes
Declaration of conflicting interests
The authors declared no potential conflicts of interest with respect to the research, authorship and/or publication of this article.
Funding
The authors disclosed receipt of the following financial support for the research, authorship, and/or publication of this article: This work was supported by the Ministry of Science and Technology of the Republic of China (Grant no. 106-2221-E-011-137-MY2).