



Abstract
Cotton spinning mills need high-quality fibers to maintain their manufacturing efficiency. Machinery throughput is increasing and it could translate into more processes with higher breaking stress. Consequently, more fibers are susceptible to breaking or damage. To face this problem, breeders must develop new varieties whose fibers can better withstand this mechanical stress. The main tool utilized in cotton breeding programs is the High Volume Instrument (HVI), which reports in a short time measurements such as micronaire, length, color, and strength. This instrument can also determine fiber elongation, but there is no current correction method for it. Both elongation and strength factor into the work-to-break of fibers, which plays a direct role in fiber breakage and spinning performance. The objective of this work was to develop cotton elongation standards, devise a correction procedure for HVI lines, evaluate measurement stability, and validate these results with a set of independent samples. Two commercial bales, one with low and one with high HVI elongation, were identified as potential elongation standards. The potential standards were produced and evaluated. After validation, they were used to correct HVI lines against Stelometer (STrength-ELOngation-METER) measurements. An independent set of samples was tested on corrected HVIs to confirm the effectiveness of the elongation corrected measurements. The HVI data were at least as good as the Stelometer data, with increased data acquisition speed and precision. This research can help cotton breeders to improve fiber elongation and strength at the same time, resulting in better fibers for yarn spinning.
In general, cotton spinning mills have small net margins. 1 Increased automation and number of spinning units per frame, and reduced power consumption are alternatives to increase spinning mill profitability. Another way to increase profit would be to increase yarn production per spinning unit. 2 This could be achieved with higher processing speeds. Unfortunately, faster processing speeds tend to translate into more cotton fiber breakage.3–5 Fiber breakage increases the number of short fibers and neps (a small entanglement of mostly low maturity fibers).6–11 It may result in higher ends down (yarn breakage on the spinning frame) and ultimately higher cost of production2,12,13 and lower yarn strength and evenness.10,14
Producing a raw material with improved tensile properties could, at least partly, solve this problem. Tensile properties are defined as follows15,16:
tenacity, which is the force, normalized by the linear density, necessary to break a bundle of fibers, expressed in cN/tex; elongation, which is the degree of stretch that a material endures to the point at which breakage occurs, expressed as a percentage of the original length; work-of-rupture, work-to-break, or toughness, which is the amount of energy that a material will absorb before it breaks, expressed in cN • cm.17,18
Fiber bundle tenacity is typically referred to as strength and is the primary focus of fiber tensile property improvement breeding efforts. Strength is one of the fiber properties used to determine cotton price.
19
Although elongation is measured at the same time as strength and is reported by High Volume Instruments (HVIs), cotton breeders typically ignore this measurement because of the following reasons.
The existence of a negative correlation between bundle elongation and bundle tenacity
20
has led breeders to ignore elongation because of the perception that it could result in cultivars with lower strength. Nevertheless, this reasoning is flawed because the coefficient of correlation is low (r = –0.35). Therefore, it does not prevent simultaneous improvement of tenacity and elongation.
17
Breeders cannot reliably measure elongation in a regular breeding program, with hundreds or thousands of entries per season. Indeed, the Stelometer (STrength-ELOngation-METER) is the reference method for determining the tenacity and elongation of a bundle of cotton fibers, but it is a slow, time-consuming, and skilled-labor-demanding method,
21
while the HVI is fast, reliable, and cost-effective, but it lacks calibration standards for elongation. For this reason, two different HVIs may measure elongation at different levels, limiting the breeder to work always with the same instruments, which often is not possible.
Therefore, the development of a correction procedure and cotton standards for HVI elongation measurements is essential to allow breeders to improve simultaneously tenacity and elongation.
Our objectives with this research were as follows:
to develop a correction procedure for elongation measurements with HVIs; to develop cotton standards for elongation; to determine the corrected HVI elongation measurement stability; to validate the corrected measurements on a set of independent samples.
Material and methods
Development of standard cottons for elongation
Based on HVI and Stelometer measurements, two bales, one considered a high-elongation bale (HEB) and the other a low-elongation bale (LEB), were selected from a set of 44 commercial bales. These bales were run through an opening line to blend and remove trash from the lint. After opening and blending, a subset of 20 samples of no less than 200 g was taken from all over the bale.
All fiber testing was completed in a conditioned laboratory at 21 ± 1℃ and 65 ± 2% relative humidity. 19 All samples were allowed to condition for a minimum of 48 hours in the laboratory before any testing was completed.
These 20 samples from the two reference bales (HEB and LEB) were tested on the Stelometer (Stelometer 654, Spinlab) to determine reference values. Each of the 20 subsamples was subjected to 10 breaks, resulting in a total of 200 measurements. According to ASTM Test Method D1445, three Stelometer ICCS (International Cotton Calibration Standards) elongations (C-39, M-1, L-2) were tested before, during, and after testing to determine a correction factor by the linear regression method. 20 The corrected elongation was then recorded for each sample.
After testing was completed, the corrected values of the 20 samples from each bale were averaged to generate a bale average elongation. Those values were assigned to the bales with the lowest (LEB) and highest elongation values (HEB). Those bales were then used as low- and high-elongation standards for the next experimental sections (Figure 1).
Flowchart of the experimental procedure to develop 2 Standards (HEB, LEB). HVI: High Volume Instrument; Stelometer: STrength-ELOngation-METER.
Determination of elongation stability
Stability testing of the HVI elongation measurement was completed in two stages. For the short-term stability experiment, a set of 10 samples of no less than 200 g was taken from each blended bale (HEB and LEB) (Figure 1). All samples were subjected to testing on each of three HVI lines utilizing the 4-4-10 (four micronaire readings–four color readings–10 length/strength/elongation readings) testing protocol within a 48-hour time frame. Mean values and confidence intervals were calculated for each bale on each HVI line. For the long-term stability, bulk lint samples from the HEBs and LEBs were subjected to testing on each of three HVI lines utilizing the 4-4-10 testing protocol within a 30-working-day period. Exponentially Weighted Moving Averages (EWMAs) were calculated for each bale with a smoothing factor of 0.1.
Validation of the correction procedure
After the 2014 growing season, 72 bales were made available for testing the correction procedure. The 72 bales came from three locations consisting of four cultivars, two harvest methods, and three field replications. The three locations were across the South Plains of Texas (Halfway, Texas A&M AgriLife Extension Center at Lubbock, and Acuff). The four cultivars were commercially available and suited for the South Plains (Deltapine 1044 B2RF, NexGen 4111 RF, Stoneville 5458 B2RF, and Fibermax 2484 B2F). The two harvest methods were stripper and picker harvested. The bales were sampled to obtain a mass of approximately 200 g that was split into two subsamples of 100 g. The samples were tested on the three available HVI lines, with 10 replications per sample for length, strength, and elongation. The elongation standards were run before, during, and after testing. Once testing was completed, a report was generated for each of the three HVI lines. The data for elongation were then corrected using the Stelometer reference values of the HEB and LEB cottons. Regression analysis was completed among the three HVI lines, before and after the data were corrected, combining the three field replications. Another regression analysis was performed between the HVI and Stelometer results. A linear regression and 95% confidence intervals for the slope and intercept of each analysis were calculated using the JMP 11 statistical software (Figure 1).
Validation of HVI elongation results
The 72 samples were tested on the Stelometer to compare their Stelometer and HVI elongations. For each of the bale samples, two replications of six breaks were performed using the standard Stelometer protocol. 20 Data were corrected each day based on the daily check high- and low-elongation standards (HEB and LEB cottons) that were run before and after testing of the samples that day. As with the HVI data, the three field replications data were combined for the regression analysis. A linear regression analysis between the HVI elongation and Stelometer elongation using JMP 11 was performed to verify if the correction procedure was effective. An analysis of variance (ANOVA) was completed to determine if the HVI statistical rankings were similar to the ones obtained using the Stelometer with respect to cultivar, location, and harvest method (Figure 1).
Results and discussion
Development of standard cottons for elongation
As described above, the initial screening was divided into two steps. The first step was the measurement of 44 commercial bales with the HVI, resulting in the selection of 10 bales with the higher elongation and 10 bales with the lower elongation values. The second step was measuring these 20 selected bales with the Stelometer. After these steps (Figure 1), two bales were selected. The LEB presented a mean elongation and a standard deviation of 5.92 ± 0.29%, and the HEB presented values of 9.02 ± 0.37%.
The USDA Universal HVI Calibration Cotton Standards present an absolute range of 8.5 g/tex for tenacity, equivalent to a high-tenacity value 38.63% greater than the low-tenacity value. 21 We obtained an absolute range of 3.10% of elongation, which is equivalent to a high-elongation value 52.4% greater than the low-elongation value. Both tenacity and elongation measurements are performed with the same HVI testing module. Therefore, this elongation range should be adequate to calibrate the HVI elongation measurement.
Determination of elongation stability
In the short-term stability study, it was found that the three HVI lines were stable but that they were indeed measuring the HVI elongation on different levels (Figure 2, Table 1).
Short-term stability of low-elongation (a) and high-elongation (b) cotton standards. HVI: High Volume Instrument. Mean elongation, confidence interval (α = 0.05), and numerical ranks for low- and high-elongation cotton standards; in each column, values followed by the same letter are not significantly different at the 0.05 level HVI: High Volume Instrument.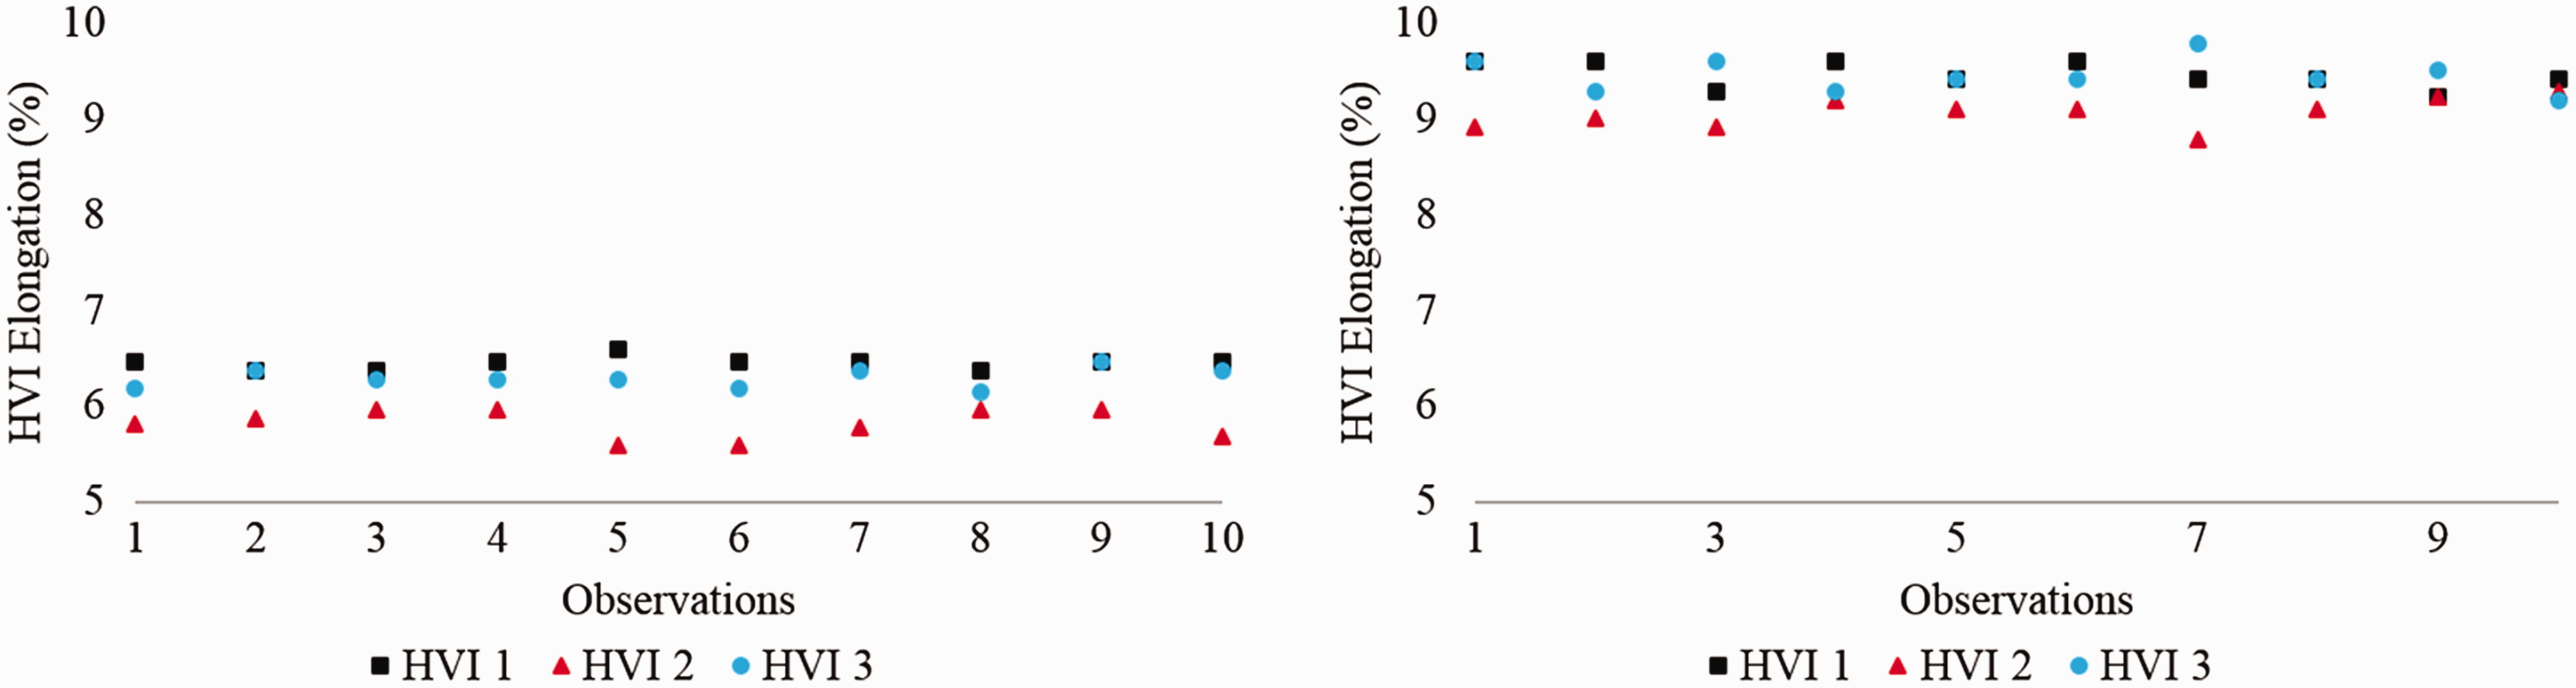
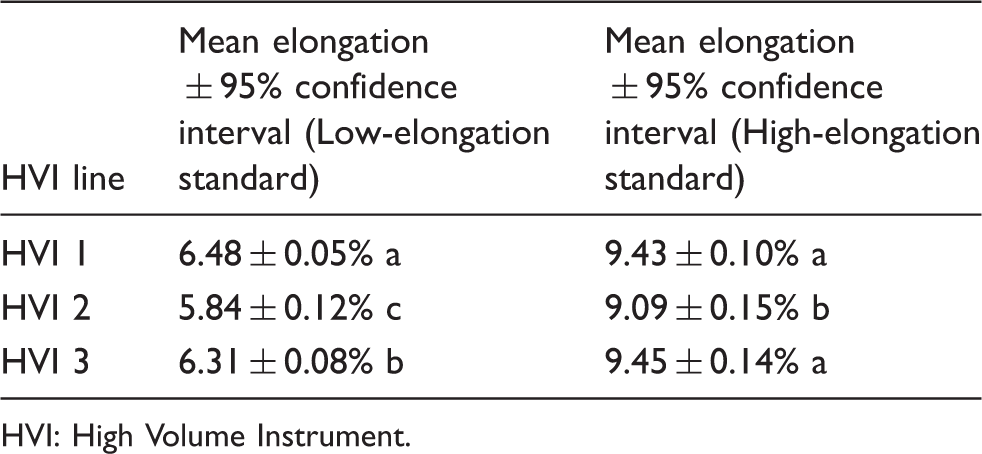
Riley 22 discussed that different HVI lines presented variations at the beginning of the stress–strain curves, and this could be a reason for the difference in the measured levels, especially for the low-elongation cotton. Since the three HVI lines gave a stable and repeatable measurement over a short period, the long-term stability study was carried out.
Lint samples from HEBs and LEBs on all three HVI lines were tested every day for 30 working days and EWMAs were calculated for each HVI line by bale. In Figure 3, we can observe that the three HVI lines deliver a stable elongation measurement over an extended period of time for the high and low-elongation standard cottons. Calculating the EWMAs confirmed the level differences among HVI lines once again, as seen with the short-term stability testing. A similar trend for long-term stability was observed in a set of eight bales for strength and elongation, with no perceived drift for three different HVI lines during 36 consecutive working days.
17
Long-term stability of low-elongation (a) and high-elongation (b) cotton standards. HVI: High Volume Instrument.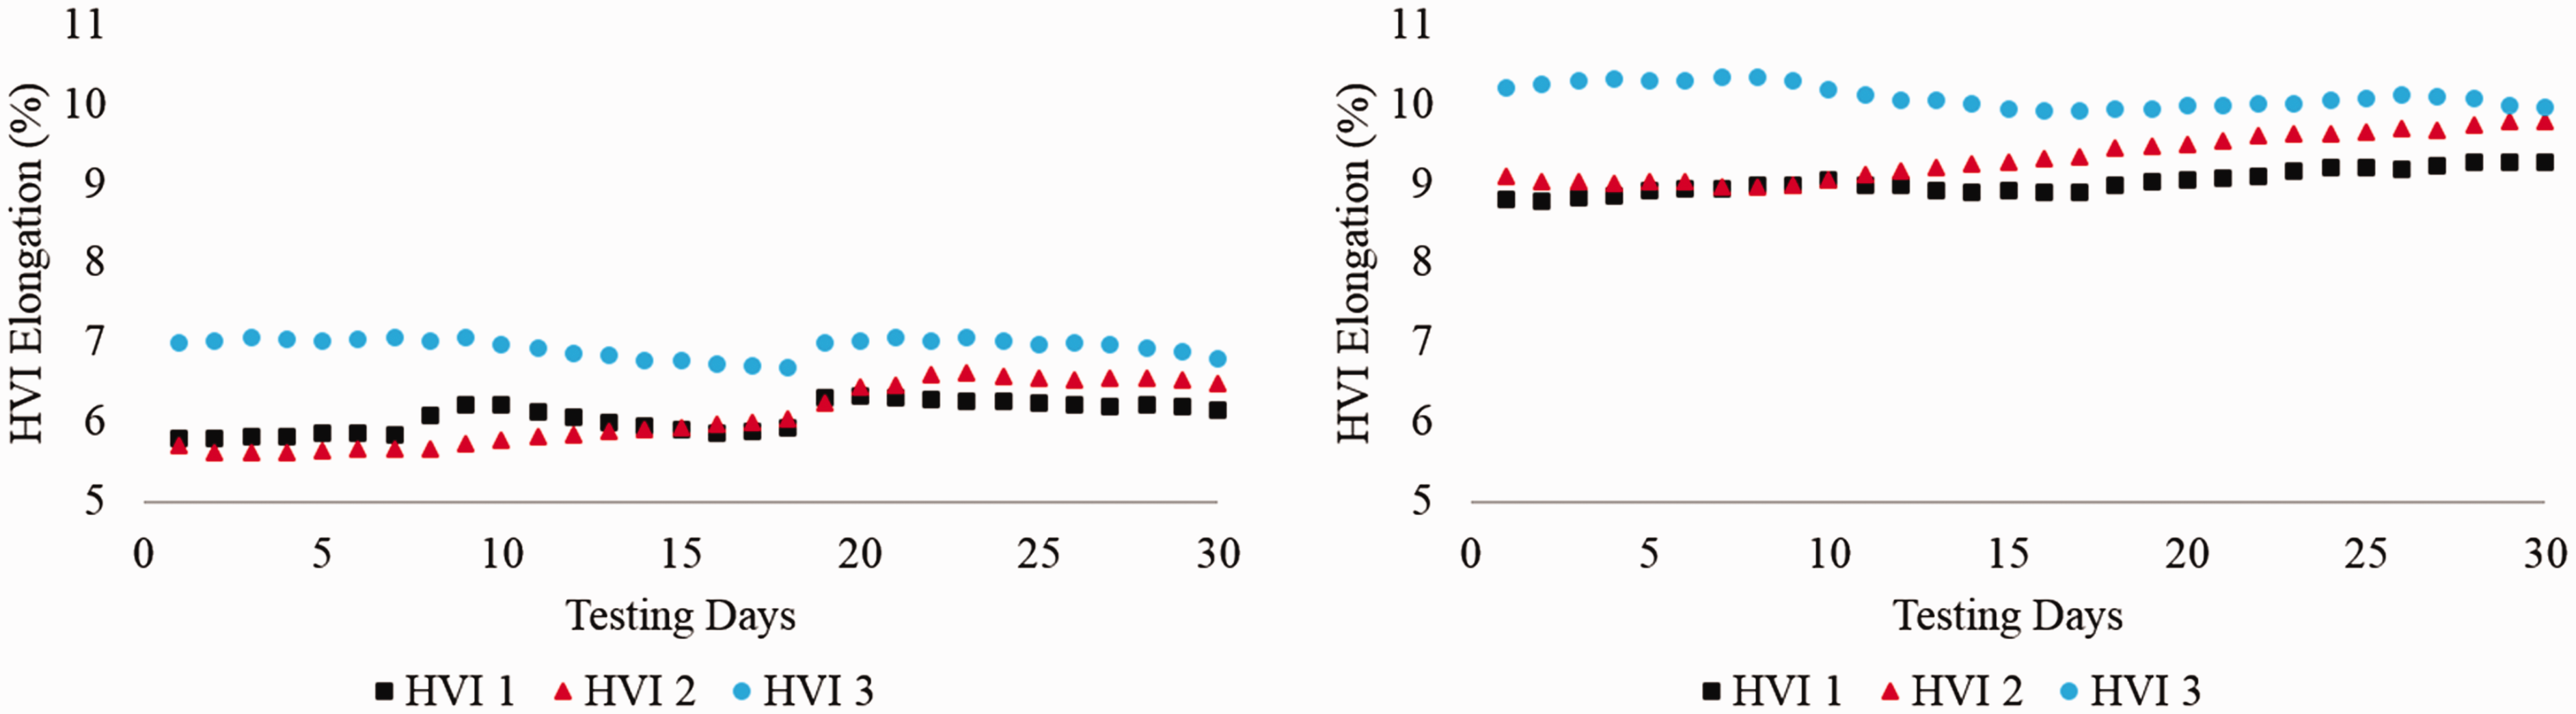
Results from this research work and Benzina et al. 17 confirm that there are differences in the levels at which each HVI line measures the elongation of a sample, which is expected without a correction procedure. Therefore, developing a correction procedure for the elongation measurement is required before we can implement elongation testing for breeding programs.
Validation of the correction method
Figure 4 shows an excellent agreement among the three HVI lines when testing the 72 bales (coefficient of determination of at least 96.0%). Nevertheless, slopes and offsets were statistically different from 1 and 0 among the lines, revealing the need for mathematical correction of the elongation measurement (Table 2). Similar results for a set of eight bales were observed and the authors concluded that without correction, differences between HVI lines are too large to ensure reliability of elongation data from different machines.
17
Linear regressions of raw values of cotton elongation among High Volume Instrument (HVI) machines. Slope, intercept, and confidence interval of raw values of cotton elongation between different High Volume Instrument (HVI) machines

Based on the established values of the two calibration standards, a correction equation for each HVI was devised. The correction equation was applied to the raw data from the 72 samples. After the correction was completed, for each HVI line, regression analyses were performed with the corrected data and new slopes, offsets, and confidence intervals were calculated (Figure 5).
Linear regressions of corrected values of cotton elongation among High Volume Instrument (HVI) machines.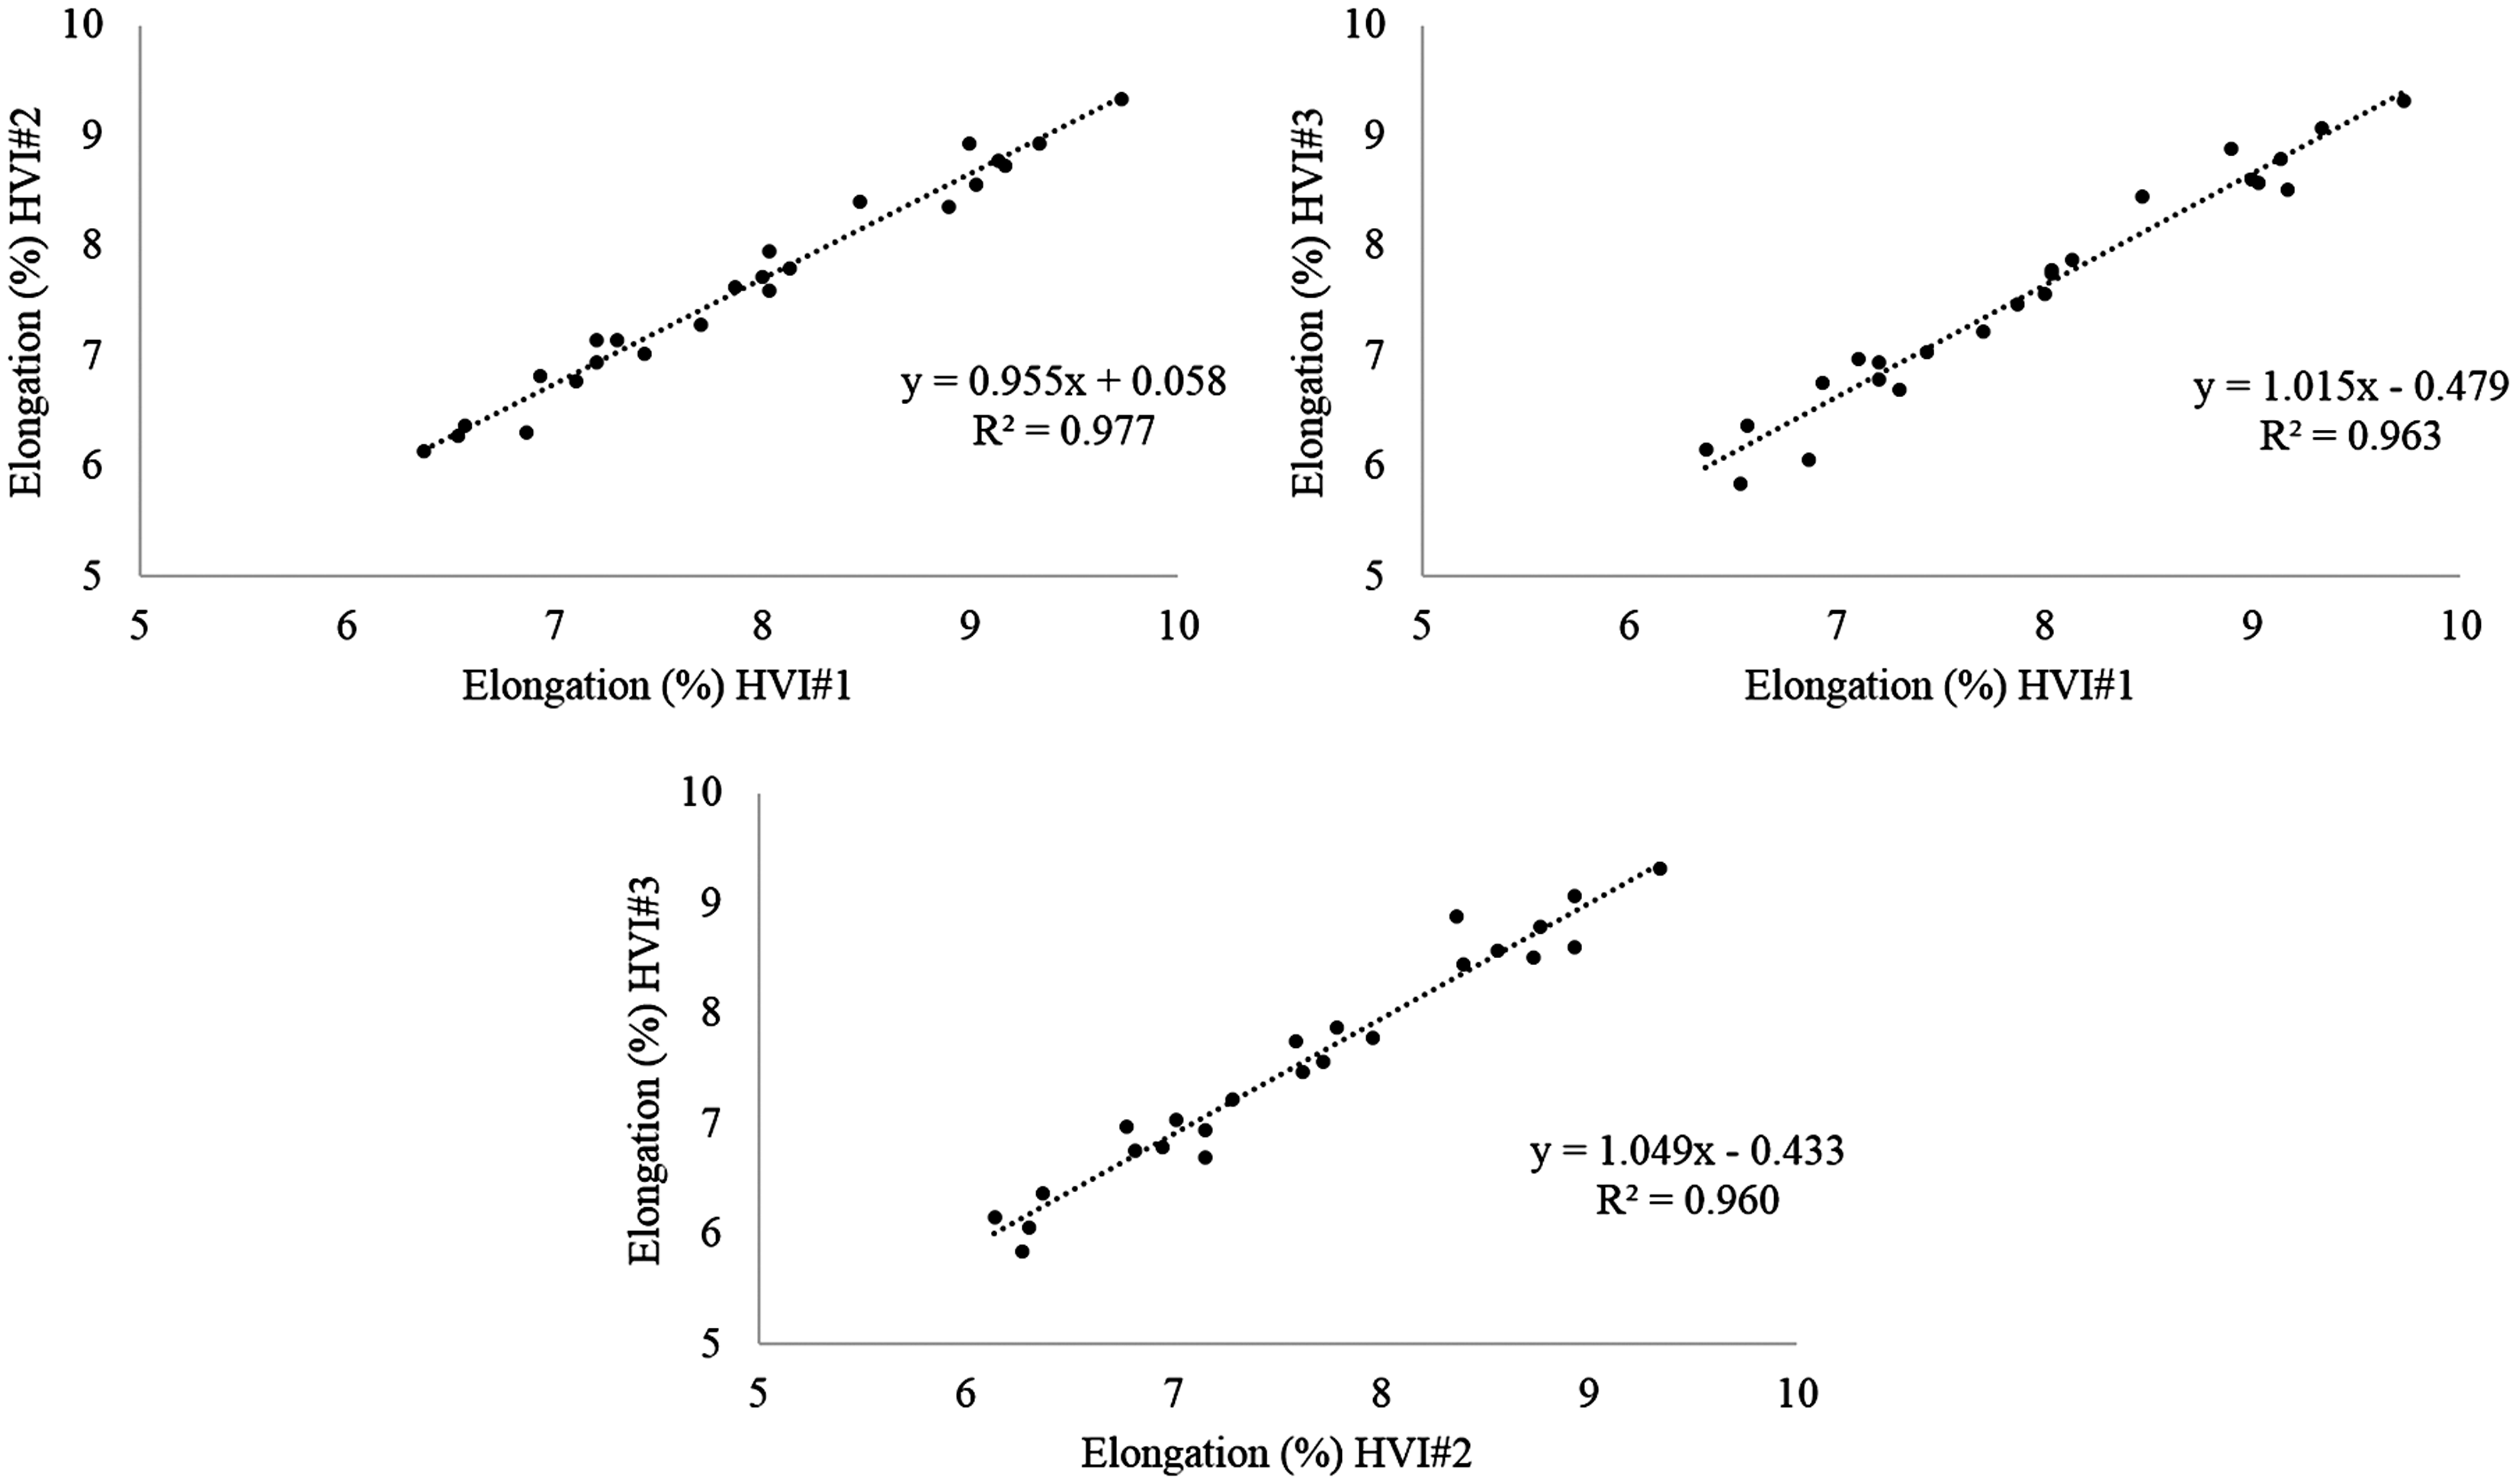
Slope, intercept, and confidence interval of corrected values of cotton elongation between different High Volume Instrument (HVI) machines

Validation of HVI elongation results
Since the level differences among HVI lines could be corrected, it was necessary to compare the HVI results with the Stelometer results. All three HVI lines corrected elongation measurements were combined because there was no statistical difference among instruments after correction. Figure 6 shows the linear regression between HVI and Stelometer data for elongation.
Linear regression of average High Volume Instrument (HVI) corrected elongation and average Stelometer elongation of cotton samples. Values in parenthesis are slope and offset with confidence intervals at 95%.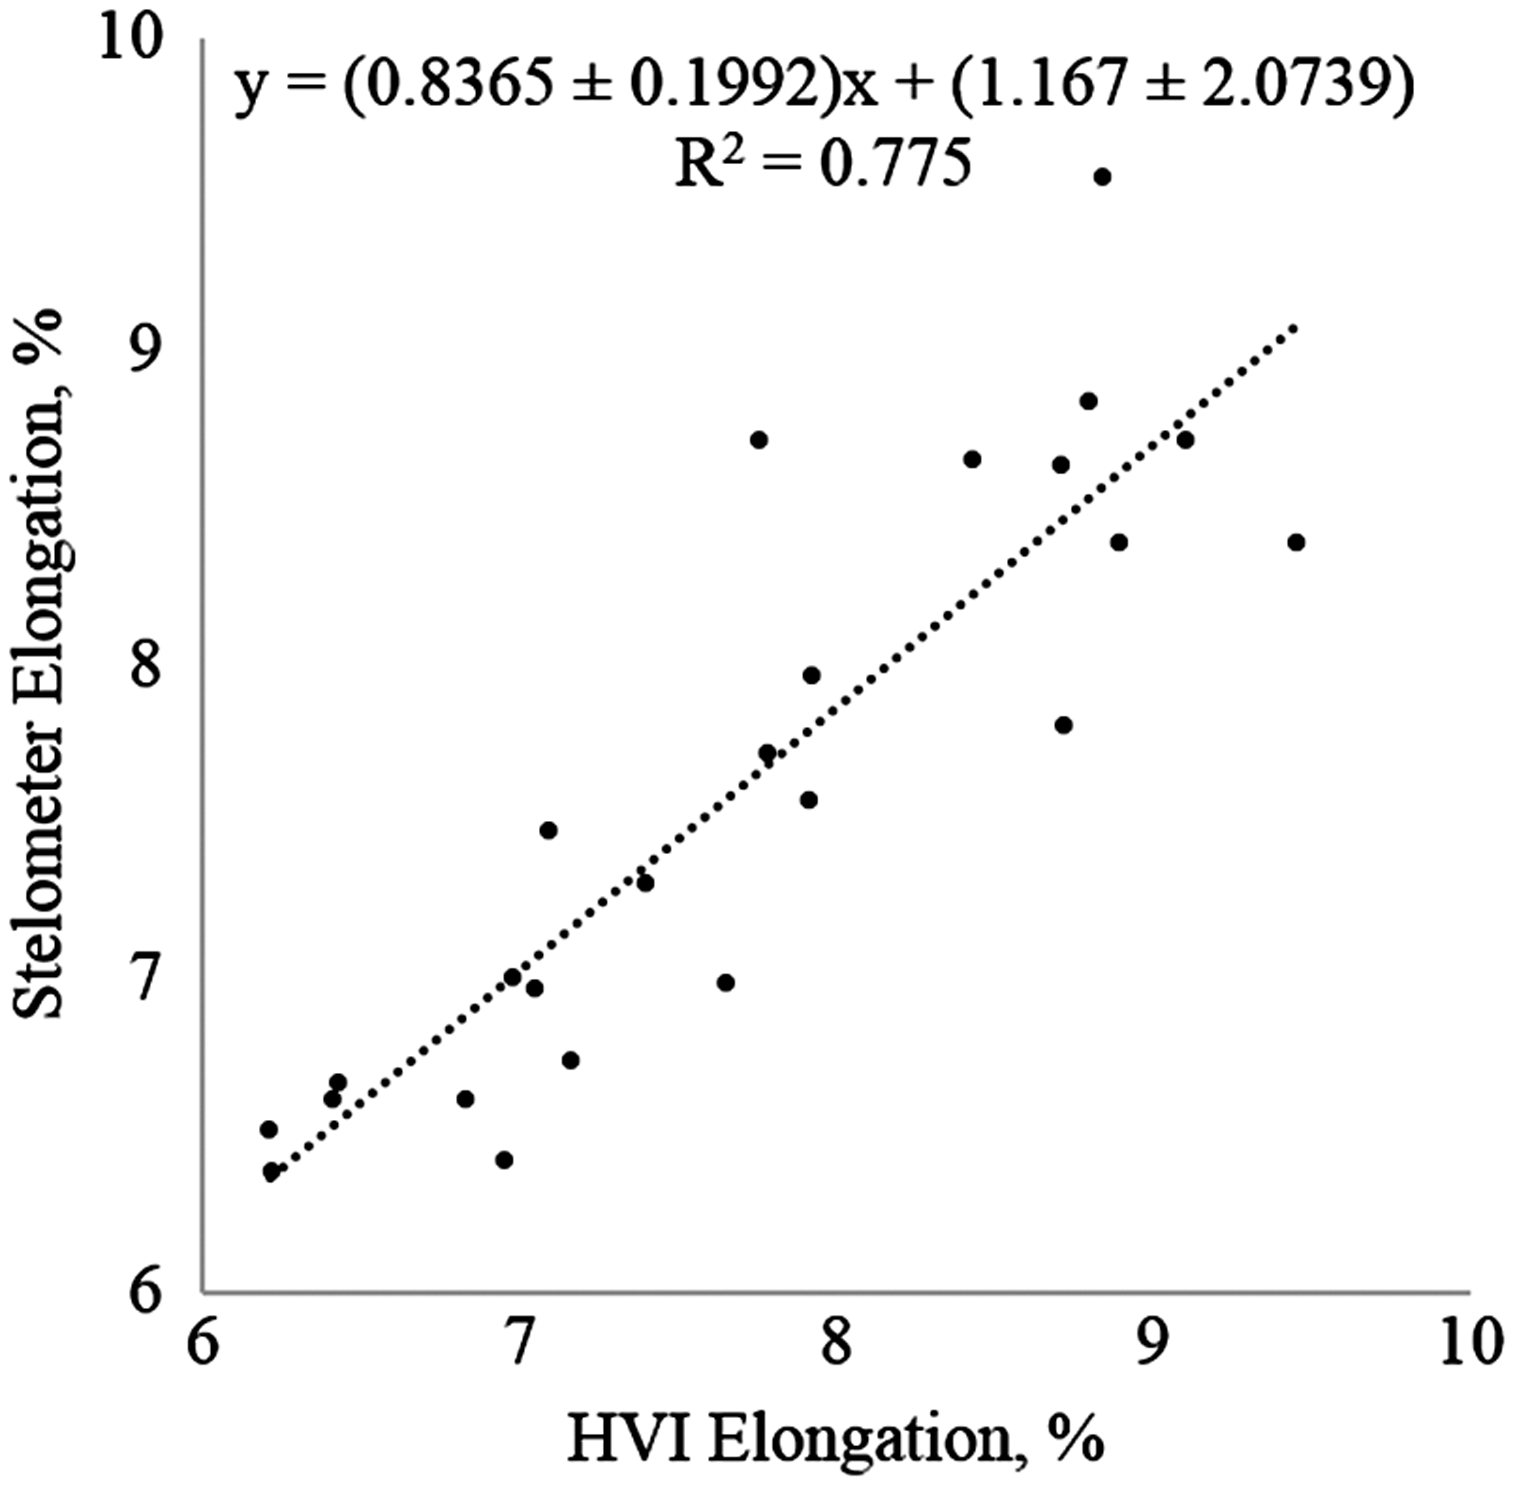
The relationship between the Stelometer and the HVI is good (R2 = 0.775). Indeed, considering the natural variability of cotton and the mechanical differences between the two types of instruments, explaining 77.5% of the observed variation is acceptable. A fiber bundle breaking device for cotton must deal with three important issues: sampling, clamping, and breaking. 23 HVI sampling uses a mechanism based on the fibrosampler, which is not length biased, whereas the Stelometer relies on length-biased sampling and the operator's consistency between samples to control sampling bias.23,24 In the Stelometer, a flat bundle of fibers is clamped in the first clamping jaw and drawn into a second clamp, where the jaw is tightened to ensure a uniform pretension and remove some of the crimp on the whole bundle. Thus, in Stelometer flat bundle testing, all of the fibers must be broken for the test to be acceptable. 20 In the HVI, the same beard used to measure the length is clamped between two jaws, with no control of the pretension or crimp. Some fibers may be clamped but many fibers in the bundle, a fiber beard, are not long enough to be clamped by both breaking jaws. These shorter fibers will not be broken in HVI tensile property testing.25,26 Another contrast between the devices is that the HVI uses a constant rate of elongation and the Stelometer use a constant rate of loading. 27 In addition, the Stelometer has an estimated instrument breaking speed of 0.3 cm/min, while the HVI presents an estimated breaking speed of 12.3 cm/min. 28
Since the HVI lines and the Stelometer correlated well with each other, it was necessary to determine if the HVI provided the same statistical rankings as the Stelometer for cultivar, location, harvest method, and their interactions.
Analysis of variance (ANOVA) for elongation measured by the High Volume Instrument (HVI) or by the Stelometer (STrength-ELOngation-METER)
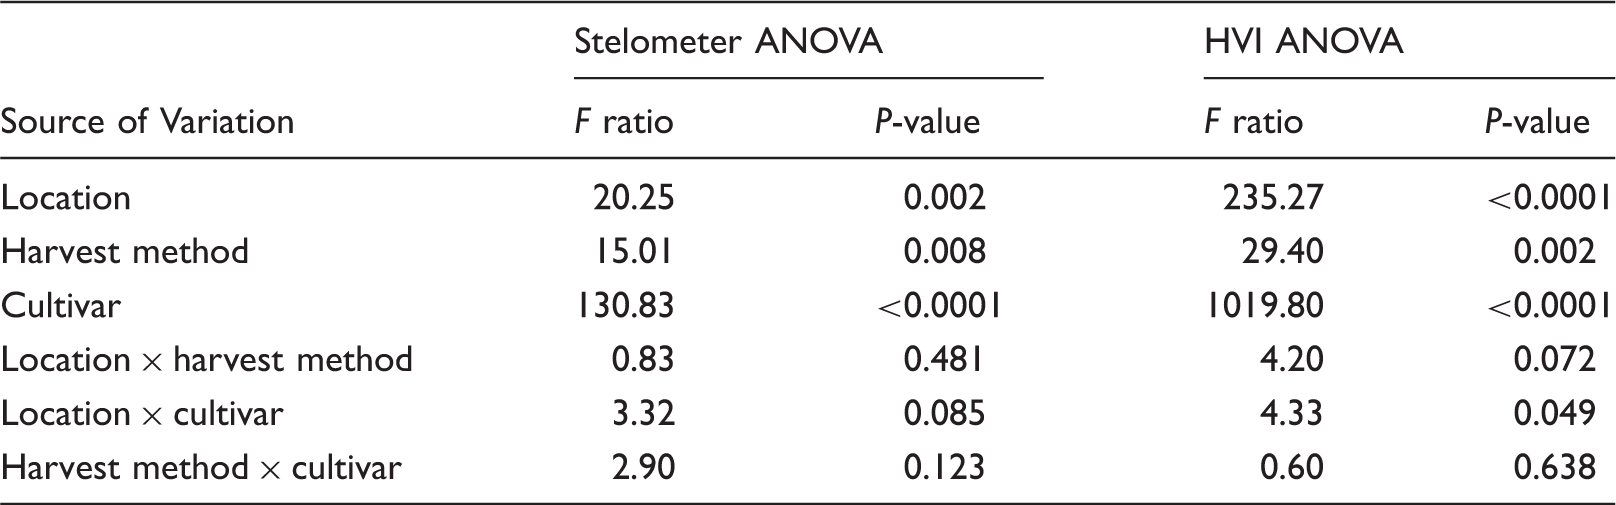
With the Stelometer analysis, the locations of Halfway and Lubbock ranked in the highest group and the cultivars were distributed among three groups (Figure 7). Cultivar DP 1044 B2RF presented the highest elongation, followed by NG 4111 RF; ST 5458 B2RF and FM 2484 B2F clustered in the same lower elongation group.
Elongation means for different cultivars and locations measured by the Stelometer and the High Volume Instrument (HVI). Means not sharing any letter are significantly different by Tukey's test at the 5% level of significance.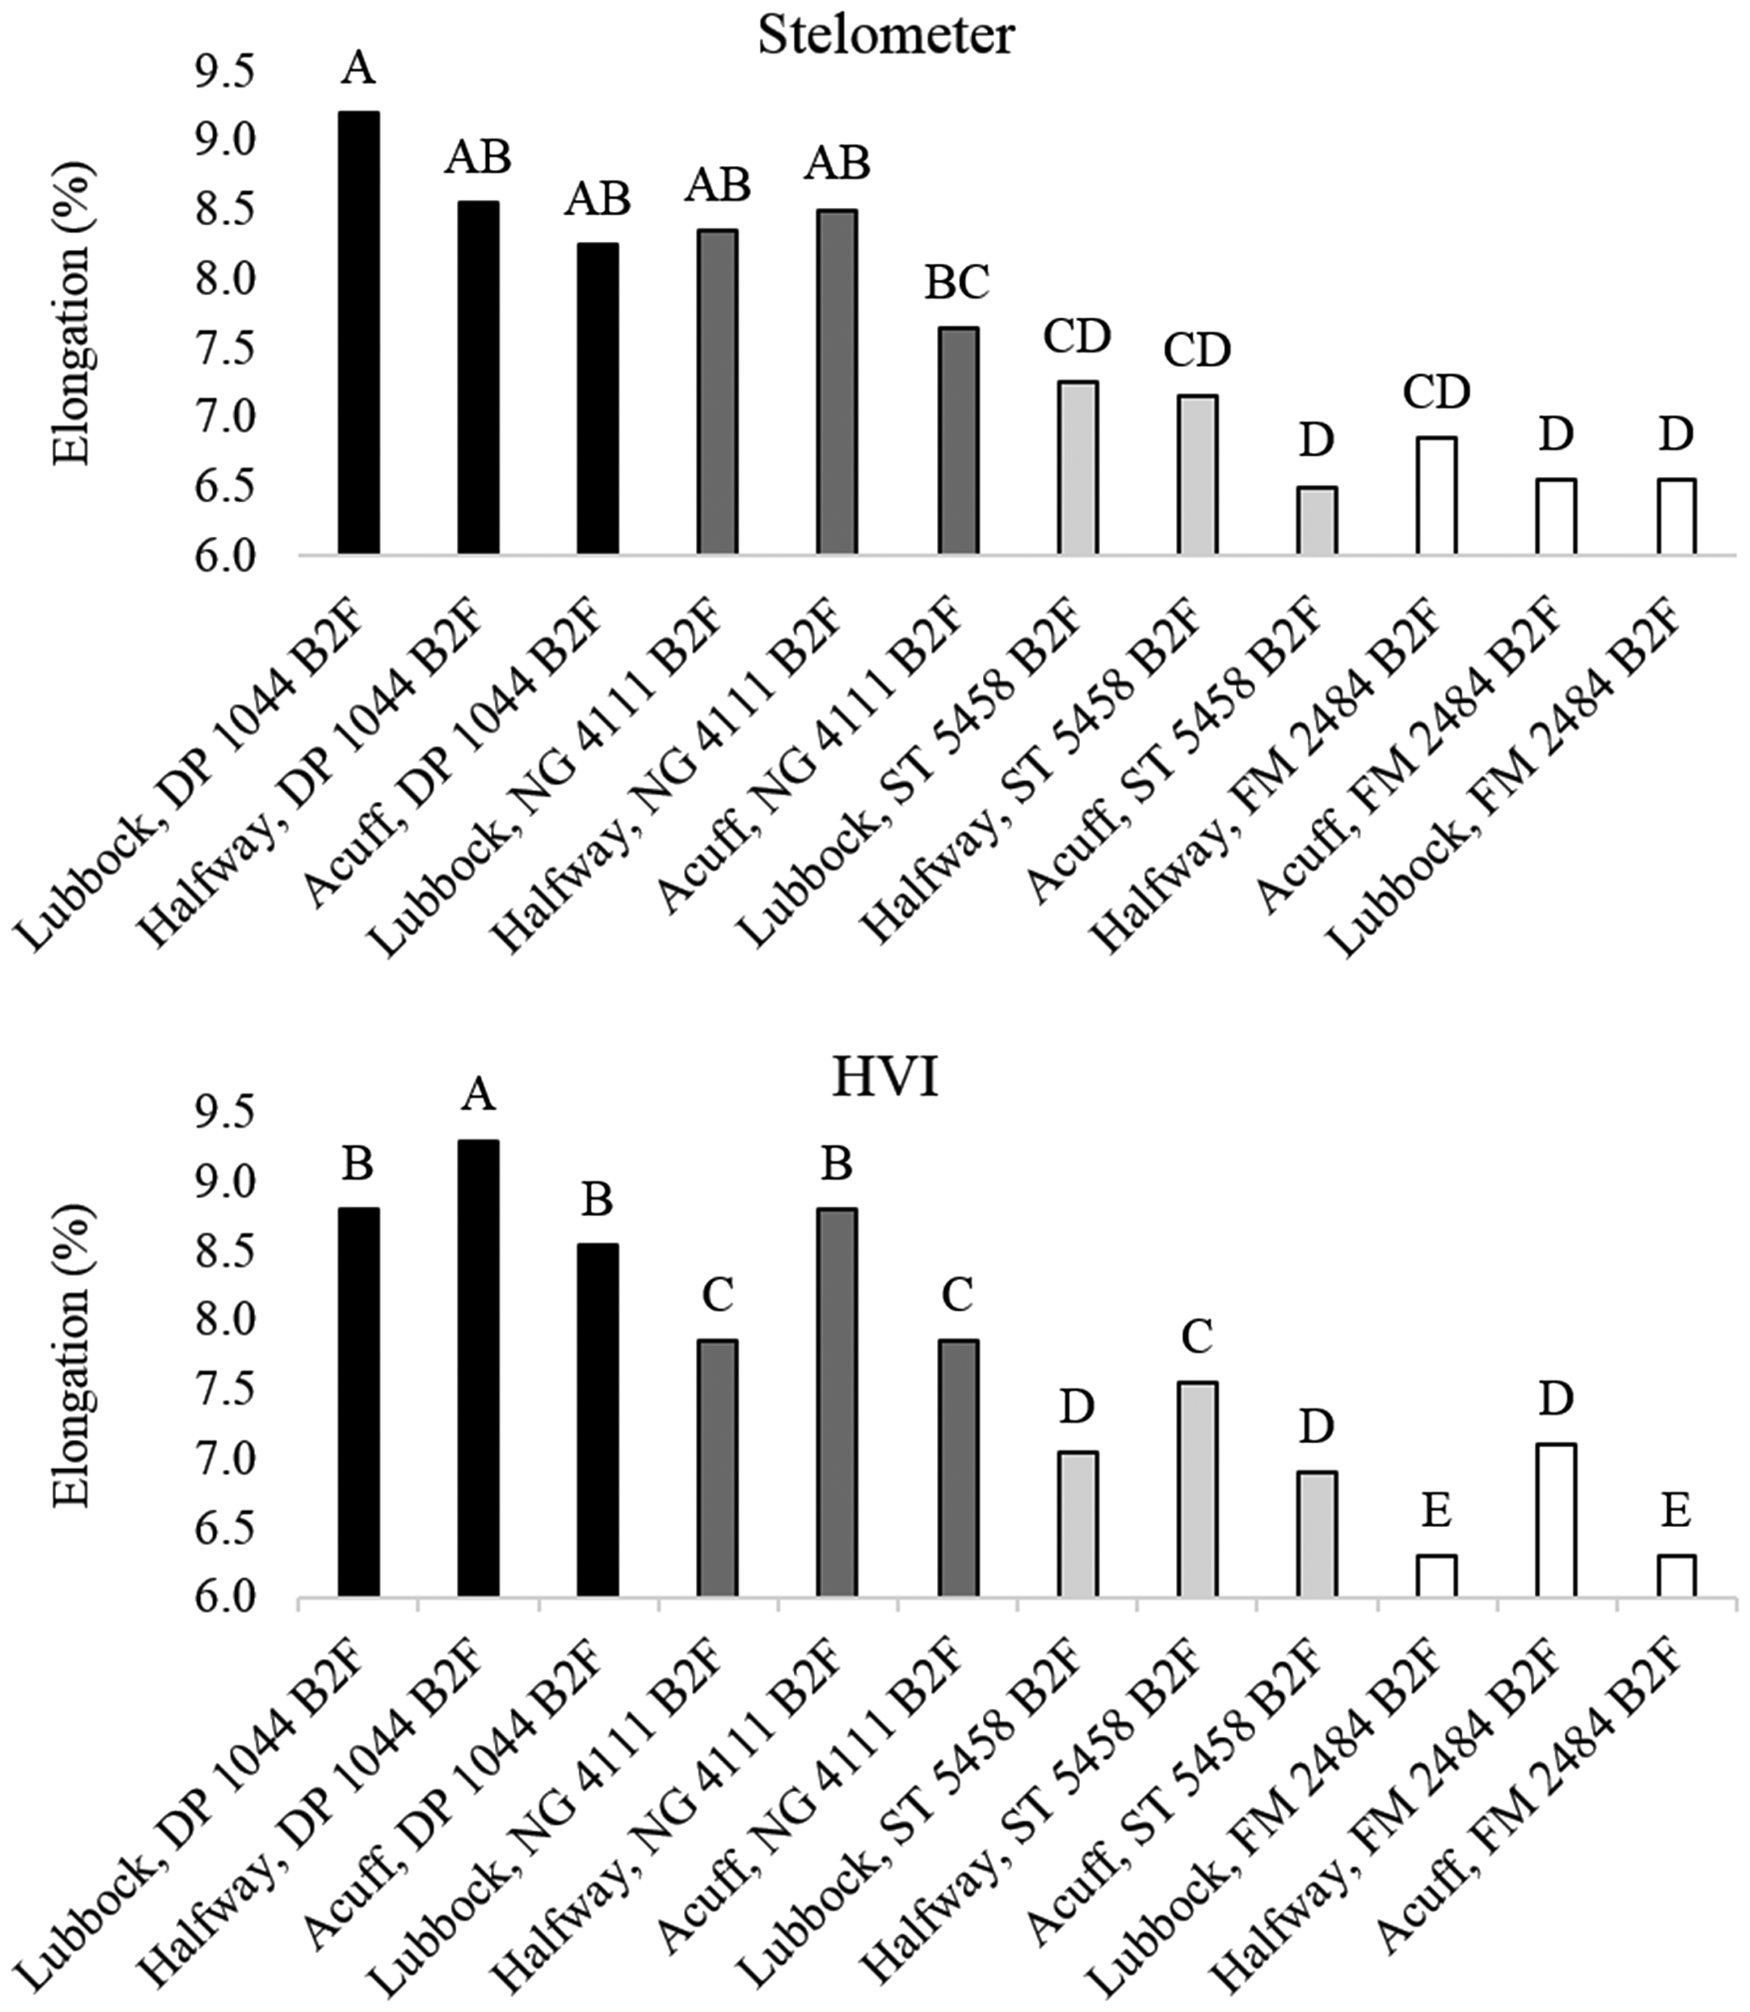
When the elongation analysis was performed with the corrected HVI lines, the sensitivity of the test increased. The four cultivars are now statistically different.
Although the number of experimental units is the same for both techniques, the number of breaks is different. Combining the data from the three corrected HVI lines and field replications, we obtained 90 HVI breaks (10 breaks/sample × 3 HVI lines × 3 field replications) versus 36 Stelometer breaks (6 breaks/sample × 2 laboratory replications × 3 field replications). This gives the ANOVA more power to detect differences with the HVI than with the Stelometer. An operator takes several minutes to perform one break with the Stelometer and just a few seconds with the HVI. Therefore, once the HVI is corrected, breeders will be able to evaluate fiber elongation with a higher number of bundle breaks, increasing the power of the analysis.
For the two harvest methods used in this trial, there was a significant difference detected for both instruments at α = 0.01, and the stripped cotton was ranked higher than the picked cotton (Figure 8). The increased elongation in the stripped cotton may be due to the harvest of fibers being from the top of the plant. In this position, there are distal bolls, which did not fully mature, that a picker harvester would not have harvested.
29
By stripping the less mature bolls the fibers contain less organized cellulose, which increases the bundle elongation. There is a greater difference in the average elongation values from the Stelometer measurements. Nevertheless, the HVI was able to detect the same trend with a smaller difference because the larger number of breakages in the HVI provide more power to the ANOVA test. This supports the idea that the HVI can be a tool that is at least as accurate as the Stelometer for elongation measurement.
Elongation means of stripped and picked cotton measured by the High Volume Instrument (HVI) and the Stelometer. Means not sharing any letter for the same instrument are significantly different by Tukey's test at the 1% level of significance.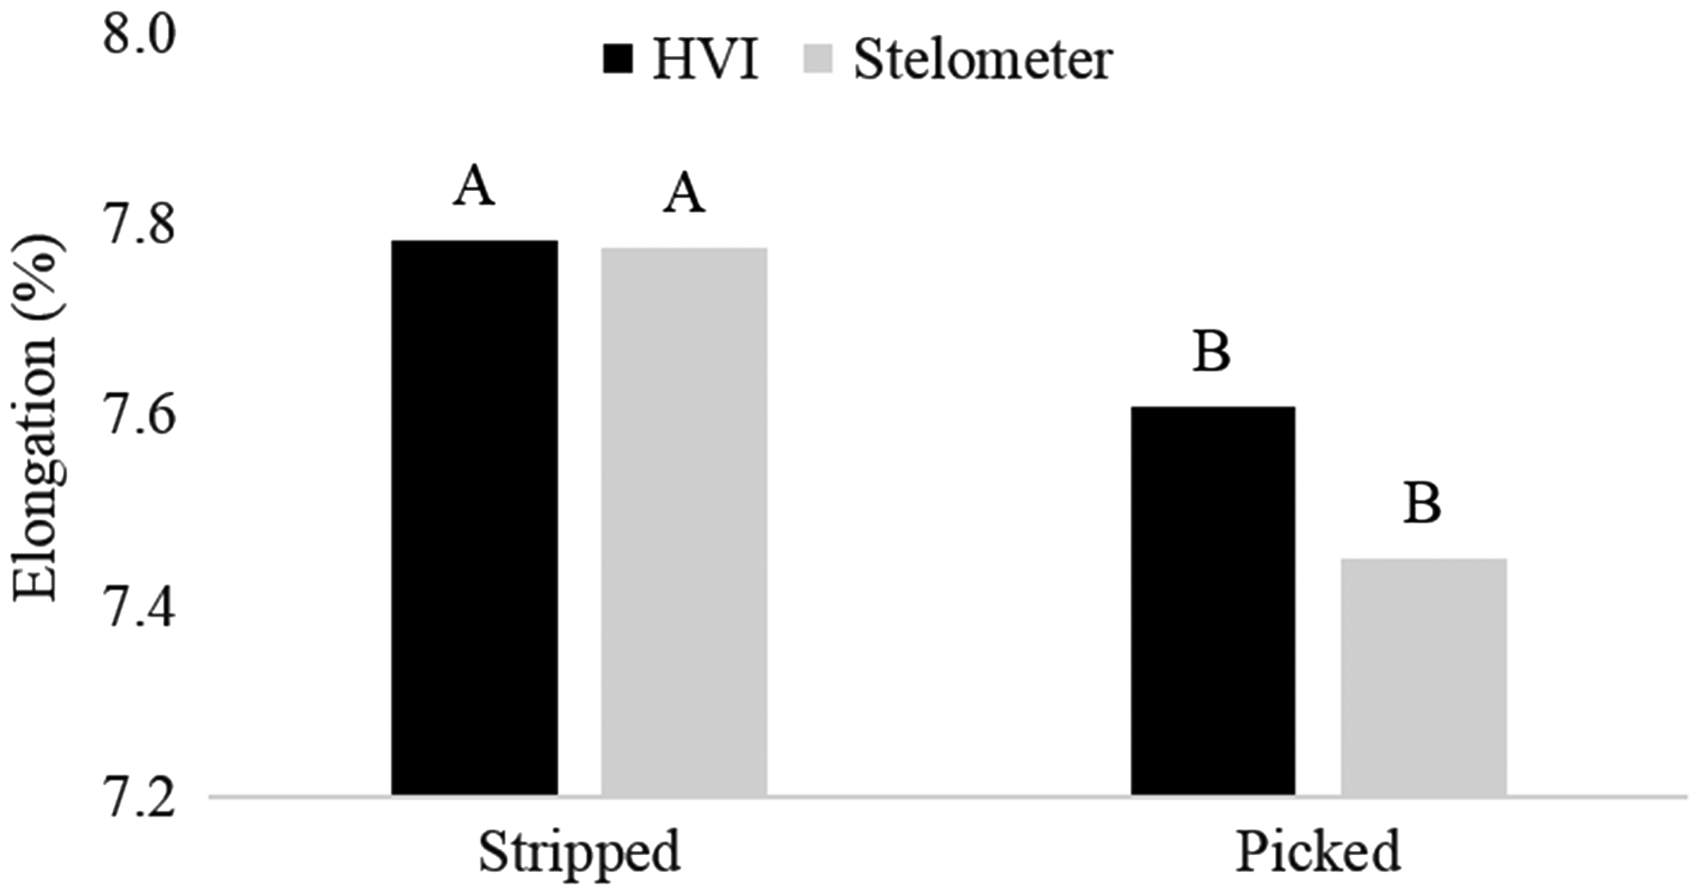
Conclusion
As the machinery at all stages of fiber processing from harvest to spinning has the potential to apply breaking forces to the cotton fibers, the breeding programs must keep improving the mechanical properties of the cotton lint. The concurrent selection of lines with improved strength and elongation will result in germplasm with higher work-to-break, increasing the total energy needed to break a bundle of fibers and yielding cotton materials with better mechanical properties. Thus, the development of a correction procedure for elongation with the HVI is an important step to improve the use of this tool in breeding programs. In this research work, we successfully developed low- and high-elongation cotton calibration standards for HVI correction. We evaluated the short- and long-term stability of three HVI lines and proved that data from these corrected machines are at least as accurate as the Stelometer data.
Footnotes
Declaration of conflicting interests
The authors declared no potential conflicts of interest with respect to the research, authorship, and/or publication of this article.
Funding
The authors disclosed receipt of the following financial support for the research, authorship, and/or publication of this article: This work was supported by the Cotton Incorporated (Grant or Project number 15-716).