
Abstract
This paper introduces a new developed wool fiber length imaging measurement instrument, named the random-beard image method, an applied fibrogram method of wool fiber length measurement. It includes four parts, namely the fiber beard preparation, image acquisition and fibrograms and fiber length parameter calculation using the dual beard and a new calculation method of Hauteur length (mean fiber length biased by the cross-section of the fibers). To check the accuracy of the built instrument, the international standard fiber length measurement instrument, the Almeter100, was used as the reference method for comparison. Hence, 10 kinds of wool fibers were measured with both methods and the results showed that four fiber length parameters, the Barbe length (weighted mean length), Hauteur length, the coefficient of variation of the Barbe length and the Hauteur length of the two methods, have high consistency. An F-test was also applied to test the repeatability of these two methods measuring another three kinds of wool fibers five times. It was found that, under the significance level of α = 0.05, the repeatability of both methods is on the same level.
Fiber length distribution is one of the most important physical properties of fibers. It can affect the evenness, strength, 1 hairiness 2 and tensile strength of short-fiber-reinforced polymers significantly, which determine the quality and properties of yarn, fabrics, 3 non-wovens and composite materials. In this case, fiber length distribution is an important basis in spinning and textile design. In addition, the measurement of fiber length has been an important topic in textile and material research4,5 and commercial trade.
Fiber length measurement methods are commonly categorized as traditional methods and high-volume automatic measurement methods. The traditional methods include the single-fiber method, 6 the hand stapling method 7 and the comb sorter method.8,9 Although these methods can obtain accurate fiber length distribution parameters, they are time-consuming and their accuracy is limited by the experience of manipulators. 10
High-volume automatic length measurement methods of wool fiber mainly comprise the Almeter10011 and the OFDA4000 (optical-based fiber diameter analyzer),12–14 which are two kinds of standard fiber length measurement methods of the International Wool Textile Organisation (IWTO) and are widely used in the textile industry and wool fiber commercial trade. When the aligned fiber beard goes through the capacitance sensor of the Almeter100, 11 the relative amount of fibers in any cross-section of the beard can be calculated by its corresponding capacitance information. In this case, the fiber length and distribution parameters can be measured with the relative linear density of the beard. Hence, the Almeter100 can obtain the Hauteur length directly, that is, the mean fiber length biased by the cross-section. Meanwhile, based on microscopy imaging techniques, the OFDA400012 counts the number of fibers in a thin aligned fiber beard at the interval of 5 mm and then interpolates the data at the interval of 1 mm. Afterwards, the fiber length distribution information can be computed from the number of fibers in each cross-section at the interval of 1 mm. As the number of fibers in one beard is small, several beards need to be measured for one sample until the number of measured fibers reaches 4000. 11
As the international standard methods, these two automatic measurement methods have the advantage of being fast, accurate and stable. However, there are also some defects.
The aligned beards used in both methods need beard preparation equipment. The preparation process of the aligned beard is more complex than that of the dual beard, which does not need to align the ends of the beard. Although great efforts have been made, a perfectly aligned beard is still not possible. Hence, linear modification was also applied to the short-fiber region of the fiber length frequency cumulative curve.12,13 Moreover, the accuracy of the capacitance sensor of the Almeter100 is limited compared with the imaging method. Contemporarily, the measured amount of fibers was four times that of the real value when the measured fiber was bending at a particular angle.12,13 This leads to a significant error in the fiber length measurement of the Almeter100.
The OFDA4000 counts the number of fibers of the aligned beard at the interval of 5 mm to obtain the numerical mean fiber length, which is called the optical mean length in the OFDA4000.12,14 However, this optical mean fiber length has a large bias compared with the Hauteur length by the Almeter100. 13 Meanwhile, there is no evidence to verify that this optical mean length is more accurate than the Hauteur length. In this case, the OFDA4000 transfers this optical mean length to the Hauteur length with a mathematical model by simulating the relationship between the number of fibers, the intersection angle between the fiber and the scanning direction and the measured capacitance. 13 The calculated Hauteur length by the OFDA4000 has high consistency with the Hauteur length measured by the Almeter100.13,14 In this case, as the Almeter100 has been used as the standard method for decades, it can be used as a standard method to verify the accuracy of a new fiber length measurement method.
Measuring fiber length using the fibrogram method 15 is typically used in measuring cotton fiber length. The High Volume Instrument (HVI) uses the cotton empirical calibration data to induce the derived Lambert–Beer theory described by Hertel. 15 Furthermore, as some fiber segments may be entangled around the needles, the scanning of the HVI has to begin at 3.81 mm (0.15 inch) away from the needle line, creating an unknown zone in the short-fiber region of the fibrograms.16–18 Therefore, the HVI does not provide short-fiber content. With projecting edges of cuticle cells and various finenesses, the wool fiber length is much harder to measure for a larger scattering coefficient than for the cotton beard. To apply the fibrogram method to wool fiber length measurement, this paper introduced a new image fiber length measurement method, the random-beard image method. Its dual-beard preparation process is much simpler than that of the traditional aligned single beard. Based on the newly derived Kubelka–Munk optical density algorithm for fiber layers 19 and the fibrogram calculation method, this new image method can measure the fiber length of translucent and transparent fibers using transmission images, 19 and its usage of scoured wool fiber length is described in this paper. Meanwhile, a new calculation method of the Hauteur length, that is, the mean fiber length biased by each cross-section of fibers, is proposed in this paper. Furthermore, to check the accuracy of the random-beard image method, the international standard fiber length measurement instrument, the Almeter100, was used as a reference method for comparison. Hence, 10 kinds of animal fibers were measured with both methods and the results show that four fiber length parameters, the Barbe length (weighted mean length), the Hauteur length, the coefficient of variation of the Barbe length and the Hauteur length of both methods, have high consistency. An F-test was also applied to test the repeatability of these two methods measuring three kinds of wool fibers five times.
Random-beard image method
With projecting edges of cuticle cells and various finenesses, wool fiber length is much more difficult to measure for a larger scattering coefficient than the cotton beard. To apply the fibrogram method to wool fiber length measurement, the random-beard image method was developed based on the fiber optical properties, image processing techniques and the dependence between the fiber beard and the spinning techniques. This system includes three parts, the beard preparation, image acquisition and processing and fiber length calculation.
When the comb clamped the fibers from the dual-beard specimen randomly, the stretching probability (g) of the fibers with the length of l away from the camped central line at the distance of L (0 ≤ L ≤ l
m
) should be determined by equation s = (l – L)/l in theory, where l
m
denotes the fiber length of the longest fiber. As the comb clamp gripped the fibers randomly, the stretched probability of the fiber with the length of l away from the napped line for each beard of the dual beard can be determined by the same equation above. This means that the distribution and number of fibers with the same length of l are the same in each beard of the napped line, as shown in Figure 1(a).
Fiber length distribution of the random beard using one (a) and two snapping lines (b).29
If fibers are randomly arranged in the wool tops, the fiber distribution of each cross-section were assumed to be same, illustrated in Figure 1(a). This ignores the random errors of the drafting process in the textile industry. Snapped fibers of each fiber length group are supposed to be two parallelograms beside the snapping line. Rearranging them, we can get sum of the two parallelograms, denoting the total fiber amount of this group, shown in Figure 1(a). However, two snapping lines are actually used instead of this unrealizable ideal one snapping line. Similarly, the fiber length distributions beside two snapping lines are calculated and rearranged, as shown in Figure 1(b). The results are same as that in Figure 1(b).29
Dual-beard preparation and image acquisition
The dual-beard preparation method for wool fibers is as follows. Select a combed wool top randomly with the length of about 60 cm. Twist the wool tops 18 times and keep them in the standard atmosphere (20℃, 65% relative humidity (RH)) for at least 24 hours. After eliminating the twists, separate the wool into several “divided tops” evenly. Afterwards, combine two of them together with two different ends aligned, forming a specimen top with a density range of 17–25 g/m and 8 cm in width. The scope of 17–25 g/m was chosen due to the requirement of the instrument's linear response scope. Furthermore, clamp the wool top at any cross-section with a designed fixed clamp with the width of 10 mm. This house-made clamped equipment was designed to clamp the samples with large enough force to ensuring the fibers remained still during the combing procedure. Moreover, using a designed comb with 9 broaches/cm, comb the floating fibers from the upper and lower surface of the prepared beard on both sides of the clamp at the interval of 2–3 cm at a speed of 7 times/minute from one end of the beard to the clamping line in sequence. Lastly, move the prepared beard to the same position of the digital device with a designed moving sample unit, avoiding shape changes of the prepared beard. The fixed clamp and final preparation sample are shown in Figure 2.
Acquisition of the random dual beard: (a) fixed clamp; (b) wool fiber beard.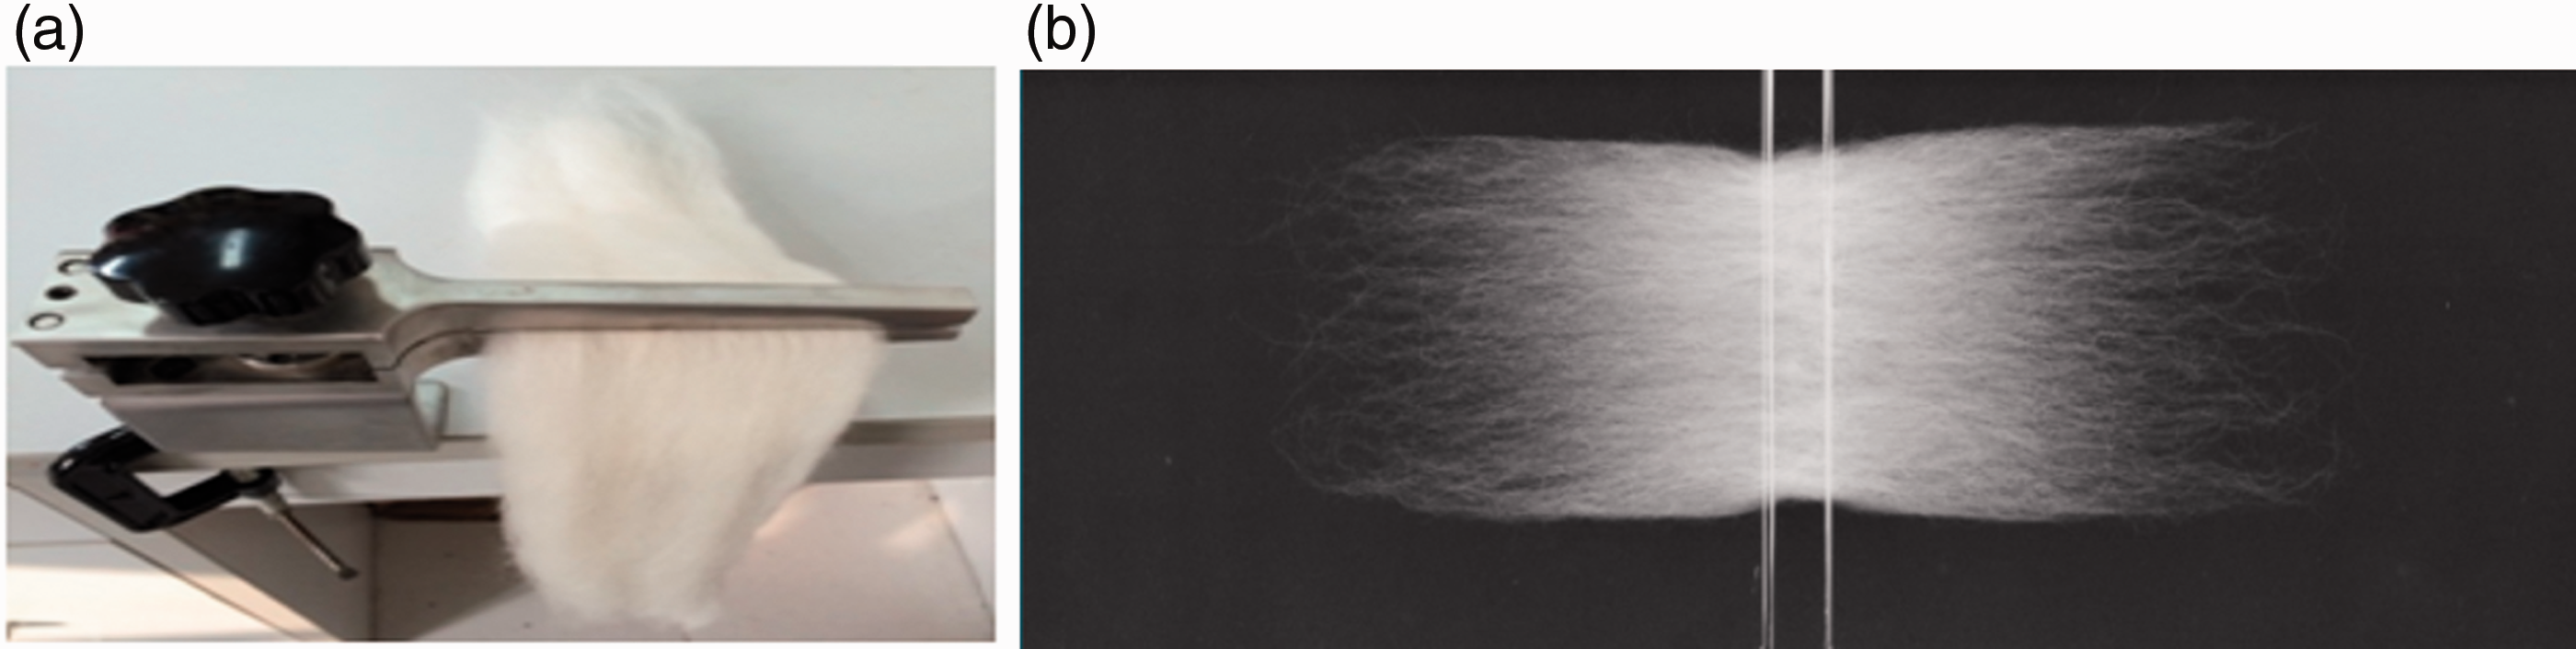
A linear CCD (charge-coupled device) scans the view above the prepared beard using a set of uniform daylight liner illuminants exposing below the beard to acquire the transmission gray image. During the testing process, the dual beard stays still and the linear CCD has a relative motion with the beard to get gray scale values of each cross-section in the beard. Afterwards, the whole transmission gray image of the dual beard could be obtained. Furthermore, the dark current was removed from each image. The transmission of each pixel of the whole image is a variable on the (x, y) plane. The range of gray values is 0–255, and their image resolution is 1000 dpi, which means the accuracy is 25.4 µm, where dpi denotes there are 1000 dots in 1 inch.
Fibrogram acquisition 20
Based on the light scattering, absorbing and reflection effects of the fibers, an optical density method was derived based on the Kubelka–Munk theory.19,21,22 Furthermore, the specific calculation method of the dual-beard fibrogram has been studied. The Lambert theory only considers light absorption of the fiber layers, ignoring their light reflectance and scattering effects, while the gray value method regards transmission as the thickness directly. Hence, this method is more accurate than the Lambert theory23,24 and the gray value method,25,26 and can be used for translucent and transparent fibers, such as cotton and wool fibers. 19
Firstly, acquire the transmission image (
Secondly, using fiber length x = △j as the abscissa, the calculated linear density coefficient p
j
is set as the ordinate in the rectangular coordinate of the fibrogram. After smoothing the preliminary fibrogram curve with the Fourier filtering, eight points, Smooth preliminary dual fibrograms. The centerline of the beard.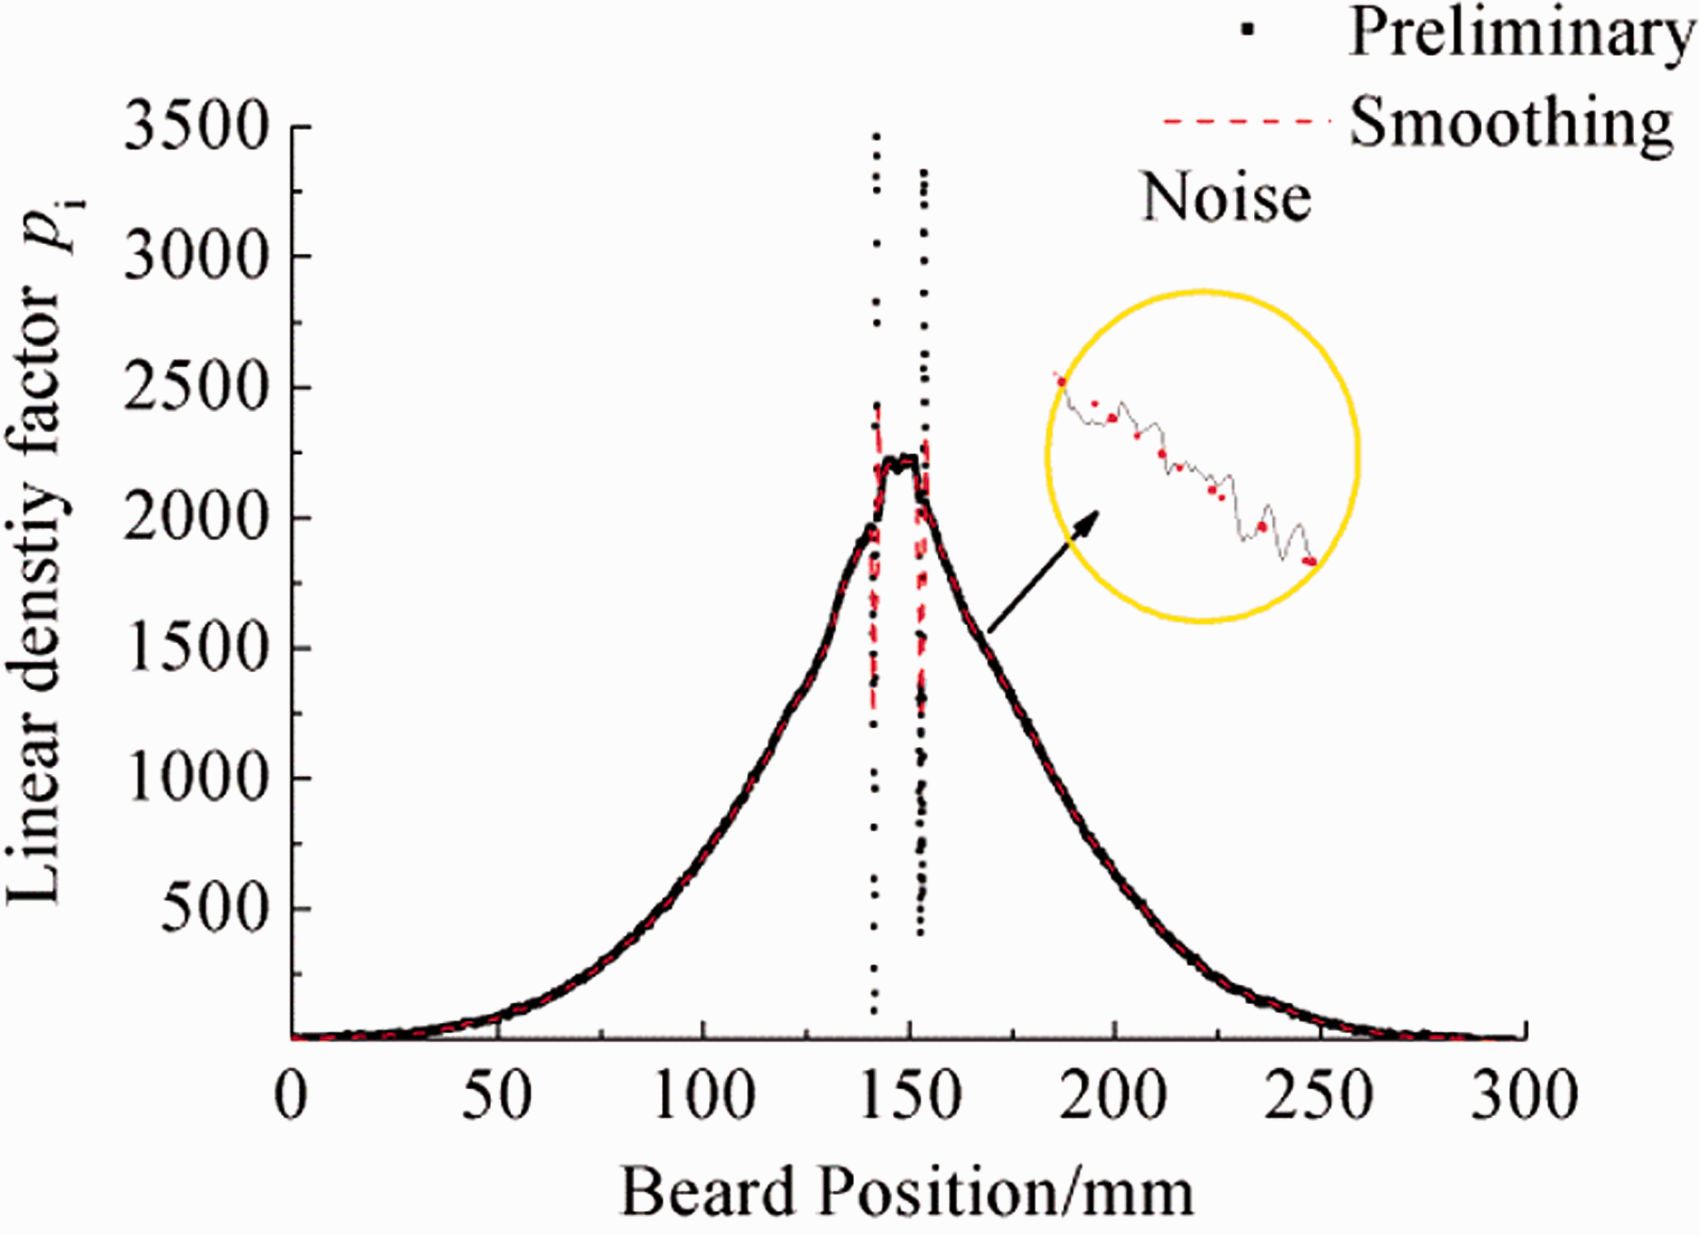


Thirdly, ideally, we assume that fibers with different length are distributed uniformly in each top after mixing and blending. However, drafting waves existing in the spinning process would lead to a non-uniform distribution of fibers with different lengths in their tops. 27 Hence, to improve the representative of each sample, two dual beards need to be tested for each measurement date. In order to calculate the weighted average fibrogram of four preliminary single fibrograms, we should sum up two dual-beard fibrograms with their centerlines overlapping. Then, turn over the fibrogram on the left-hand side to the right-hand side and calculate their sum curve. Therefore, the final fibrogram is the mass-weighted preliminary fibrogram, which is named the average preliminary fibrogram here.
The normalized average preliminary fibrogram is the ratio of the linear density of a certain cross-section to the maximum linear density, which was derived as Equation (3)
Fibrogram before and after using a coefficient by 1.03.20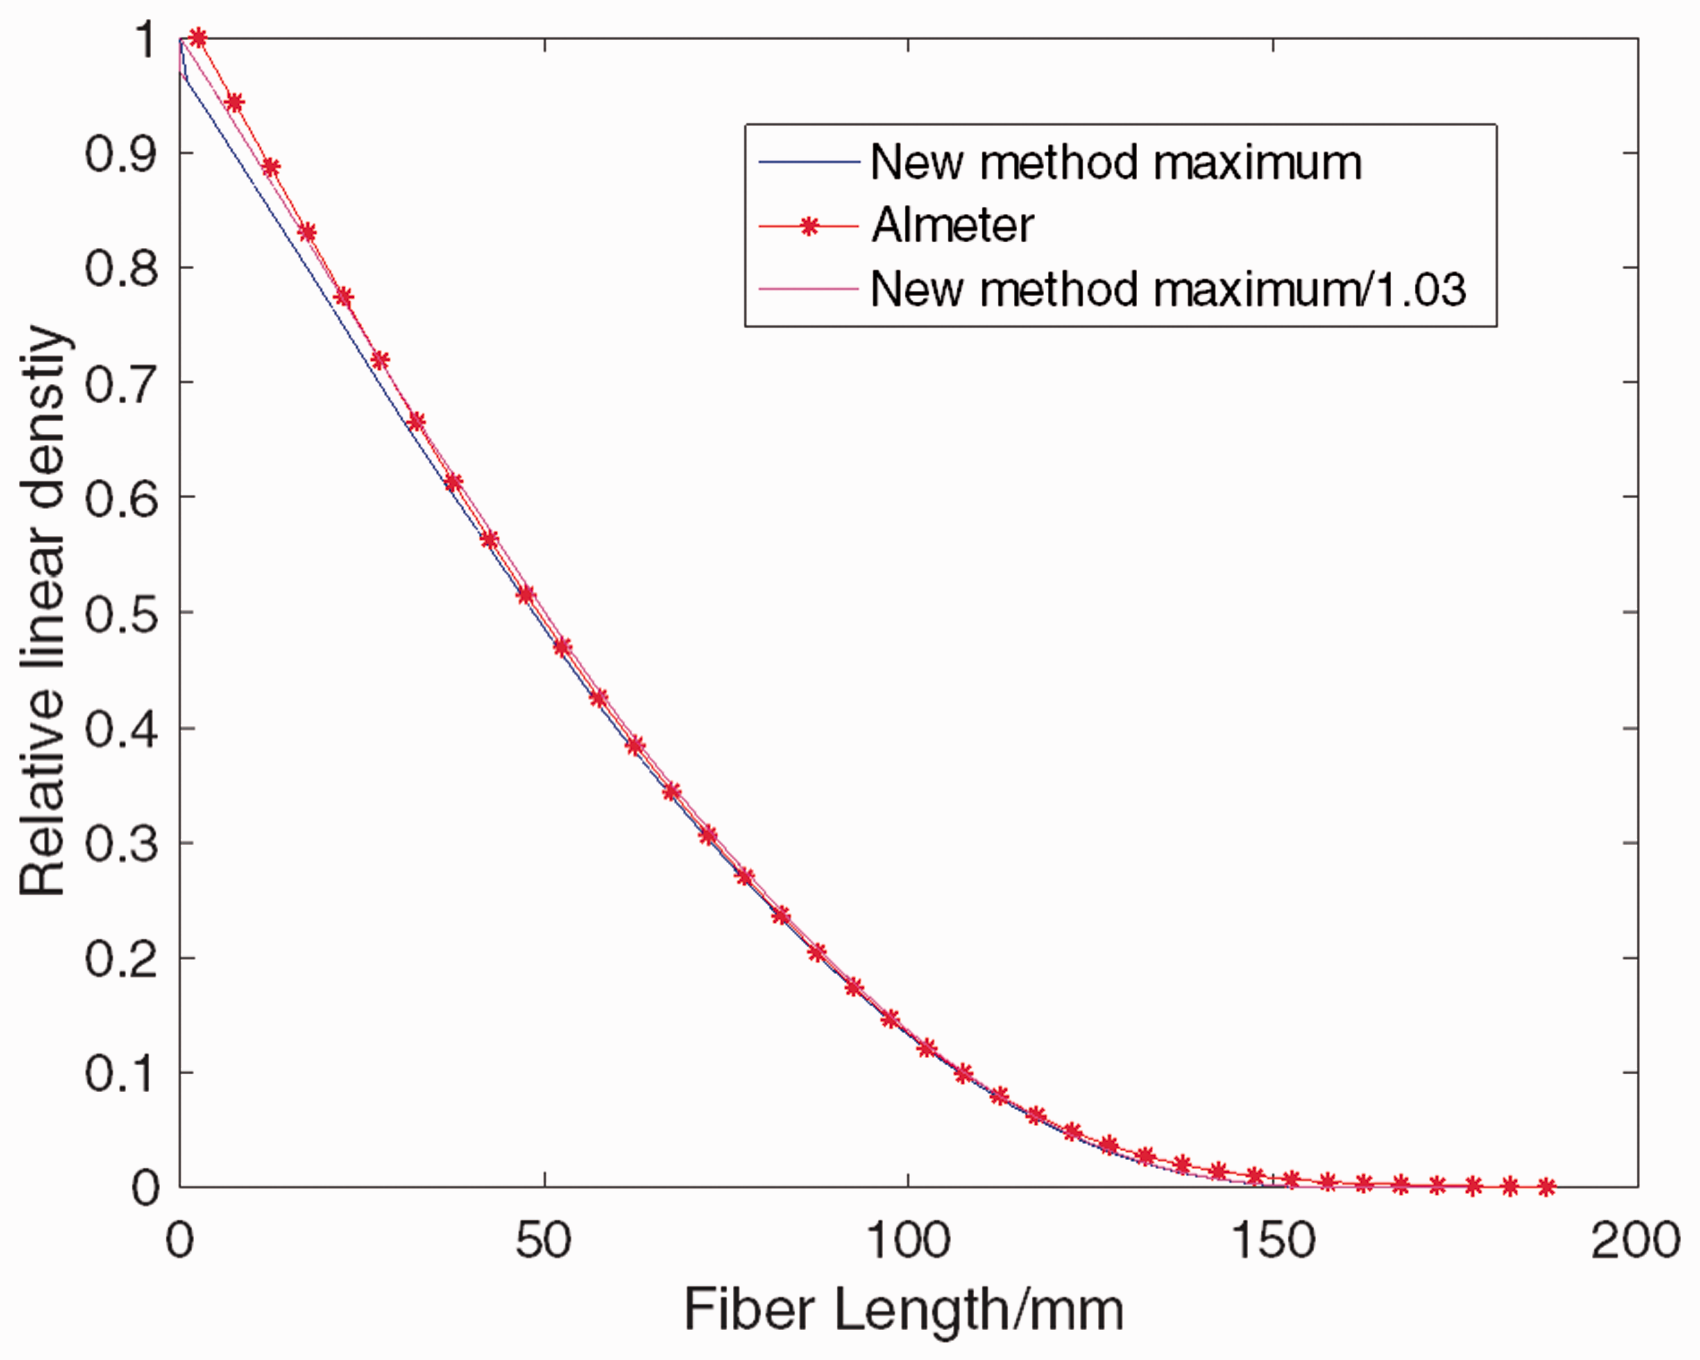

Assuming the waviness is maintained the same along each fiber, the fiber transverse interference is corrected with waviness coefficients. The waviness coefficients for the correction of the wool fibrograms is 1.10, 20 respectively determined using experience experiments.15,28
The wool and cotton fibrogram results of this method have been compared with the international standard method Almeter 11 (wool).
Wu and Wang
28
and Jin et al.
26
described the mathematical relationship between the random dual-beard fibrogram

In this case, we can calculate the fibrogram

Figure 6 illustrates the high consistency between the fibrogram of the random-beard image method and that of the standard methods.
Fibrograms measured by the random-beard image method and the Almeter100.
Calculation methods of fiber length parameters
The wool fiber length distribution indexes mainly include five parameters: The Barbe length, the Hauteur length, the short-fiber content, the coefficient of variances of the Barbe length and the coefficient of variances of the Hauteur length. As the accuracy of the parameter short-fiber content of this method has been studied by Jin et al., 26 it is not discussed in this paper.
Wu and Wang 24 and Jin et al. 26 described the mathematical relationship between the dual-beard fibrogram and fiber length distribution. Meanwhile, equations of weighted mean length and its coefficient of variance were derived 24 and applied in the cotton fiber. 28 However, the Hauteur length and its coefficient of variance from the random fibrogram have not been derived or checked as yet.
Barbe length and its coefficient variance
Wu and Wang
28
induced the mathematical equation to calculate the Barbe length B and the coefficient of variance of the Barbe length CV
B
from the cotton fibrogram F(l) of the dual beard, which are shown in equations (6) and (7), respectively


Hauteur length
Assuming the linear densities of fibers in each length group are the same, the Hauteur length can be regard as the numerical mean length according to the definition of Hauteur length, followed by

As

As

As
Coefficient of variance of Hauteur length
The mathematical relationship between the Hauteur length (H), Barbe length (B) and the coefficient of variance of the Hauteur length (CV
H
) has been studied, which is shown in Equation (11). The coefficient of variance of the Hauteur length can be calculated by Equation (11)

Materials
The fineness of fiber samples

Accuracy examination of the random-beard image
The accuracy represents the agreement level between the tested result and the real value and the measurement stability of the system, which is usually evaluated by the parameter bias. In this experiment, the accuracy of the random-beard method is explored from two aspects, the trueness and the repeatability.
Almeter100
The Almeter100 11 is an IWTO standard wool fiber length measurement method, which is widely used in the wool fiber commercial trade and the spinning industry. According to the IWTO-17-04 standard, 11 the operating procedure of the Almeter100 is as follows. Twist one 1.2 meters long wool top 36 times and keep it in the standard atmosphere for at least 24 hours. After eliminating the twists and aligning the two ends of the top, place it evenly on the needle bed of the sampling machine. Then, insert the tops into the needle bed with a rake. Afterward, preparing the aligned top by extracting the fibers 20 times, and the aligned beard can be prepared after extracting fibers from the aligned wool tops 5–16 times. Finally, the aligned beard is tested under the capacitance sensor and the fiber length distribution information can be calculated.
Trueness check
Correlation analysis
According to the random-beard image method and the IWTO standard of the Almeter10011 as mentioned, four fiber length parameters, the Barbe length, the Hauteur length and their coefficient variances, of samples 1#–10# were measured by the random-beard image method and the reference method to check the accuracy of the random-beard image method, as shown in Figure 7. Each fiber length parameter of the random-beard image method was calculated by the average fibrogram derived from two dual-beard transmission images.
The agreement between the random-beard image method and the Almeter100: (a) Barbe length; (b) Hauteur length; (c) coefficient of variance of the Barbe length; (d) coefficient of variance of the Hauteur length.
Figure 7 indicates that the measured Barbe length, Hauteur length and coefficients of deviation of the Barbe length and Hauteur length using the random-beard image method have high linearity with those using the reference method. In addition, the square of correlation coefficients R2 of the Barbe length, Hauteur length and coefficients of deviation of the Barbe length and Hauteur length are 0.98921, 0.98082, 0.98504 and 0.95863, respectively, among which 0.95863 is on the edge of a high correlation for the used parameters, B and H, in its calculation equation.
The coefficients of variance scope of the Hauteur length of samples are relatively small. In this case, the linear correlation analysis of this parameter only tested a small range of values. However, the results of this parameter by the testing and reference methods are very close to each other. In this case, these measurement results are valid for demonstrating the agreement of the two methods.
Bias
Bias was used to evaluate the agreement of the fiber length parameters between the two methods. This term is defined as the errors between the measured average value and the reference value. The smaller the biases are, the better the agreements of the parameters measured by the two methods would be. Moreover, a T-test was applied to determine whether the bias was significant.
Biases of fiber length parameters between the random-beard image method and the Almeter100

Repeatability examination
The standard deviation σ and coefficient of deviation c v of four parameters of three samples by testing five times with the random-beard image method and the Almeter100

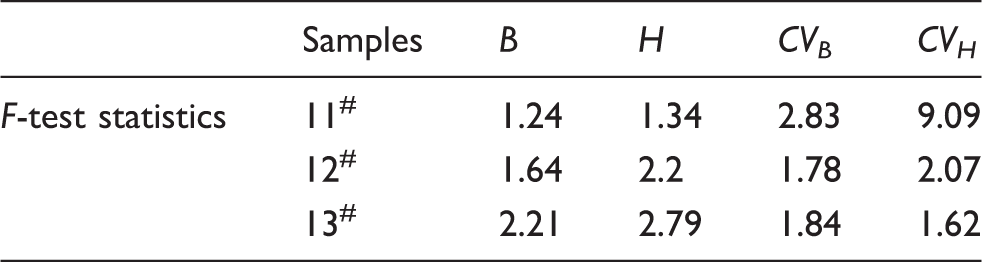
The standard deviation and coefficients of deviation of each fiber length parameters of the three samples calculated by testing five times with the random-beard image method are small and close to the results of the Almeter100, as shown in Table 3. To evaluate the repeatability of these two methods, an F-test was used to evaluate the significance of the differences of each parameter between them.
F-test statistic values of four fiber length indexes between the random-beard image method and the Almeter100
Conclusion
Based on the mathematic relationship between the random distribution and fibrogram of the dual beard, this paper derived the mathematic method for calculating the wool fiber length parameter, the Hauteur length, from the fibrogram F(l). In addition, taking the IWTO standard method Almeter100 as the reference method, a series of experiments was carried out to evaluate the accuracy and repeatability of the random-beard image method. Some conclusions are as follows.
The results of four fiber length parameters, the Barbe length, Hauteur length and the coefficients of variance of the Barbe length and Hauteur length, by the random-beard method and Almeter100, have good agreement. These four fiber length parameters of 10 kinds of samples were measured using the random-beard image method and the reference method. According to the linear correlation analysis, the square of correlation coefficients R2 of the Barbe length, Hauteur length and coefficients of deviation of the Barbe length and Hauteur length were 0.98921, 0.98082, 0.98504 and 0.95863, respectively. Furthermore, under significance of α = 0.01, it was found that the biases of each parameter using the two methods are not significant. The random-beard image method has good repeatability. Three kinds of wool samples were measured five times by both the random-beard image method and the reference method, the Almeter100, in the same laboratory. An F-test was applied to analyze the repeatability of the two methods. Under significance of α = 0.05, the results show that the repeatability of the four fiber length parameters by the random-beard method and the Almeter100 are at the same level.
In conclusion, the accuracy of the random-beard image method is good. This rapid, low-cost, portable and new image method has potential use in the spinning industry and commercial trade. Meanwhile, the accuracy and repeatability could be improved after all processes become automatic in the future. Future studies will focus on fiber length measurement of other kinds of fibers.
Footnotes
Declaration of conflicting interests
The authors declared no potential conflicts of interest with respect to the research, authorship and/or publication of this article.
Funding
The authors disclosed receipt of the following financial support for the research, authorship, and/or publication of this article: This work was partially supported by the Chinese National Science Foundation (Grant Number NSFC 51673036) and the Fundamental Research Funds for the Central Universities (Grant Number CUSF-DH- D-2016014).