



Abstract
The rapid and accurate determination of flax fiber composition is necessary for its application, but until now it has mainly been tested by the wet chemical method, which is time-consuming and not environmentally friendly. In this paper, near-infrared (NIR) spectroscopy was studied to determinate the main composition of flax, in which 43 flax samples were tested according to the traditional Chinese wet chemical component test standard. Five sets of spectra were generated to show the characteristic of each sample; in total 215 spectra sets were collected using a Fourier transform near-infrared spectrometer. The methods of partial least squares (PLS) and principal component regression (PCR) were used to establish the relationships between the data from the chemical and NIR methods. PLS proved to be a better quantitative method than PCR, based on the value of the coefficient of multiple determination for calibration (Rc2) and prediction (Rp2), the ratio of performance to standard deviate (RPD) and the root mean square error of prediction (RMSEP). With the best pretreatment method, the spectral range of 10,000–4000 cm–1 yielded a better predictive result than the full range, with Rc2 of 0.968, Rp2 of 0.955, RMSEP of 1.060%, RPD of 4.641 for cellulose and Rc2 of 0.958, Rp2 of 0.906, RMSEP of 0.678%, RPD of 3.305 for hemicellulose, while the spectral range 6900–5600 cm–1 yielded a better predictive result with Rc2 of 0.936, Rp2 of 0.769, RMSEP of 0.455%, and RPD of 2.366 for lignin. The study shows that NIR models can provide a simple and fast way to analyze flax fiber composition, which is also beneficial to evaluate its quality.
Keywords
Flax, like jute, hemp, ramie and kenaf, is a bast fiber. Flax plants 1 are divided into fiber flax, oil flax and dual-use flax. Fiber flax is the main raw material used to produce middle-to-high grade linens. Linens made from flax fiber have the unique properties of being hygroscopic, cool, antiseptic and antistatic, having a natural texture and being soft in color and rough. 2 They have worldwide applications because of their sanitary and stiff properties. Flax is a type of cellular fiber with several nuclei, in which the morphological constituents, such as cellulose, hemicellulose, lignin and pectin, affect its physical, mechanical and chemical properties. 3 Therefore, it is very important to determine the content of hemicellulose, cellulose and lignin in flax to identify its application in the textile or other industry areas. There is no standard of detecting the composition of bast fibers in the world except in China, and the existing traditional Chinese wet chemical component test standard (GB/T5889-86) has its limitations, such as being time-consuming, being a complicated operation and the potential dangers to the tester and environmental pollution.4,5 According to the traditional Chinese wet chemical component test standard (GB/T5889-86), it takes about 6 full days to identify the content of hemicelluloses, cellulose and lignin for one flax fiber sample. One sample needs to be measured three times for data accuracy. Therefore, a simple and fast detection for flax composition is essential.
As a spectral analysis technique, the near-infrared (NIR) technique can achieve the requirement of fast and multiple composition analysis.6,7 Recently, the NIR technique has been frequently used to quickly analyze the chemical composition of plant materials and has shown comparative advantages and value. Once reliable and robust NIR models are built, it will take only about several hours for sample preparation, and then the content of cellulose, hemicellulose and lignin can be measured through the NIR model predication without any chemical process. The NIR technique is expensive for most industries, and is mainly used by research institutes at present. The application of Fourier transform near-infrared (FT-NIR) techniques has been demonstrated in quantitatively analyzing the chemical composition of corn. 8 NIR models were also found to be suitable for the fast and accurate analysis of the chemical composition of maizesilage, 9 rice straw 7 and tobacco. 10 Kelley et al. 4 obtained solid calibration models for most of the biomass components in various agricultural samples. The NIR technique proved to be useful to test hemicellulose, cellulose and lignin in ramie, 11 Moso Bamboo, 12 Miscanthussinensis 13 and big bluestem. 14 Through the NIR method, Miryeong et al.15–18 determined the content of wax in flax fiber, the shive content of flax and the content of flax in flax/cotton blended products. Using the NIR method, Jiang et al. 19 and Zhou et al.20,21 obtained a series of research results about the determination of mixed hardwood lignin and carbohydrate content, cellulose content in pulp and the classification and identification of plant fibrous material.
However, it was found that the research on applying NIR spectroscopy to determine the main chemical compositions of flax was limited. In this study, FT-NIR spectroscopy was used to establish the NIR models to predict the contents of hemicellulose, cellulose and lignin in flax fiber. The models derived from this work can be used to quickly analyze the main chemical compositions of flax fiber.
Methods
Sample preparation
Forty-three flax fiber specimens with different chemical components were selected in which 25 specimens were planted in France, Belgium and Netherlands. The remaining 18 fiber specimens from France were treated by enzymes aimed to get a broader variation range of chemical components. All specimens were supplied by Royal Golden Eagle Co., Ltd (Zhejiang Province, China).
The traditional Chinese wet chemical component test
Reliable data calibration is the most critical aspect because it affects the precision of the NIR measurement system for the fast chemical characterization.
8
In this research, the cellulose, hemicellulose, lignin and other contents (including wax, water solute, pectin) in 43 samples were firstly measured following the standard procedure of the traditional Chinese wet chemical component test standard “GB/T5889-86.” It is the most common testing method for bast fiber. The detailed procedure is shown in Figure 1.
Schematic diagram for the wet chemical analysis to determine bast fiber composition.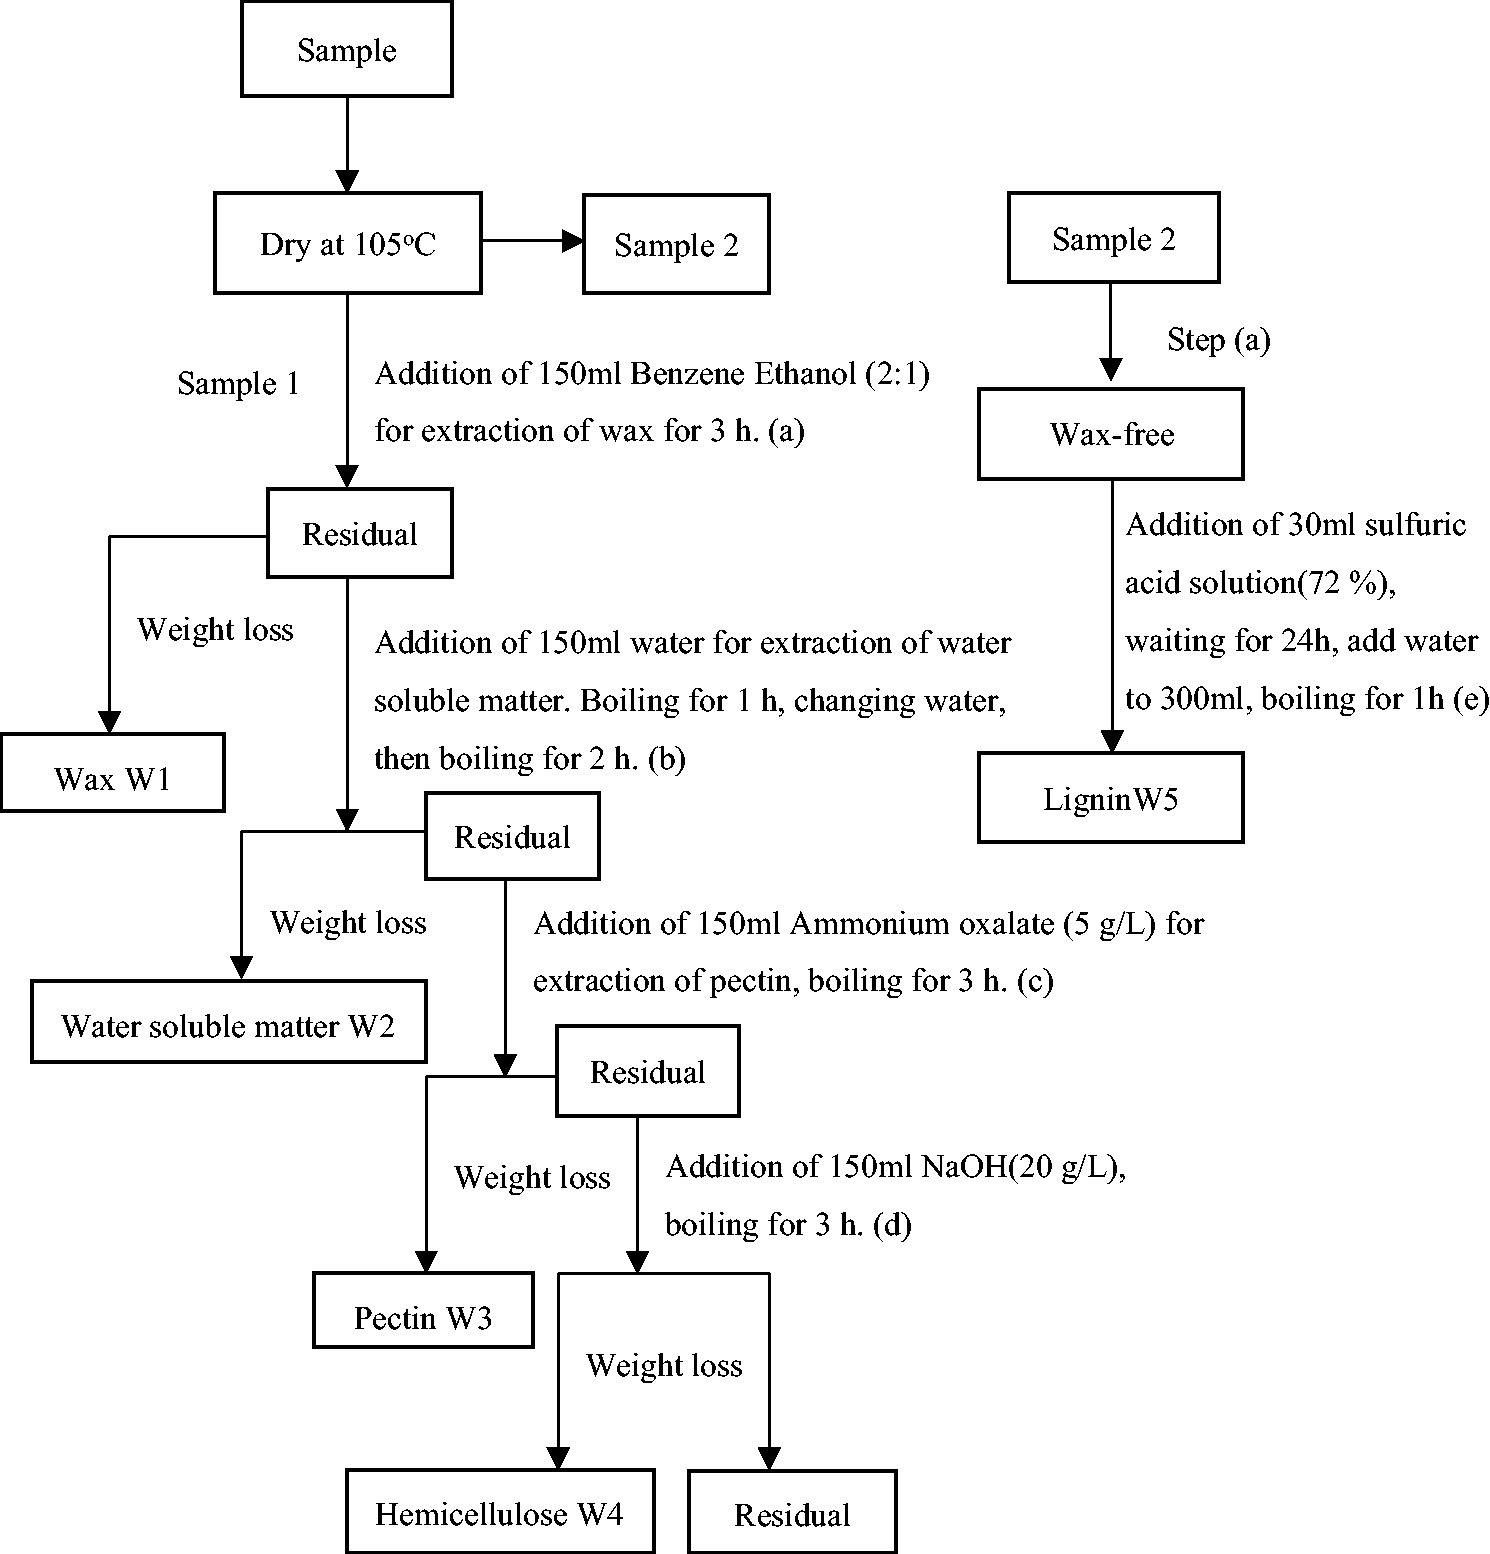
All the data (%, w/w) in Figure 1 were moisture-free. “W1, W2, W3, W4, W5” represent the weight percentage of wax, water soluble matter, pectin, hemicellulose and lignin, respectively. The remaining codes (“100- W1- W2- W3 -W4 -W5”) represent the weight percentage of cellulose. Chemical contents were measured by the Chinese wet chemical testing method and another two test rounds were added for accuracy.
NIR measurement
According to the definition of the American Society for Testing and Materials (ASTM), NIR light is a spectral region with a wavelength of 800–2500 nm (the wave number is 12,500–4000 cm–1). 22 The wave number commonly used in practical applications is the measurement unit in the NIR spectral region, and the wave number range of the NIR spectrum is from 12,500 to 4000 cm–1 usually. The NIR spectrum is mainly caused by the non-resonant vibration of molecular vibration, which causes the molecular vibration to transition from the ground state to the high energy level. The NIR absorbance of a material is mainly associated with the overtone vibrations and combination vibrations of the chemical bonds, such as X-H (X = C,N,O). The NIR absorbance spectra offer a reliable, fast and nondestructive approach for content tests with simple sample preparation, so it is applied widely in the agriculture, pharmaceutical, textile and petroleum industries. In this study, the spectrum covered a range of 12,500–4000 cm–1 with a spectral resolution of 8 cm–1. Each spectrum is the average of 32 scans obtained by diffuse reflection. Considering the diversity of flax fiber composition, each sample was scanned 50 times by the NIR spectroscopy device. After achieving hygroscopic equilibrium, about 1 g of the sample (crushed into 60 items) was placed in a sample cup (18 mm in diameter) for scanning to obtain the NIR spectrum.
Chemometric analysis
Unscrambler X 10.5 software was used for NIR model construction. Principal component regression (PCR) and partial least squares (PLS) are two main statistical methods that can be used to build NIR models. These regression methods can be used to find the optimum relationship between the spectral data matrix and the properties of interest.
12
Different pretreatments can be used to correct the baseline and reduce the noise before using these methods to build NIR models, such as baseline, first derivative (FD), multiplication scattering correction (MSC) and standard normal variate (SNV). Thirty-six samples were used for calibration and seven samples were used for prediction to construct and verify the models. Those samples for calibration and prediction were randomly selected, and their data distribution should have a similar mean value and in approximately the same range. The model performance was evaluated by five important indicators,12,13 namely the coefficient of multiple determination for calibration (Rc2), the coefficient of multiple determination for prediction (Rp2), the root mean square error of calibration (RMSEC), the root mean square error of prediction (RMSEP) and the ratio of performance to standard deviate (RPD). They were calculated as follows:



RPD was calculated to assess the predictive ability of the NIR model.
13
The higher the value of RPD, the more powerful the predictive ability the model obtains. In specific agricultural applications, RPD larger than 1.5 is regarded as good for preliminary screenings and initial predictions; RPD between 2.0 and 2.5 is considered satisfactory for prediction; RPD greater than 3.0 indicates that the model could predict efficiently.
23
RPD was calculated as follows

Results and discussion
Flax samples
Composition (%, w/w) of flax samples by the chemical method for calibration and prediction

Sample spectra
Considering the complex spectral fluctuate characteristic of flax samples, each sample was scanned 50 times to form an initial spectra database. The average of 10 single random spectra in the database was used as a representative curve set, and finally five sets of spectra were generated to show the characteristic of each sample. In total 215 spectra sets can be generated, in which 180 spectra sets are used to develop and 35 spectra sets are used to verify the NIR models, which is presented in Figure 2.
Two-hundred-and-fifteen spectra sets with 32 scans at a resolution of 8 cm–1.
In general, all NIR spectra exhibited three main peaks. The first peak was relatively wide, between 6550 and 7100 cm–1, which was in relation to cellulose (6711 cm–1) and the O-H stretch in the first overtone of H2O (6897 cm–1). The second peak at 5180 cm–1 was associated with the O-H stretch/O-H deformation of H2O from a combination of cellulose.25,26 The third peak potentially corresponded to the asymmetrical C=O stretch in the third overtone of cellulose (4745 cm–1).24,25
NIR model development
Results of the PLS and PCR models for cellulose with different pretreatments based on the full and reduced spectral range

PLS: partial least squares; PCR: principal component regression; FD: first derivative; SNV: standard normal variate; Rc2: coefficient of multiple determination for calibration; RMSEC: root mean square error of calibration; Rp2: coefficient of multiple determination for prediction; RMSEP: root mean square error of prediction; RPD: ratio of performance to standard deviate.
Results of the PLS and PCR models for hemicellulose with different pretreatments based on the full and reduced spectral range

PLS: partial least squares; PCR: principal component regression; FD: first derivative; SNV: standard normal variate; Rc2: coefficient of multiple determination for calibration; RMSEC: root mean square error of calibration; Rp2: coefficient of multiple determination for prediction; RMSEP: root mean square error of prediction; RPD: ratio of performance to standard deviate.
Results of the PLS and PCR models for lignin with different pretreatments based on the full and reduced spectral range
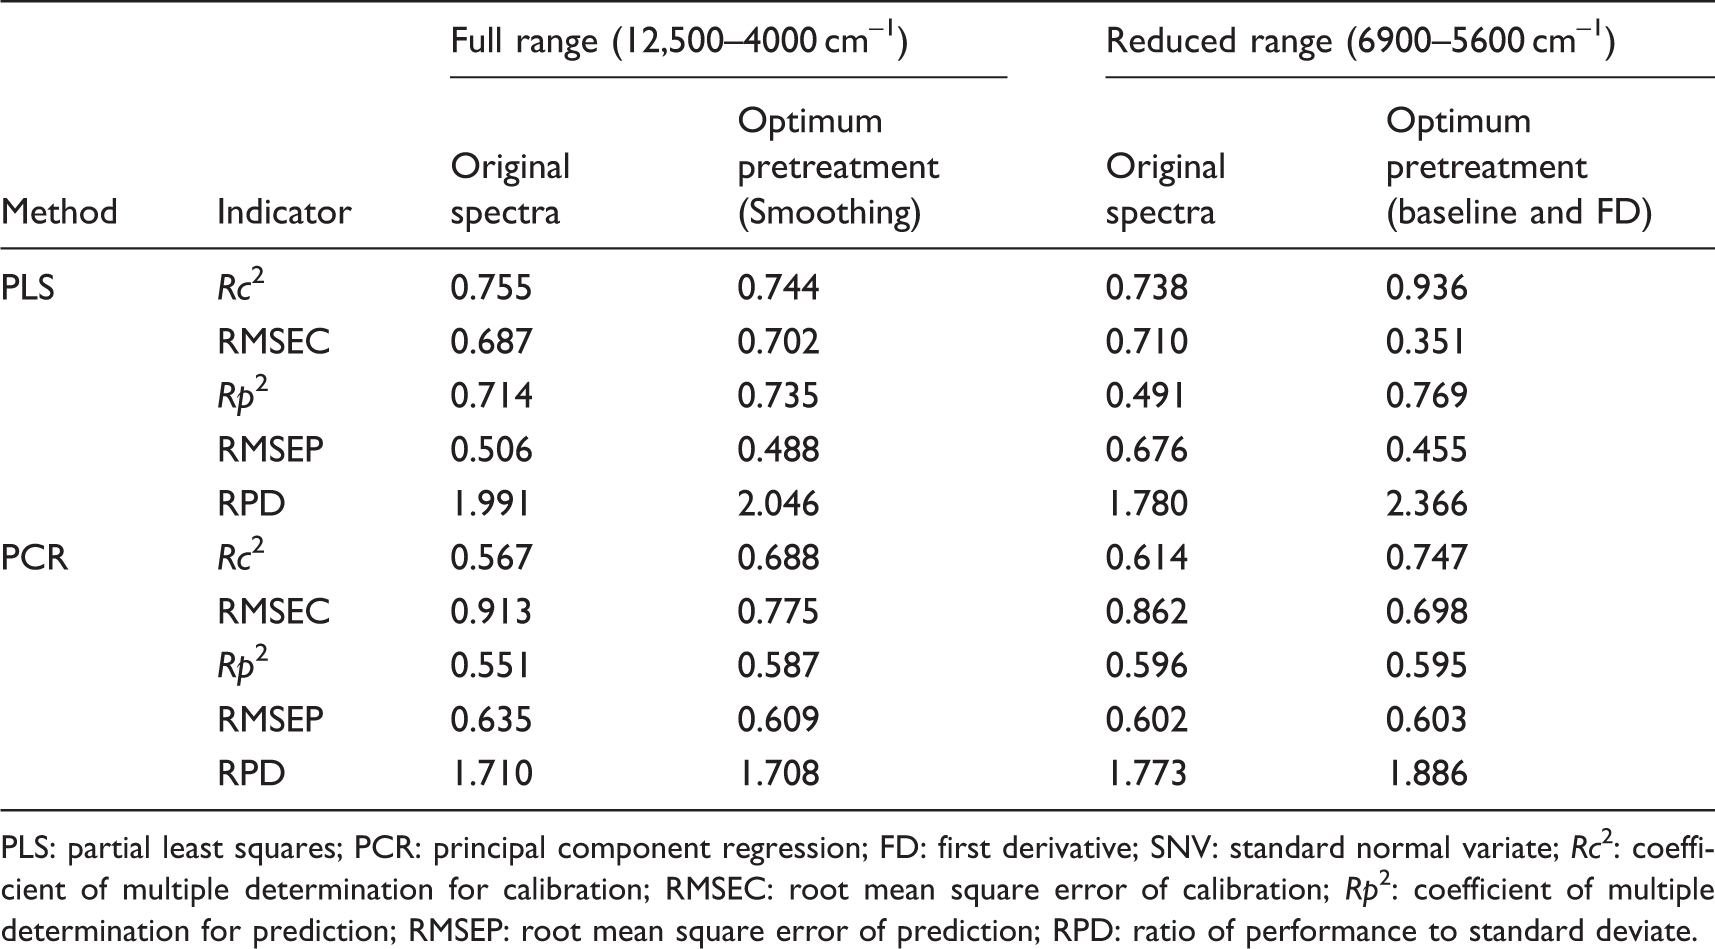
PLS: partial least squares; PCR: principal component regression; FD: first derivative; SNV: standard normal variate; Rc2: coefficient of multiple determination for calibration; RMSEC: root mean square error of calibration; Rp2: coefficient of multiple determination for prediction; RMSEP: root mean square error of prediction; RPD: ratio of performance to standard deviate.
The central approximate position of the combination bands and frequency doubling absorption band of the C-H and O-H groups
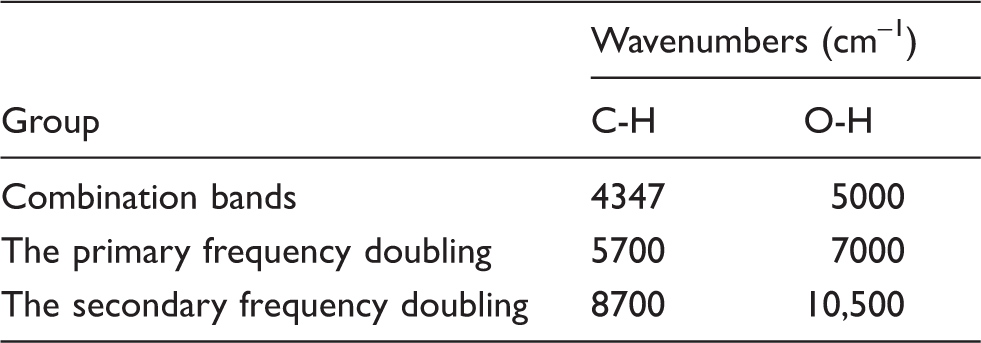
Figure 3 shows plots of predicted versus measured contents of cellulose (a), hemicellulose (b) and lignin (c) in the calibration sub-database. The x-axis represents measured contents of cellulose, hemicellulose and lignin from the traditional wet chemistry component test method according to GB/T5889-86, and the y-axis represents their predicted contents according to optimal NIR models of the calibration sub-database. In Figure 3, the prediction versus reference plots showed that the slope of the linear equation was close to 1 (0.968, 0.958 and 0.936, respectively), in which X was the measured content and Y was the predicted content. This indicated the high predicting quality of the three PLS models, which was proven by the other statistics listed in Tables 2–4.
Partial least squares regression plots of predicted versus measured contents of cellulose (a), hemicellulose (b) and lignin (c) in 180 spectra sets in the calibration sub-database of flax fiber.
Predicted versus measured content of cellulose in the prediction sub-database

Predicted versus measured content of hemicellulose in the prediction sub-database
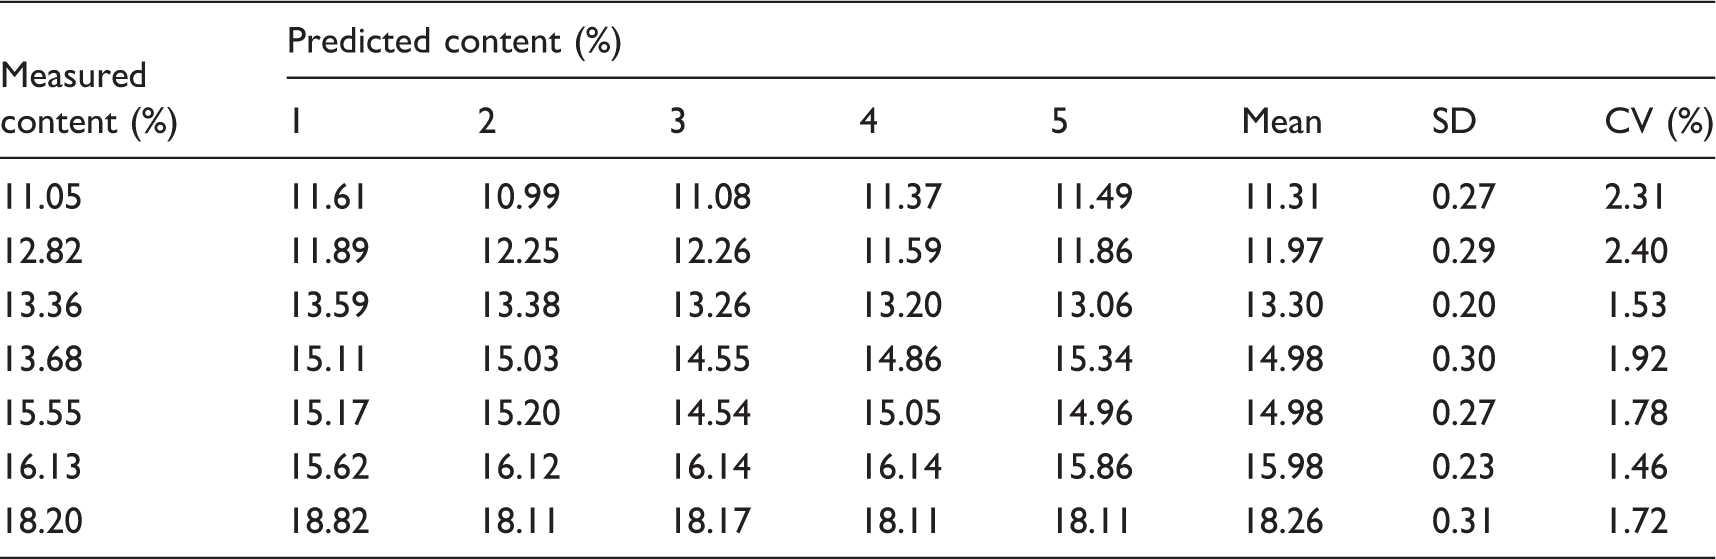
Predicted versus measured content of lignin in the prediction sub-database

Conclusions
FT-NIR spectroscopy together with chemometric analysis was applied to the quantitative prediction of cellulose, hemicellulose and lignin contents of flax. PLS was proved to be a better quantitative method than PCR, based on larger Rp2 and RPD and smaller RMSEP when establishing the NIR prediction model. The spectral range from 10,000 to 4000 cm–1 with the FD and SNV treatment yielded a better prediction model, with Rc2 of 0.968, Rp2 of 0.955, RMSEP of 1.060% and RPD of 4.641 for cellulose; the spectral range from 10,000 to 4000 cm–1 with the baseline and FD treatment yielded a better prediction model with Rc2 of 0.959, Rp2 of 0.906, RMSEP of 0.678% and RPD of 3.305 for hemicellulose; and the spectral range from 6900 to 5600 cm–1 with the baseline and FD treatment yielded a better prediction model with Rc2 of 0.936, Rp2 of 0.769, RMSEP of 0.455% and RPD of 2.366 for lignin. NIR models were established to show good potential as a highly efficient tool for rapid and accurate measurement of cellulose and hemicellulose content in flax fiber. Moreover, the model was also good for the prediction of lignin content to some extent. In future work, the accuracy of lignin prediction needs to be improved and the sample size for calibration needs to be increased reasonably for a wider range to improve the model robustness.
Declaration of conflicting interests
The authors declared no potential conflicts of interest with respect to the research, authorship and/or publication of this article.
Funding
The authors disclosed receipt of the following financial support for the research, authorship, and/or publication of this article: This worked was supported by the earmarked fund for China Agriculture Research System for Bast and Leaf Fiber Crops: CARS-19; China Academy of Agricultural Science and Technology Innovation Project: ASTIP-IBFC07.