
Abstract
Color is difficult to distinguish by human vision and is described by keywords, resulting in low efficiency of wool fabric retrieval in factories at present. To obtain the process sheets of existing products and reduce the work of color measurement in sample analysis, this paper proposes an effective method based on dominant colors (DCs) and color moments (CMs) for wool fabric image retrieval. Firstly, the image was scaled to reduce computational time. Then, the hue, saturation, value color space was divided into 128 parts by the fast color quantization algorithm to extract the DCs of the image. Meanwhile, the CMs based on image partition were calculated in CIE L*a*b* color space to describe the spatial color information. Subsequently, different similarity measure methods were carried out based on the DC feature and CM feature. Finally, experiments were conducted on a wool fabric image database with 20,000 images for parameter optimization and verification. The average precision and recall were up to 87% and 44%, respectively. Experimental results show that the proposed scheme can retrieve images with the same or similar colors quickly and effectively and it outperformed other methods, providing referential assistance for the factory worker when retrieving wool fabrics.
When a wool fabric factory obtains samples from consumers for reproduction, sample analysis 1 is adopted to obtain the fabric parameters by manual work. The fabric parameters mainly include fabric weave, density, yarn arrangement, color, etc. Except for color, the other parameters can be regarded as texture features. In the sample analysis, the fabric colors are measured using the instrument Datacolor or DigiEye. Then, color matching is performed by repeated proofing until the consumer is satisfied with the color appearance. This method is very time-consuming, laborious and has low accuracy. Retrieving existing products can obtain the process sheet directly and guide production to shorten the production period. For traditional methods, the sample was compared with the existing fabrics by manual work to retrieve a similar color. However, humans cannot distinguish colors that are very similar due to the limited color difference discrimination of human eyes. Another method used in factories, text-based image retrieval (TBIR), relies on textual keywords manually annotated on images. There is a semantic gap 2 between the visual features and the richness of human semantics. In the first part 3 of this series, retrieving fabrics with the same or similar texture was realized based on low-level texture features. This part aims at retrieving fabrics with the same or similar colors based on low-level color features to obtain the same or a similar color matching scheme, saving a great deal of labor and material resources in the sample analysis and proofing process.
In previous studies, the color features used for image retrieval include two aspects: the global color feature and the spatial color feature. The global color feature focuses on color indexing techniques based on global color distributions, such as the color histogram (CH), 4 dominant color (DC), 5 color moment (CM), 6 color distribution entropy (CDE) 7 and so on, but has limited discriminating ability to capture local color information. The spatial color feature combines the spatial correlation of color regions and the global distribution, including the color coherence vector (CCV), 8 color correlogram (CC) 9 and annular, angular and hybrid histograms, 10 but requires more computation time than the global color feature. The local color feature is another method describing the spatial structure relations of colors. This method firstly divides the image into several specified regions, then calculates and combines the color feature of each region to improve the spatial discrimination ability of the global color features. Common regional division methods are based on manual, fixed block, interactive and semi-automatic methods and image segmentation. 11 Local color information is described by the average color, CH, 12 CM, 13 binary color values and so on. For fabric image retrieval, Jing et al. 14 divided each image into four non-overlapping sub-images and obtained a descriptor of 12 × 3 floating points, then adopted a weighted color channel scheme for the similarity measure. Xiang et al. 15 quantized the color edges in the hue, saturation, value (HSV) color space into 63 color sets and extracted the edge CH for printed fabric. Suciati et al. 16 presented quantizing colors in the HSV color space into 72 color sets and extracting the CH for “batik” and “common” fabric. Chen et al. 17 reduced 360 hue values of the HSV color space and four gray levels to 30 values as the color feature using principal component analysis. The above methods all obtained satisfactory results.
However, it is still a challenge for image retrieval of wool fabric due to its characteristics. Firstly, wool fabric appearances are diverse and complicated. In the factory, wool fabric is divided into plain colored, striped, plaid and patterned fabric. There is only one color in some plain colored fabrics, but there are two or more colors in the other kinds of fabrics. Secondly, wool fabric appearances are commonly dark and blurry due to the adopted colors and characteristics of wool fibers, being different from cotton fabric and chemical fiber fabric. This results in the colors in one fabric being difficult to distinguish. Thirdly, wool fabric occupies the entire image and the image has no background, not like the image databases that contain objects. The images captured in the same fabric can also show a great difference. Traditional image partition methods used in images that include objects are not suitable. Therefore, one single color feature cannot characterize different types of wool fabrics, and the above methods need to be expanded.
In this paper, an effective method is proposed for the image retrieval of wool fabric based on modified DCs and CMs. The DC method was performed to describe the global color information, and the local CM method was adopted to describe the spatial color information. Two features were combined to characterize the color of wool fabric based on the new similarity measure methods. This paper proceeds as follows. The second section describes in detail the method proposed in this work. The third section presents the experimental implementation. The fourth section gives detailed experimental results and analysis. The fifth section concludes this paper.
Methods
The proposed framework is outlined in Figure 1, which describes the workflow of the wool fabric image retrieval system. There are three main processing stages: image pre-processing, feature extraction and similarity measure. The images in the database and the query image were pre-processed, and DC and CM features were extracted by feature extraction methods. The distances between query image features and the feature database were calculated by similarity measures. The images were sorted by the distances from small to large and top-K images were output as final results, where K is the number of images.
Framework overview of wool fabric image retrieval. HSV: hue, saturation, value.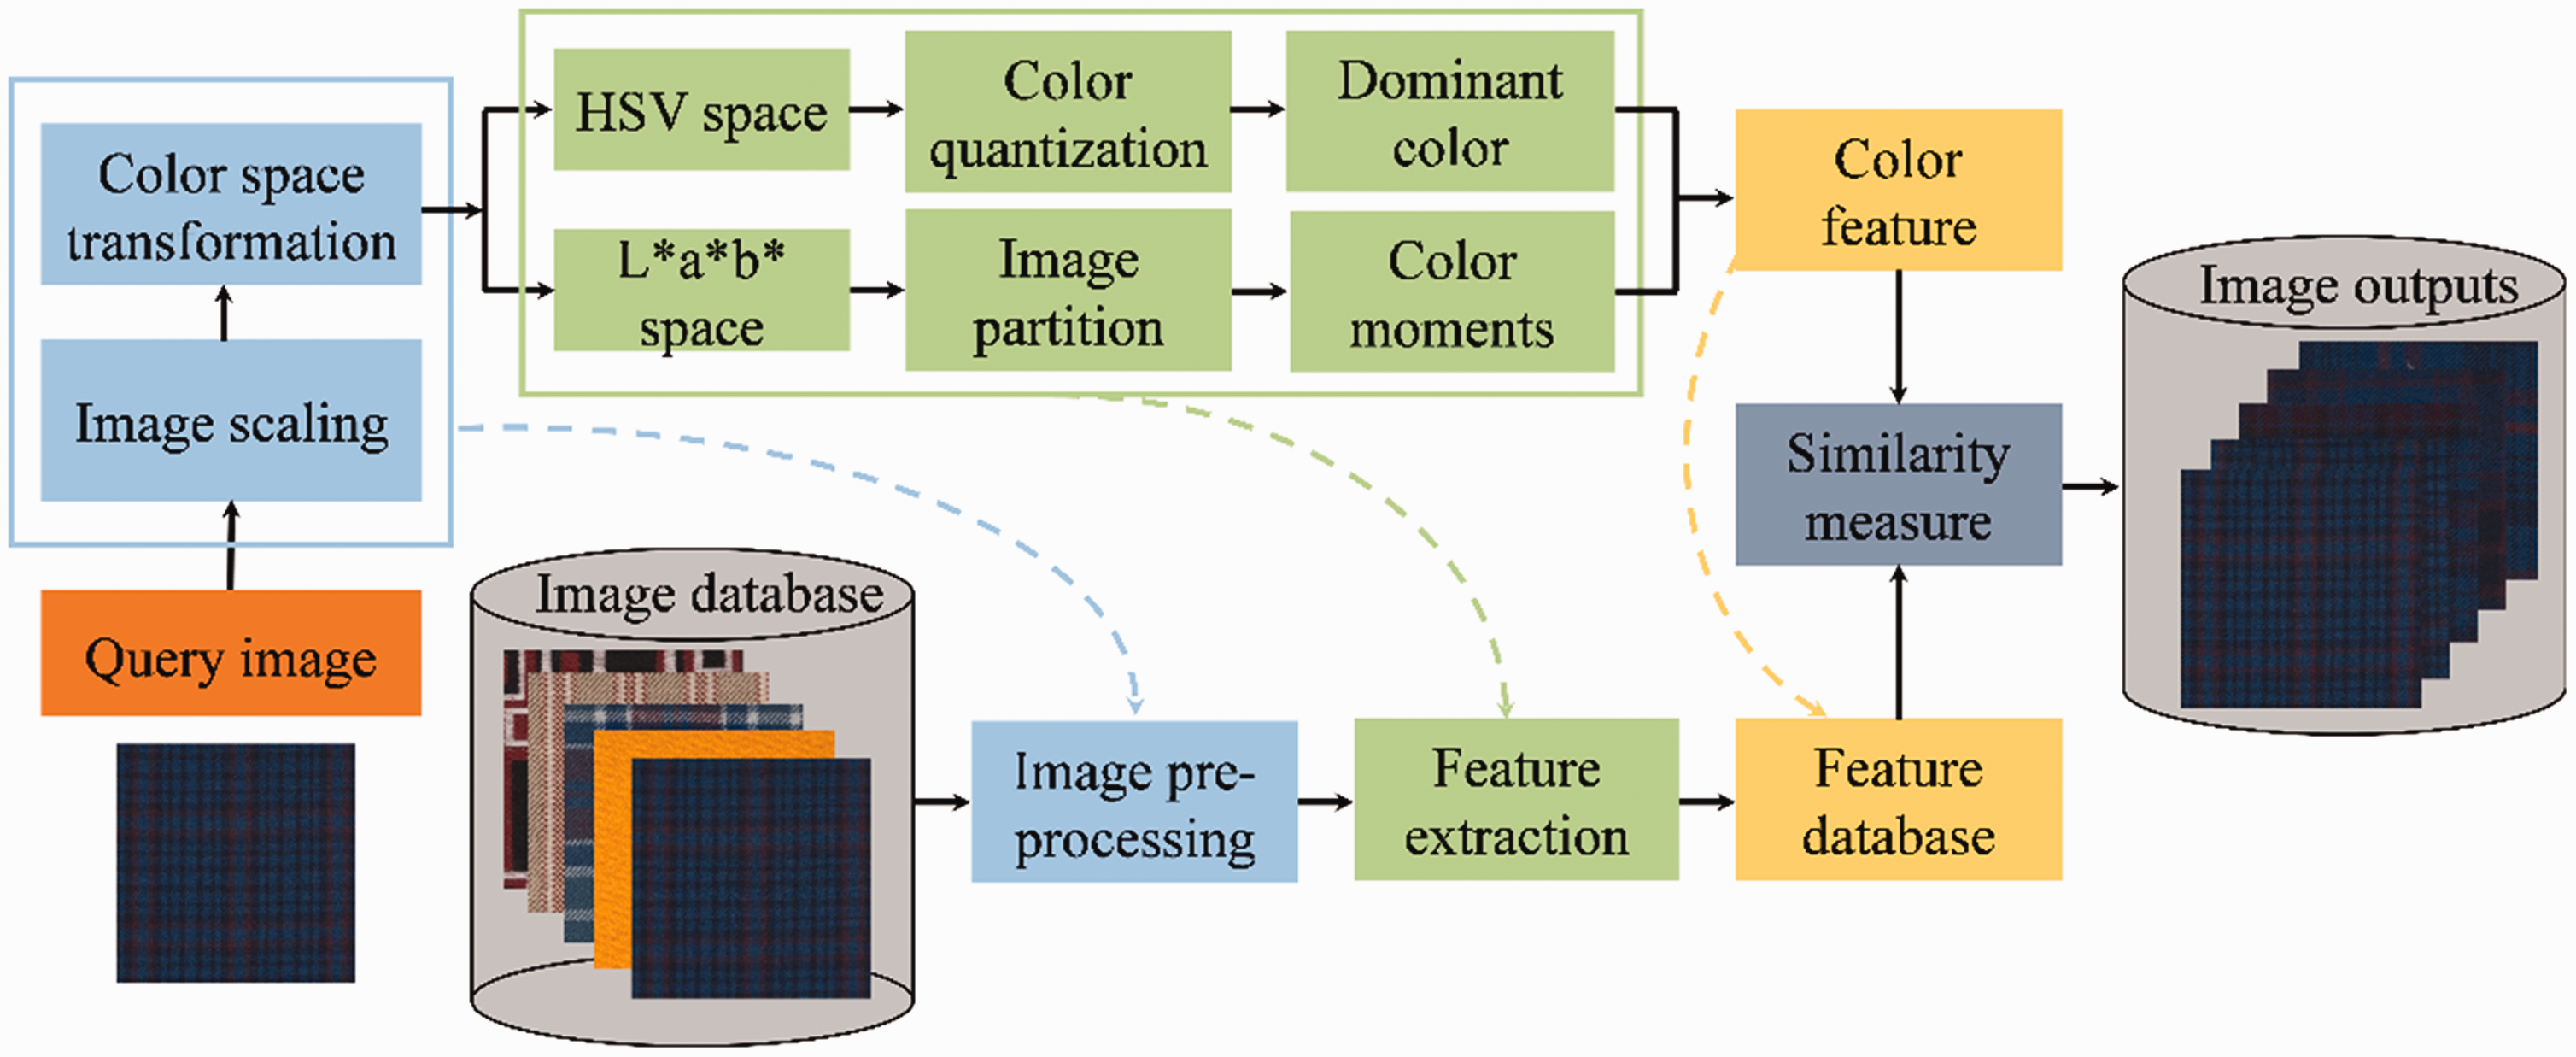
Image pre-processing
To reduce the human workload in the factory, the images used for the color part are the same images in the texture part. As mentioned in Part I,
3
the images were captured using a scanner at the resolution of 200 dpi and cropped to the size of 512 pixels × 512 pixels, and the corresponding physical size is 6.46 cm × 6.46 cm. Patterned fabric whose patterns are larger than this size will not be considered in this experiment. To reduce the computing time, image scaling was performed at the appropriate scaling ratio r. Image scaling uses interpolation to create new or delete redundant pixels. Three frequently used interpolation methods are nearest neighbor, bilinear and bicubic interpolation.
18
Compared to the other interpolation methods, bicubic interpolation avoids the loss in geometric and photometric accuracy. Thus, the bicubic interpolation method was adopted, providing a compromise between computational efficiency and image quality. Assuming that f(x
i
, y
i
) and f(x, y) are the pixel values in the original image and the scaled image, respectively, the bicubic interpolation method is as defined in formula (1).
19
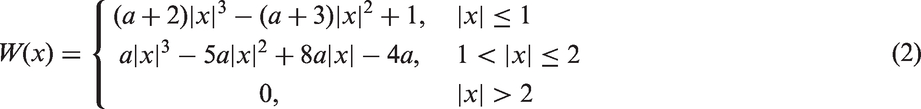
The value of f(x, y) is the weighted stack of the 16 nearest pixel values, and the weights are calculated by the interpolation kernel W(x). The scaling rate was determined by experiments. The scaling process is illustrated in Figure 2, where r = 0.8 as an example
The image scaling process.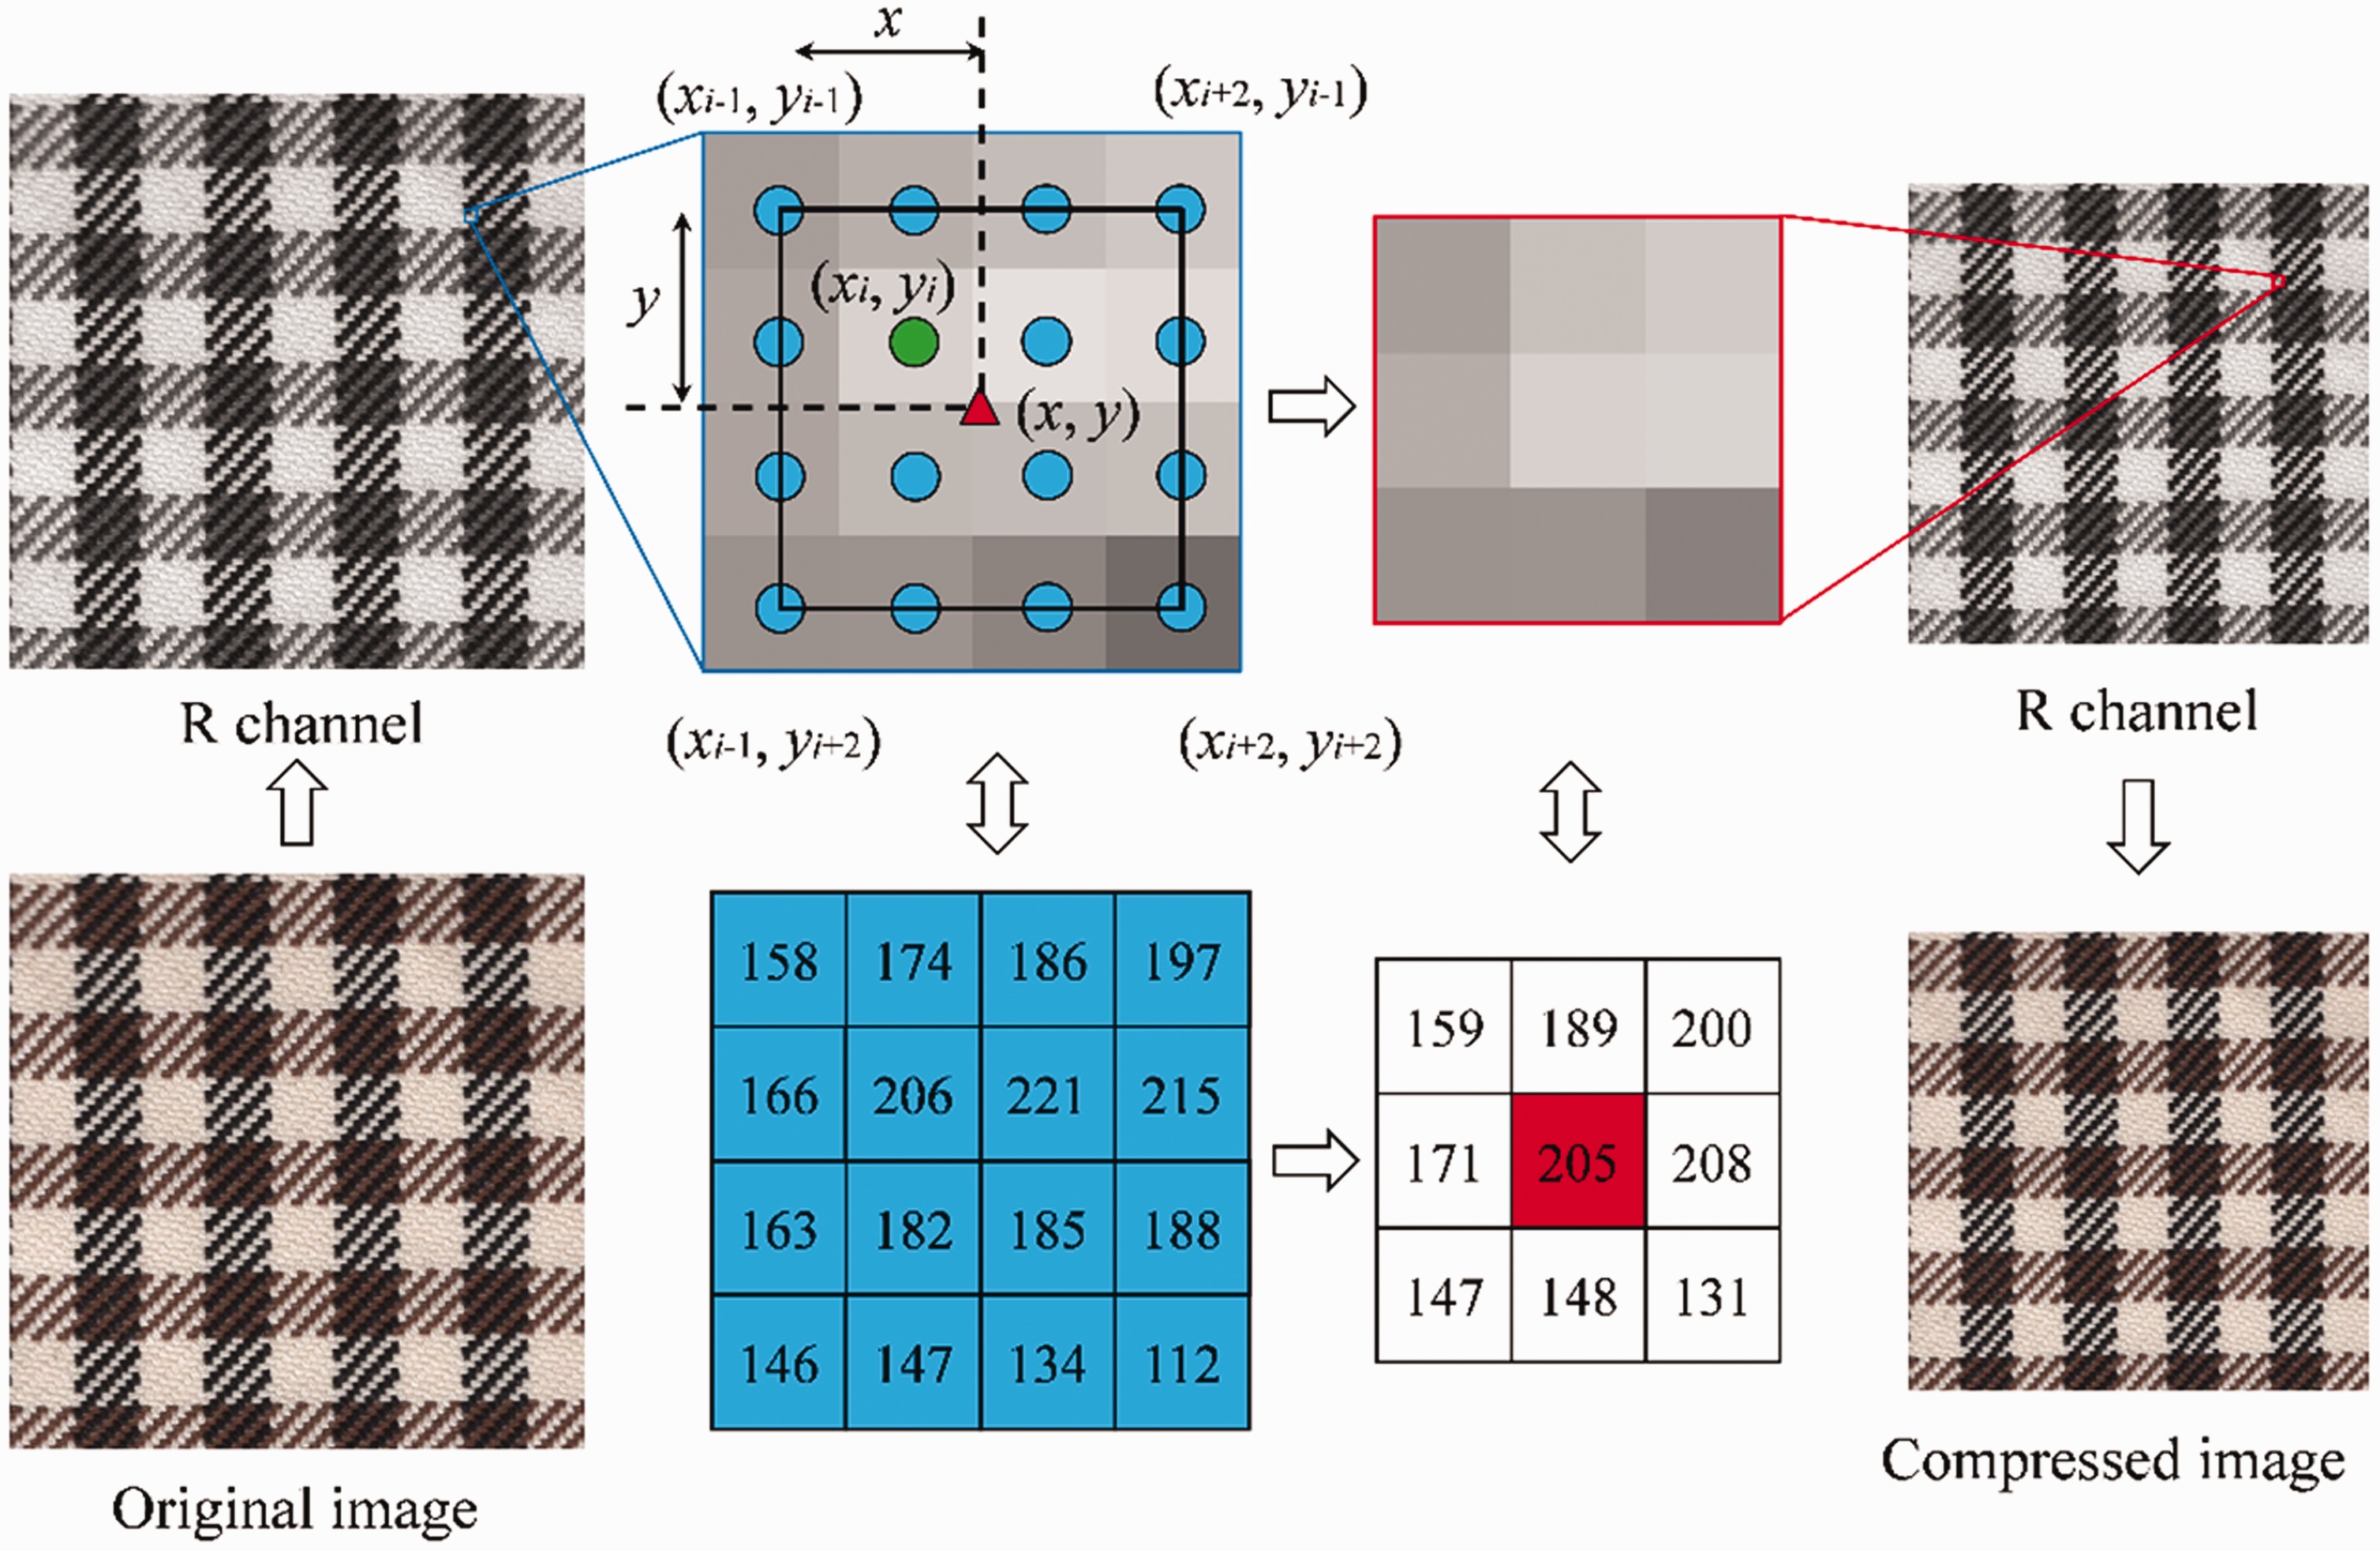

Feature extraction
Dominant color descriptor
As one of the descriptors in Moving Picture Experts Group-7 (MPEG-7),
20
the DC method clusters the colors in an image into a small number of representative colors to describe the salient color distributions, specifying the statistical properties: distribution and variance. The DC descriptor is defined as

Commonly, the generalized Lloyd algorithm (GLA) or fast color quantization algorithm is used to extract the DCs. However, the GLA is limited by time-consuming computation, predefined clusters and the lack of robustness to different initial clusters. Thus, fast color quantization algorithm was performed on HSV color space to reflect human color perception and identification. Hue is the shade portion and is expressed by an angle, ranging from 0° to 360°. Saturation describes the brightness of the color and the value describes the lightness of the color, both ranging from 0 to 1. The HSV color space was quantized into 128 (8 × 4 × 4) parts by non-interval quantization, as shown in Figure 3. H was divided into eight intervals, namely [21°, 40°], [41°, 75°], [76°, 155°], [156°, 190°], [191°, 270°], [271°, 295°], [296°, 316°] and [316°, 20°].
21
S and V were divided into four intervals, respectively, namely [0, 0.25], [0.26, 0.5], [0.51, 0.75] and [0.76, 1]. In this case, c is represented by formula (4), and Non-interval partition of the hue, saturation, value model.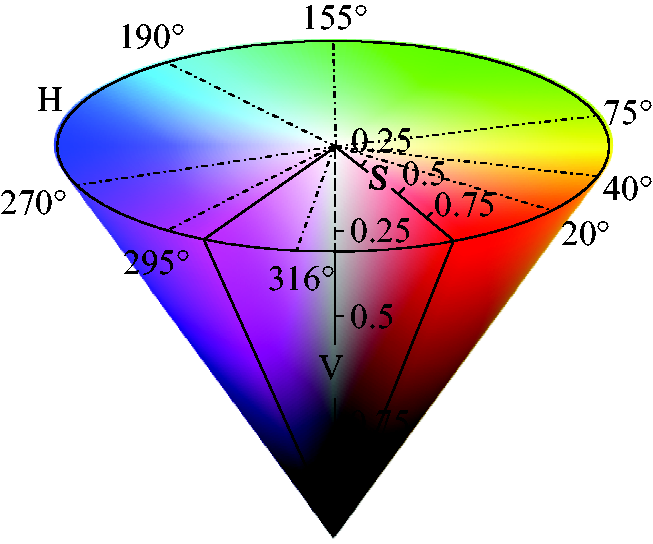

Let Process of non-interval quantization in hue, saturation, value color space.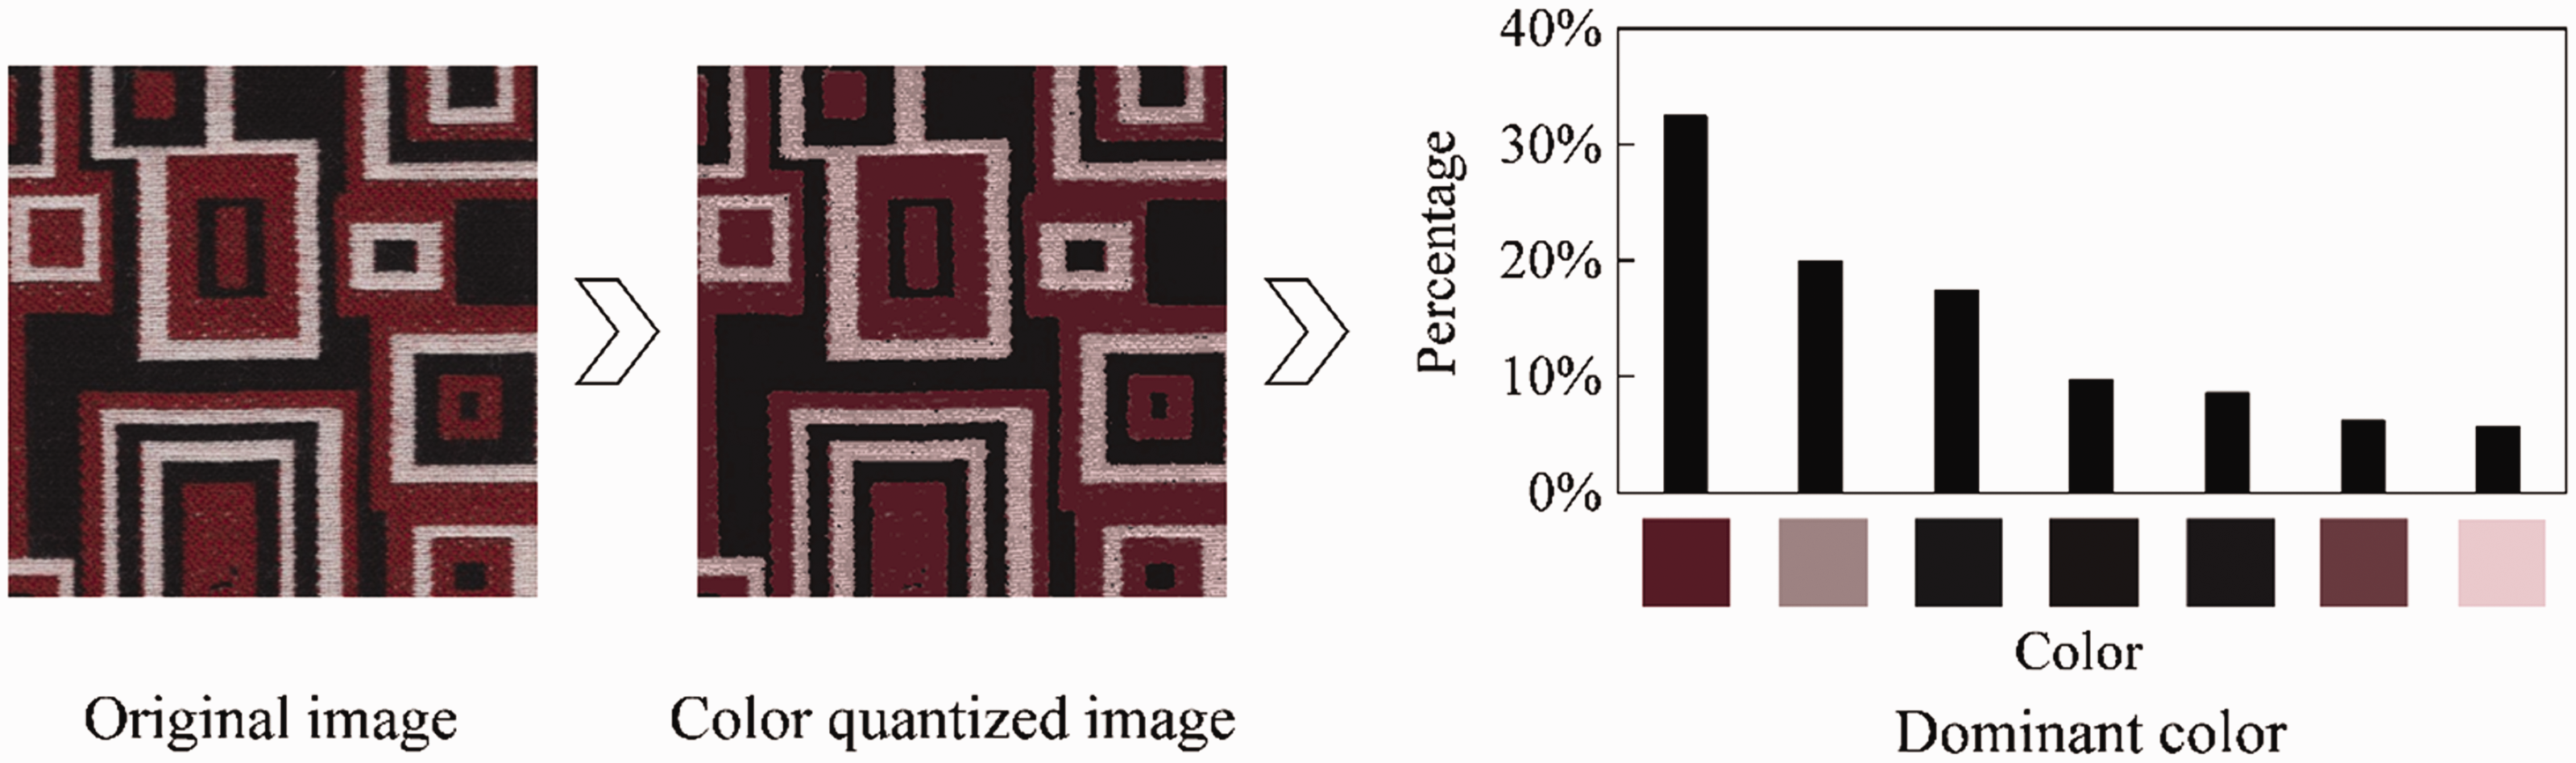

Color moment
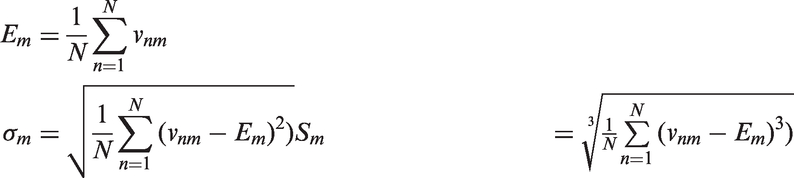
The CM estimates the image brightness and intensity, which contains three principal moments: mean, variance and skewness. The moments represent image color distribution mathematically. Each image color content is represented by nine values, that is, three moments in three channels. Let v
mn
be the value of the nth pixel of the image at the mth color channel; the mean E
m
, standard deviation σ
m
and skewness S
m
can be defined as follows
As a perceptually uniform space with respect to human color perception, Euclidean distance measurement describes the visual perceptual differences between two colors in CIE L*a*b* color space. CIE L*a*b* color space was selected to calculate the CMs. L* represents the lightness from black (0) to white (100), a* ranges from green (–) to red (+) and b* ranges from blue (–) to yellow (+). To represent the spatial color distribution, the image partition method was implemented on the image to extract CM features. As shown in Figure 5, the commonly used image partition methods include two vertically divided parts (V2), three vertically divided parts (V3), two horizontally divided parts (H2), three horizontally divided parts (H3),
23
multiple divided parts (M
d
, d = 2, 3, 4, 5, … , N) and annular parts (A).
13
Different image partition methods.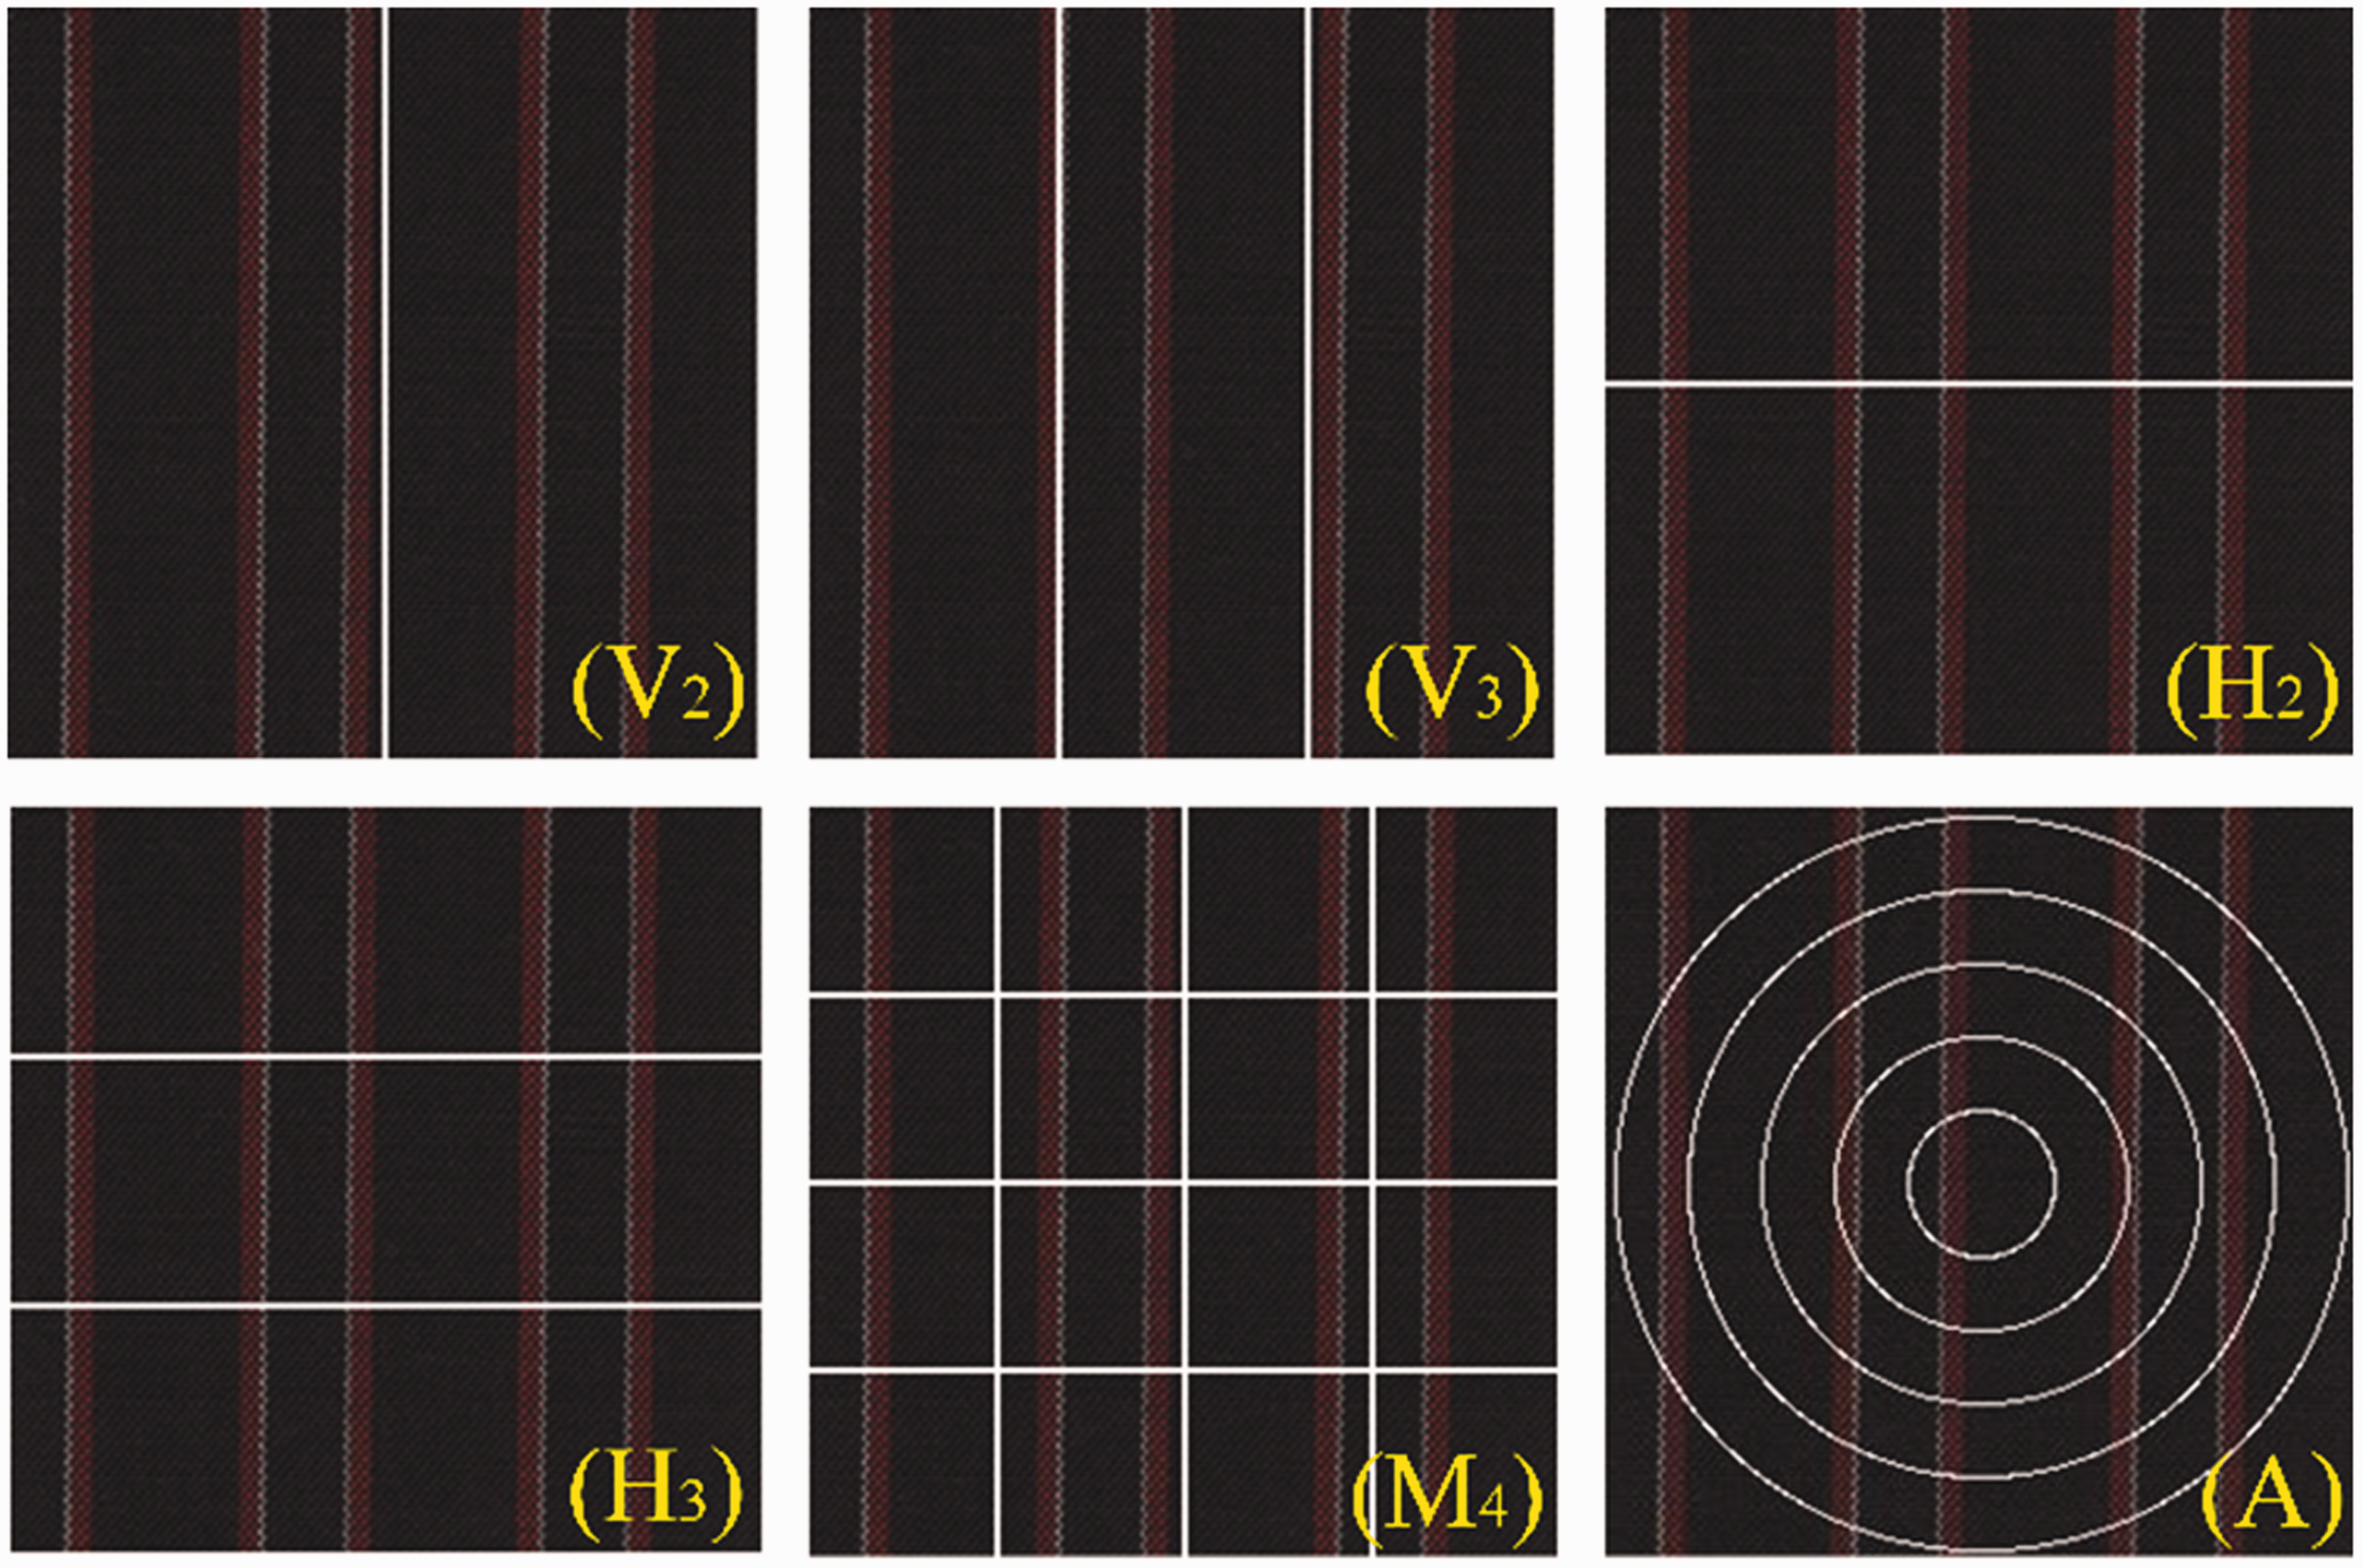
Similarity measure
Two different methods were used to perform similarity measurement for DCs and CMs, respectively. For CMs, Euclidean distance
14
was chosen to calculate the similarity. In n-dimensional space, assuming that

For DCs, Yang et al.
24
proved that the commonly used quadratic-like dissimilarity measure
5
incorrectly reflects the distance between two images under certain conditions, and proposed a modified method. Assuming that two color features are


S i,j is the similarity score between two different DCs. a i,j is the similarity coefficient between c i and b j , determined by the ith and jth DC distance. d i,j is the Euclidean distance between c i and b j . T d is the maximum distance used to judge whether two color clusters are similar, and dmax = αT d . In the previous study, α = 2 and T d = 2524 for RGB (red, green and blue) color space. In RGB color space, R, G and B values all range from 0 to 255. In this experiment, H was normalized to [0, 1] as for the ranges of S and V using Min–Max normalization. Thus, α and T d were set to 2/255 and 25/255, respectively.
To combine the advantages of the two features and overcome the problem that the two distances have different orders of magnitude, the product of the two distances proposed in Part I 3 of this paper was used for the similarity measure. Some distances of DCs are negative numbers, so the numeric attribute was scaled to [0, 1] for further multiplication. Then, the total distance was calculated based on DCs and CMs.
Experimental implementation
This paper aims at developing an image retrieval system for wool fabric. Through the trial experiment and analysis, it was found that the wool fabric has characteristics as described in the Introduction. Wool fabric appearances are diverse, complicated, dark and blurry. Unlike image databases that contain objects, wool fabrics occupies the whole image and the image has no background. The methods used in previous studies need to be modified and the parameters need to be optimized. The experiments should be implemented on the wool fabric image database, but there are no public datasets for fabric image retrieval at present. To provide data support for parameter optimization and verification, 20,000 wool fabrics were collected from the factory and captured under identical conditions to build the image database, as described in Part I.
3
As mentioned above, there are four categories of wool fabrics. In each category, the fabrics contain different fabric weaves, colors, stripes and so on. Figure 6 exhibits some query examples in each category. Experiments were conducted in a MATLAB computing environment on a desktop computer with an Intel 3.60 GHz processor and 16 GB RAM.
Query examples in the image database.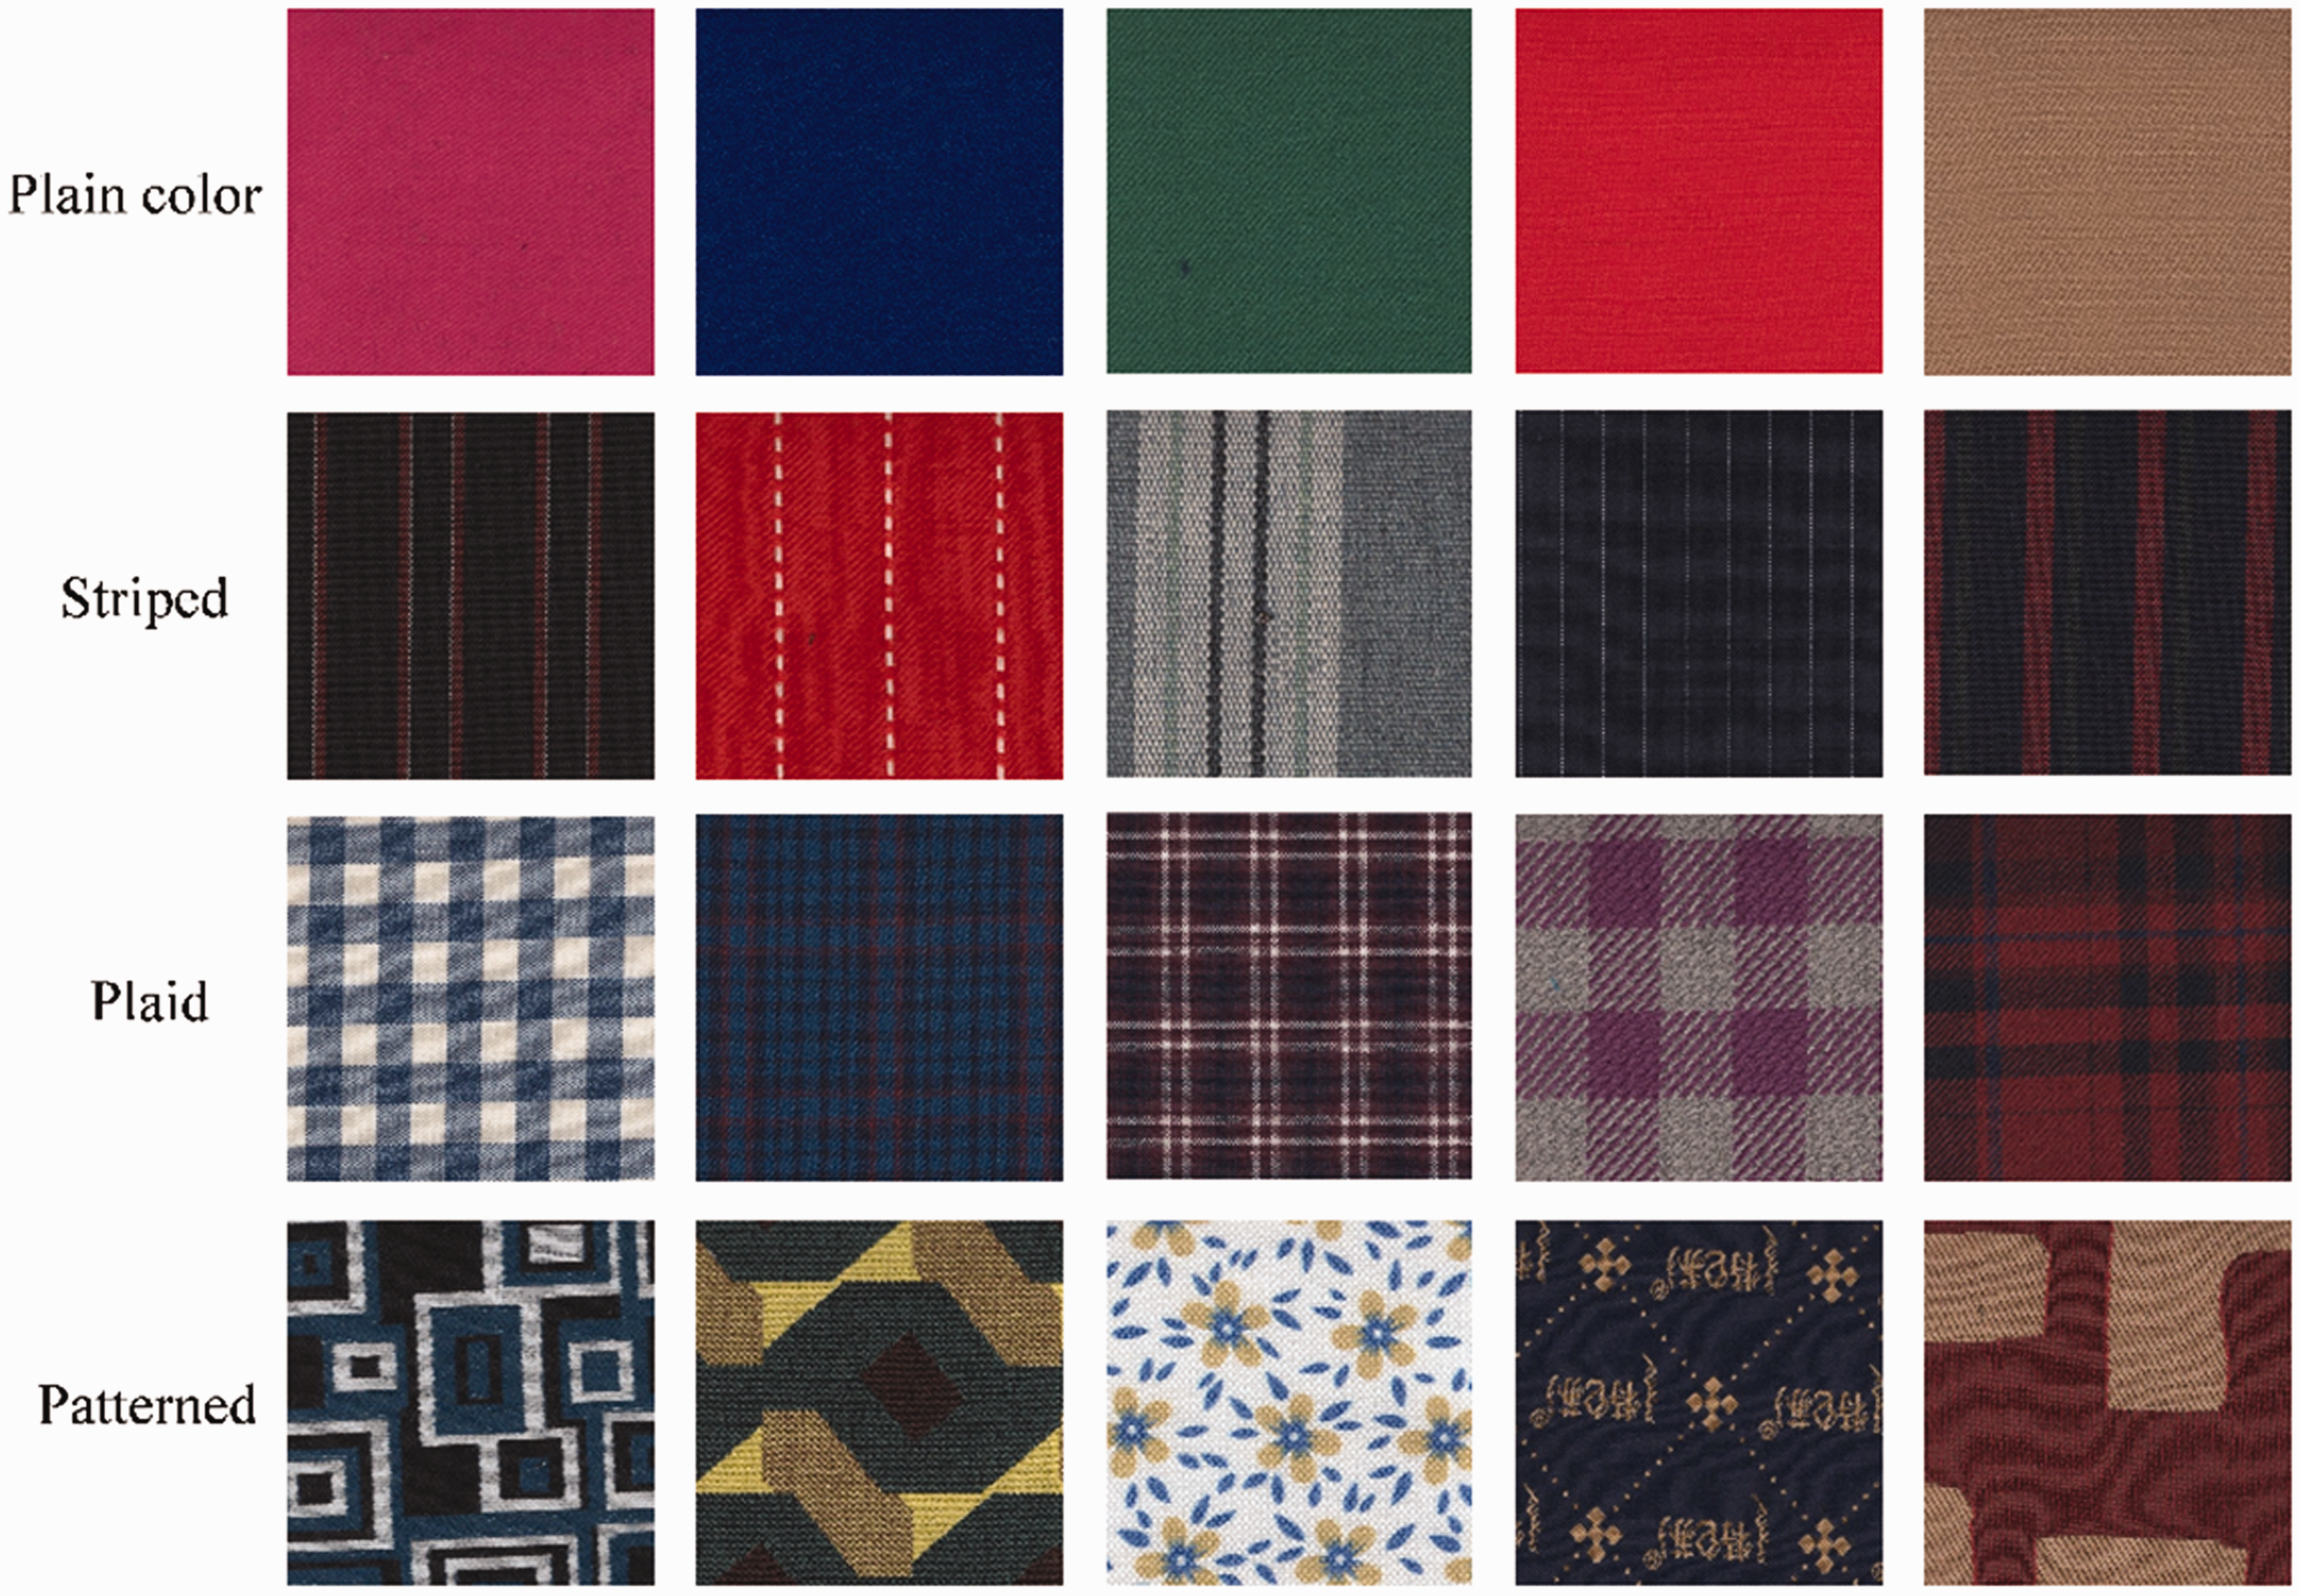
As shown in Figure 7, the retrieval interface was built using the MATLAB GUI and the top-eight images were shown as the final results as in Part I. To reduce the irrelevant factors when the experts evaluated the results, the interface background color and the monitor were adjusted under the standard illuminant D65.
25
Then the experiments were conducted in a dark room. There are four main items: retrieval options, comparison methods, elapsed time and retrieval results. Different experiments were performed using different options. Precision and recall
26
were used to evaluate the retrieval performance, as defined in Equations (11) and (12)
7
The image retrieval interface.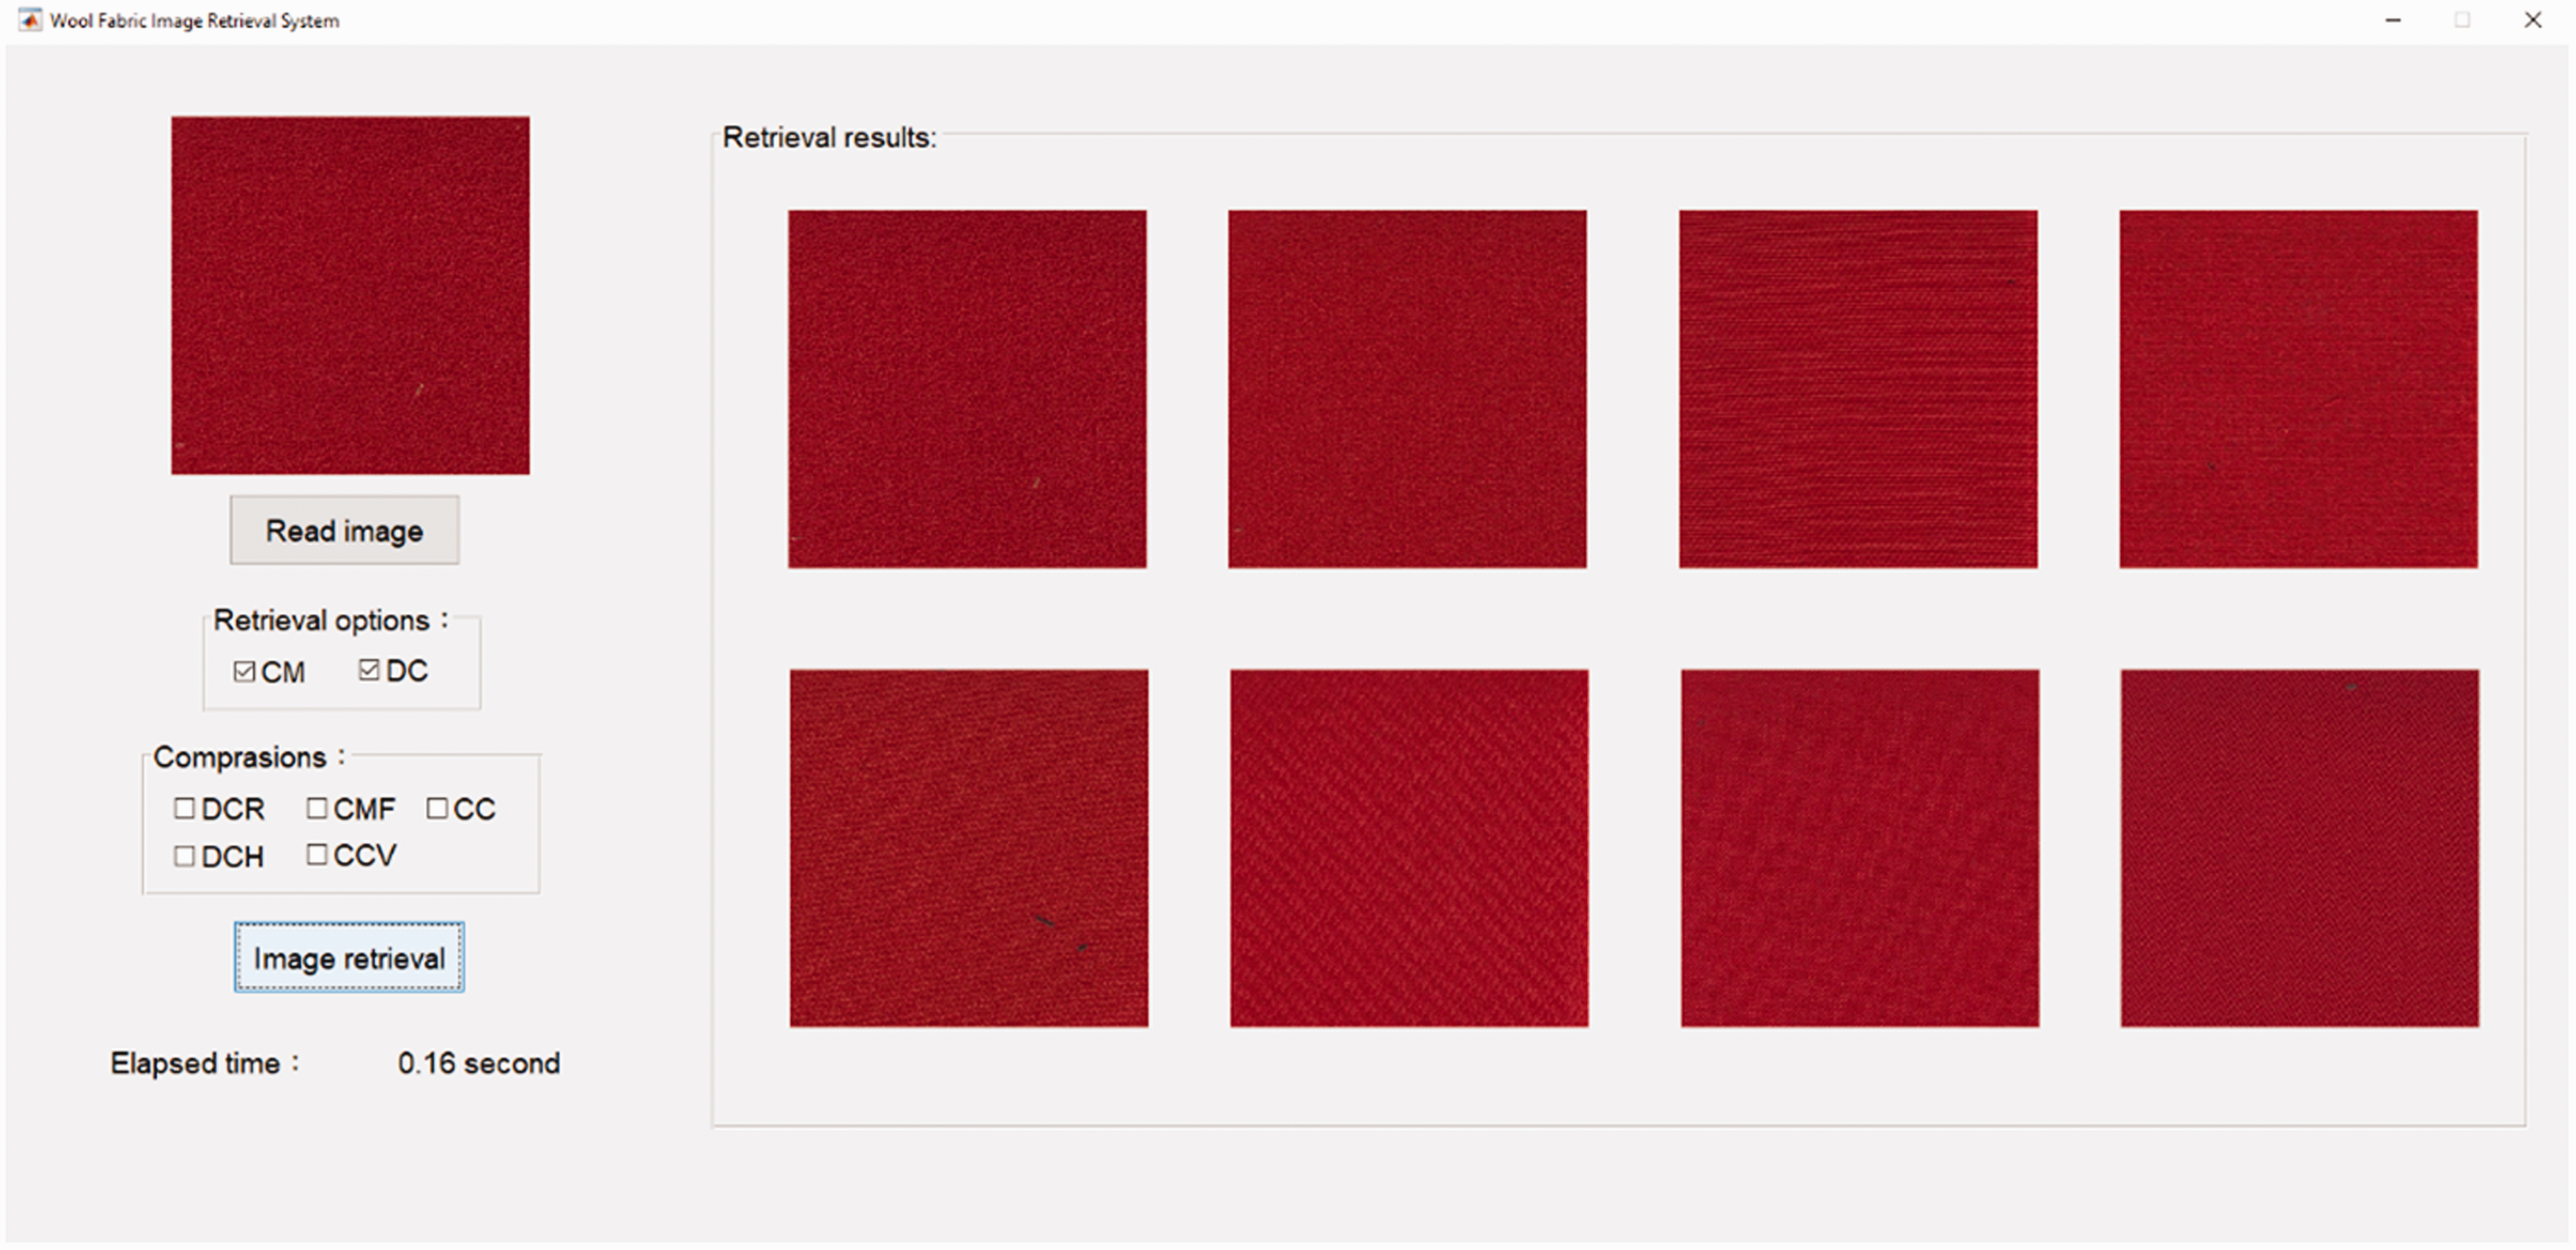


Results and discussion
This section details the performance evaluation of the proposed method. To ensure fair and honest results, 400 images, 100 of each category, were selected as query images for each experiment. The relevant images were selected by the experts in the factory from the returned images. The precision and recall of each query image were calculated based on the relevant images. The average precision and average recall of 400 images were selected to evaluate the retrieval performance.
Parameter optimization
DCs and CMs demand different image qualities, so the compression rates are different. To achieve comprehensive characterization of the color, the image partition method and the T P of DCs were combined with different r for experiments, respectively. Too small an r value leads to poor image quality and too large an r value results in large computational time. Thus, r ranging from 0.3 to 0.9 in 0.1 intervals was selected to perform experiments on CMs and DCs, respectively.
Regarding DCs, threshold T
p
, which determines which color set belongs to the DCs, was set to 6% in a previous study.
24
In this experiment, too large a T
P
value will result in losing color information, especially for striped fabric, while too small a T
P
value will lead to image noises being clustered as one color set. Thus, T
p
was set to 3%, 4%, 5%, 6% and 7% to optimize suitable parameters. Figure 8 gives the retrieval results of different r and T
P
values. As can be seen in Figure 8, in general, the precision decreases with the increase of T
P
, and the precision increases with the increase of r. The performance is best when r = 0.8 and T
P
= 4%, so r and TP were set to 0.8 and 4%, respectively.
Retrieval results of different r and T
P
values.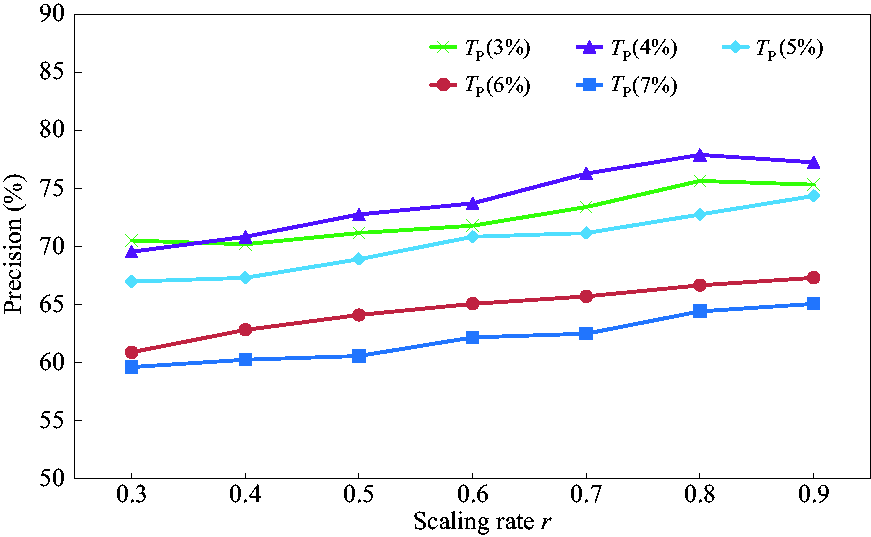
For CMs, the image partition directly influences the description ability of the spatial color information. Through trial tests , it was found that the methods of V2, V3 and M4 increased the differences if identical strips are in different regions. Thus, H2, H3, M2, M3 and A were selected for the experiments. The experimental results are exhibited in Figure 9. When r > 0.5, precision tends to be stable, and the performance of 0.5 is the best. The elapsed times of 0.5 and 0.8 are 0.07 and 0.12 seconds, respectively. Considering a further increase of images in the database, r was set to 0.5 to reduce the computational time. Besides, the performance of H2 is the highest, so 0.5 and H2 were selected to extract CMs.
Retrieval results of different compression rates.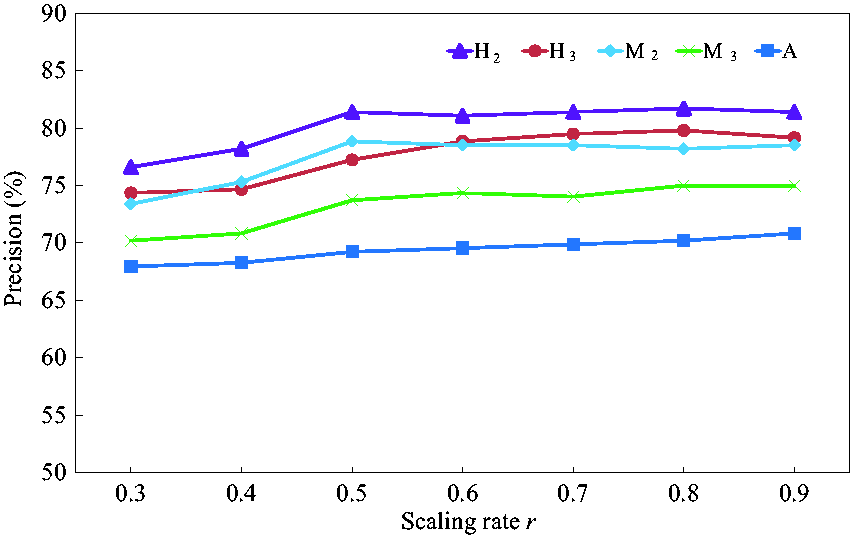
Experimental retrieval results
The experiments were carried out based on the proposed scheme. For qualitative analysis, Figure 10 presents the representative retrieval results of different kinds of wool fabrics. The ranked top-eight images retrieved by the system are presented in the pictures from 1 to 8. Intuitively, this retrieval system can retrieve the images with the same or similar colors. Moreover, the similar images are in the same category as the query image. Retrieving wool fabrics with the same or similar colors in the factory aims at overcoming difficulties in fabric retrieval, so the color is the first assessment standard. In Figure 10(c), the fifth image is the patterned fabric, and is not the same type as the query image. However, the colors are similar to the query image, which is also essential for a fabric color retrieval system.
Retrieval results of different types of wool fabric: (a) plain colored; (b) striped; (c) plaid; (d) plaid and (e) patterned.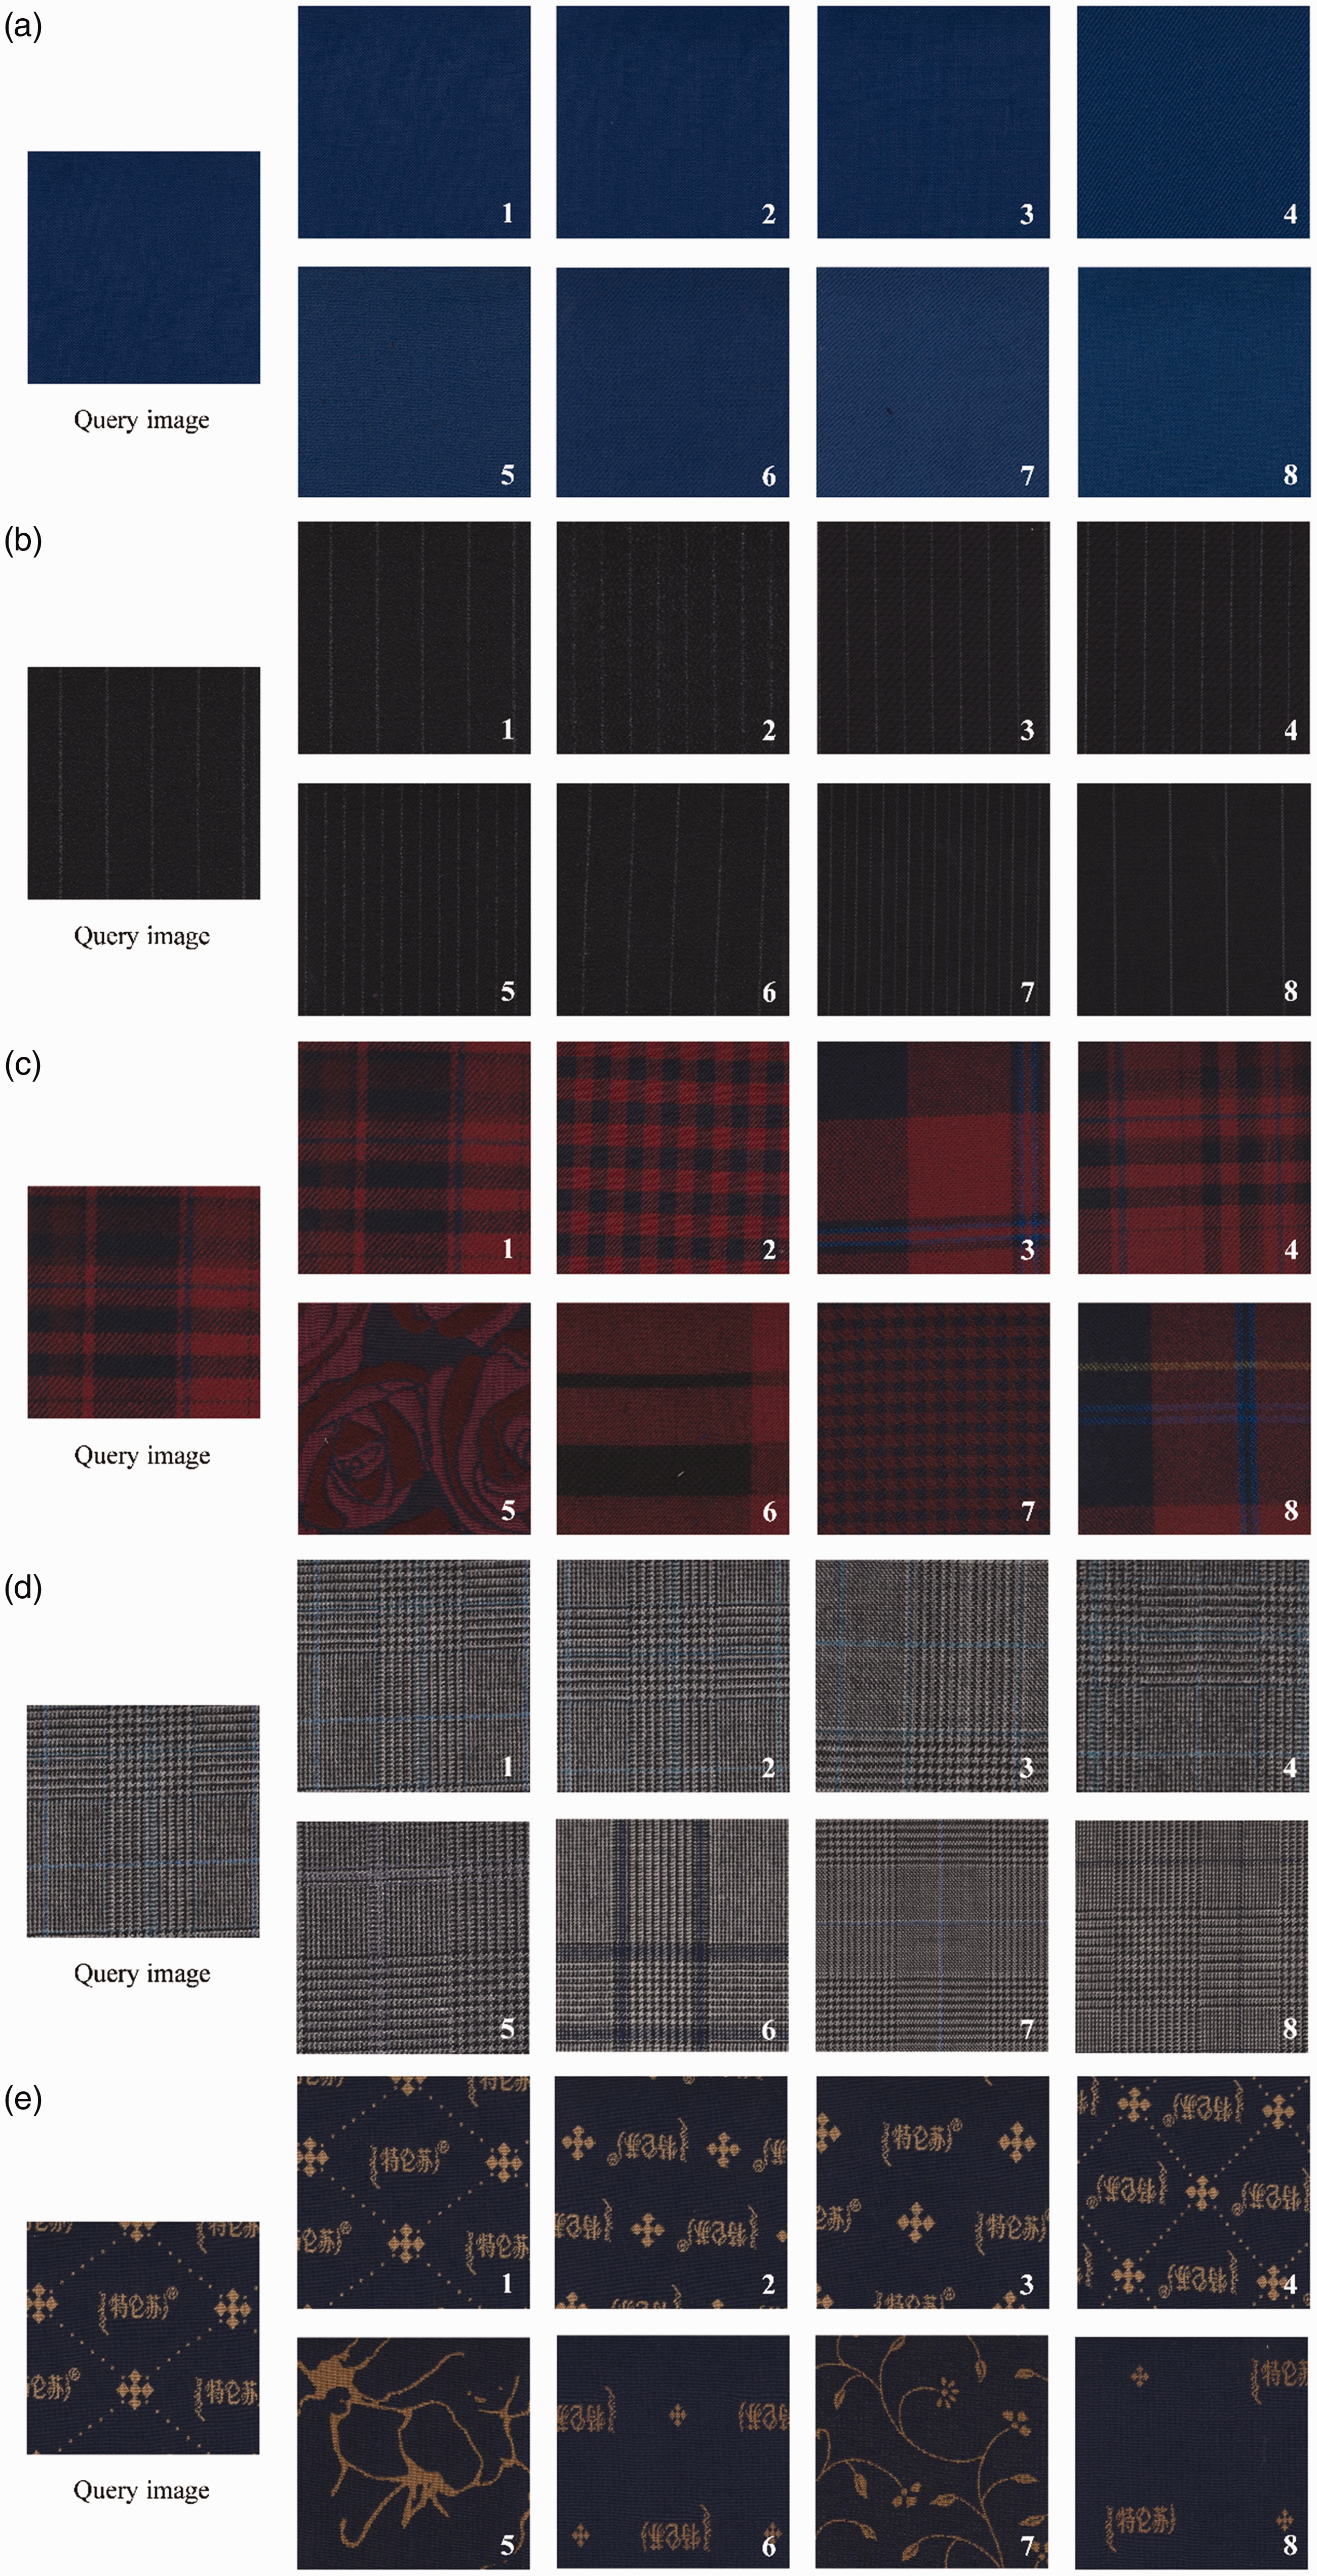
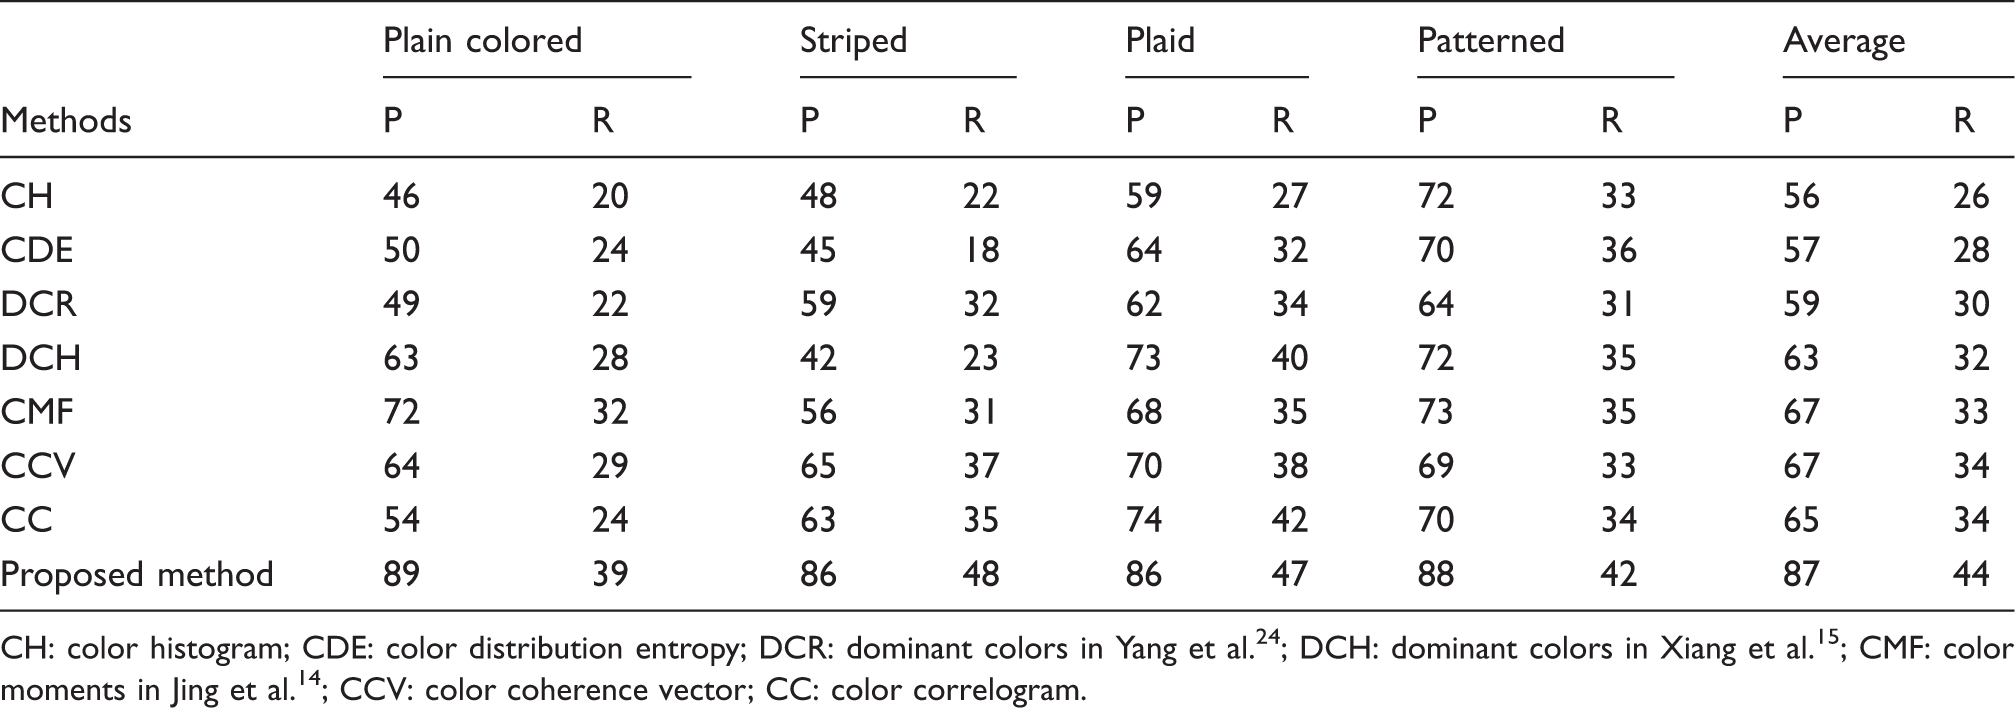
Retrieval results of different methods (unit: %)
Through analysis, the average precision and recall were dragged down by some fabrics with indistinct embedded lines. As shown in Figure 11, (a) and (c) are considered to be similar plaid fabrics, which have embedded lines of a similar color, and (b) is a plain colored fabric with the same texture as that of (a). However, the similarity between (a) and (c) calculated by the proposed method is larger than the similarity between (a) and (b). The reason is that even if (a) and (b) are different because of the embedded lines, the color of the embedded lines in (a) is close to that of the entire fabric color, and also similar to the colors in (b). Furthermore, the embedded lines commonly occupy quite a low percentage in the image. However, when the embedded lines are clear, the results are still satisfactory, as shown in Figures 10(b) and (d).
Similar fabrics: (a) plaid fabric; (b) plain colored fabric and (c) similar fabric to that in (a).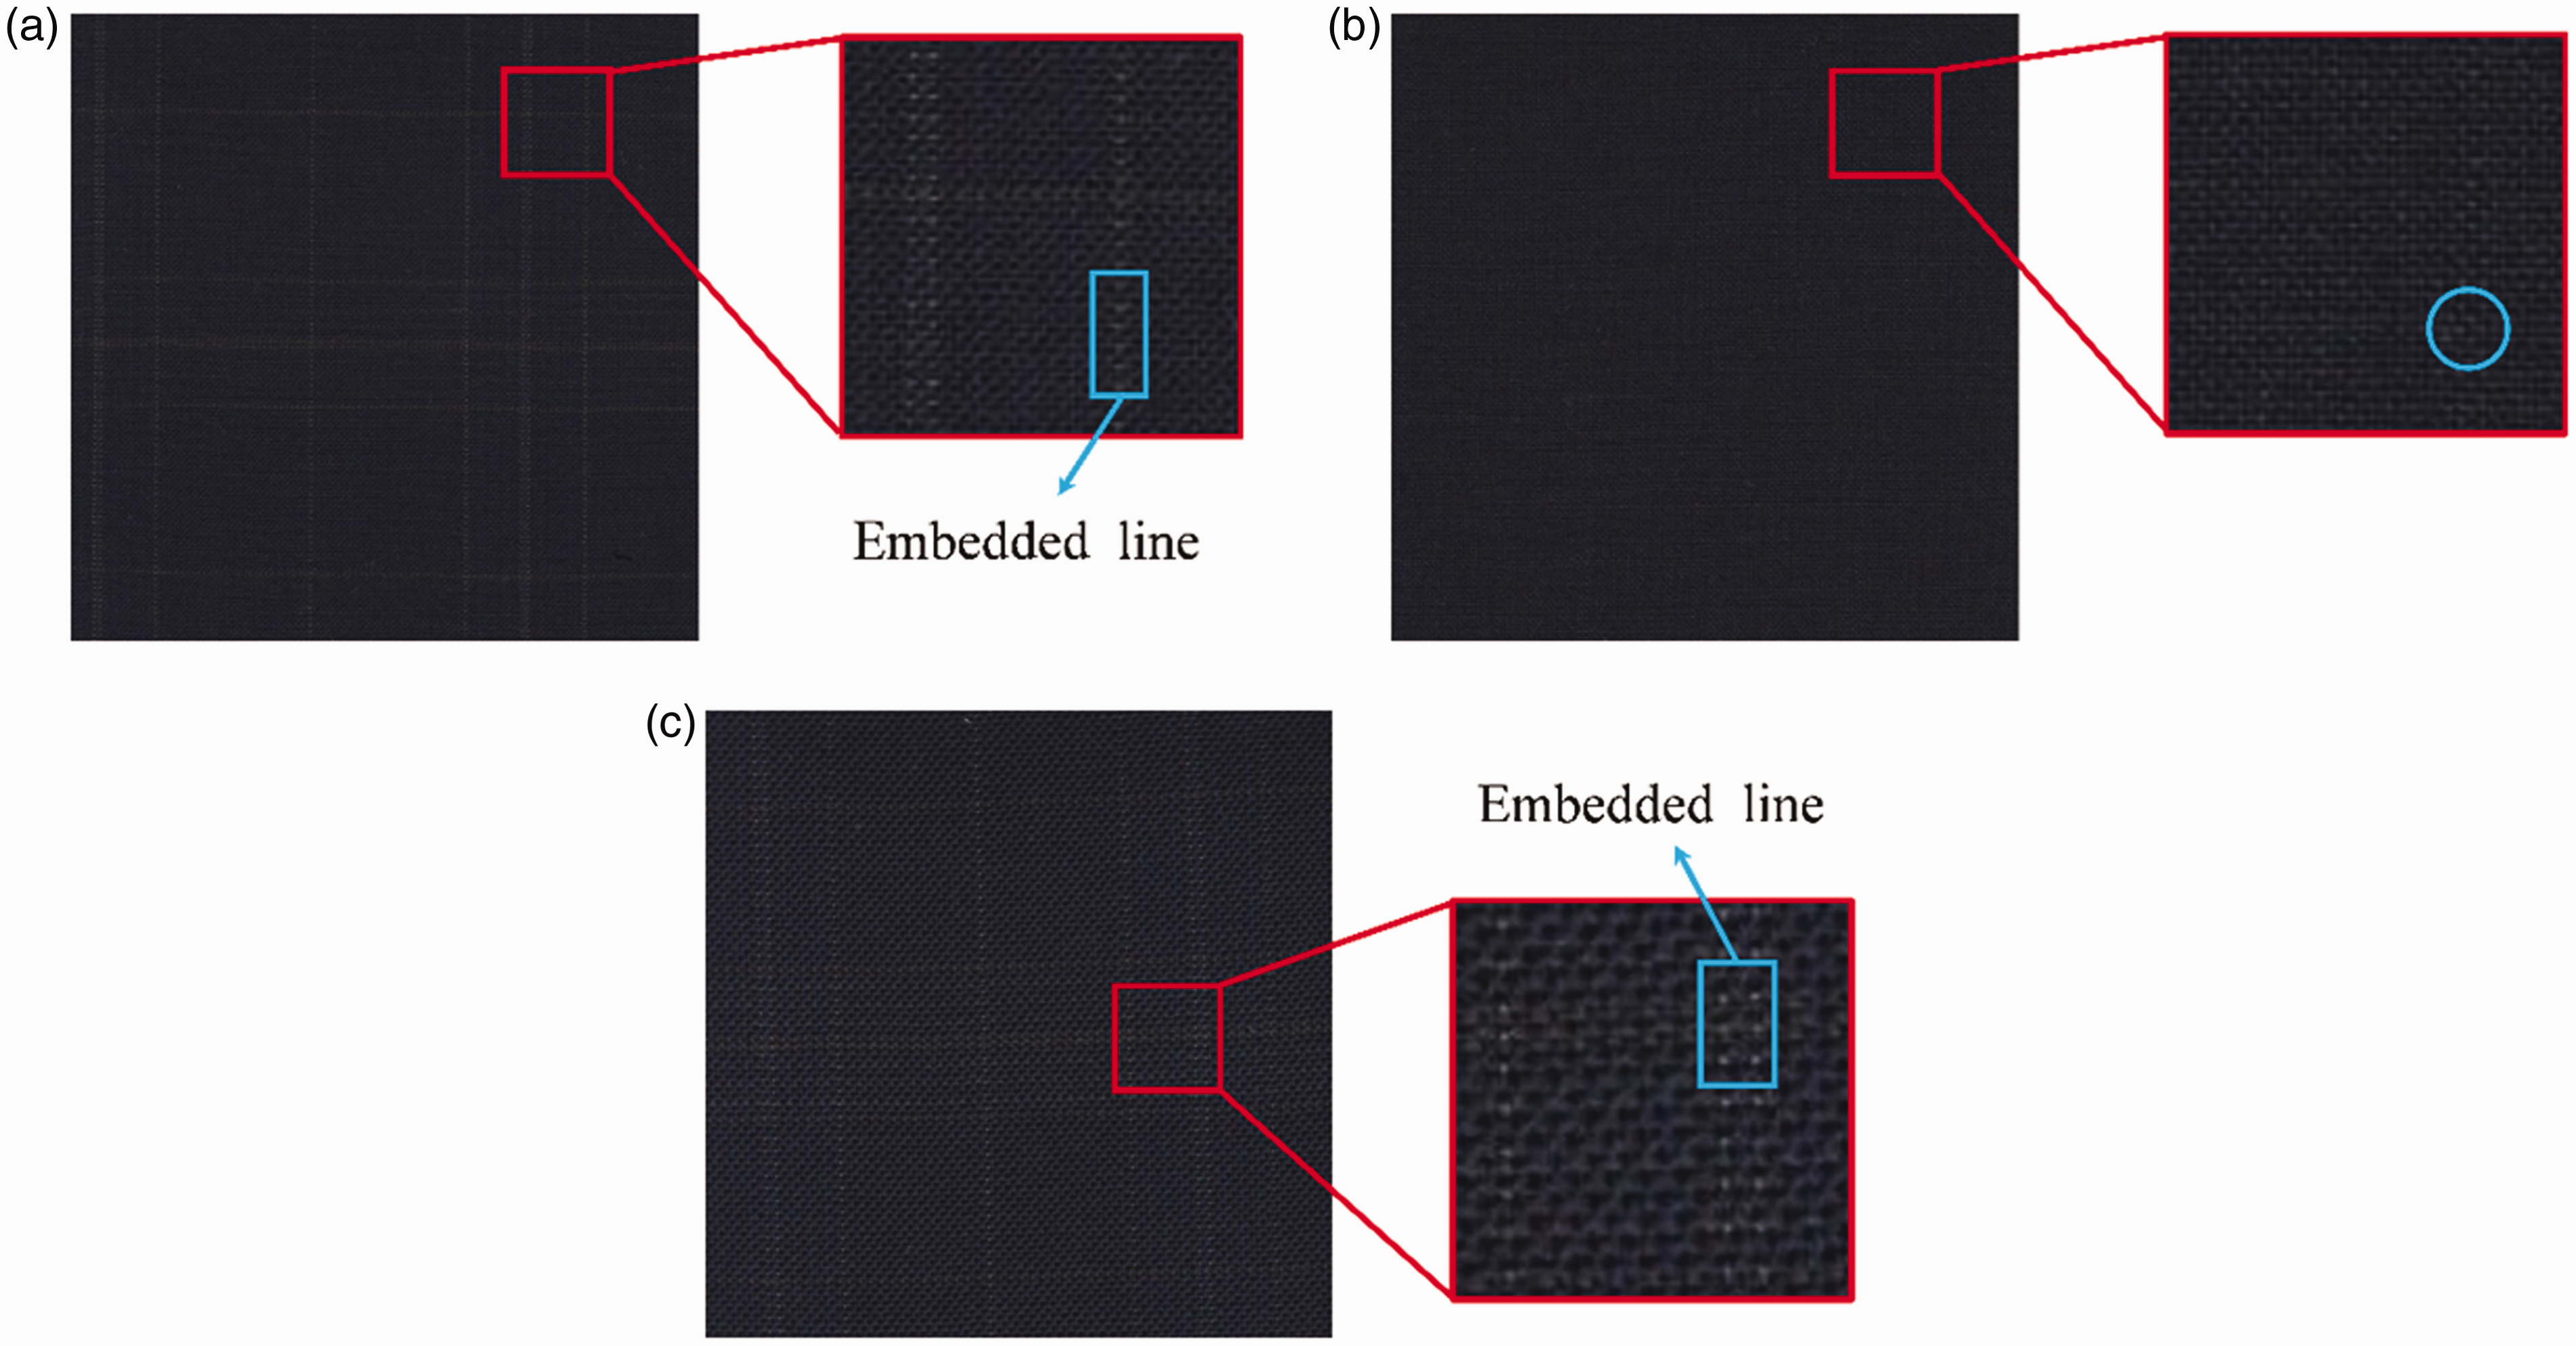
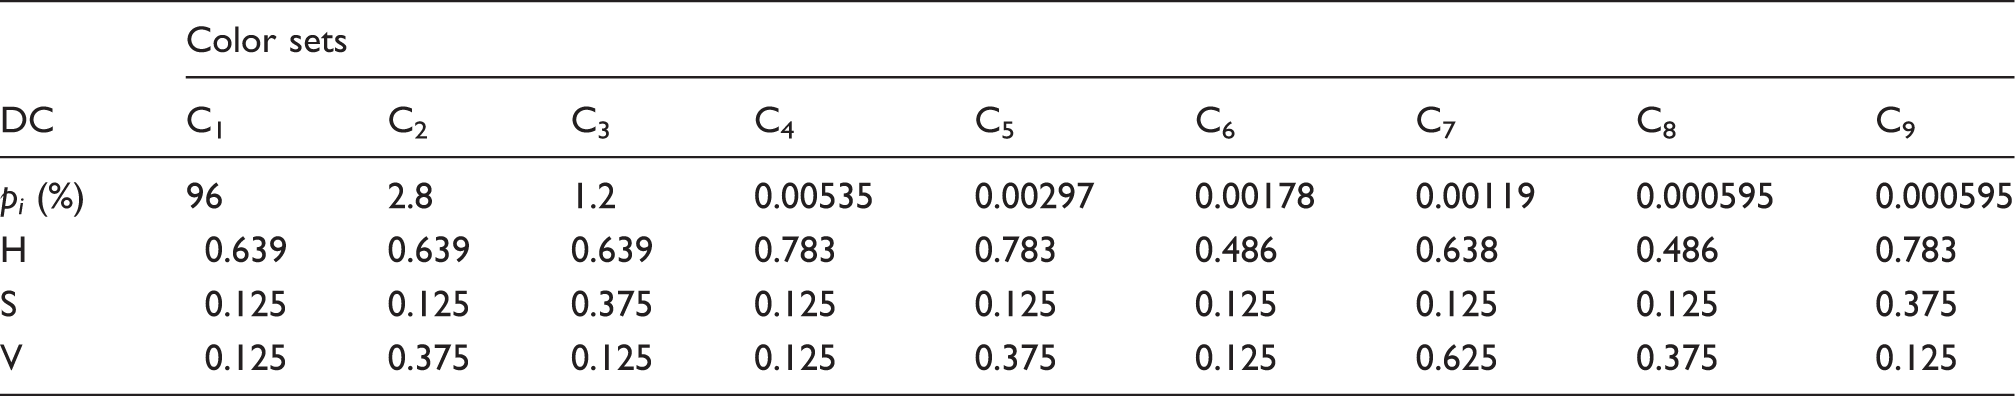
Details of dominant colors (DCs) after quantization
Through experiments, the multiple image partition method can not only distinguish different types of fabrics, but it also increases the differences between the same or similar fabrics. This is because the wool fabric retrieval focuses on the whole surface, unlike the object retrieval,
27
which focuses on the object in different positions of the image. To demonstrate the drawback of multiple image partitions, Figure 12(a) gives three divided images when d = 5, where (a1) and (a2) are similar images and (a1) and (a3) are quite different images. To demonstrate the differences, Figure 12(b) gives the distances of each CM calculated by Euclidean distance. There are a total of 225 CM values, including three comments in three channels in 25 regions. As shown in Figure 12(b), the distances for some values of CM between (a1) and (a2) is much larger than the distances between (a1) and (a3), resulting in a larger final Euclidean distance. The analysis proved that the multiple image partition method increased the differences between similar images.
Color moment distances of multiple image partition when d = 5: (a) similar images and (b) distances.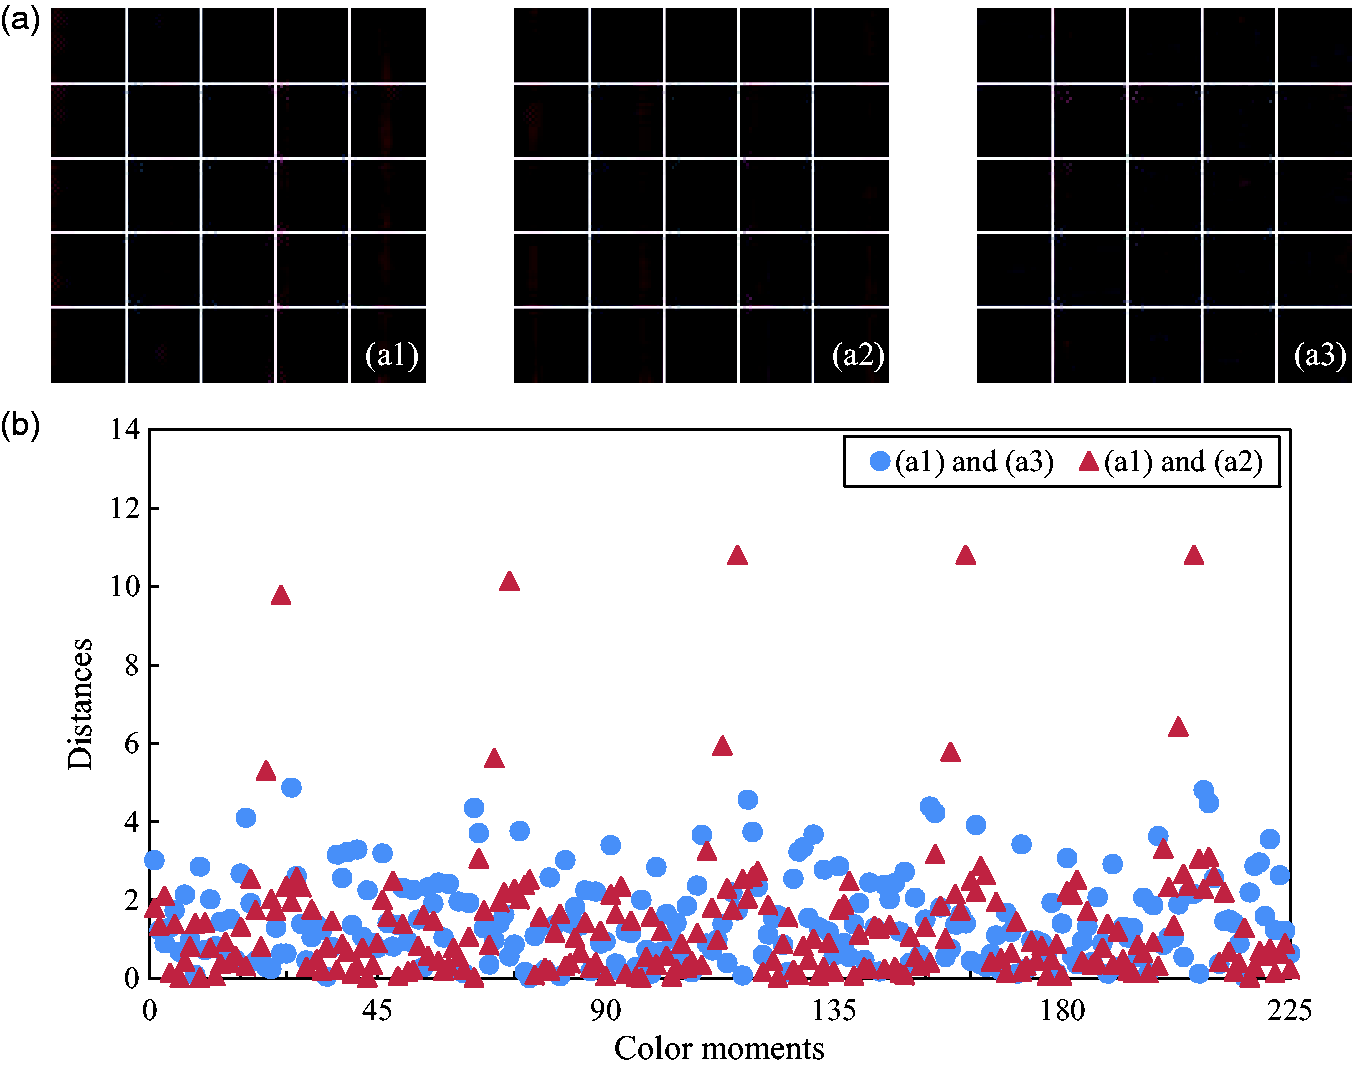
Comparison results
To verify the superiority of the proposed method, different color feature extraction methods in previous studies were performed for comparison, including the CH, 4 CDE, 7 DC in Yang et al. 24 (DCR), DC in Xiang et al. 15 (DCH), CM in Jing et al. 14 (CMF), CCV 8 and CC. 9 In Yang et al., 24 DCR was extracted in RGB color space. In Xiang et al., 15 DCH was extracted without merging the non-DCs into the nearest DC sets. For CMF, the fabric image was divided into non non-overlapping sub-images and a descriptor of 12 × 3 floating points was obtained. Table 1 gives the average precision and recall of different methods. Through analysis, CH performed badly except for patterned fabrics due to it being extracted based on local feature regions. DCR performed badly, especially for plain colored fabrics. This method only divided the RGB color space into eight intervals. The close colors in dissimilar plain colored fabrics were quantized into one category, so it cannot distinguish these fabrics. CDE, DCH and CM6 are unsuitable for striped fabric. For CDE, the small isolated color patches were removed in Sun et al., 7 while the colors of embedded lines commonly occupy small percentages. For DCH, the colors whose percentages were less than T p were ignored, but the colors are the stripes, except for noise. For CMF, the CM was calculated based on color distribution, so the striped fabrics are easily influenced by similar plain colored fabrics. CCV performed badly for plain colored fabric and striped fabric due to the similar aggregation of dissimilar colors. CC is unsuitable for plain colored fabric because similar plain colored fabrics also have similar histograms.
Conclusion
In this paper, an effective method based on DCs and CMs was proposed for the image retrieval of wool fabric. The advantages of DCs and CMs were combined based on the product of two features. The results reveal that the average precision and recall are up to 87% and 44%, respectively, and the elapsed time is 0.2 seconds. The proposed scheme can retrieve fabric with the same or similar color quickly, precisely and efficiently, and shows superiority over other color extraction methods. This system can help the factory save a great deal of labor and material resources in sample analysis and fabric retrieval.
However, fabrics with indistinct embedded lines dragged down the average precision. This fabric will be classified in detail, and future efforts will be made to improve the robustness of the proposed method. An optimized method combined the texture feature and the color feature will be proposed for a more robust and higher precision image retrieval system of wool fabric.
Footnotes
Declaration of conflicting interests
The authors declared no potential conflicts of interest with respect to the research, authorship and/or publication of this article.
Funding
The authors disclosed receipt of the following financial support for the research, authorship, and/or publication of this article: Postgraduate Research & Practice Innovation Program of Jiangsu Province (No. KYCX18_1819); the National Natural Science Foundation of China (No. 61976105 and No. 61802152); the Natural Science Foundation of Jiangsu Province (No. BK20180602); the China Postdoctoral Science Foundation Funded Project (No. 2018M640453); the Jiangsu Province Postdoctoral Science Foundation (No. 2018K037B); the Fundamental Research Funds for the Central Universities (No. JUSRP11805).