



Abstract
To evaluate the ability of woven fabrics to drape in a more accurate way, a three-dimensional point cloud of a draped woven fabric was captured via an in-house drape-scanner. A new indicator, total drape angle (TDA), was proposed based on the three-dimensional fabric drape to characterize the ability of a woven fabric to drape. The relationship between TDA and the drape coefficient (DC) was analyzed to validate the performance of TDA. The result indicated that TDA is more stable and representative than the traditional DC in characterizing the ability of a woven fabric to drape. In addition, the drape angle distribution function (DADF) of the triangular mesh was employed to describe fabric drape, as well as to bridge the gap between drape configuration and the warp bending rigidity of woven fabric. The results showed that the correlation coefficient between the real warp bending rigidity value and what was predicted warp based on DADF and fabric weight was 0.952.
The drape of a woven fabric can be regarded as a specific appearance defined by various intrinsic properties. It refers to the 3D deformation of fabrics arising from their weight. Since fabric drape profoundly affects garment appearance, measuring and predicting the behavior of draped fabrics has been one of the fundamental research topics. In terms of finding an efficient, accurate, and reliable method to characterize the drape-ability, many efforts have been made. Adams et al. 1 found that fabric bending rigidity was the primary factor affecting the ability of woven fabrics to drape. Bending length was employed to evaluate the ability of woven fabrics to drape. However, measuring drape based on the cantilever principle is not an accurate approach, since fabric drape is a general reflection of the mechanical properties of a fabric. To evaluate drape in a general and objective way, Chu et al. 2 developed a drape meter based on photoelectric projection. They proposed the theory that the woven fabric could be put on a given disk or cube to test the drape-ability. This idea of projection inspired Cusick 3 who proposed the umbrella method and the corresponding drape coefficient (DC) to evaluate the ability of woven fabrics to drape. With the development of photography and image processing, more research on this topic was carried out using the Cusick Drape Meter. This method involves the use of a camera and a beam of parallel light to capture the projection of the draped fabric. Software was used to process the projected image. The limitation of this method was that the cameras only captured the top view of the fabric drape. In practice, the drape profile from other viewing angles is also of importance. Therefore, researchers attempted to test fabric drape using a three-dimensional (3D) surface reconstruction method. Shi et al. 4 developed a 3D scanning system that can capture the 3D point cloud of fabric drapes without switching the background or post-process. Mah et al. 5 captured 3D images of fabric drape through 3D body scanning, and studied the air gaps and the distribution between the outside edge of a cylinder. Kim et al. 6 compared two drape test methods, the conventional Cusick Drape Test, and an in-house drape tester that captured an accurate 3D shape of the drape based on a depth camera. Hu et al. 7 proposed a simple, effective method that reconstructs and measure the drapes with a smartphone. The breakthrough of their study lies in the simple approach of obtaining the 3D point cloud of the fabric drape. However, Hu et al. 7 did not conduct further analysis of the 3D point cloud using new indicators. Therefore, currently, even though a 3D point cloud of a fabric drape is easy to obtain, there are no 3D indicator proposed to evaluate fabric drape.
Carrera-Gallissà et al. 8 listed the 36 drape indicators that had been proposed by the Textile Society since 1968. Most of them are extracted from projections of the drape. Only a few indicators refer to depth information involving peak or valley points. The 3D point cloud of a draped fabric contains more information than a 2D projection. Furthermore, many fabrics have the same DCs, but they differ in the contour profile. As for parameterizing the 3D drape models of fabric, Wu et al. 9 used Elliptical Fourier analysis and principle component analysis to cluster different 3D shapes of fabrics. However, their shortcoming is that they use a series of 2D planes to cut the 3D triangular mesh in a virtual environment. In fact, since the 3D boundary of the fabric is not on the same 2D plane, it is difficult to represent complete 3D information for fabric drape using a series of 2D intersection curves. Another problem that should be considered is the variation in fabric drape results. Niwa et al. 10 tested 145 fabrics for use in women’s dresses and 138 fabrics for men’s shirts. The results revealed that the same fabric could possess different DCs under the same experimental condition. Furthermore, the Coefficient of Variation (CV) of various DCs was proportional to the bending hysteresis moment and was inversely proportional to fabric weight. Breen, 11 Jeong, 12 and Lojen et al. 13 verified the variation of fabric drape results in their respective studies. For the variation of fabric drape, Kenkare et al. 14 pointed out that fabric drape is dependent on a large number of variables including fabric properties, the shape of the object over which it drapes, and the environmental conditions. Each of these is in turn dependent on more variables, which exhibit chaotic behavior. Therefore, fabrics do not fall in the same configuration each time they drape.
Considering the variation in fabric drape results and the limitation of 2D indicators of fabric drape, in this study, we initially proposed a new indicator to solve this problem. We then proposed the drape angle distribution function (DADF) to describe fabric configuration. DADF was used to predict warp bending rigidity. The comparison between the newly proposed TDA with DC is presented in the following sections. The analysis of distribution function in describing fabric configuration and predicting warp bending rigidity is also described.
Material and methods
Preparing fabric samples
The fabrics were centered on a supporting disk with a radius of 60 mm surrounded by four RGB-Depth cameras. The angle between the two adjacent cameras was 90°. To achieve an accurate scanning result, a T-shaped checkerboard shown in Figure 1a was used to calibrate the extrinsic parameters for the four cameras based on the algorithm proposed by Zhang et al.
15
and Wu et al.
16
The scanning device is shown in Figure 1b.
Scanning fabric drape workflow: (a) calibration, (b) scanning, (c) four patches, (d) completed 3D points cloud, and (e) 3D triangulated mesh.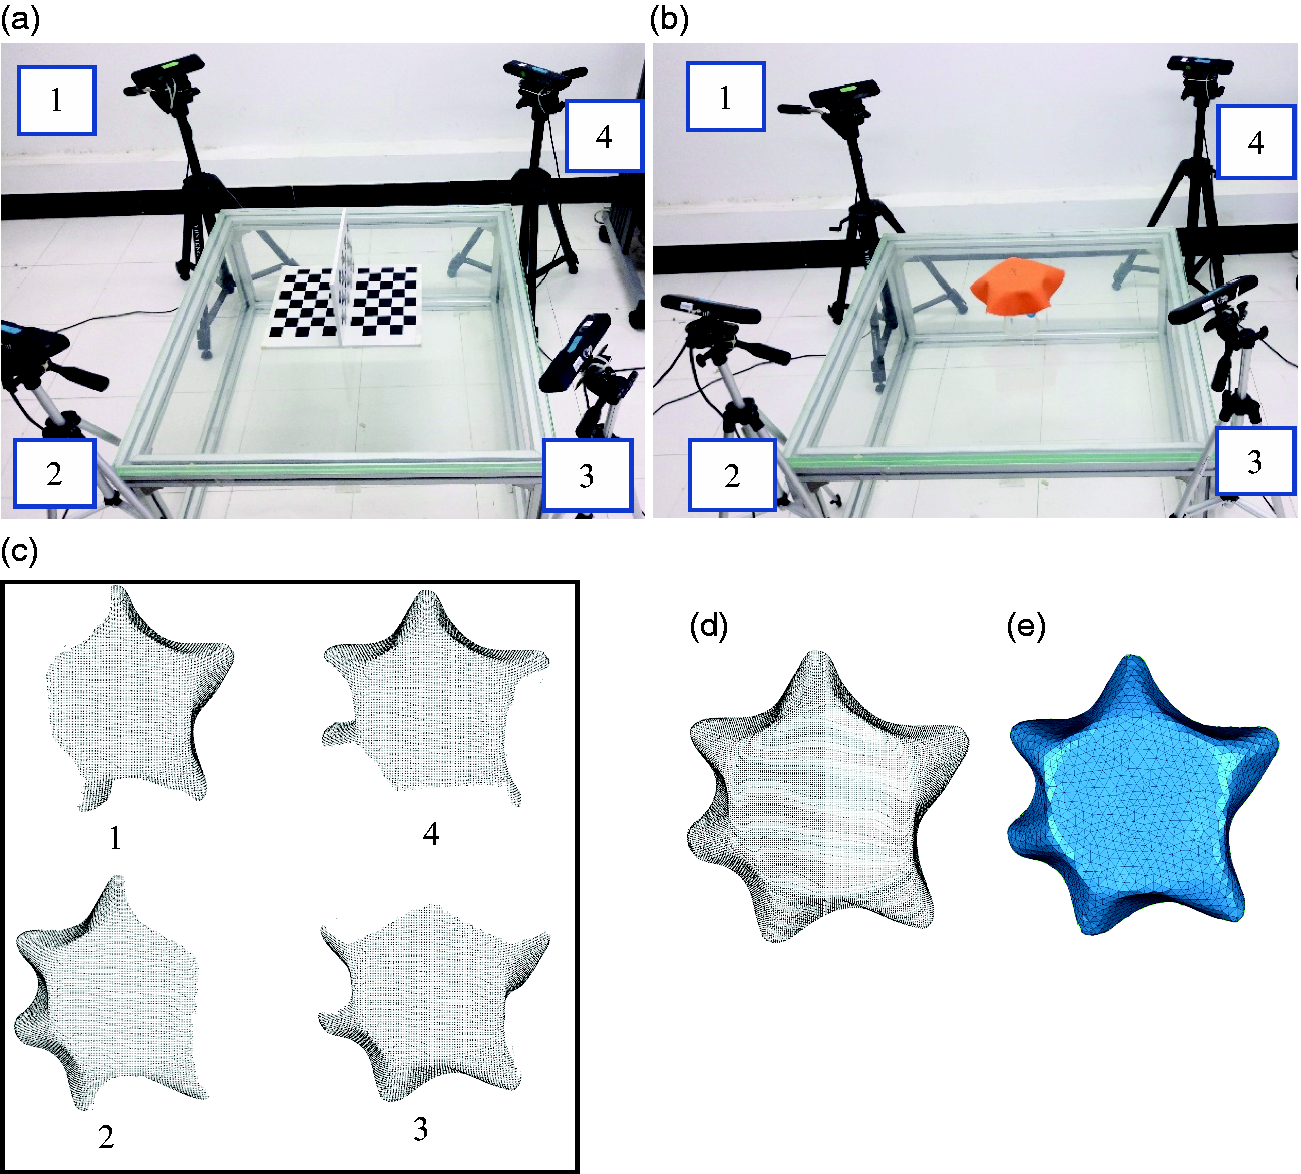
Figure 1c illustrates the four point-cloud patches of the draped fabric captured by each camera. These were fused to generate a complete point cloud, as shown in Figure 1d. The corresponding triangulated mesh was generated after surface reconstruction, as shown in Figure 1e.
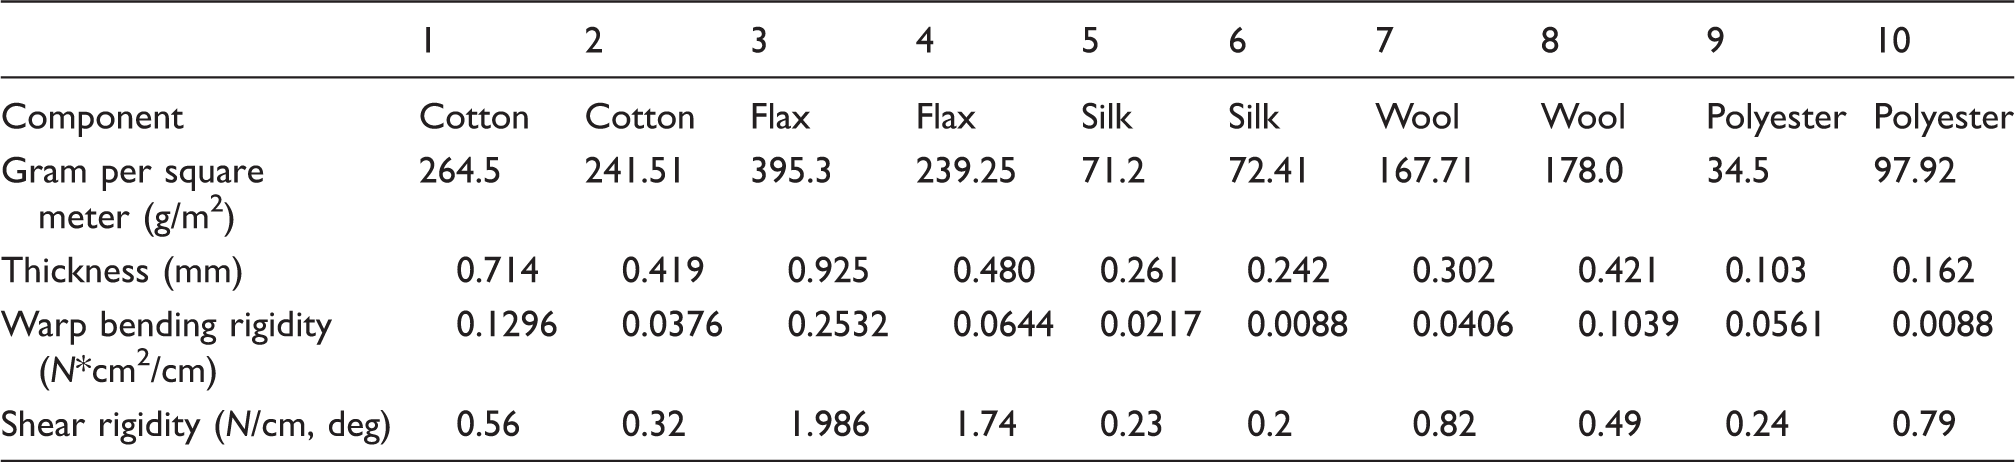
Fifty-one commercial fabrics were purchased from the Chinese market. All 51 fabric samples were ironed to remove wrinkles before conditioning under constant temperature and humidity (temperature: 23 ± 2℃, humidity: 65% ± 2%) for 48 h. Circular specimens of radius 120 mm were cut from each fabric. To propose a new indicator to evaluate the ability of a woven fabric to drape and verify its superiority, we selected 10 fabrics from the 51 samples. The sample selection method involved dividing all the fabrics into five categories according to the type of fiber (cotton, hemp, silk, wool, and synthetic fibers). Two representative fabrics were then selected from each cluster.
The specifications of the 10 selected fabric samples
In order to demonstrate that a neural network can correlate the fabric drape morphology with the warp bending rigidity of the fabric, all 51 fabrics were separately scanned three times under the same experimental conditions. This was done because fabric weight would be introduced in the subsequent stage (as part of the input vector feature of the neural network). Although multiple 3D point clouds can be acquired by scanning the fabric several times under the same experimental conditions, these point clouds have the same weight. Therefore, when training the neural network, a large number of samples with the same weight would result in over-fitting of the neural network. However, if the number of training samples is small, it is difficult for the network to extract the correlation between fabric drape morphology and the warp bending rigidity of the fabric.
Drape angle (α) and total drape angle
Once the triangulated mesh of the fabric is obtained, the geometrical features can be extracted to infer its ability to drape. In this study, a new parameter, TDA, was introduced. The mathematical definition of TDA is given in Equation (1).
Schematic diagram of fabric drape: (a) before draping, (b) after draping.
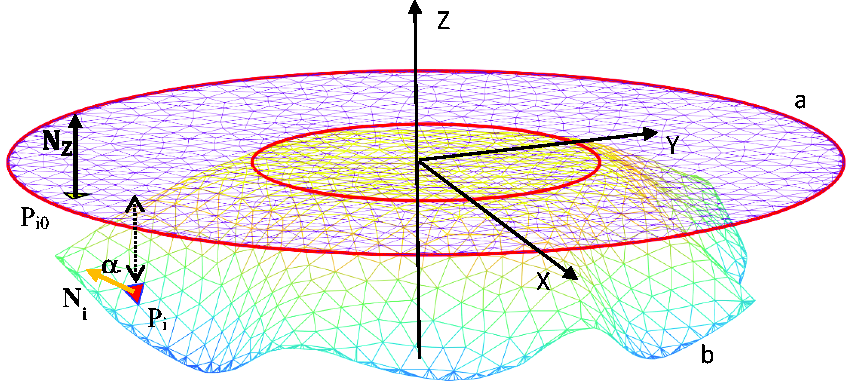
As shown in Figure 2, the triangular mesh surface with a red contour is the fabric before draping, and the one with a blue contour is the mesh following draping. They possess the same triangular topology. The center of the 
Using DADF to describe the morphological features
Although TDA as a scalar (one-dimensional variable) can more accurately evaluate the ability of a woven fabric to drape, it cannot be used directly to express the morphological features among various drapes. However, more useful information could be extracted with the statistical analysis of all drape angles in a triangular mesh. The drape angles of a fabric sample are always within the range of 0–180°. In this study, different drape models were prepared using the same vertex number and triangle topology. Therefore, the problem of drape angles could be treated as a problem of probability. Therefore, we defined a new function, 
Using TDA or DADF to predict warp bending rigidity
An interesting idea would be to use TDA or DADF to predict the mechanical properties of fabrics, which can be regarded as an attempt to establish a non-linear numerical relationship between drape (a morphological feature) and the mechanical properties in an end-to-end manner. To verify this idea, TDA and DADF were used separately to predict the warp bending rigidity of fabrics in this study. If the relationship between TDA or DADF and warp bending rigidity could be ascertained, similar work could be conducted to predict other mechanical properties.
Firstly, for all 51 fabrics, three triangular meshes of each fabric were selected from the scanned models (covered in the section “Preparing fabric samples”). That is to say, 51 fabrics (153 triangular meshes) were used to study the relationship between drape configuration and fabric warp bending rigidity. The warp and weft bending of the fabrics were subsequently tested using the bending tester of the Kawabata evaluation system for fabrics (KES-FB2). The 51 fabrics were split into three. Fourteen of them were selected as testing fabrics (3 × 14 triangular meshes). Thirty-three of them were selected as training fabrics (3 × 33 triangular meshes). The rest were used as validation fabrics (3 × 4 triangular meshes). Two neural networks were constructed as shown in Figure 3.
Structure of the BP neural networks: (a) with TDA as the input, (b) with DADF as the input.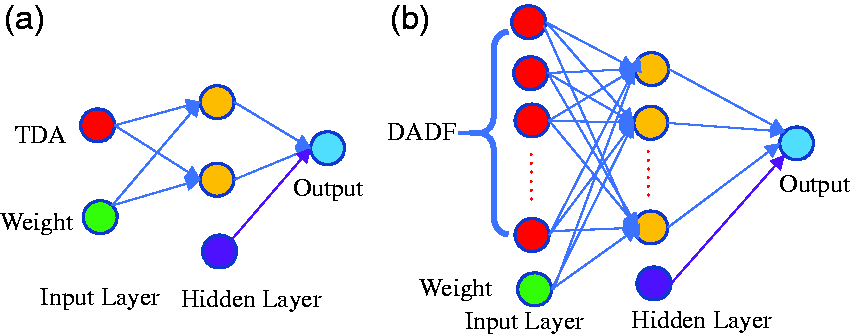
The inputs of Figure 3a are TDA and fabric weight. There is a hidden layer with two neurons and one bias. The output is warp bending rigidity. The inputs of Figure 3b are DADF and fabric weight. There is a hidden layer with six neurons and one bias. Experiments have verified that the lowest validation errors are smallest when six neurons in the hidden layer are specified in the network. Mean-square error was used as the loss function. The non-linear activation was the Sigmoid function. All training and testing were undertaken on a quad-core processor laptop (2.8 GHz and 16 GB RAM).
Results and discussion
The limitation of using DC to evaluate fabric drape performance
Overhead images of the selected 10 fabrics in 10 drape scans are shown in Figure 4. Drape variation is commonly observed in the same fabric under various drape tests, as shown in Figure 4. This means that all 10 fabrics have distinct drape results. The most obvious and objective explanation is the variation in drape nodes. As shown in Figure 4, the drape nodes of Fabric #1 could be 6, 7, or 8. The drape nodes of Fabric #2 could be 6, 7, or 8. The remaining fabrics also have multiple discrete drape nodes.
Overhead view of the selected 10 fabrics across 10 drape scans.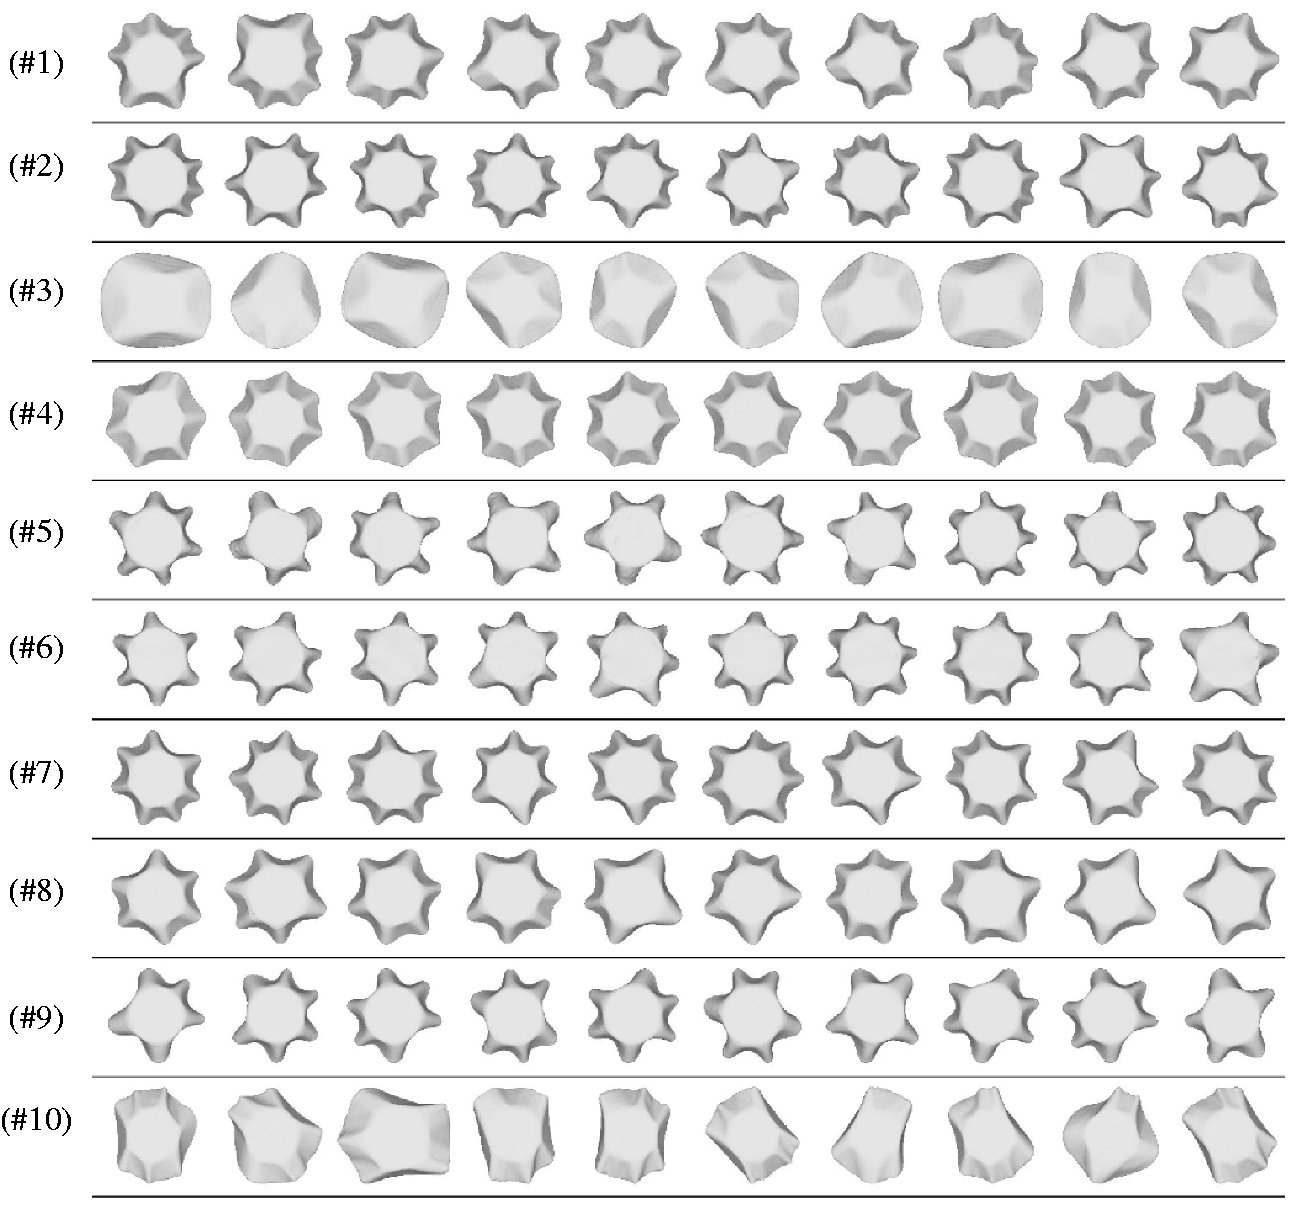
To further investigate the performance of the proposed parameters in explaining this phenomenon, we plotted the fluctuations of TDA and DC respectively, as shown in Figure 5.
Scatter plots of (a) DC and (b) TDA of the 10 fabrics.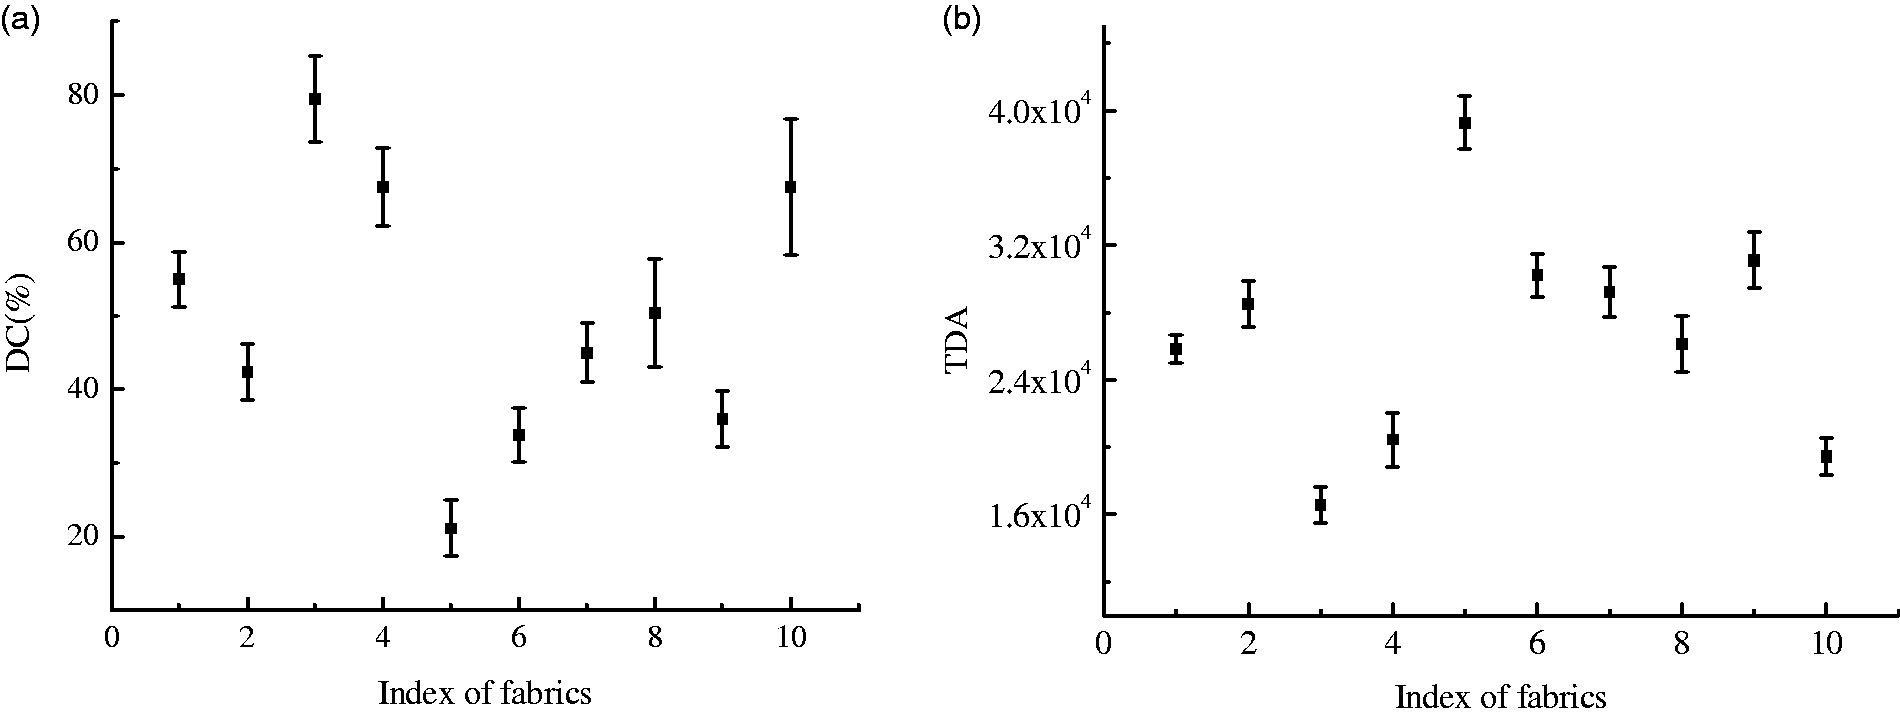
The TDA and DC error bars (shown in Figure 5) TDA DC are not actually errors, they represent the coefficient of variance of the 10 TDAs and DCs, which evaluates the variation range. It was observed that, for the same fabric, the DC variances across 10 drape tests were always greater than that of TDA. This implies that TDA is more reliable in characterizing the ability of a woven fabric to drape than traditional DC. Theoretically, using the projection area to compute DC as an indicator of drape-ability could be problematic when, for example, occlusion occurs in soft fabrics (i.e., Three-dimensional triangle meshes of fabric #3 and #5 with various supporting radiuses: (a) #3, 60 mm, (b) #3, 60 mm, (c) #3, 60 mm, (d) #5, 50 mm, (e) #5, 60 mm, (f) #5, 75 mm.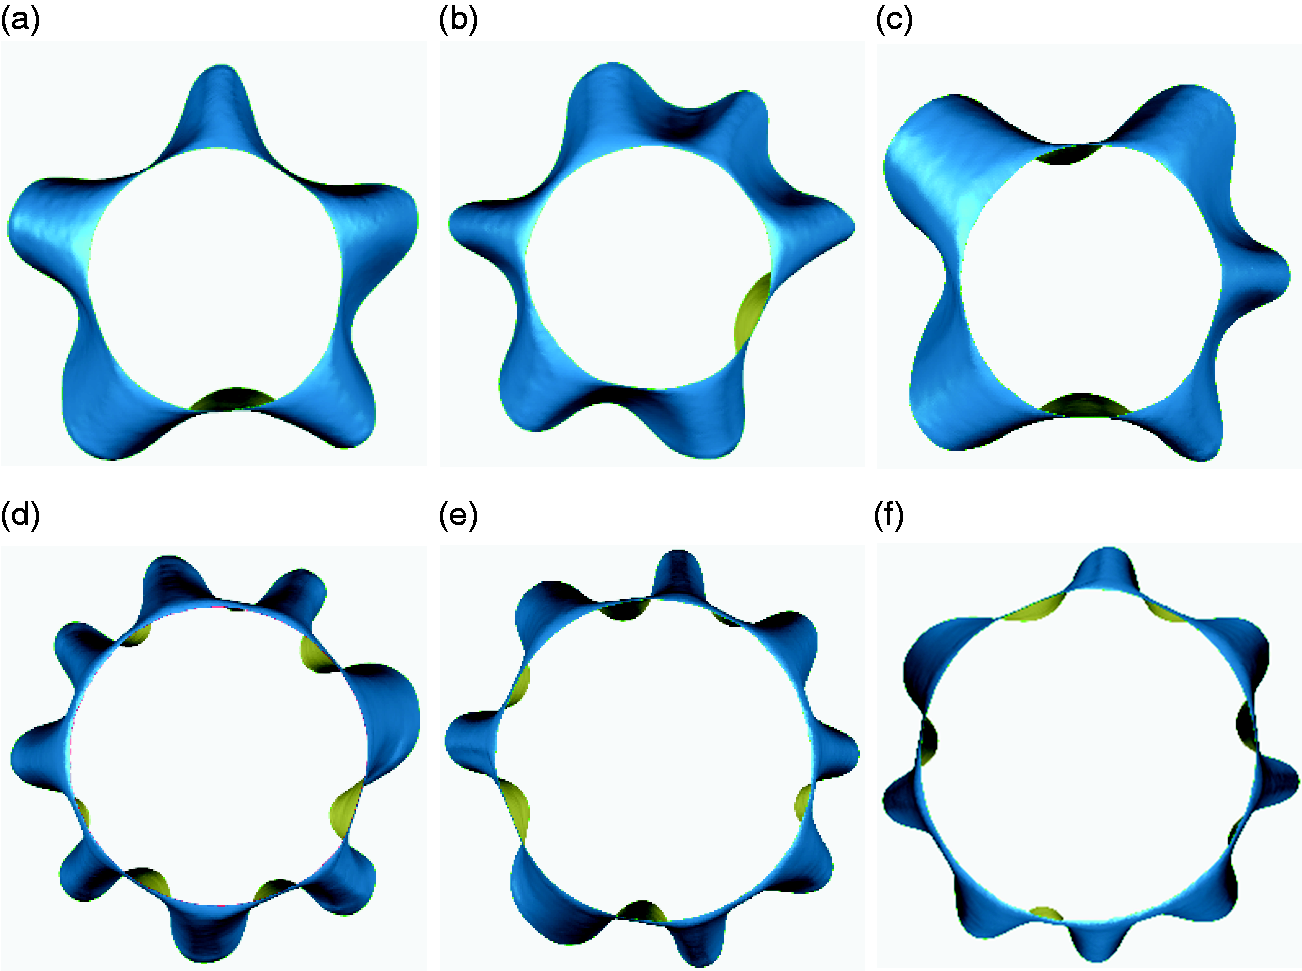
Figures 6a, b, and c are overhead views of Fabric #3 under the same supporting radius. This validates that the occlusions cannot be removed by multiple drape testing. Figures 6d, e, and f are overhead views of Fabric #5 with supporting radiuses of 50 mm, 60 mm, and 75 mm respectively. These results verify that occlusion cannot be removed by enlarging the radius of the supporting disk, since occlusion results from the slippage of yarns and fibers, which can be macroscopically demonstrated as specific mechanical properties. The results also indicate that DC, which depends on computation of the overhead projection area, is not a reliable approach.
However, when using 3D scans to compute drape-ability, occlusion can be tackled since
The effect of the number of triangles on TDA
In characterizing the ability of a continuous fabric sample with discrete triangular meshes to drape, the more 3D triangles, the better the approximation. However, a larger number of 3D triangles would increase the cost of computation. Therefore, the density of 3D triangles should be controlled to some extent. To this end, we also investigated the relationship between TDA and number of triangles. As shown in Figure 7, there is an increase in The relationship between 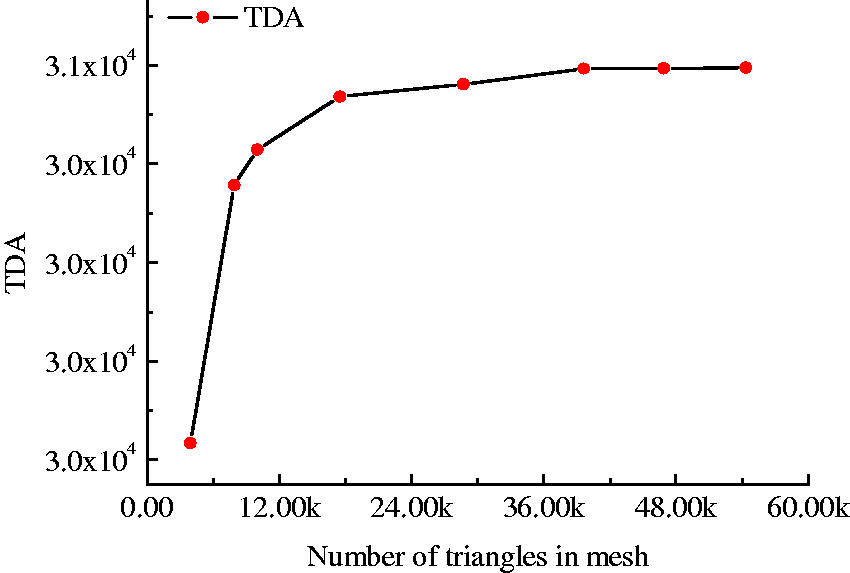
The relationship between TDA, DADF and drape configuration
Figure 8a illustrates two triangular meshes whose TDA are the same, as is their drape angle distribution function. The abscissa of the drape angle distribution function is the specified drape angle. The ordinate of the drape angle distribution function is the distribution function. The curve in blue is the distribution function of Mesh 1. The curve in orange is the distribution function of Mesh 2. The two meshes in Figure 8a have a similar drape-ability (TDA). However, their drape configurations are obviously different. The results in figures 8b and d are similar to Figure 8a. The two Figure 8c meshes are more similar than the meshes in figures 8a, b, or d. Their distributions are also closer than those of the other three graphs. The results demonstrate that DADF outperforms TDA in describing drape configuration.
Fabrics with the same TDA but a different DADF.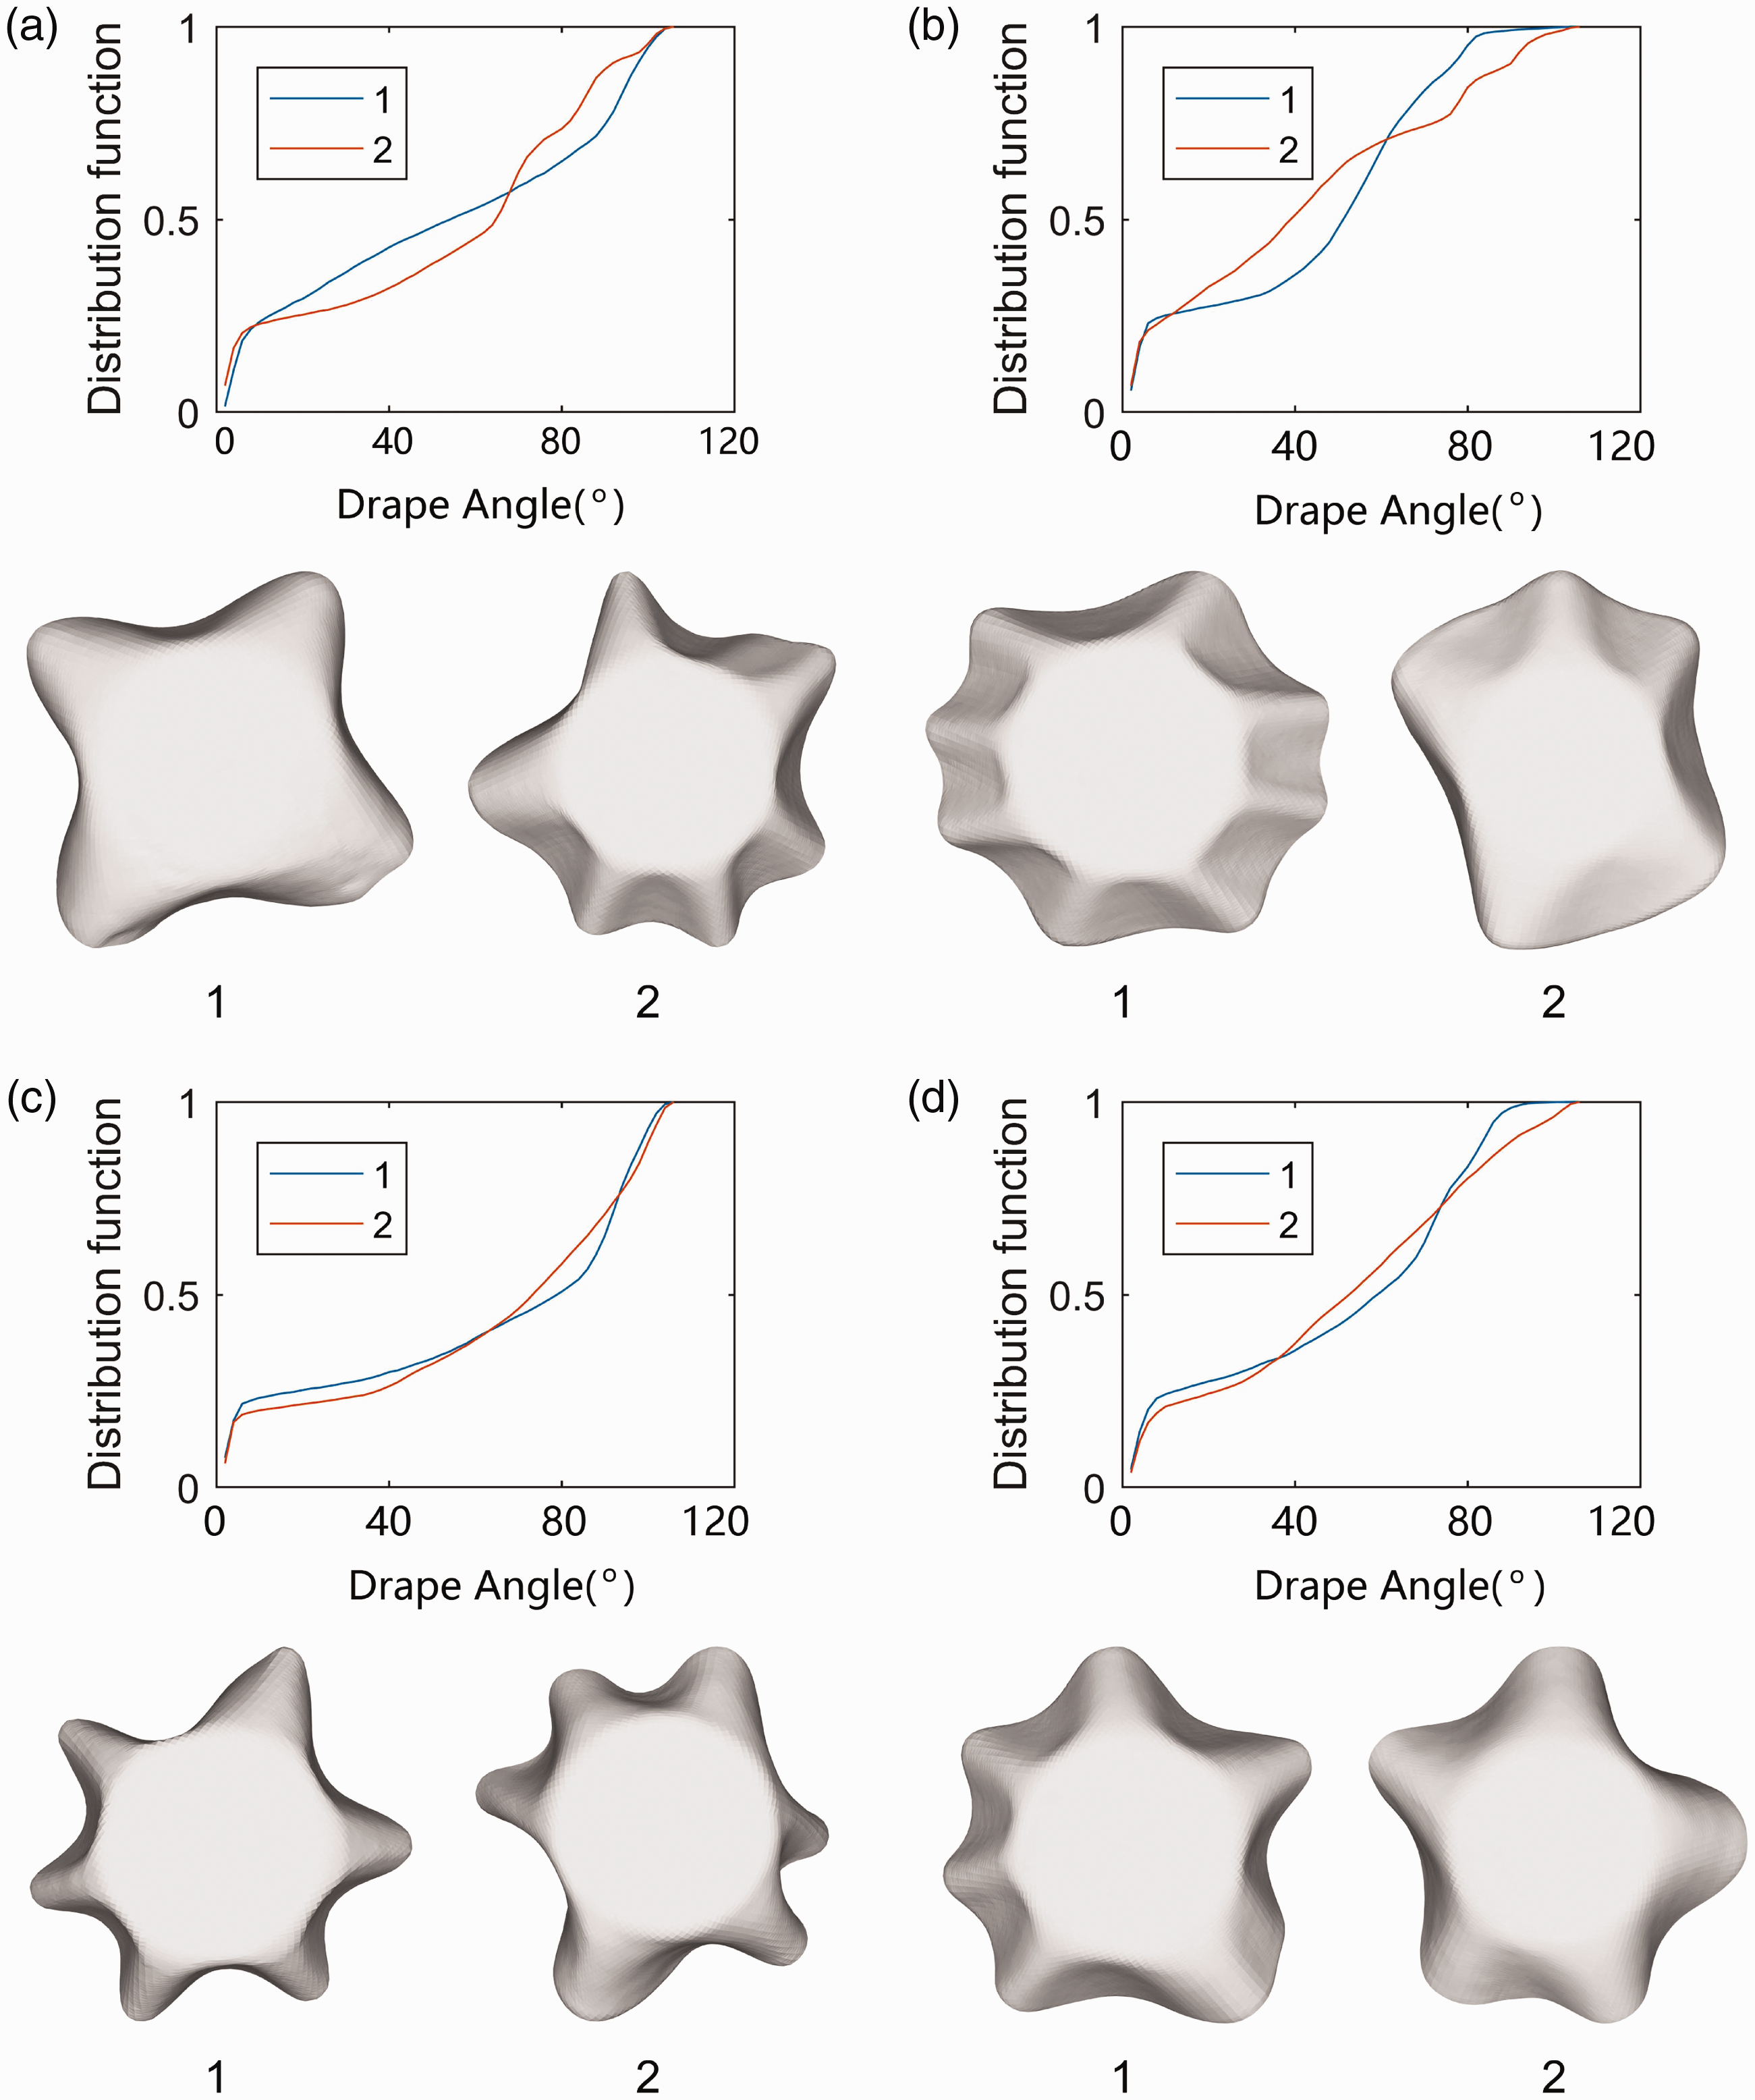
In Figure 9a, the two displayed triangular meshes have similar DADFs. The abscissa of the drape angle distribution function is the specified drape angle. The ordinate is the distribution function. The curve in blue is the distribution function of Mesh 1. The curve in orange is the distribution function of Mesh 2. It is clear that the two triangular meshes in Figure 9a have similar drape configurations. Likewise, the meshes in figures 9b, c, and d have similar drape configurations. These results also confirm that DADF is suitable for comparison of drape configuration.
Fabrics with similar DADF.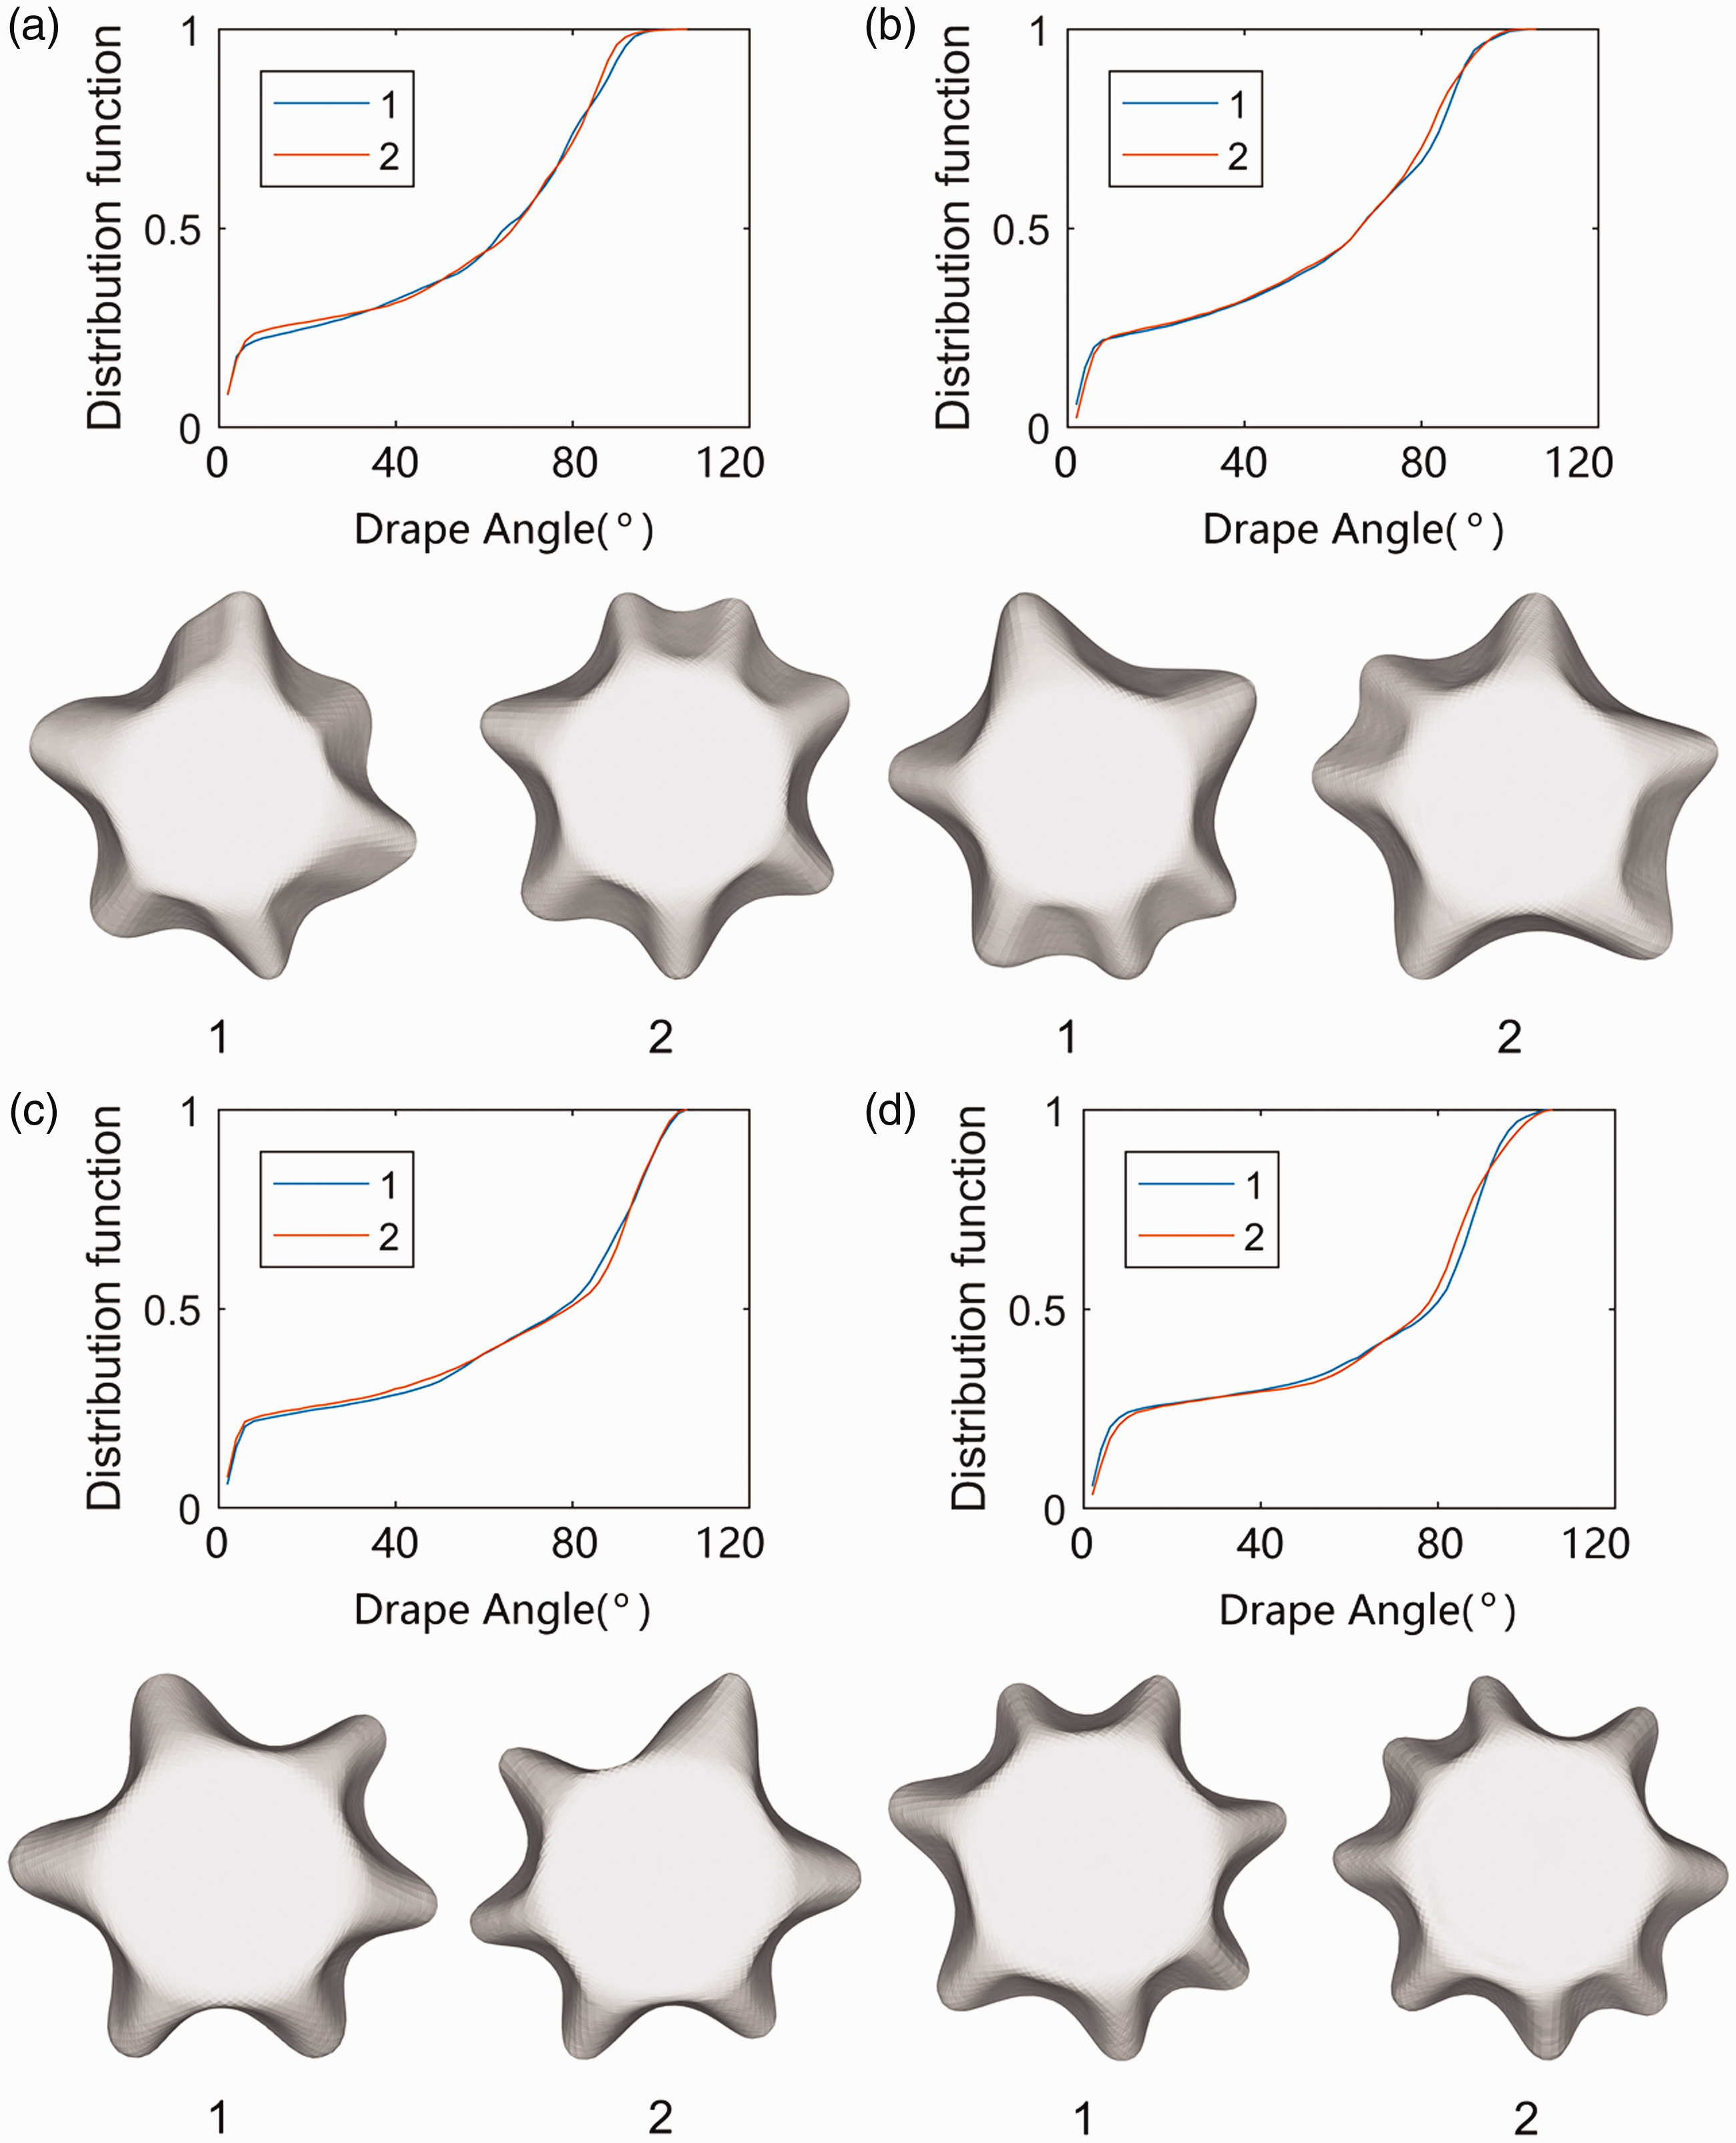
The predicted warp bending rigidity
The predicted warp bending rigidity of 14 test fabrics (42 triangular meshes) is shown in Figure 10, which indicates that most of the predicted warp bending rigidity is close to the ground truth. The mean absolute error of the method based on TDA and fabric weight was 0.0018. The mean absolute error of the method based on DADF and fabric weight was 0.00081. The correlation coefficient between ground truth and predicted warp bending rigidity based on TDA and fabric weight was 0.697. The correlation coefficient between ground truth and predicted warp bending rigidity based on DADF and fabric weight was 0.952. The results demonstrate the superiority of DADF in inferring the warp bending rigidity of fabrics. This is because drape performance is an expression of fabric structure and mechanical properties. TDA is a suitable indicator of the ability of a woven fabric to drape. However, DADF is a vector with a high dimension; more detailed information of fabric drape configuration can therefore be displayed with DADF.
Test results of fabric warp bending rigidity with a neural network.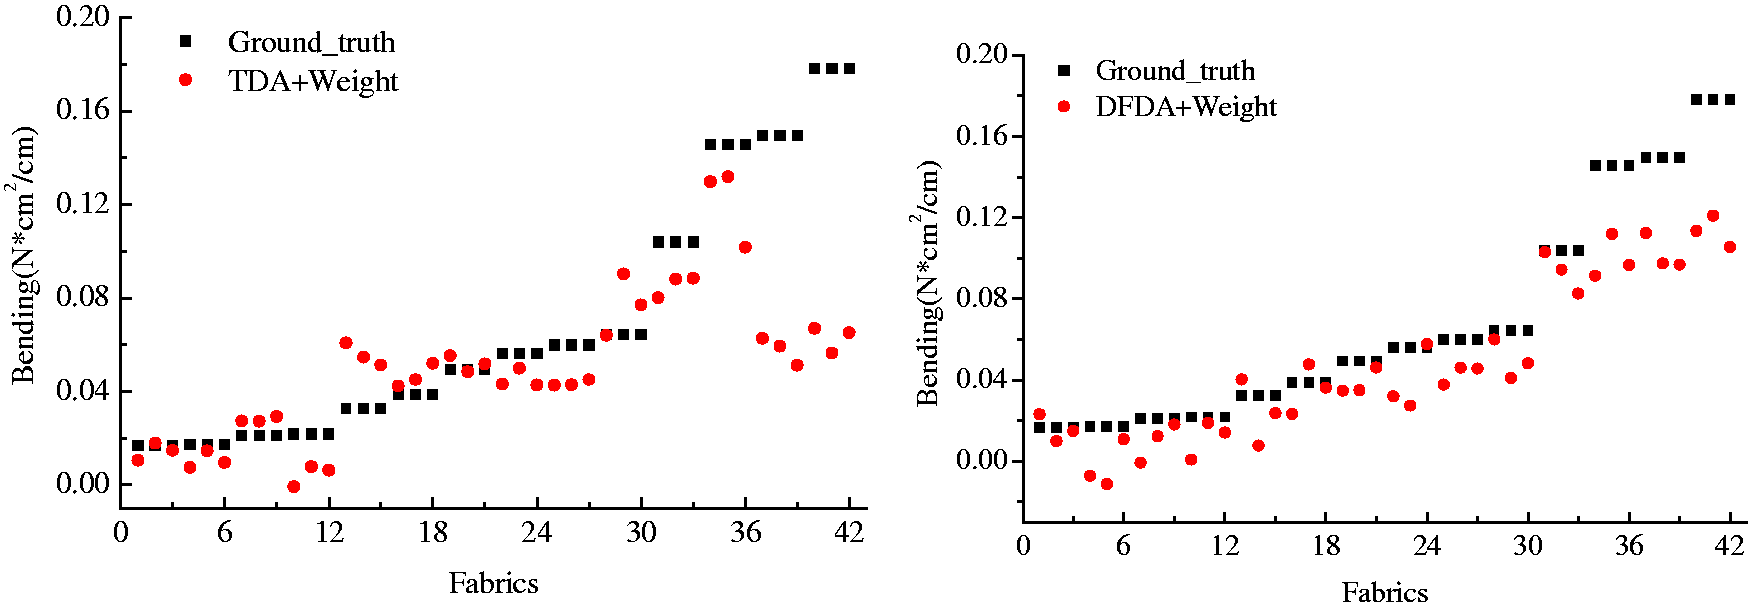
We also predicted the weft bending rigidity of the woven fabrics using the same method; however, as this was not the focus of the current study, the results are not presented here. The reason for the phenomenon may be explained as follows. Fabric drape is a synergistic deformation of a fabric in multiple directions, which is related to the warp and weft properties of the fabric. The density of the warp yarns affects the warp bending rigidity of the fabric. The density of the weft yarns affects the warp bending rigidity of the fabric as well as the weft bending rigidity. In practice, to satisfy various usages, the ratio of the warp- to the weft direction of woven fabric is designed in various methods. That is to say, the correlation between the warp bending rigidity of the fabric and that of the weft (correlation coefficient) is usually low. The correlation between the warp- and weft bending rigidity was 0.532. Therefore, it is difficult to predict both the warp- and the weft bending rigidity of the fabric with the model proposed in this study. In future work, other methods could be applied to infer the weft bending rigidity of a woven fabric based on the new indicators proposed in this study.
Conclusions
The 3D point cloud of fabric drape was captured using a self-developed 3D scanning system followed by surface reconstruction. With the 3D model of fabric drape, TDA was proposed to characterize the ability of a woven fabric to drape. To bridge the gap between fabric drape configurations and fabric warp bending rigidity, DADF was extracted with a statistical analysis of drape angles. Three conclusions were drawn: (1) TDA is more reliable and representative than the traditional DC in characterizing the ability of a woven fabric to drape. To calculate the TDA of fabric accurately, the corresponding density of triangles should be more than
Footnotes
Declaration of conflicting interests
The authors declared no potential conflicts of interest with respect to the research, authorship, and/or publication of this article.
Funding
The authors disclosed receipt of the following financial support for the research, authorship, and/or publication of this article: This work was supported by the National Natural Science Foundation of China (Grant No. 61572124) and the Special Excellent PhD International Visit Program by Donghua University (DHU).
