
Abstract
Study of the degradation of cellulosic fibers can be based on measurement of their optical, mechanical and chemical properties. Instrumental spectroscopic methods and mechanical properties measurement are preferred. Other methods, such as viscometric and gel permeation chromatography determination of the average degree of polymerization are even more reliable. Selection of the methods for cellulose degradation monitoring must be based on the knowledge of their limits in relation to the various degradation mechanisms. This work is concerned with determining these limits of selected methods of characterizing cellulose textiles in relation to damage in acidic and alkaline conditions and to oxidation at various pH values of the oxidation bath. Model samples of cotton textiles damaged to various degrees in various media were characterized using viscometric determination of the average degree of polymerization of the cellulose, the thread tensile strength, Fourier-transform infrared spectroscopy and ultraviolet/visible spectroscopy.
Keywords
A number of methods can be employed in studying the degradation of cellulosic fibers. Chemical properties can be monitored during degradation by determining the average degree of polymerization (viscometrically, chromatographically) and the content of carbonyl groups; the structure can then be described using spectroscopic methods (nuclear magnetic resonance (NMR), Fourier-transform infrared (FTIR), ultraviolet/visible (UV/Vis), Raman spectroscopy). A frequently employed method involves measuring the color and determining the mechanical properties. In selecting the optimum methodology for studying the degradation of cellulose, it is necessary to take into consideration the sensitivities of the individual methods in relation to the various degradation mechanisms. Consequently, this work was concerned with determining the sensitivities of selected methods of characterizing cellulose textiles in relation to damage in acidic and alkaline solution and to oxidation at various pH values of the oxidation bath.
Degradation of cellulose
The degradation reaction of cellulose can lead to changes in its chemical and supramolecular structures and thus to changes in the physical, chemical and mechanical properties of the fibers. The main mechanisms of chemical degradation of cellulose are thus hydrolysis in acidic medium or enzymatic hydrolysis, reactions with alkali, oxidation or photo-oxidation, and possibly cross-linking. Degradation of cellulose fibers can also be caused by temperature fluctuations and moisture, while biological degradation is an entirely separate chapter. 1
Reactions with acids
Depending on the reaction conditions, the action of acids on cellulose can lead to its esterification or hydrolysis. Dilute acids at elevated temperatures or concentrated acids at laboratory temperatures cause hydrolysis.2,3 This reaction is accompanied by random splitting of the glycosidic bonds and the hydrogen bonds are also influenced. Changes can thus occur in the chemical and supramolecular structure of the cellulose. The rate of hydrolysis is dependent not only on the temperature and acidity of the environment but also on any previous degradation. For example, carbonyl groups substantially accelerate the acidic hydrolysis of cellulose.2,4
Reactions with alkali
The reactions of cellulose with alkali are very diverse and, depending on the reaction conditions, can be used for mercerization or for regeneration and modification of threads or for evaluating the quality of the pulp. On the other hand, they can lead to undesirable degradation processes.1,2
Depending on the reaction conditions, degradation in alkaline medium can result in hydrolysis of the glycosidic bonds or reactions of the terminal glucopyranose units (so called “peeling off”, end-wise degradation, β-elimination).5–7 Under normal conditions, “peeling off” is the predominant mechanism.1,5 Similar to hydrolysis in acidic medium, the degradation reaction in alkaline medium takes place primarily in the amorphous parts of the cellulose and its speed is affected by previous or ongoing oxidation. The resistance of celluloses to alkali decreases with an increasing degree of previous degradation and especially with an increasing content of carbonyl groups in the chain.5,6 The degradation in alkaline media of oxidation-damaged cellulose is not limited to the last reducing glucopyranose unit, but rather entails the splitting of other glycosidic bonds along the chain that are in the β position relative to a keto group or the γ position relative to an aldehyde group. The reduction in the degree of polymerization of the cellulose is then greater than that resulting from “peeling off” of the terminal reducing groups.1,8
Oxidation
While normal reducing agents do not lead to fundamental degradation of cellulose, oxidizing agents cause substantial changes in its structure. The range and type of degradation depends on the type and concentration of the oxidation agent, the temperature and the pH. Primarily the reduction type of oxycellulose is formed in acidic conditions (Figure 1(d)), while the acidic type of oxycellulose is formed in alkaline conditions (Figure 1(h)).1,9
Possible products of the oxidation of the hydroxyl groups of cellulose: (a), (b), (c) secondary hydroxyl groups oxidation; (d), (e) secondary hydroxyl groups oxidation with the simultaneous splitting of the glucopyranose ring; (f) hemiacetal hydroxyl groups oxidation with the simultaneous splitting of the glucopyranose ring; (g), (h) primary hydroxyl groups oxidation. Source: Ďurovič.
10
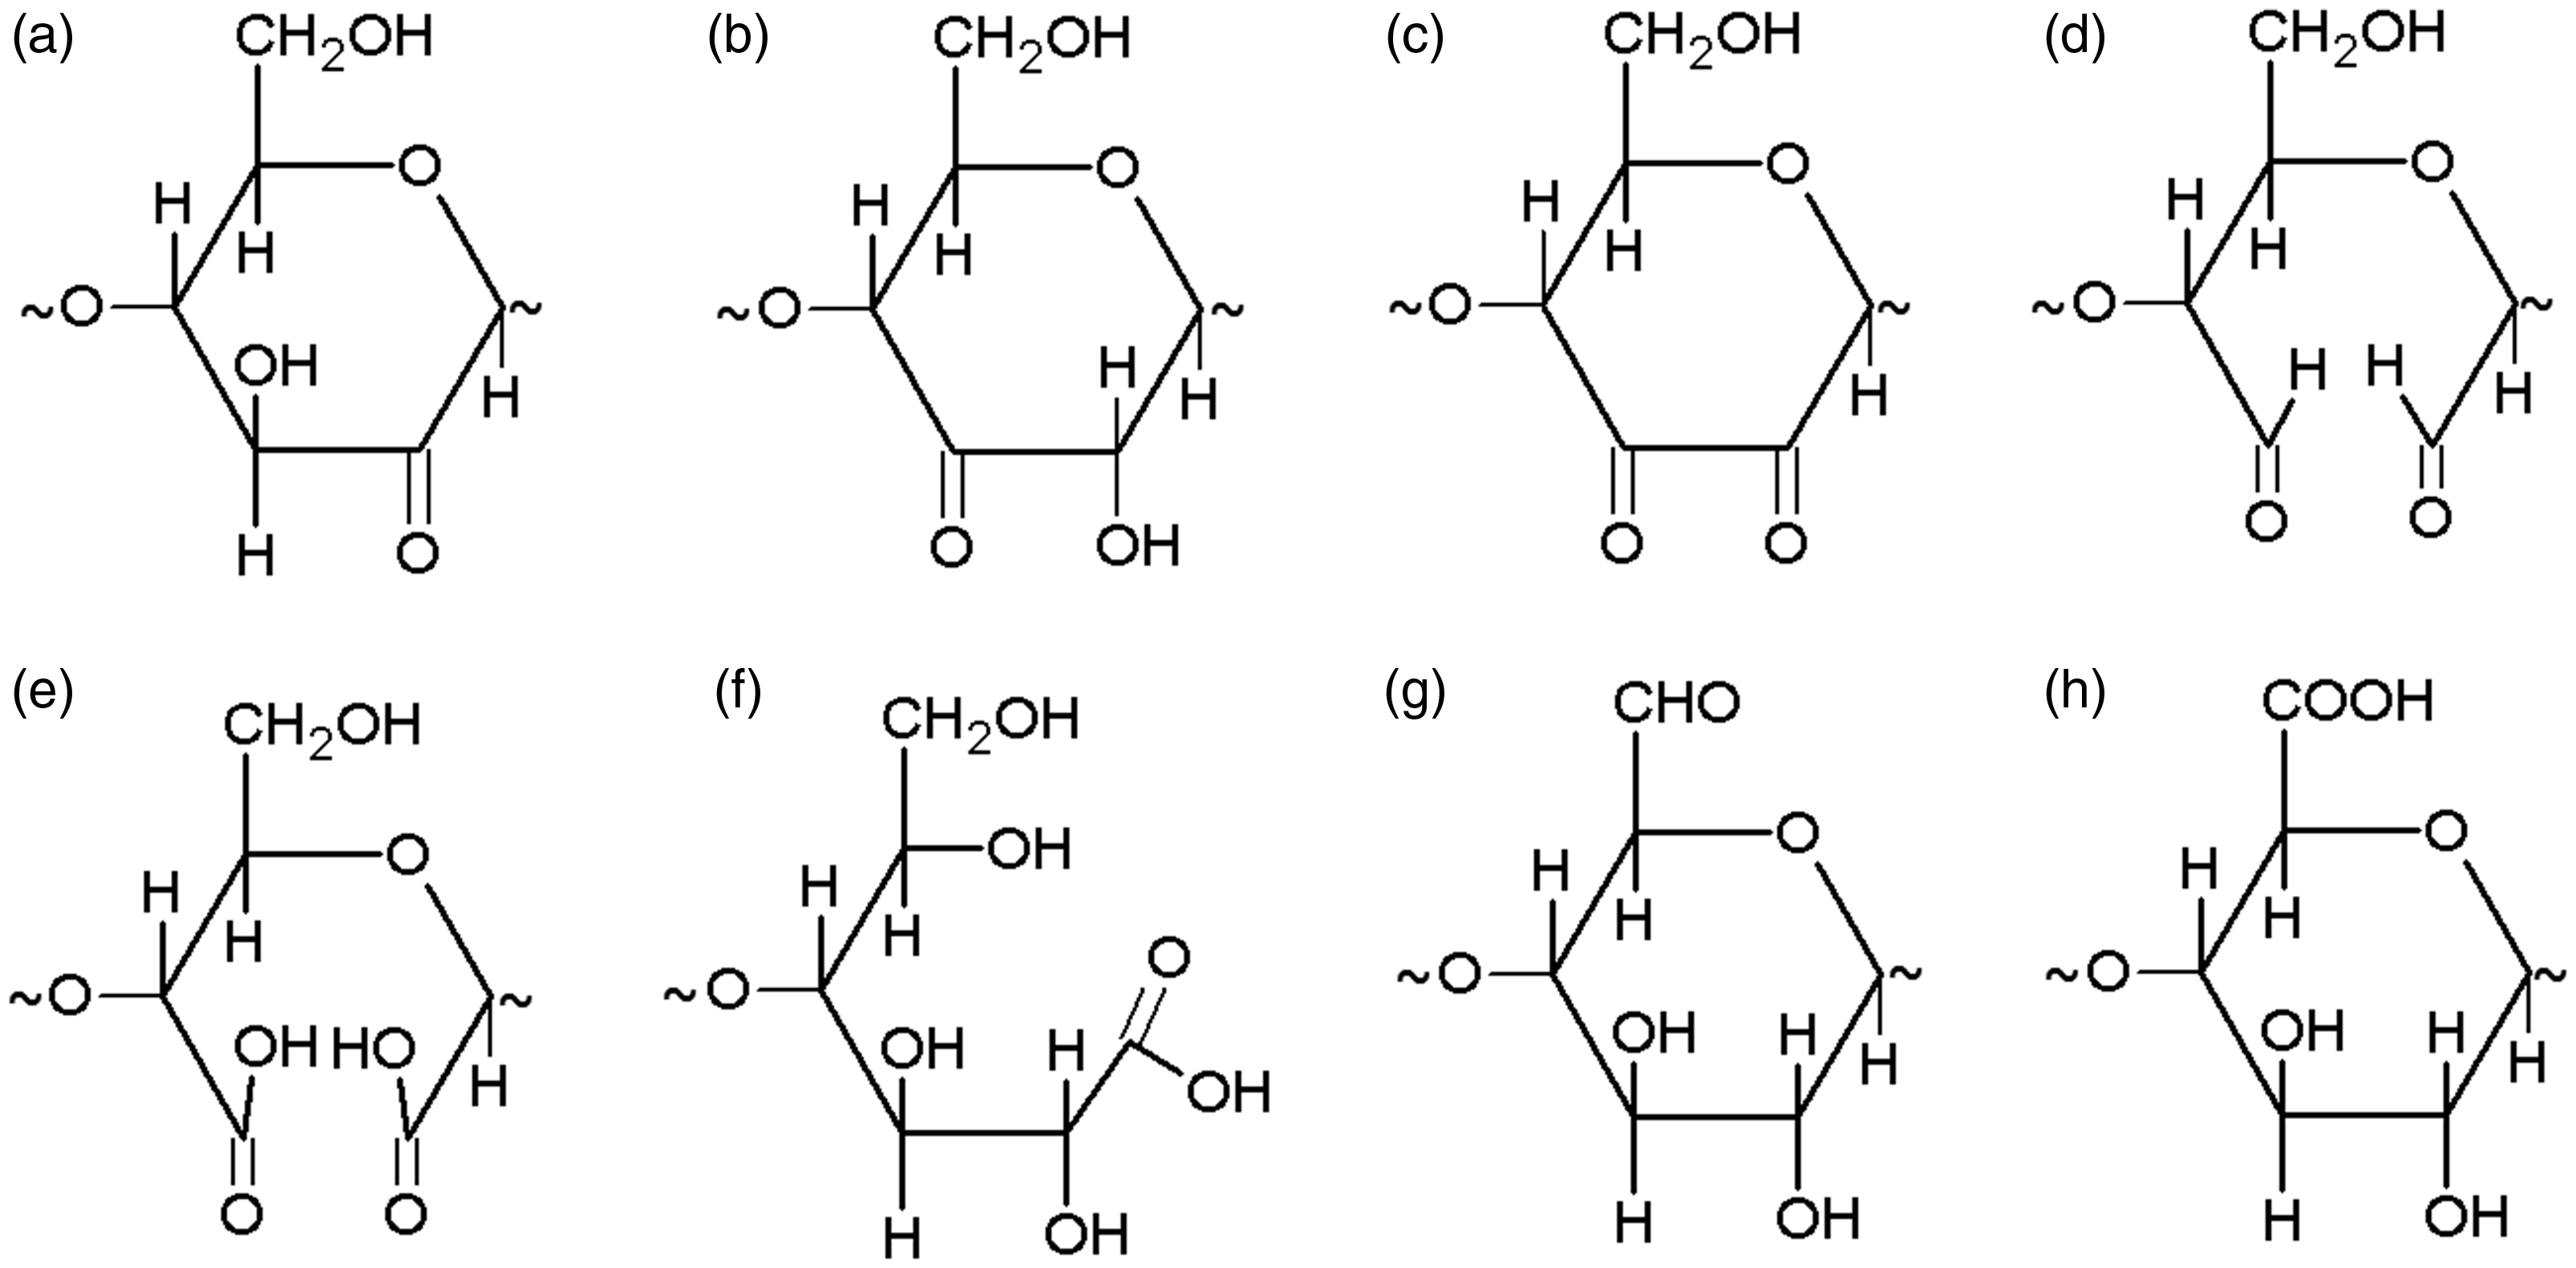
Oxidation of hydroxyl groups to carbonyl groups can take place at all the carbon atoms of the glucopyranose unit and thus several types of degradation products can be formed during the oxidation of cellulose (Figure 1).1,10
Atmospheric oxygen can also react with the oxygen of the glycosidic bond. The unstable peroxide formed splits with simultaneous splitting of the glycosidic bond, leading to a substantial reduction in the average degree of polymerization of the cellulose.1,11
Methods of characterizing cellulosic textiles
Cellulosic materials can be characterized and their degradation can be studied using a number of methods, such as a change in the color, pH or mechanical properties, determining the content of carbonyl groups or the average degree of polymerization and also using spectroscopic methods (FTIR, UV/Vis, NMR, Raman). This work is concerned with determining the sensitivity of measurement of the mechanical properties and FTIR and UV/Vis spectroscopic parameters in terms of various mechanisms of cellulose damage.
Average degree of polymerization
The fundamental procedures for determining the average degree of polymerization (DP) include viscometry, osmometry and light scattering methods. These methods can be employed to determine both the average molar weight of a macromolecular mixture and also for characterizing the individual fractions. Fractionation performed, for example using gel permeation chromatography (GPC), enables determination of both the average values and also of the molar weight distribution curves and the non-uniformity index.
Viscometric determination is instrumentally the least demanding and is simultaneously a very reliable method for determining the cellulose DP. The dissolution of cellulose for this determination, especially in the presence of oxygen, can be accompanied by degradation of the cellulose (primarily oxidation damaged), thus reducing the DP value.12,13 The least degradation of the macromolecule is caused by a LiCl solution in dimethylacetamide, while slight degradation is caused by EWN solvent (iron(III) sodium tartrate complex) or cadoxen (cadmium ethylenediamine). The greatest degradation of the cellulose chains occurs when using CED (cupriethylenediamine) or cuoxam (tetraamminediaquacopper dihydroxide) solvents. 12 Kačík et al. 13 compared the results of determination of DP using viscometry (CED and EWN solvents) and GPC (following derivatization to tricarbanylates). It follows from the results that, while the individual methods yield different absolute molar mass values, the correlations between the values obtained by various methods are linear with a high correlation coefficient. Although the individual DP values do not agree, the linear correlation enables the individual methods to be used for following changes in DP during the degradation process. 13
Mechanical properties
The mechanical properties can be measured during various kinds of loading; however, determination of the thread tensile strength to breakage is used most frequently. The tensile strength is then defined as the force required for breakage related to the fineness of the thread and is given as N∙tex−1, where tex is the unit of fineness (linear density). 2 There are a number of standard tests for determining the mechanical properties of textiles: for example, ISO 1805 (Fishing nets – Determination of the breaking force and knot breaking force of netting yarns), ISO 2062 (Textiles – Yarns from packages), ISO 13934-1:1999 (Textiles – Tensile properties of fabrics).
The use of measurements of mechanical properties to study degradation has, however, substantial limitations, because changes in these properties occur only at a greater degree of cellulose degradation.14,15
FTIR spectroscopy
Infrared spectroscopy is an analytical method that is frequently used to study the degradation of cellulose materials. A number of publications deal with the interpretation of cellulose spectra.16–19
From the viewpoint of monitoring cellulose degradation, problems are associated especially with the band with a maximum at 1640 cm−1, corresponding to absorbed water, because it can cover the bands of the carbonyl groups formed during degradation. The effect of this band can be minimized by vacuum drying of the sample4,6 or by using heavy water. 20,21 This problem can also be solved by mathematical separation of the bands.
Some authors22–24 quantified the contents of the individual functional groups on the basis of band intensities, while others6,21,25 evaluated the integral intensity of the bands. It is not accurate to evaluate the absorption activity only on the basis of the intensity of a band, because it takes into account only the contribution of a narrow fraction of molecules and not the contributions of the same bonds absorbing in the immediate vicinity of the wavelength of the band maximum. It thus follows that the integral intensity is a more suitable parameter. Most of the absorption bands of cellulose partially overlap and thus it is necessary to separate the bands mathematically before calculating the areas. The structural changes in the cellulose and any quantification can be advantageously performed on the basis of the ratios of selected absorption bands.17,21,22,24,26,27
UV/Vis spectroscopy
Selected absorption maxima of chromophores in UV/Vis spectra

Methods and materials
Textiles damage by various mechanisms
Model samples were prepared from cotton fabric (unbleached, any low-molecular components were removed by boiling in a 0.5% sodium hydroxide solution): 134 g/m2, plain weave, thread count in warp and weft 30 threads per 1 cm; supplier: Výtvarné potřeby - Radek Rosenkranz, CR.
To enable monitoring of the sensitivity of selected methods of determining the properties of textiles in relation to various mechanisms of cellulose degradation, the cotton samples were damaged to various degrees by various agents. This involves damage in acidic and alkaline solution and oxidation damage at various pH values of an oxidation bath.
Damage in acidic solution
The conditions of damage to cotton in acidic solution were selected on the basis of the literature. 3 Experiments employed 1.5% HCl (300 ml solution and 5 g cotton) at a temperature of 65℃; the reaction took place in a heated box in a closed vessel for 30 min and 1, 2, 3, 5, 7 and 16 hours. The cotton was then washed in distilled water until the acidic reaction disappeared (checked with universal indicator paper). The sample was dried in the air at laboratory temperature (20 ± 2℃, RH 50 ± 5%).
Damage in alkaline solution
The conditions of damage to cotton in alkaline solution were selected on the basis of the literature. 31 Experiments employed a 5% NaOH solution (300 ml solution and 5 g cotton) at a temperature of 65℃; the reaction took place in a drying box in a closed vessel for 16 hours and 3, 7 and 14 days. The cotton was then washed in distilled water until the alkaline reaction disappeared (checked with universal indicator paper). The sample was dried in the air at laboratory temperature.
Oxidation in neutral solution
The oxidation damage to cotton in practically neutral solution was caused by 5% NaClO solution (200 ml solution and 5 g cotton) buffered with a 1M KH2PO4 solution at laboratory temperature for 1, 2, 5, 10, 15 and 30 min. The pH of the oxidation bath (pH meter WTW inoLab 720, Germany) was 6.5 throughout the reaction. The cotton was then thoroughly washed in distilled water and dried in the air at laboratory temperature.
Oxidation in alkaline solution
The oxidation damage to cotton in alkaline solution was caused by 5% NaClO solution buffered with Na2CO3 (200 ml solution and 5 g of cotton) at laboratory temperature for 2, 10, 15, 30, 60 and 120 min. The pH of the oxidation bath was 10 throughout the reaction. The cotton was then thoroughly washed in distilled water to disappearance of the alkaline reaction (checked with universal indicator paper) and dried in the air at laboratory temperature.
Chemicals
The following chemicals were used: sodium hydroxide (CAS number: 1310-73-2), hydrochloric acid (CAS number: 7647-01-0), sodium hypochlorite (CAS number: 7681-52-9), sodium carbonate (CAS number: 497-19-8), potassium dihydrogenorthophosphate (CAS number: 7778-77-0). For EWN solvent preparation: sodium hydroxide, iron(III) nitrate (CAS number: 7782-61-8), monosodium tartrate (CAS number: 526-94-3).
Determination of the textile properties
Average degree of polymerization
The limiting viscosity number of the cellulose was determined according to standard ČSN 800811. This involves viscometric determination using a capillary Ubbelohde viscometer UII (Schott, Germany) with solvent consisting of an iron(III) sodium tartrate complex (EWN). The limiting viscosity number was recalculated to DP using equation (1), where number 152 is the constant from the standard. Two parallel determinations were carried out for each sample, where the given results are the arithmetic mean.

Mechanical properties
The thread tensile strength to breakage was determined using standard ISO 2062 with Universal testing instrument LabTest 5.030-2 (Labortech, CR) with special jaws for holding threads. The thread fixed length was 10 cm and the jaw speed was 50 mm ∙ min−1. The measured stress to failure was related to thread linear density and resultant values of the tensile strength expressed in N ∙ tex−1 are the arithmetic mean of 20 weft thread measurements. The results were processed statistically and the error was calculated as the corrected standard deviation, where twice this value is indicated in the graphs as error bars.
FTIR spectroscopy
The spectra were recorded on Nicolet iZ10 infrared spectrometer (Thermo Fisher Scientific, USA) with ATR technique (single reflection diamond crystal). Conditions for measuring spectra were the following: spectral range 4000–650 cm−1, number of accumulation spectra 64, resolution 4 cm−1, liquid nitrogen cooled MCT-A detector. The interferometer and the spectrometer area were rinsed with nitrogen (99.999% pure) during the measurement.
Omnic 8 software was used for measuring and processing the spectra. Mathematical separation was carried out for its ability to quantify selected absorption bands. Five spectra were measured for each sample, with mathematical separation, calculation of the integral intensities of the absorption bands and calculation of selected band ratios. The resultant values of the ratios of the areas of the absorption bands were processed statistically and the error was calculated as the corrected standard deviation, where twice these values are indicated in the graphs as error bars.
Mathematical separation of the infrared spectra consisted of subtraction of the absorption bands of water vapor and CO2 present in the measured spectra, selection of separated areas of the spectra (1900–800 cm−1), automatic baseline correction and standardization (to the 1030 cm−1 band). Gauss function without supplementary baseline with band half-width 7 and differential curve noise 10 was used for the mathematical separation.
UV/Vis spectroscopy
The UV/Vis spectra were measured on a Cary 60 spectrometer (Agilent, USA) with diffusion reflectance adapter (Barrellino). The reflectance spectra were measured on a light-stable white support in the 200–800 nm wavelength range.
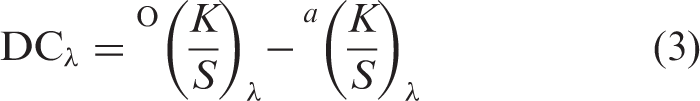
Ten spectra were measured at various places on each sample and were averaged; the average reflectivity values R∞ in the entire spectral range were used to calculate the ratio factors K/S according to equation (2). The factor K/S expresses the ratio of the coefficient of light absorbance K and the coefficient of light scattering S. Decoloration numbers DCλ were calculated according to equation (3).
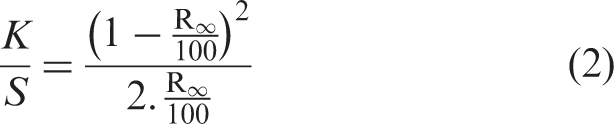
The ratio factor
Results and discussion
Average degree of polymerization
The average degree of polymerization of cellulose in variously damaged cotton
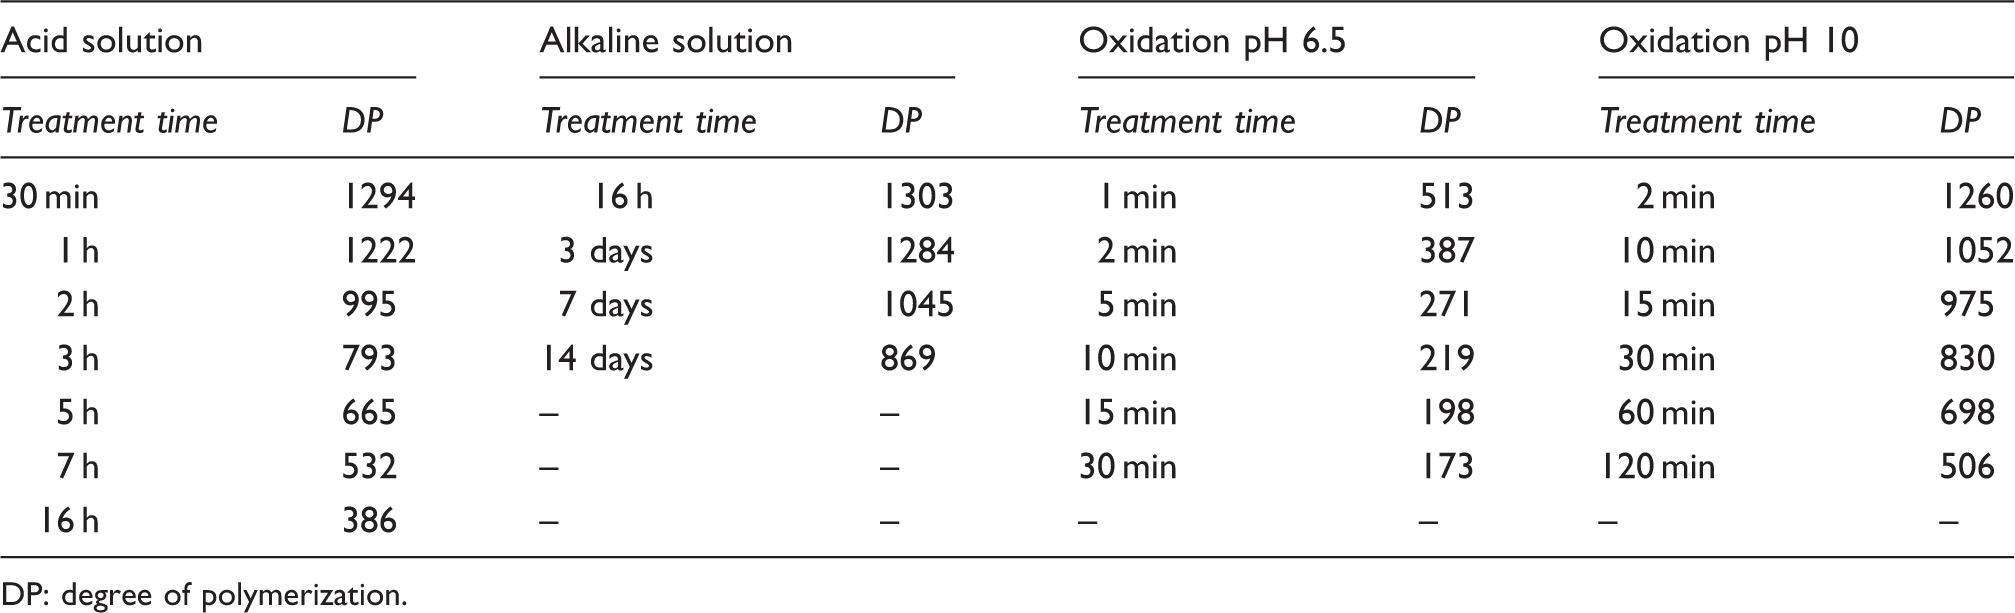
DP: degree of polymerization.
On the basis of the mechanisms of cellulose degradation described in “Degradation of cellulose”, above, it can be stated that the determined DP values unambiguously reflect possible shortening of the cellulose chains in samples damaged in alkaline and acidic solution. However, for samples damaged by oxidation, the resultant DP values given in Table 2 need not fully reflect the actual length of the macromolecular chain. One of the reasons could be the elevated sensitivity of oxycellulose to degradation in alkaline conditions. Greater damage to the oxidized cellulose macromolecule than to unoxidized samples could occur during dissolution of the cellulose for viscometric determination of DP in highly alkaline solvent EWN. Another problem could be opening of the glucopyranose ring during oxidation of cellulose (see Figure 1(d), (e), (f)), which could affect determination of the limiting viscosity number and also complicate the possibility of its recalculation to the average degree of polymerization.
Thread tensile strength
The weft threads were pulled out of the cotton fabric for measuring the tensile strength. The strength was not measurable for the most damaged samples (DP 387 after damage in acidic solution and DP 173 after oxidation at pH 6.5) because these threads could not be pulled out without breaking.
Cotton threads damaged in acidic or alkaline conditions exhibit the same dependence of their tensile strengths on the average degree of polymerization. It is apparent from Figure 2 that the decrease in tensile strength occurs for threads whose cellulose DP value decreases by at least 30%.
Dependence of the thread tensile strength on damage to the cellulose in acidic solution.
The effect on the mechanical properties of cotton threads differs during oxidation. Oxidation is accompanied by substantial changes in the chemical structure of the cellulose, thus affecting the determination of the limiting viscosity number, while the mechanical properties of the thread are not changed so significantly. This trend is more substantial for oxidation at pH 6.5 (Figure 3), which could be caused by the formation of oxycellulose of the reducing type, which is more susceptible to subsequent degradation in alkaline medium.
Dependence of the thread tensile strength on damage to the cellulose by oxidation at pH 6.5.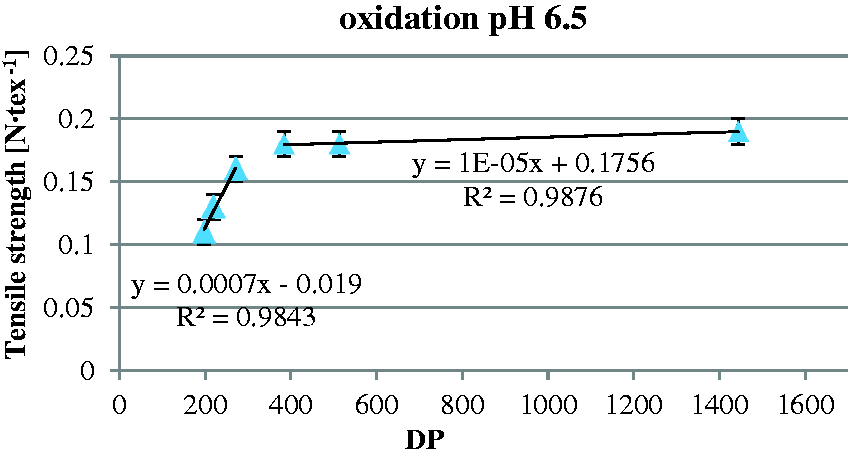
It follows from these results that the mechanical properties deteriorate only at a higher level of splitting of the cellulose macromolecules (after reduction of DP to approximately 1000). This is in accordance with already published results. De Silva and Byrne 15 state very similar dependence of mechanical properties on the average degree of polymerization; mechanical properties deterioration is caused by DP reduction to approximately 1150. Takács et al. 14 refer to a decrease of the mechanical properties only at a greater degree of cellulose degradation. Consequently, it is not sufficient to measure the mechanical properties as the main characteristic of textiles when studying their degradation, as is stated in some publications.32,33
Infrared spectroscopy
The measured infrared spectra were first evaluated qualitatively. In the figures, the individual spectra are designated with the values of the average degree of polymerization of the cellulose. Figure 4 depicts a section of the spectrum of cotton damaged in acidic solution, which includes the area of vibrations of the glycosidic bond (1159 cm−1). No changes are visible in the spectra even though the average degree of polymerization of the cellulose gradually decreased from 1444 to a value of 386. No significant qualitative changes are observable even in the spectra of cotton damaged in alkaline medium.
FTIR spectra of cotton with various DP – damaged in acidic solution.
Certain qualitative changes are visible in the area of the vibrations of the carbonyl groups of cotton damaged by oxidation at pH 10 (Figure 5). Changes occurred in the spectra especially in the area around 1600 cm−1, corresponding to the absorbance bands of conjugated carbonyls. Unambiguously observable changes are visible in the spectra of the most damaged cotton (DP 506). A closer look at the dependence of the content of carbonyl groups on the degree of degradation can lead to quantification of selected absorption bands.
FTIR spectra of cotton with various DP – damaged by oxidation at pH 10.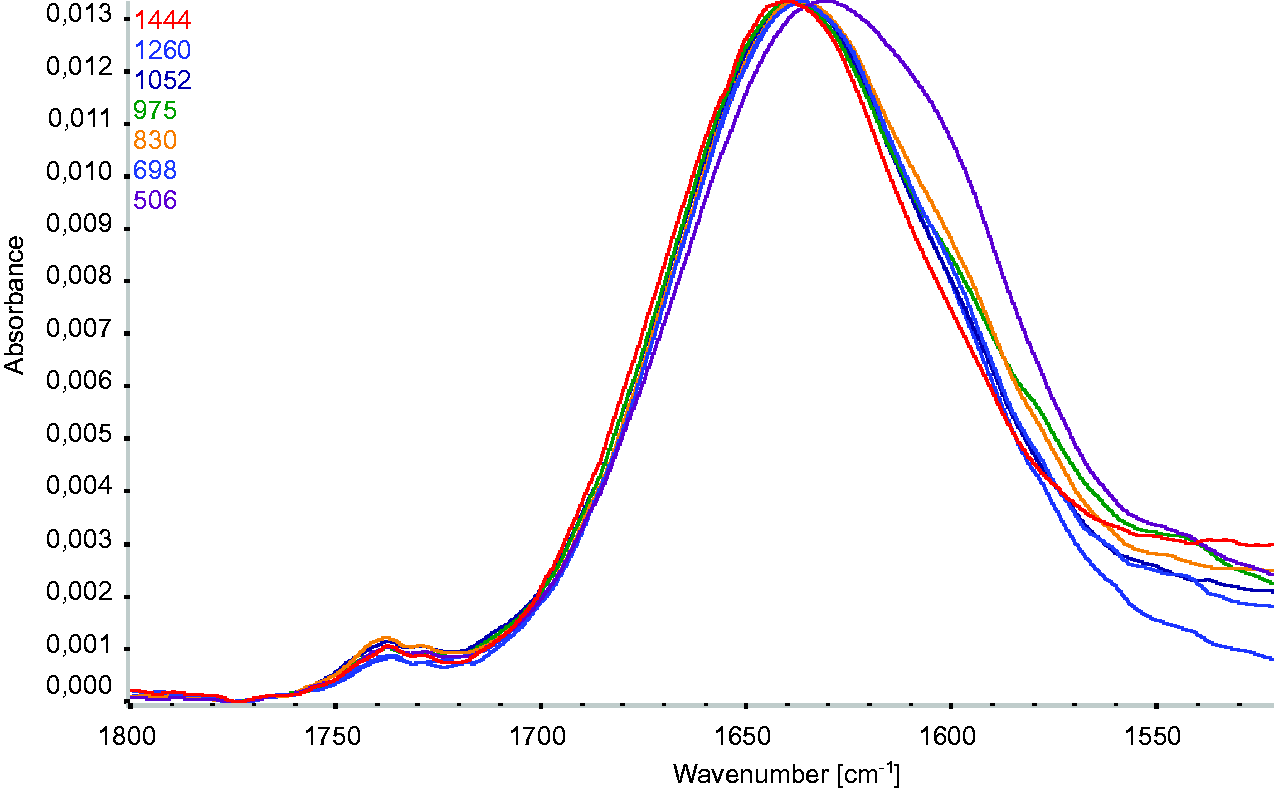
Qualitative changes in the spectra in the area of the carbonyl group vibrations are far more visible for cotton damaged by oxidation at pH 6.5 (Figure 6) than after oxidation at pH 10, which is in accordance with the theoretical assumptions (oxidation of the cotton with sodium chlorate around neutral pH leads to the greatest damage to cellulose macromolecules). Changes in the spectra occurred again in the area around 1600 cm−1, corresponding to the absorption bands of the conjugated carbonyls. In addition, a broadening and increase in the intensity of the absorption band occurred in the area around 1740 cm−1, corresponding to the vibrations of various carbonyl group forms. An increase in the intensities of the carbonyl absorption bands in dependence on the damage to the cellulose can be clearly seen in the spectra.
FTIR spectra of cotton with various DP – damaged by oxidation at pH 6.5.
Summary of the tested ratios of integral intensities of absorption bands
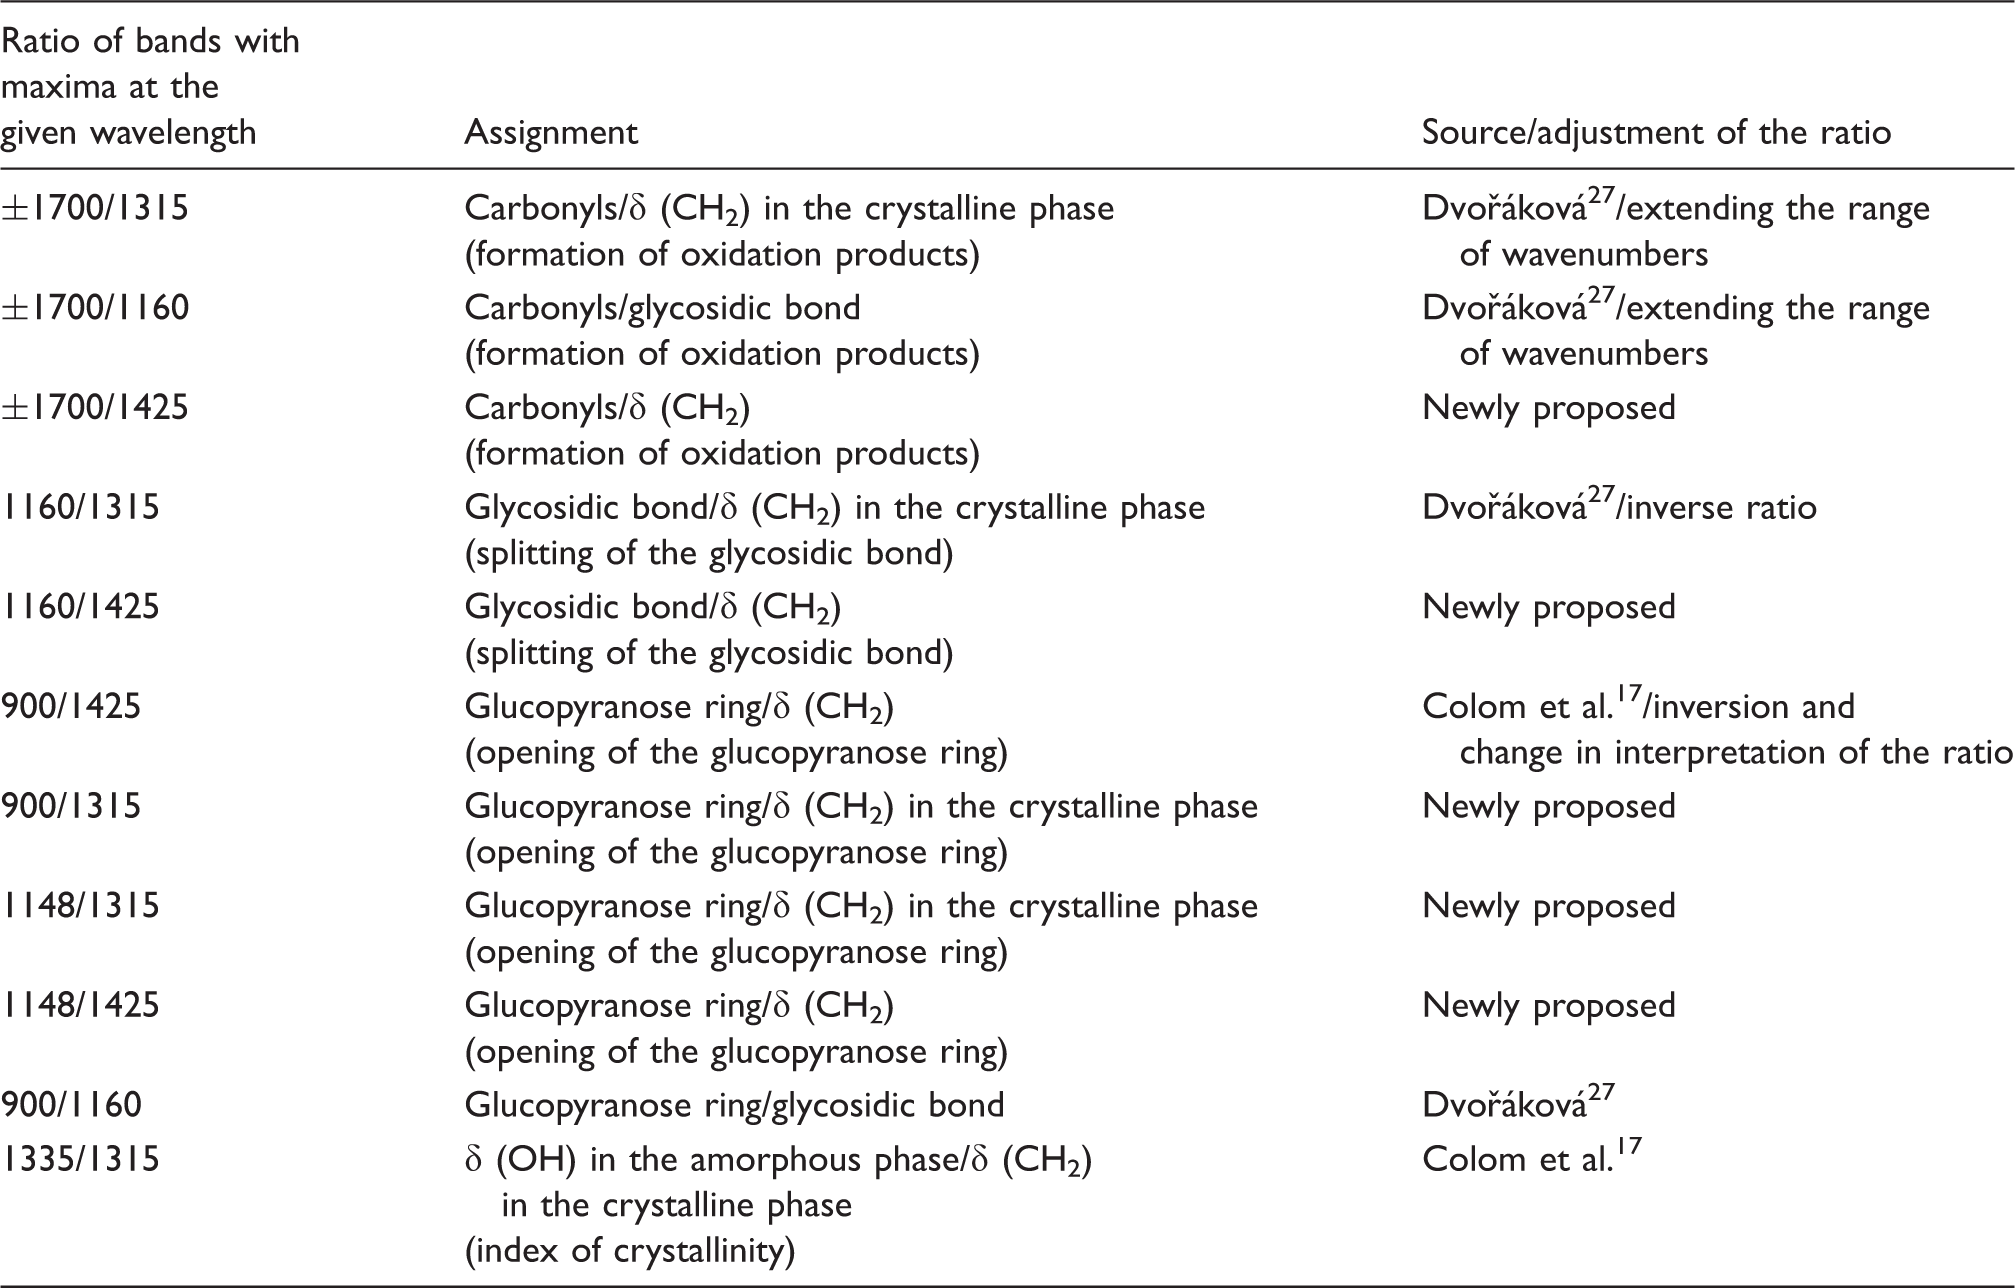
The absorption band at 1735–1750 cm−1 is attributed to non-conjugated carbonyls,18,34,35 at 1710 cm−1 to carbonyl in ketones, 21 at 1600–1620 cm−1 to conjugated carbonyls, 21 at 1425 and 1315 cm−1 to CH2 bending vibration16,17 and at 1160 cm−1 to glycosidic bond.16–18
The absorption band at ±1700 is the sum of the integral intensities of all the bands (carbonyl groups) occurring in the wavelength range 1600–1800 cm−1, except for the band at 1640 cm−1, corresponding to absorbed water.16,18 Compared with the published data (1690–1740 cm−1), 27 the range of wavenumbers was extended so as to include the contributions of the conjugated and unconjugated carbonyls.
In addition to the band at approximately 900 cm−1, mentioned in the literature, the band at approximately 1110 cm−1 can also be used to monitor opening of the glucopyranose ring.16–18 However, it is difficult to separate this band mathematically and the separation is very poorly reproducible. A new band in the area around 1148 cm−1 was also suggested for monitoring glucopyranose ring opening; no interpretation could be found in the literature, but it was assigned to vibrations of the glucopyranose ring on the basis of comparison spectra of glucose, cellobiose and cellulose.
No trend that would correspond to the assumed degradation mechanism, in this case splitting of the glycosidic bond, could be followed on any of the calculated band ratios of the cotton samples damaged in acidic solution. Figure 7 depicts the dependence of the ratio of the bands at 1160 and 1315 cm−1 on DP, from which the anticipated reduction of this ratio is, however, not visible.
Monitoring of the splitting of the glycosidic bonds after damage in acidic medium.
Similar to cotton damaged in acidic solution, even after damage in alkaline solution it is not possible to unambiguously follow the anticipated main mechanism of degradation, which is opening or a decrease in the number of glucopyranose rings. Figure 8 shows a certain decrease in the ratio of the bands at 1148 and 1315 cm−1 with increasing degree of degradation. This ratio was found to be the most suitable of all the tested ratios; nonetheless, in relation to the error in the determination and not completely unambiguous trend, the opening of the glucopyranose ring is not fully demonstrable. Similarly, ambiguous dependences also occur for the other ratios of absorption band intensities.
Monitoring opening of the glucopyranose ring after damage in alkaline medium.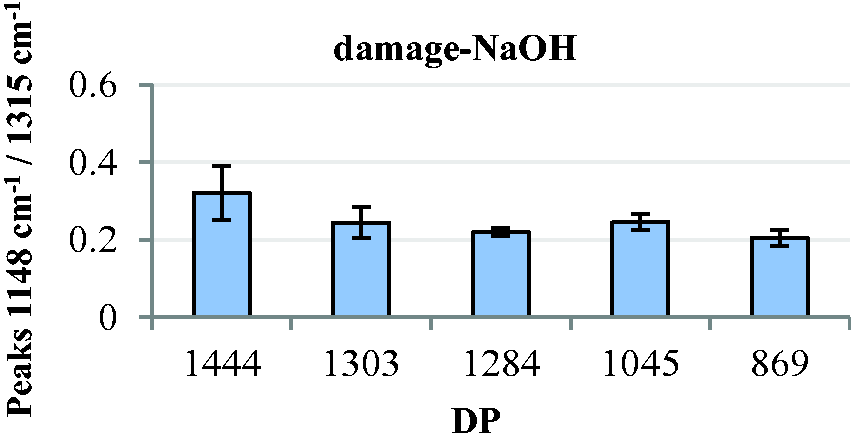
An increase in the carbonyl content during degradation can be seen on samples of cotton damaged by oxidation at pH 10 (Figure 9). The error in determining the ratio of bands at 1700 and 1315 cm−1 is quite large and the differences between the variously damaged samples are not sufficiently conclusive. These results correspond to qualitative evaluation of the spectra during which no substantial changes were manifested in the spectral characters of variously damaged samples (with the exception of the most damaged cotton). The other ratios of bands evaluating the content of carbonyl groups exhibit a similar trend, while other tested band ratios were not found to be suitable for monitoring oxidation degradation in alkaline medium.
Monitoring the formation of oxidation products after oxidation at pH 10.
An unambiguous dependence of the content of carbonyl groups on the degree of degradation is visible for cotton samples damaged by oxidation at pH 6.5 (Figure 10). Samples after oxidation damage in a bath with neutral pH exhibit a more substantial increase in the content of carbonyl groups than after oxidation in alkaline medium, in agreement with the published data, according to which greater damage to the cellulose macromolecules occurs during oxidation of cotton with sodium chlorate at neutral pH.1,2
Monitoring the formation of oxidation products after oxidation at pH 6.5.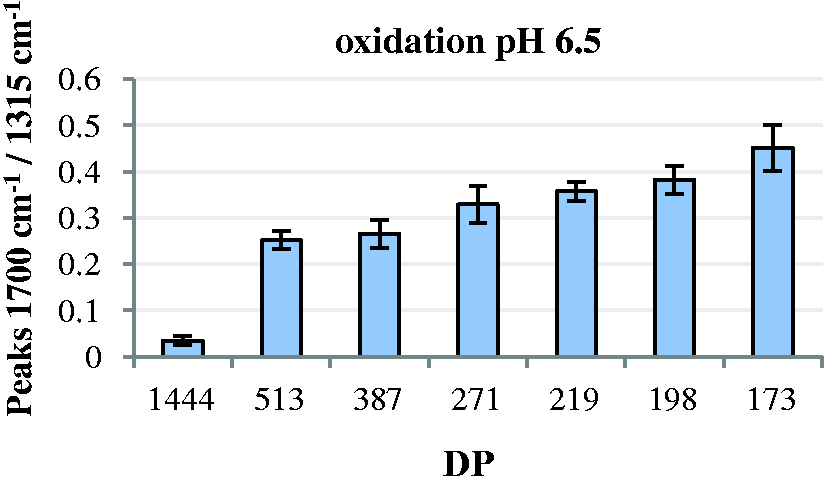
The infrared spectra can be affected by phenomena that prevent correlation of the ratios of absorption bands with damage to the cellulose macromolecule. This could be caused by a change in the arrangement of hydrogen bridges as a result of the degradation reaction, which could lead to changes in the intensities and maxima of the absorption bands of the bonds in their vicinity, although these bonds need not be directly affected by the degradation reaction itself.
UV/Vis spectroscopy
On the reflectance spectra themselves, only changes in the visible area caused by bleaching of the sample after the action of sodium hydroxide and sodium hypochlorite are visible. Changes in the chromophore system are not observable in the spectra of any of the model samples.
Reflectance UV/Vis spectroscopy is not suitable for studying the degradation of cellulose in acid or alkaline condition because the course of the degradation cannot be followed even on K/S or on the decoloration curves.
The K/S curves exhibit a decrease in dependence on the degree of damage only for cotton samples oxidized by sodium hypochlorite at pH 10 (Figure 11), indicating a decrease in number of chromophores. However, these curves do not permit a closer view of the chromophore system.
K/S curves of cotton with various DP – damaged by oxidation at pH 10.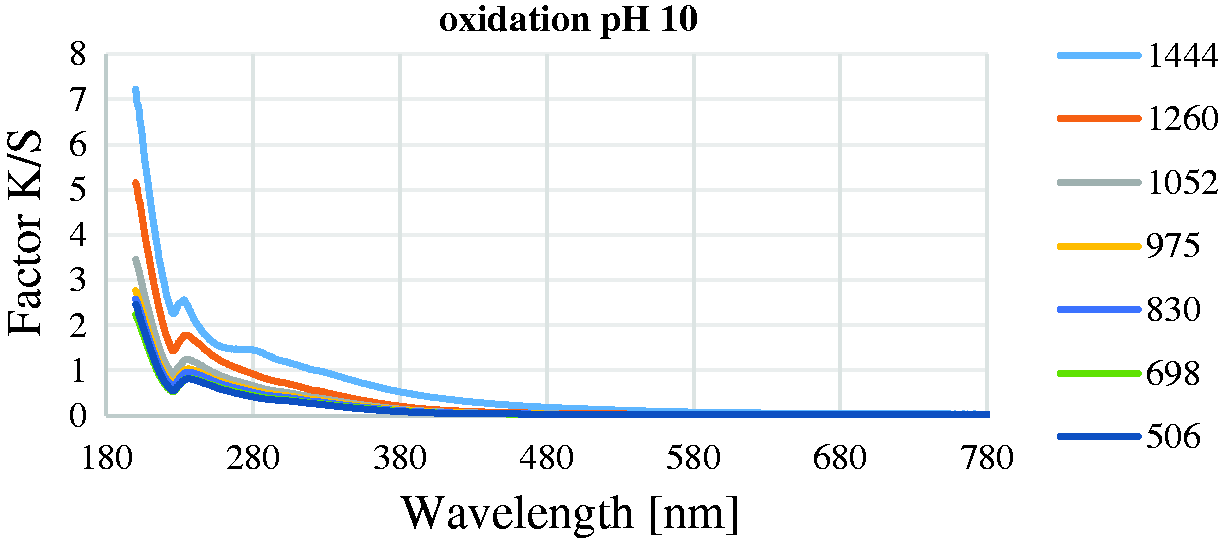
The decoloration curves are the most useful for observing changes in the chromophore system. An increase in the decoloration number in the area around 258 nm is visible in Figure 12, depicting the dependence on the time of action of the oxidation agents at pH 10, indicating a decrease in number of chromophores (in this case conjugated carbonyls). Thus, at pH 10, bleaching especially occurs and, to a lesser degree, oxidation damage to the cellulose macromolecule.
Decoloration curves of cotton with various DP – damaged by oxidation at pH 10.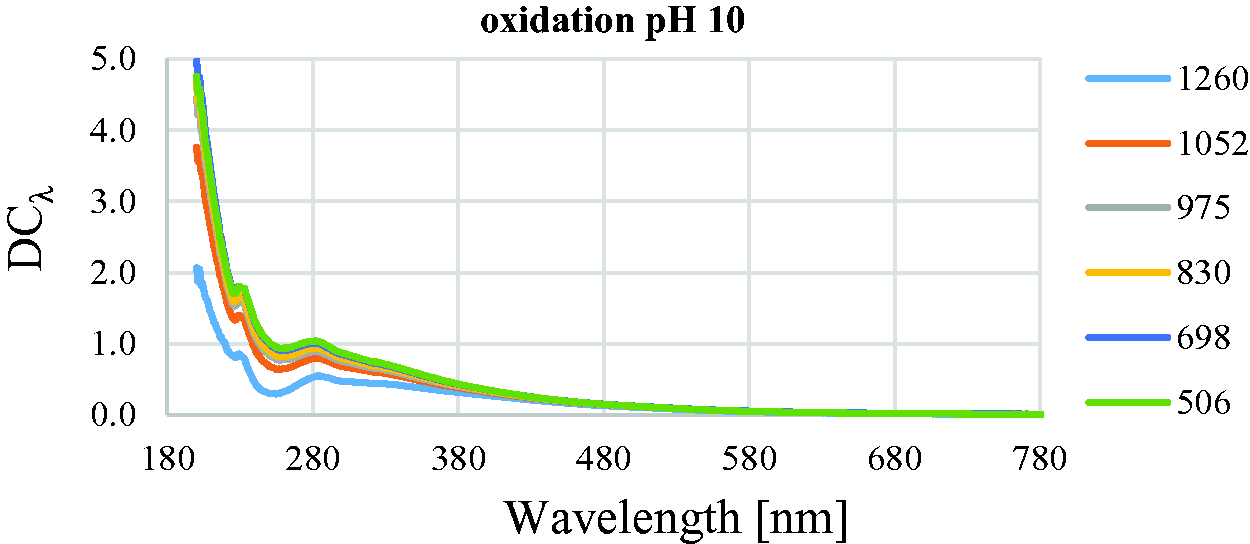
On the other hand, a decrease in the decoloration number in dependence on the time of action of the oxidation agent is visible in the UV region for cotton oxidized in neutral solution (Figure 13) and thus conjugated carbonyls are formed. While the cotton is mainly bleached during oxidation in alkaline conditions, degradation predominates during oxidation in neutral conditions. The increase in the content of conjugated carbonyls, especially after oxidation in neutral solution, corresponds to the results of FTIR spectroscopy. The greater damage to the cellulose macromolecules during oxidation with sodium hypochlorite in neutral conditions is also in agreement with the theory of cotton bleaching.
1
Cotton decoloration curves with various DP – damaged by oxidation at pH 6.5.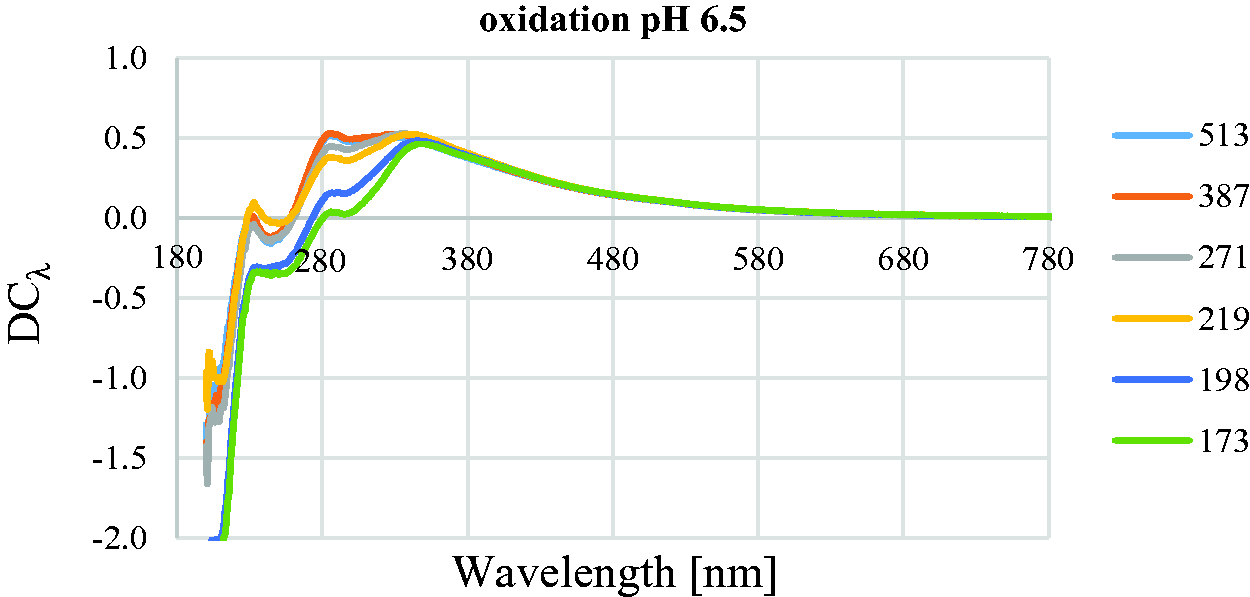
Conclusion
The properties of cotton textile samples damaged by various agents were determined by measuring the average degree of polymerization, thread tensile strength and using infrared and UV/Vis spectroscopy. It follows from the results that, especially when various degradation mechanisms can occur simultaneously or consecutively, it is important to determine the textile properties by several methods. Determination of the average degree of polymerization is especially important for qualified evaluation of any splitting of the cellulose macromolecule because, in contrast to the mechanical properties, it clearly reflects the start of splitting of the macromolecules. The mechanical properties are then an important characteristic, especially for oxidation-damaged cellulose, where they can affect the DP determination.
The ratios of the integral intensities of the absorption bands of the individual bonds related to the absorption bands of the C-H bonds (especially in the 1315 or 1425 cm−1 region) were found to be most stable for monitoring the degradation of cellulose by FTIR spectroscopy. The index of crystallinity (1335/1315 cm−1) and the 900/1160 cm−1 ratio were found to have low diagnostic value and could not be used to follow the degradation of any of the model damaged cotton samples. Infrared spectroscopy has substantial limitations in assessing the degree of degradation of cellulose. Monitoring the splitting of glycosidic bonds or opening of the glucopyranose ring, during which no new functional groups are formed, was especially problematic and thus FTIR spectroscopy was not found to be a suitable and reliable method. However, this method is useful for monitoring the oxidation damage to cellulose, where the content of newly formed carbonyl groups correlates well with the degree of damage. However, it has certain limitations even for oxidation damage: primarily it is insufficiently sensitive, especially in the initial stages of degradation.
Similar to infrared spectroscopy, UV/Vis spectroscopy was not found to be a suitable method for monitoring degradation in either acidic or alkaline conditions. Processing of the reflectance spectra in the form of decoloration curves, which can be used to follow changes in the chromophore system, e.g. during bleaching or oxidation damage to cellulose materials, is the most suitable. While FTIR spectroscopy enables a certain degree of quantification of the carbonyl group content, UV/Vis spectroscopy is more sensitive for studying the chromophore system of the cellulose macromolecule. However, UV/Vis spectra interpretation and the assignment of bands to individual chromophores is not comprehensively studied. The additional research should be focused on this problem.
The concurrence of several degradation mechanisms and the possible presence of residues of chemical agents leads to problems for both tested spectroscopic methods. Both these factors substantially complicate spectral interpretation. Their sensitivity only to oxidation and their lower sensitivity, especially in the initial phases of degradation, are further limiting factors in their use in comprehensive studies of the degradation of cellulose materials.
Footnotes
Declaration of conflicting interests
The authors declared no potential conflicts of interest with respect to the research, authorship, and/or publication of this article.
Funding
The authors received no financial support for the research, authorship, and/or publication of this article.