



Abstract
The fiber injection molding process is an innovative approach for the manufacturing of long fiber nonwoven preforms with little to no waste. An important property for the mechanical characteristics of the composite parts is the fiber orientation of the fiber injection molded nonwovens. In this paper a newly developed assemble method based on Fast Fourier Transform and improved Structure Tensor methods for the computation of the fiber orientation distribution in the local orientation by image analysis of transmitted light images is presented. For the computation of the fiber orientation, the Fast Fourier Transform and Structure Tensor methods are used. The new method is evaluated using simulated images and transmitted light images of real nonwovens to evaluate their accuracy. The computed fiber orientation distributions are compared to reference distributions by means of the Kullback–Leibler divergence. It is shown that the assemble method can perform accurate and reliable measurement of fiber orientation measurement and the modified Structure Tensor method improves results significantly compared to the current state of the art.
Keywords
Nonwoven-based composites represent a cost-effective alternative to endless fiber-reinforced composites for applications with lower mechanical requirements, such as claddings or floor panels. 1 Preforms for the manufacturing of composites are produced by cutting the contour from semi-finished products in the form of rolled goods, such as nonwovens and mats, followed by stacking and forming in a three-dimensional shape. 2 This leads to waste of material and therefor higher material costs. 3
The fiber injection molding (FIM) process is a promising innovative process for the manufacturing of three-dimensional near net shape nonwoven preforms without the intermediate step of two-dimensional (2D) semi-finished products. 3 The process allows the production of three-dimensionally formed long fiber semi-finished products without cutting waste by blowing fibers into a closed mold by means of an air stream. 4 To better understand the process and monitor mold filling, a process monitoring system has been developed. 5 For the monitoring system, the injection mold has been modified with two Plexiglas windows at the top and bottom sides. A digital camera is integrated beneath the mold to record the injection process. Additional lighting over the upper mold improves the visibility of the fibers and allows the capturing of transmitted light images of the final preform when the mold is fully filled. The transmitted light images of this monitoring system shall be used to evaluate the fiber orientation of the manufactured FIM nonwovens, as it is an important property of nonwovens that represents the directional mechanical properties of nonwovens. In addition, the mechanical properties of nonwovens can be improved by a fiber arrangement with one or more preferred orientations.
In related works, the fiber orientation is often represented by the so-called Orientation Distribution Function (ODF).
6
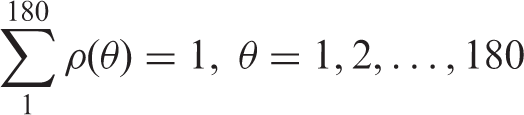
The ODF is the probability that the fibers in one image are aligned in different orientations, which is defined as

The research of different methods for the measurement of fiber orientation distribution and anisotropy has been ongoing for a few decades. In recent years a great deal of research has focused on image analysis methods for fiber orientation analysis. Compared to traditional methods, image analysis methods require simple equipment and a short measurement time. In addition, they have been already widely used in industrial production, especially in the field of visual inspection. Based on image analysis theory, vision measurement methods in related papers can be divided into different types.
Among these methods, Fast Fourier Transform (FFT) is the most frequently used method.7–12 In this method, the acquired images will be converted to the frequency domain. Then, the energy in the different orientations ranging from 1° to 180° will be integrated and compared with each other to get the final ODF. Tunák et al.13,14 adopted window FFT to construct a blockwise FFT (BFFT) method. Firstly, the whole nonwoven image will be divided into multiple same-sized subwindows. Then, FFT will be processed to find the preferred orientation for each subwindow.
The Hough Transform is also a common image analysis method and some experts have made attempts to adapt it for orientation measurement.15–18 In order to use the Hough Transform, the original nonwoven images should be added to a thinning procedure to prevent spectrum leakage. Analog to the FFT method, there is also a variation of the original HT where the image is divided into subwindows, which will be called blockwise Hough Transform (BHT) in the following. 19
Van Vliet and Verbeek 20 first adopted the Structure Tensor (ST) to measure the properties of the orientation of materials. The ST, which was presented by Knutsson, 21 improves the properties of the gray value gradient. Krause et al. 22 used the ST to analyze fiber-reinforced materials scanned with computer tomography in two and three dimensions. ST methods are widely used for the analysis of different types of fibrous materials, such as biomaterials, nonwovens, composites and paper.
Besides the three main theories, there are also some different attempts. Pourdeyhimi and Dent 23 used a Flow Field (FF) to integrate the local gray value gradient of each pixel by some statistical method. Hong et al. 24 made use of a similar orientation estimator (the least mean square orientation measure algorithm) to measure the orientation of ridges within a fingerprint image. Pourdeyhimi et al. 25 also attempted to directly track (DT) the fibers to determine fiber orientation distribution. In this method, before tracking the fibers need to be thinned to one pixel width. Otherwise, tracking will be confused by multiple surrounding pixels. Besides fitting the line in Hough space, Jue et al. 26 also wanted to fit the edge lines of fibers in the image domain. These methods obtained good results when the input images have a very high resolution, such as those acquired by a microscope. Tunák et al. 13 introduced the Image Moment Analysis (IMA) method for fiber orientation measurement of nonwovens and nano-fibrous layers and combined spectrum and moment approaches in the measurement of the fiber orientation section. Lijuan and Weidong 18 addressed this method for the analysis of electrospun submicro-fibers. In contrast to the BFFT method, the evenly cut off subwindow will not be transformed into the frequency domain through FFT, but directly be analyzed by moment analysis to calculate the dominant orientations of each window. By considering the variability of image intensities along different directions surrounding each pixel, Quinn and Georgakoudi 27 presented a weighted orientation vector summation (WVS) algorithm that can detect fiber orientation simultaneously at each pixel within an image.
Overview of state of the art with the presented methods, evaluated materials and the image acquisition equipment used
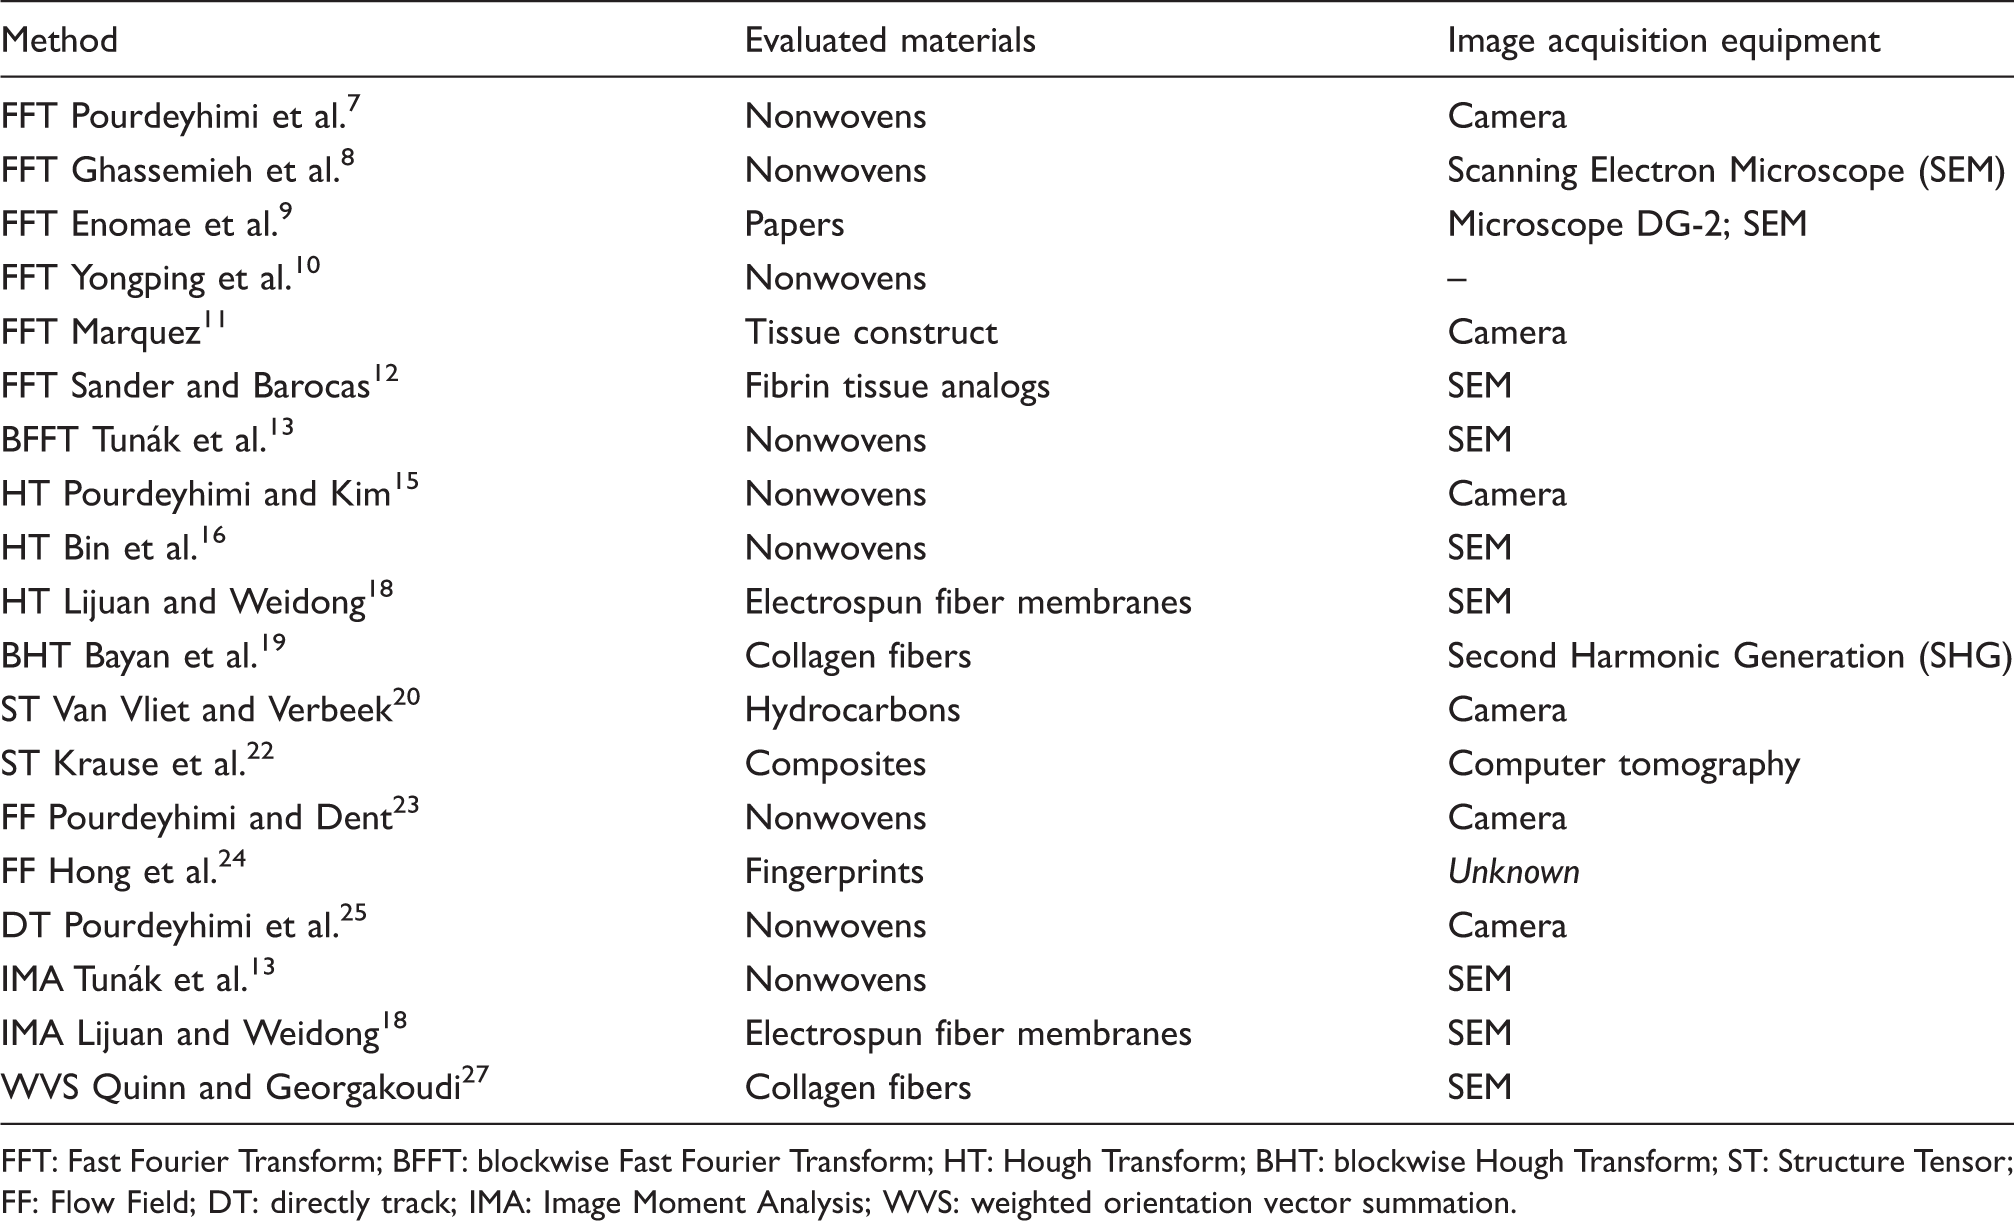
FFT: Fast Fourier Transform; BFFT: blockwise Fast Fourier Transform; HT: Hough Transform; BHT: blockwise Hough Transform; ST: Structure Tensor; FF: Flow Field; DT: directly track; IMA: Image Moment Analysis; WVS: weighted orientation vector summation.
Based on the analysis of the existing methods, the research gap that this work focuses on is the analysis of nonwovens with high basis weight and complex structural properties within a digital image acquired by an industrial camera. So, in this paper, an assemble method has been developed for fast and non-invasive measurement of the fiber orientation distribution and local orientation with a focus on fiber injection molded nonwovens.
Development of methods for fiber orientation calculation
In this work, an industrial camera was used to acquire nonwoven images. Because of the limit of image resolution, the images were preprocessed to enhance the local structure of fibers and rovings. The original BFFT method can efficiently and accurately measure the global ODF of nonwovens. However, in the original BFFT method the calculated orientation distributions of each subwindow are used to calculate the overall ODF with the same factor. So, in this work, it was improved by assigning adaptive weights to each subwindow. In addition, the original BFFT method cannot provide the orientation of each foreground pixel, which causes an information loss of fiber orientation. To overcome this deficit, in this work a new method called Structure Tensor Thinning (STT) based on the ST method was developed.
The assemble measurement method consists of three main parts, as shown in Figure 1: image preprocessing, BFFT and STT. In the first step, the acquired images are cropped, denoised, enhanced and segmented by an adapted image preprocessing workflow. Then, by using BFFT an accurate global ODF can be calculated quickly and reliably. In this work, we improved this method with the weighted summation of preferred orientations of all image blocks for obtaining the global ODF. Finally, the images are measured by the newly developed STT method, which can provide the local orientation of each pixel and the global ODF based on the local information. The global ODFs determined by these two different methods can be compared with each other.
Processing workflow of the assemble method for the determination of the fiber Orientation Distribution Function. CLAHE: Contrasted Limit Adaptive Histogram Equalization; BFFT: blockwise Fast Fourier Transform; FFT: Fast Fourier Transform; GC: Gaussian Curvature; ODF: Orientation Distribution Function.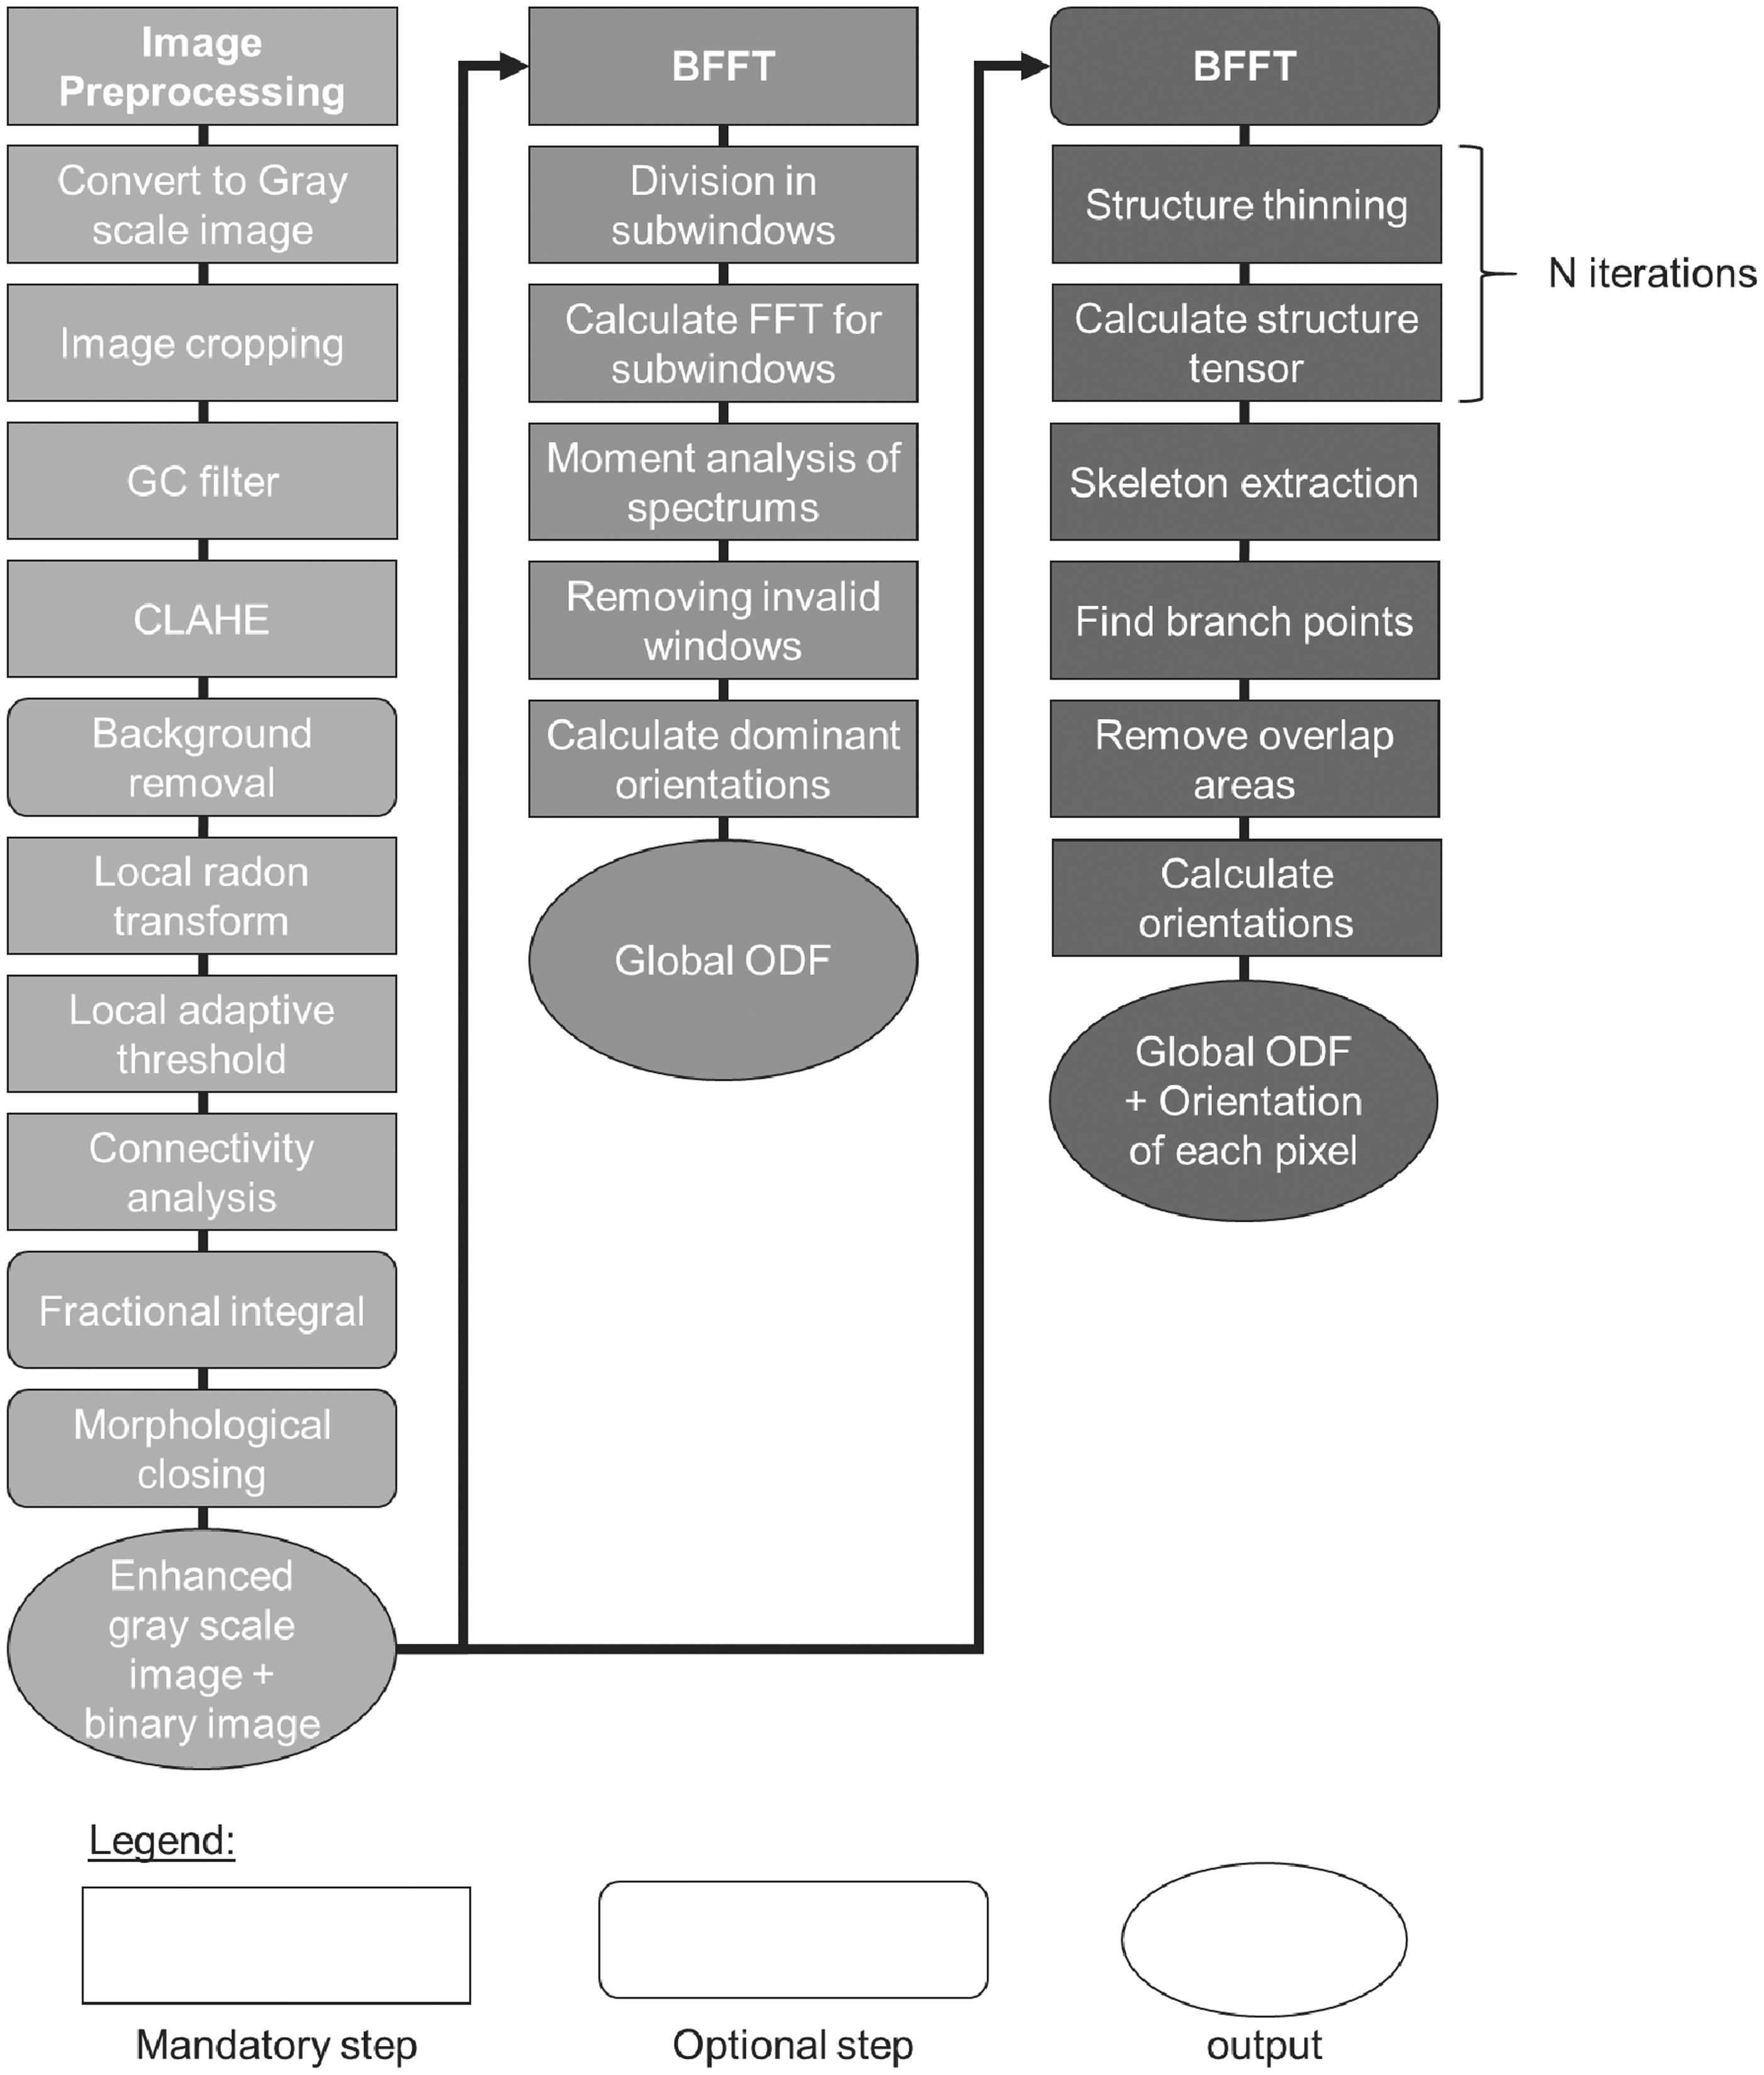
Image preprocessing
Parameter settings used for image preprocessing
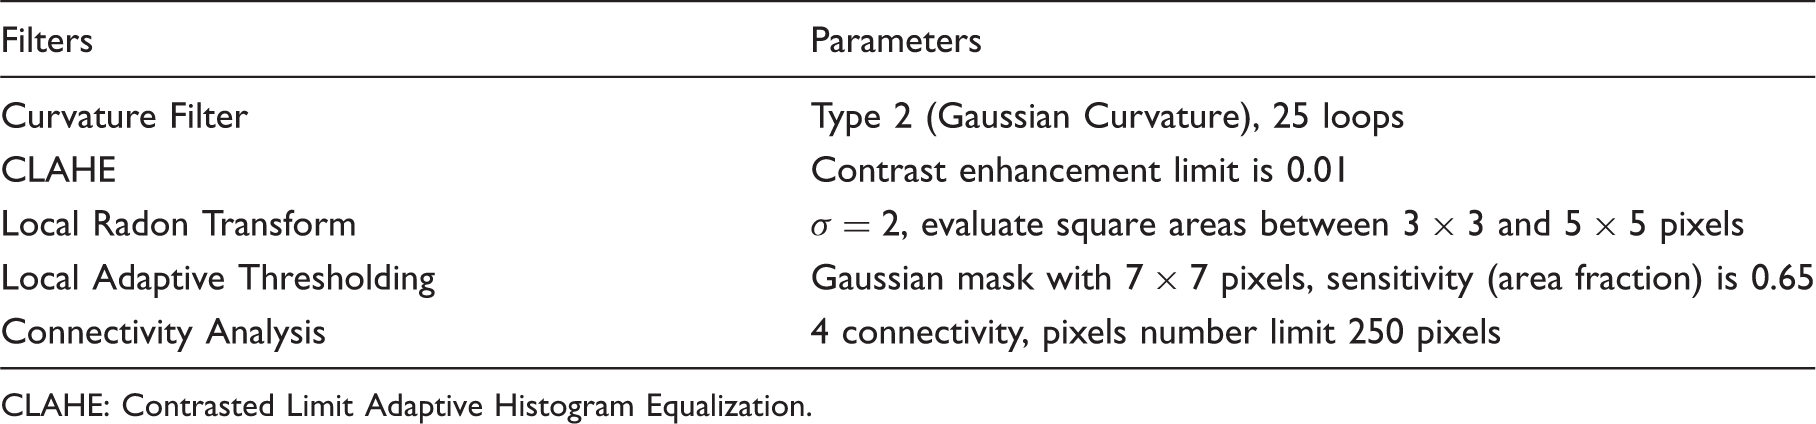
CLAHE: Contrasted Limit Adaptive Histogram Equalization.
In Figure 2, the results of image preprocessing by original histogram equalization and the newly developed preprocessing methods are illustrated. Based on the double-contrast enhancement method (CLAHE) and local contrast enhancement method in our image preprocessing method, the detailed structure of fibers and rovings in nonwoven images are much clearer than the results based on the original histogram equalization. This significantly improves the measurement of the orientation of fibers.
(a) Original transmitted light image of a fiber injection molded nonwoven sample of 400 mm × 400 mm with resolution of 2000 × 2000 pixels. (b) Image after the original histogram equalization. (c) Gray value image after the presented preprocessing. (d) Binary image after the presented preprocessing.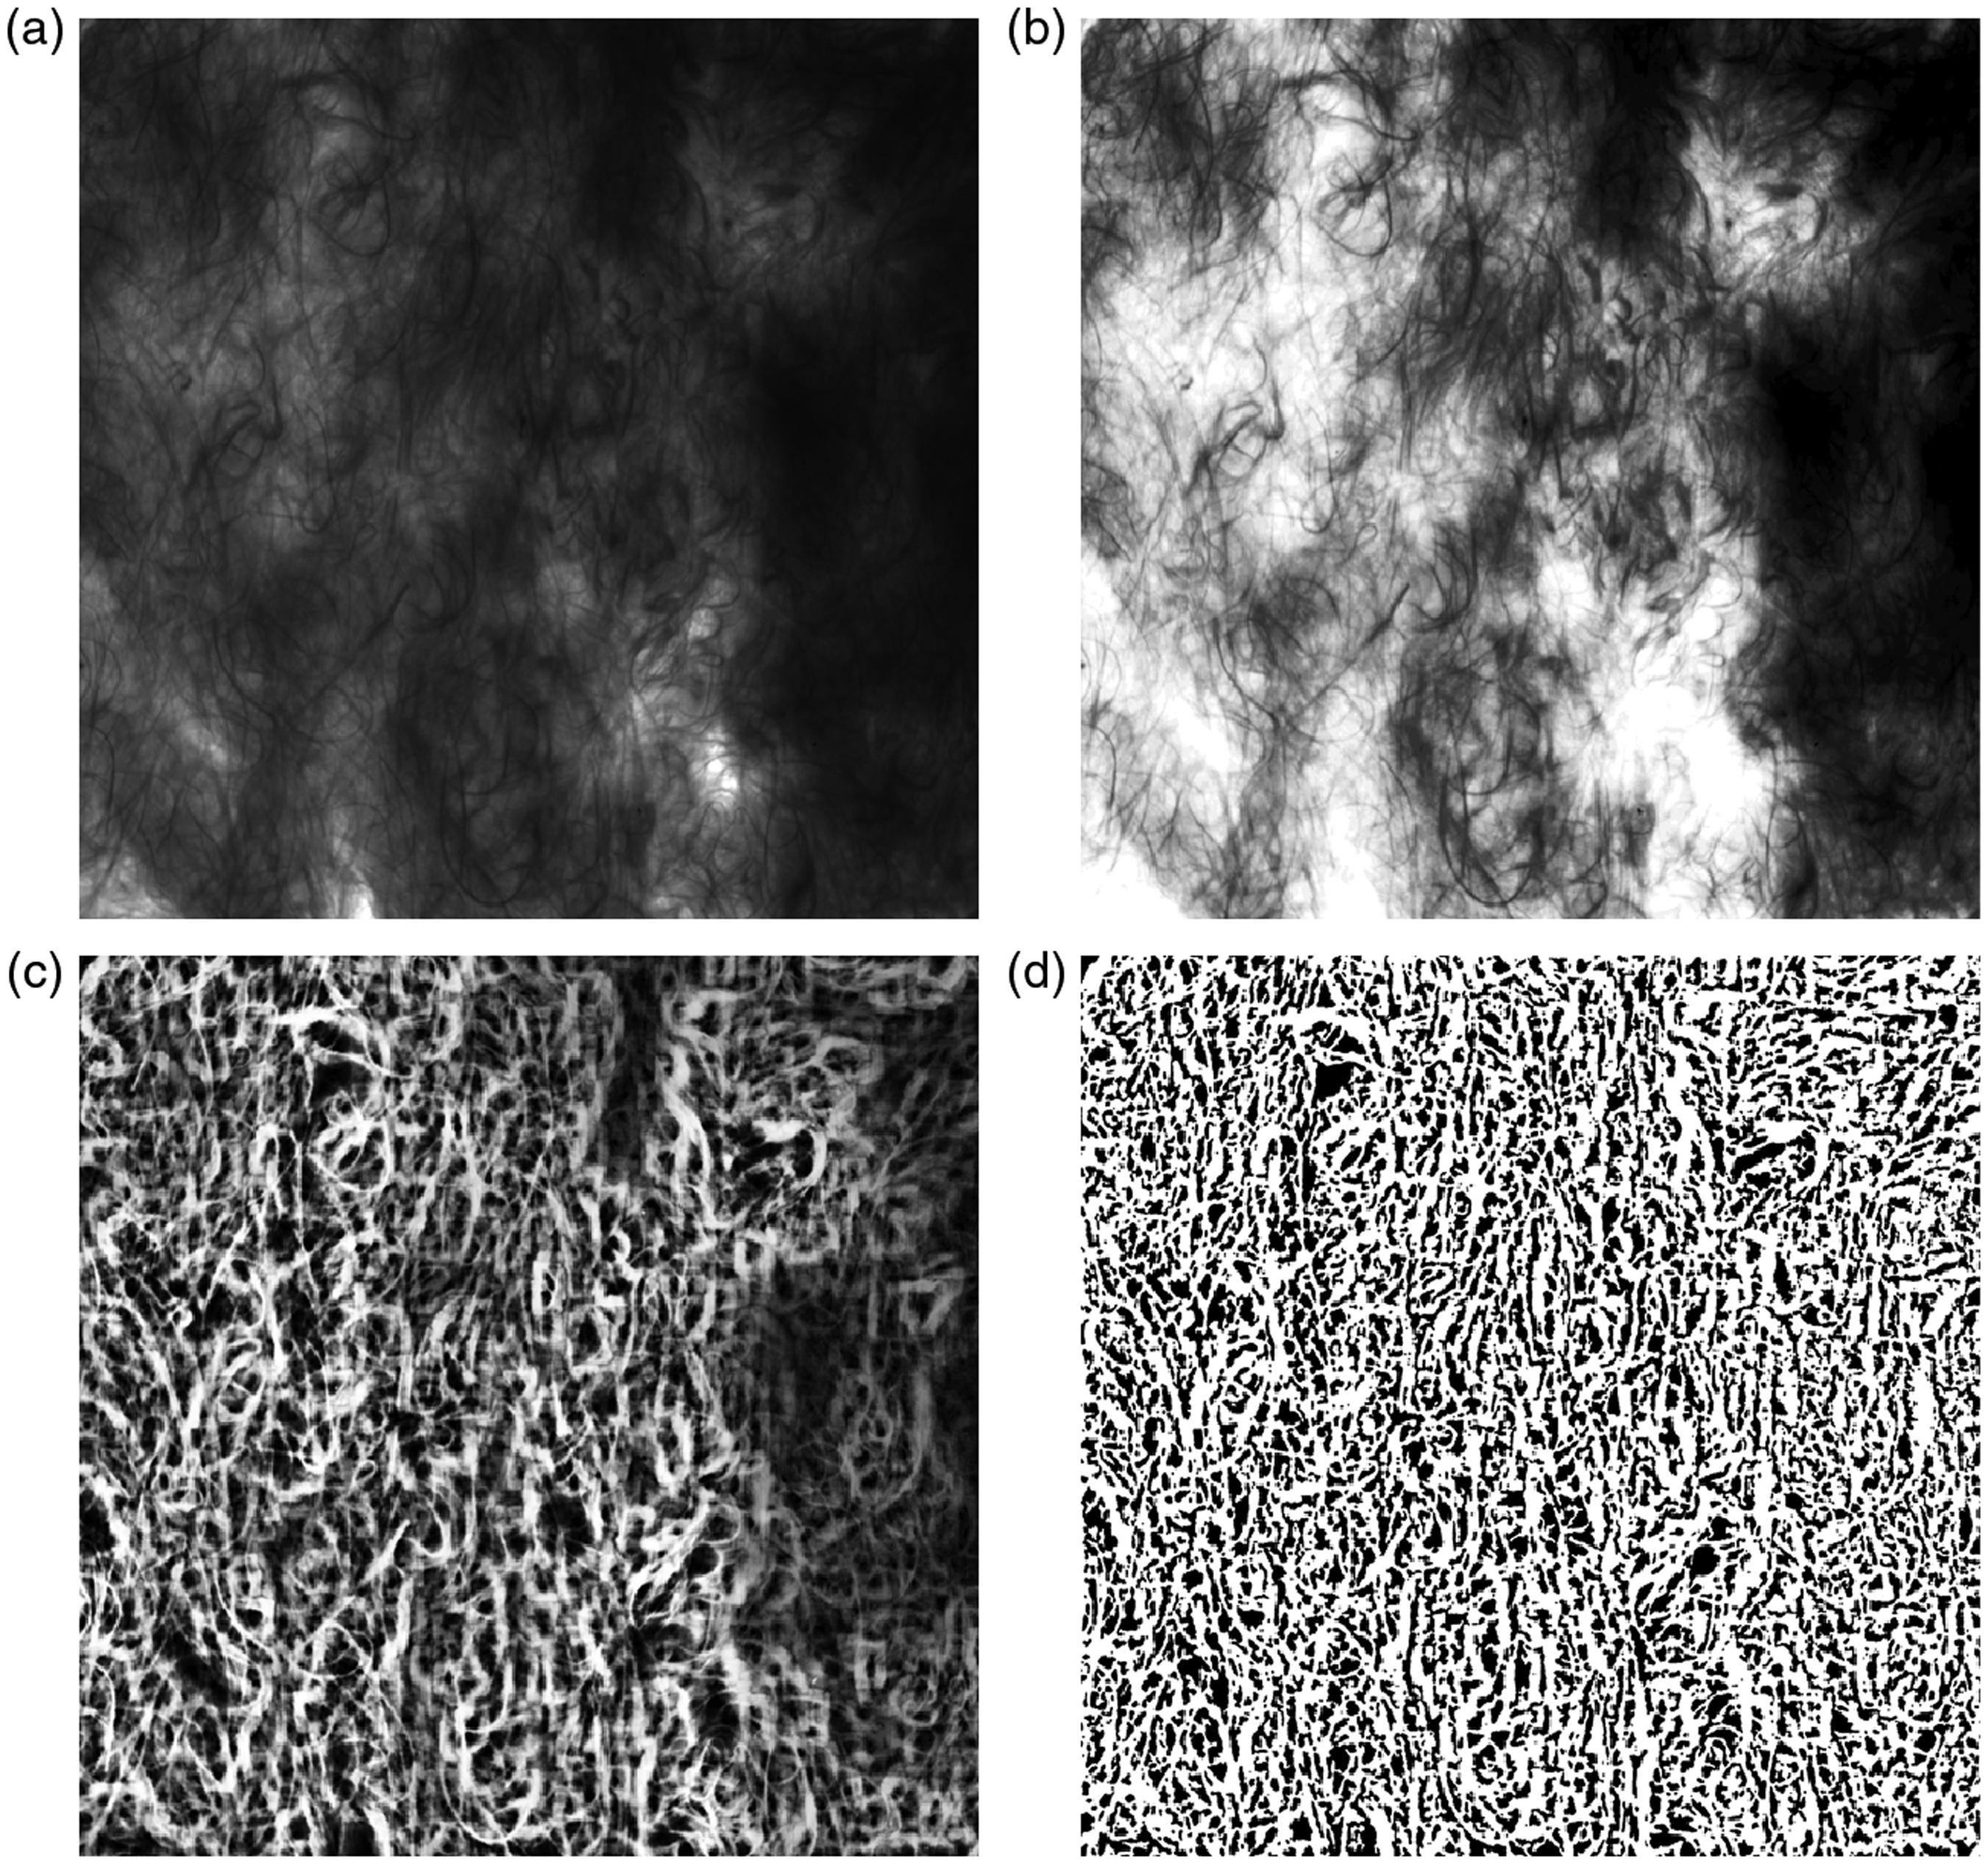
Improved blockwise Fast Fourier Transform
As discussed before, the BFFT method can efficiently and accurately measure the global ODF of nonwoven images. In addition, FFT methods are robust to different types of fibrous materials. Therefore, in this work BFFT is adopted for an efficient and accurate first overview of the ODF of nonwoven fabrics.
In Tunák et al., 13 each dominant orientation of a valid subwindow is assigned with the same weight (uniform weight). However, this is only reasonable when the fiber density is low and fibers are parallel aligned. In FIM nonwovens, the fiber density is very high and fiber alignment very complex, which makes the fiber structures in different subwindows very different from each other. Therefore, regardless of the specific fiber structure in each subwindow, assigning the same weight to calculate dominant orientations from different subwindows is not reasonable.
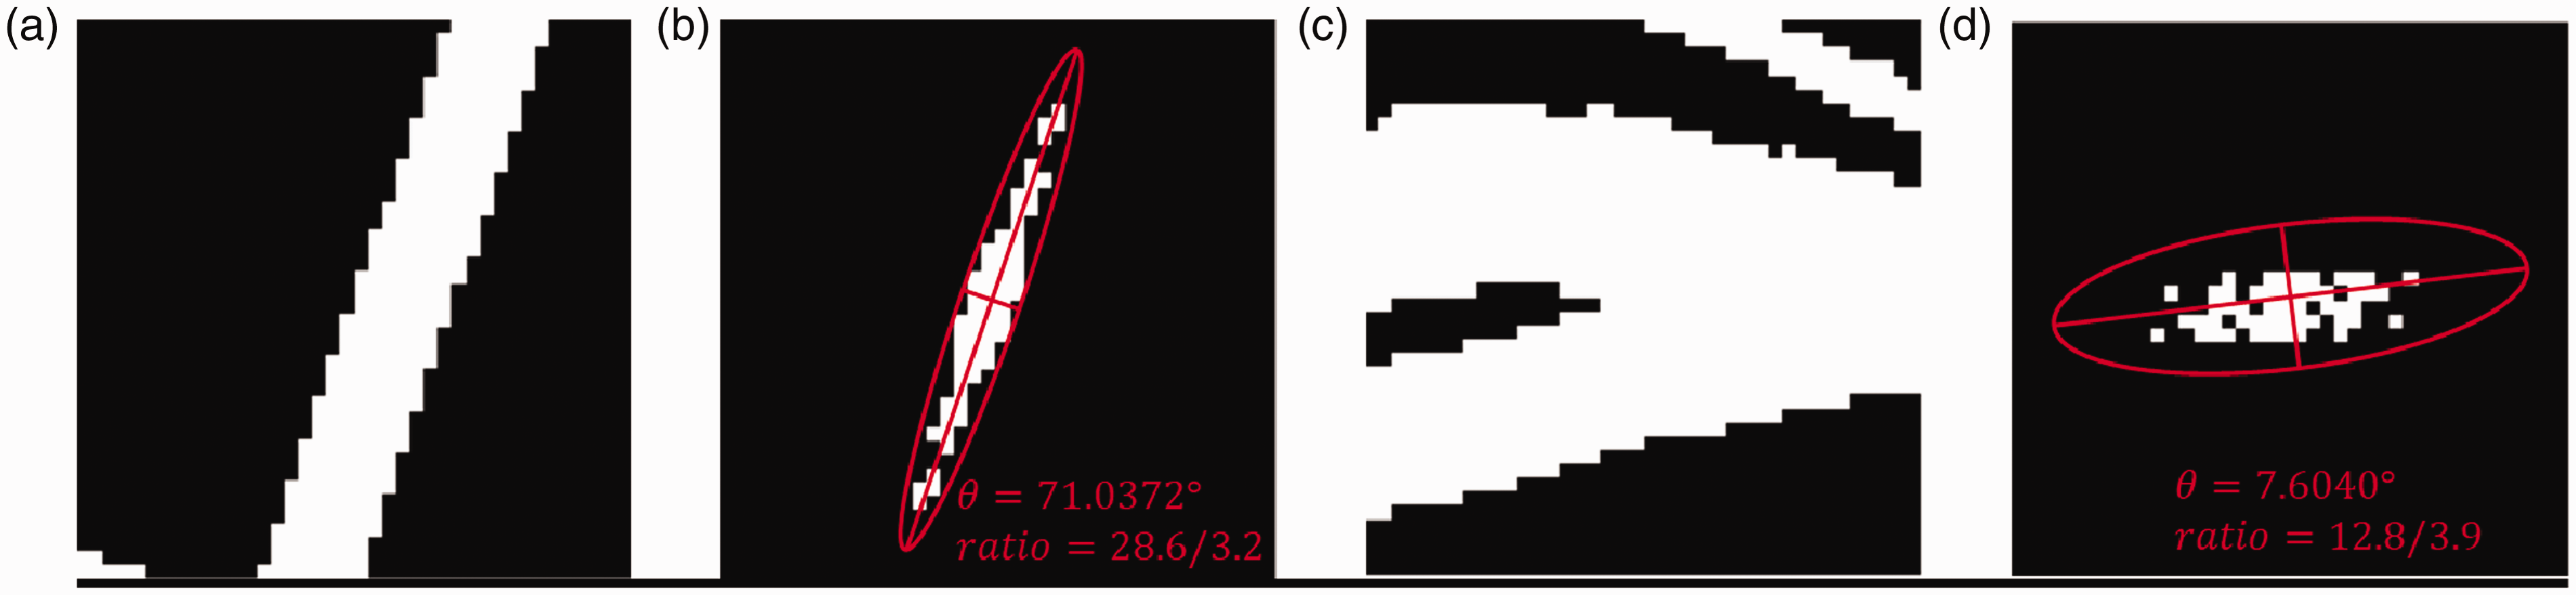
The assignment of weights should consider fiber density and their specific alignment. The fiber density is represented by the area fraction. The specific fiber structure is considered by the ratio of the long axis and the short axis. In Figure 3 the relation between them is shown. This means that when there are more fibers with dominant orientation in one subwindow, the ratio is larger than the ratio of a subwindow with fewer fibers of dominant orientation. In this work, a constant a was set as the correlation coefficient of the ratio of dominant fibers and the ratio of the long and short axes. The adaptive weight of one dominant orientation is defined as
Moment analysis of the binary spectrum: (a) subwindow 1 and (b) its spectrum; (c) subwindow 2 and (d) its spectrum.
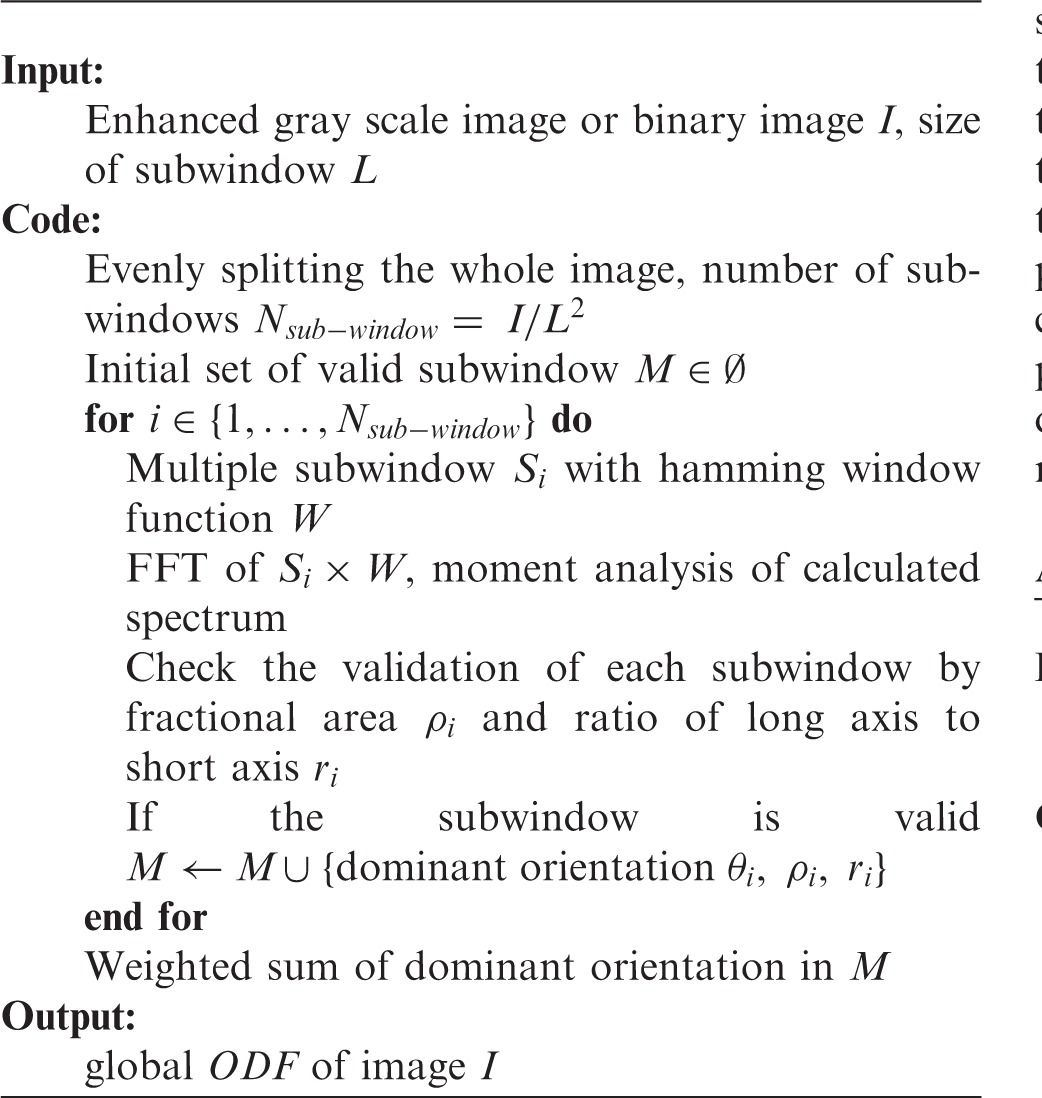
The whole determination of the fiber ODF with the improved approach is described in Algorithm 1, which shows the pseudocode of the implementation. For the results of this paper the implementation has been executed in MATLAB. The workflow of the computation corresponds to the steps described in Figure 1.
Enhanced gray scale image or binary image I, size of subwindow L
Evenly splitting the whole image, number of subwindows
Initial set of valid subwindow
Multiple subwindow
FFT of
Check the validation of each subwindow by fractional area
If the subwindow is valid
Weighted sum of dominant orientation in M
global
Structure Tensor Thinning
In this section the detailed algorithm of the newly developed Structure Tensor Thinning (STT) method is presented. The major change of STT compared to the ST are the multiple iterations of thinning and orientation measurement. In every loop except the last, firstly, the ST and corresponding orientation of each pixel are calculated by the ST. Secondly, the edges or edge areas are detected and the orientation of pixels belonging to these areas are stored. Thirdly, fibers are thinned by removing the pixels in the edge areas. Finally, the remaining parts of each fiber are smoothed and will be the input image for the next loop. In the last loop, there is no thinning procedure, the remaining web structure is evaluated by the ST and the calculated orientation of all remaining foreground (pixels and roving) pixels will be stored. Through this algorithm, despite the width of fibers and rovings, the orientation of each pixel belonging to fibers can be measured. The algorithm of STT is given in Algorithm 2 as pseudocode.
In addition, before the calculation of global ODFs, there are three steps to search the overlap areas of different fibers. Since STT is based on 2D images, the areas where the fibers in different planes overlap cannot be accurately analyzed. The orientation measurement results of pixels in the overlap areas are not only inaccurate but also disturb the accuracy of the further calculated global ODF of nonwovens. In order to solve this problem, an overlapping area positioning and removal procedure is adopted. Firstly, the skeleton of the fibers is calculated by the medial axis transform algorithm. In this work, the 8 connectivity in the 2D image is used in this algorithm, which means that all eight neighboring pixels are considered for the tracking (see Pourdeyhimi et al. 25 ). Then, the branch points are found by morphological analysis. Finally, a certain number (here a square area in the size of 20 × 20 pixels) of fiber pixels surrounding these points are determined and their orientation information is neglected.
Binary Image I, loops number N, size of mask for overlap areas removing l
Initial set of orientation map
Calculate structure tensor of pixels in I
Extract the edge pixels set
Add the orientation
Remove the edge pixels from current image
Extract the skeleton of webs in orientation map S
Find the branchpoints set B of skeleton S
Remove the fiber pixels set of the square area P surrounding B, the reminded
Statistic the orientation of foreground pixels in
global
Experimental evaluation of fiber orientation measurement techniques
In this section, the evaluation test images and data analysis methods used to evaluate the developed methods are presented. On the one hand, the fiber orientation measurement method should accurately measure the ODF of different types of nonwovens. The accuracy means not only the dominant peak orientation but also the variance of each peak. On the other hand, it must reliably and robustly measure the ODF based on different types of fiber distribution function as well as nonwoven types, such as the fiber form or the web structure. By considering these requirements, the test image sets are constructed.
Data smoothing filter
In order to obtain accurate overall trends and eliminate local fluctuations in the measured ODF, in general, in related works a data smoothing procedure has been adopted. There are two major methods: one transforms the ODF in a 1-degree bin or higher range bin, mostly 5-degree or 10-degree; 7 the other uses a local smooth filter, such as moving average or kernel regression. 13 The first method loses too much information of the ODF and sometimes artificially enlarges the measurement error, especially for the measurement of dominant orientations. Therefore, in this work the kernel regression with a 7 degree span Gaussian kernel is used to smooth the measured ODF.
Evaluation indexes
Another relevant aspect is how to evaluate the similarity between different ODFs. In related works, the dominant orientation (peak orientation)
7
and entropy of the ODF
19
were used for the comparison of differently computed ODFs. Both are distribution characters of a single ODF. To compare the similarity between two ODFs (for example, the measured ODF and the reference ODF), different indexes should be compared separately and there is no unified standard that takes all indexes into account. Therefore, in this work the Kullback–Leibler (KL) divergence
30
is adopted as a standard to compare similarity between different ODFs. In mathematical statistics, the KL divergence (also called relative entropy) is a measurement of how one probability distribution is different from a second. For two probability distributions P and Q, the KL divergence is defined as

Simulated images
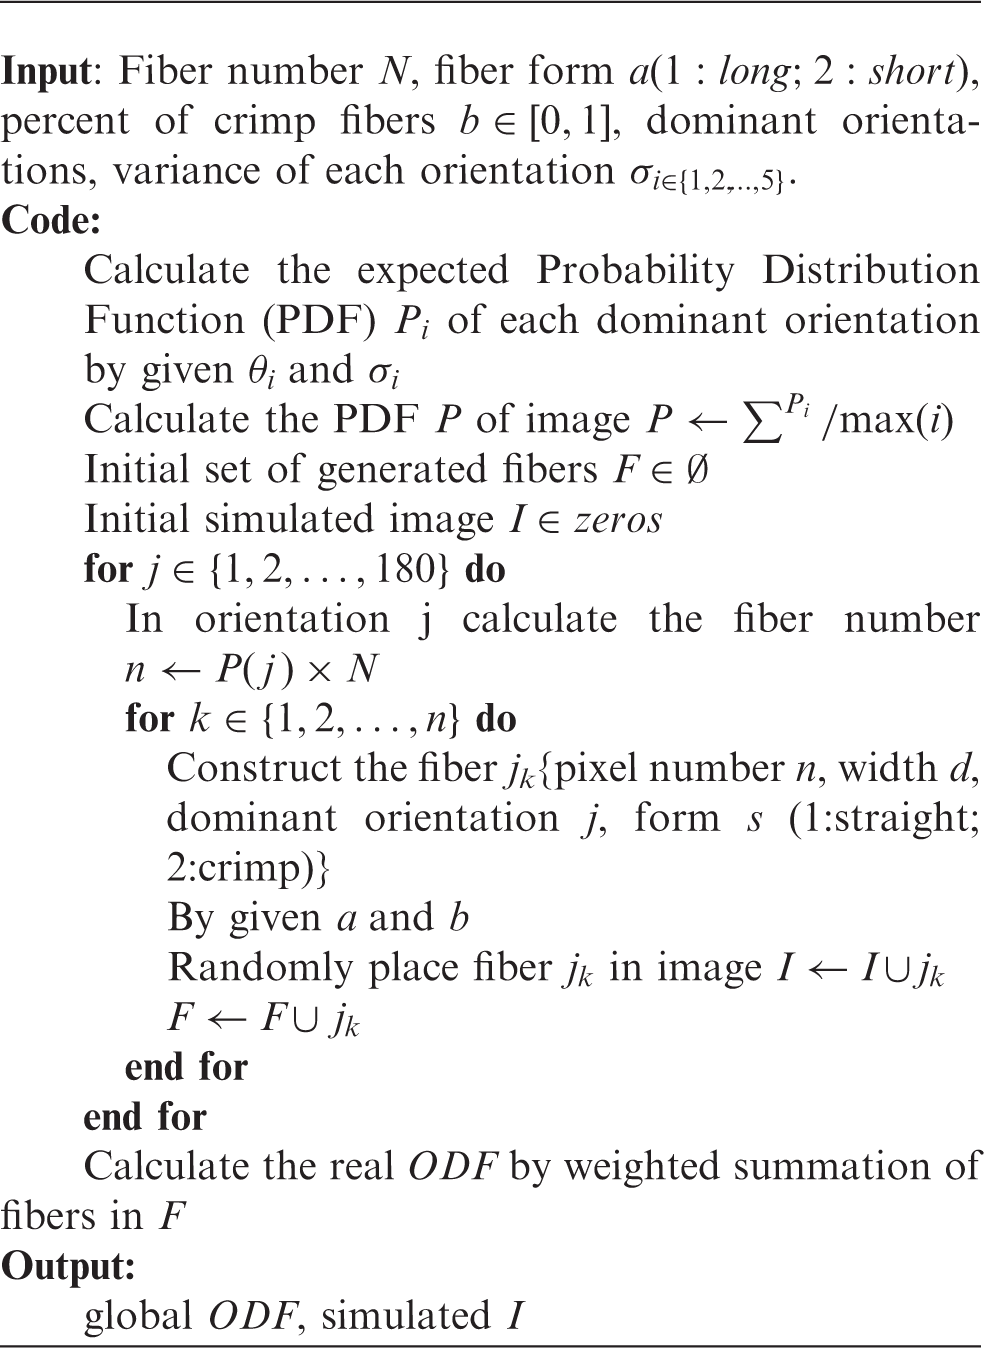
In practice, it is almost impossible to get the true ODF of real nonwovens. Therefore, a series of simulated images with different human-controlled ODFs was generated. In this work, we refer to the ‘arcs replaced by straight line’ idea, which was presented by Pourdeyhimi et al. 6 The planar structure of simulated images should be as close to the real situation as possible. After analysis of the nonwovens in this work, five important structural properties are represented by simulated images, which are length, width, crimp, density and orientation distribution modal of fibers. Aimed to satisfy these requirements, our simulated images have been constructed. By using this algorithm simulated images with 2000 × 2000 pixels and different structural properties have been constructed for evaluating the accuracy and reliability of different orientation measurement methods. Each fiber in a simulated image is constructed separately to meet the requirements of different fiber forms. Then these fibers are rotated based on the given ODF. Next, they are randomly placed on the simulated image for a near uniform distribution. Finally, based on this known structural information, the true ODF is calculated as the reference in the evaluation of our approach. The pseudocode for the generation of these simulated images is given in Algorithm 3.
Calculate the expected Probability Distribution Function (PDF)
Calculate the PDF P of image
Initial set of generated fibers
Initial simulated image
In orientation j calculate the fiber number
Construct the fiber j k {pixel number n, width d, dominant orientation j, form s (1:straight; 2:crimp)}
By given aand b
Randomly place fiber
Calculate the real
global
In order to evaluate the required characteristics mentioned before, three sets of simulated images have been generated. One set of images consists of short and crimped fibers, one set of images consists of long and straight fibers and a third set of images consists of long and crimped fibers. In each set the distribution models of fibers in different images are different as shown in Figure 4. In each set there are five different ODF models with different numbers of dominant orientations and variances. Table 3 shows the number of dominant orientations and the variance of each of these dominant orientations (peak) in parentheses for the different models.
Simulated images with 2000 × 2000 pixels.. Image set 1 with short, crimp fibers and (a) one, (b) two and (c) three dominant directions. Image set 2 with long, straight fibers and (d) one, (e) two and (f) three dominant directions. Image set 3 with long, crimp fibers and (g) one, (h) two and (i) three dominant directions. Structural parameters of simulated images in different image sets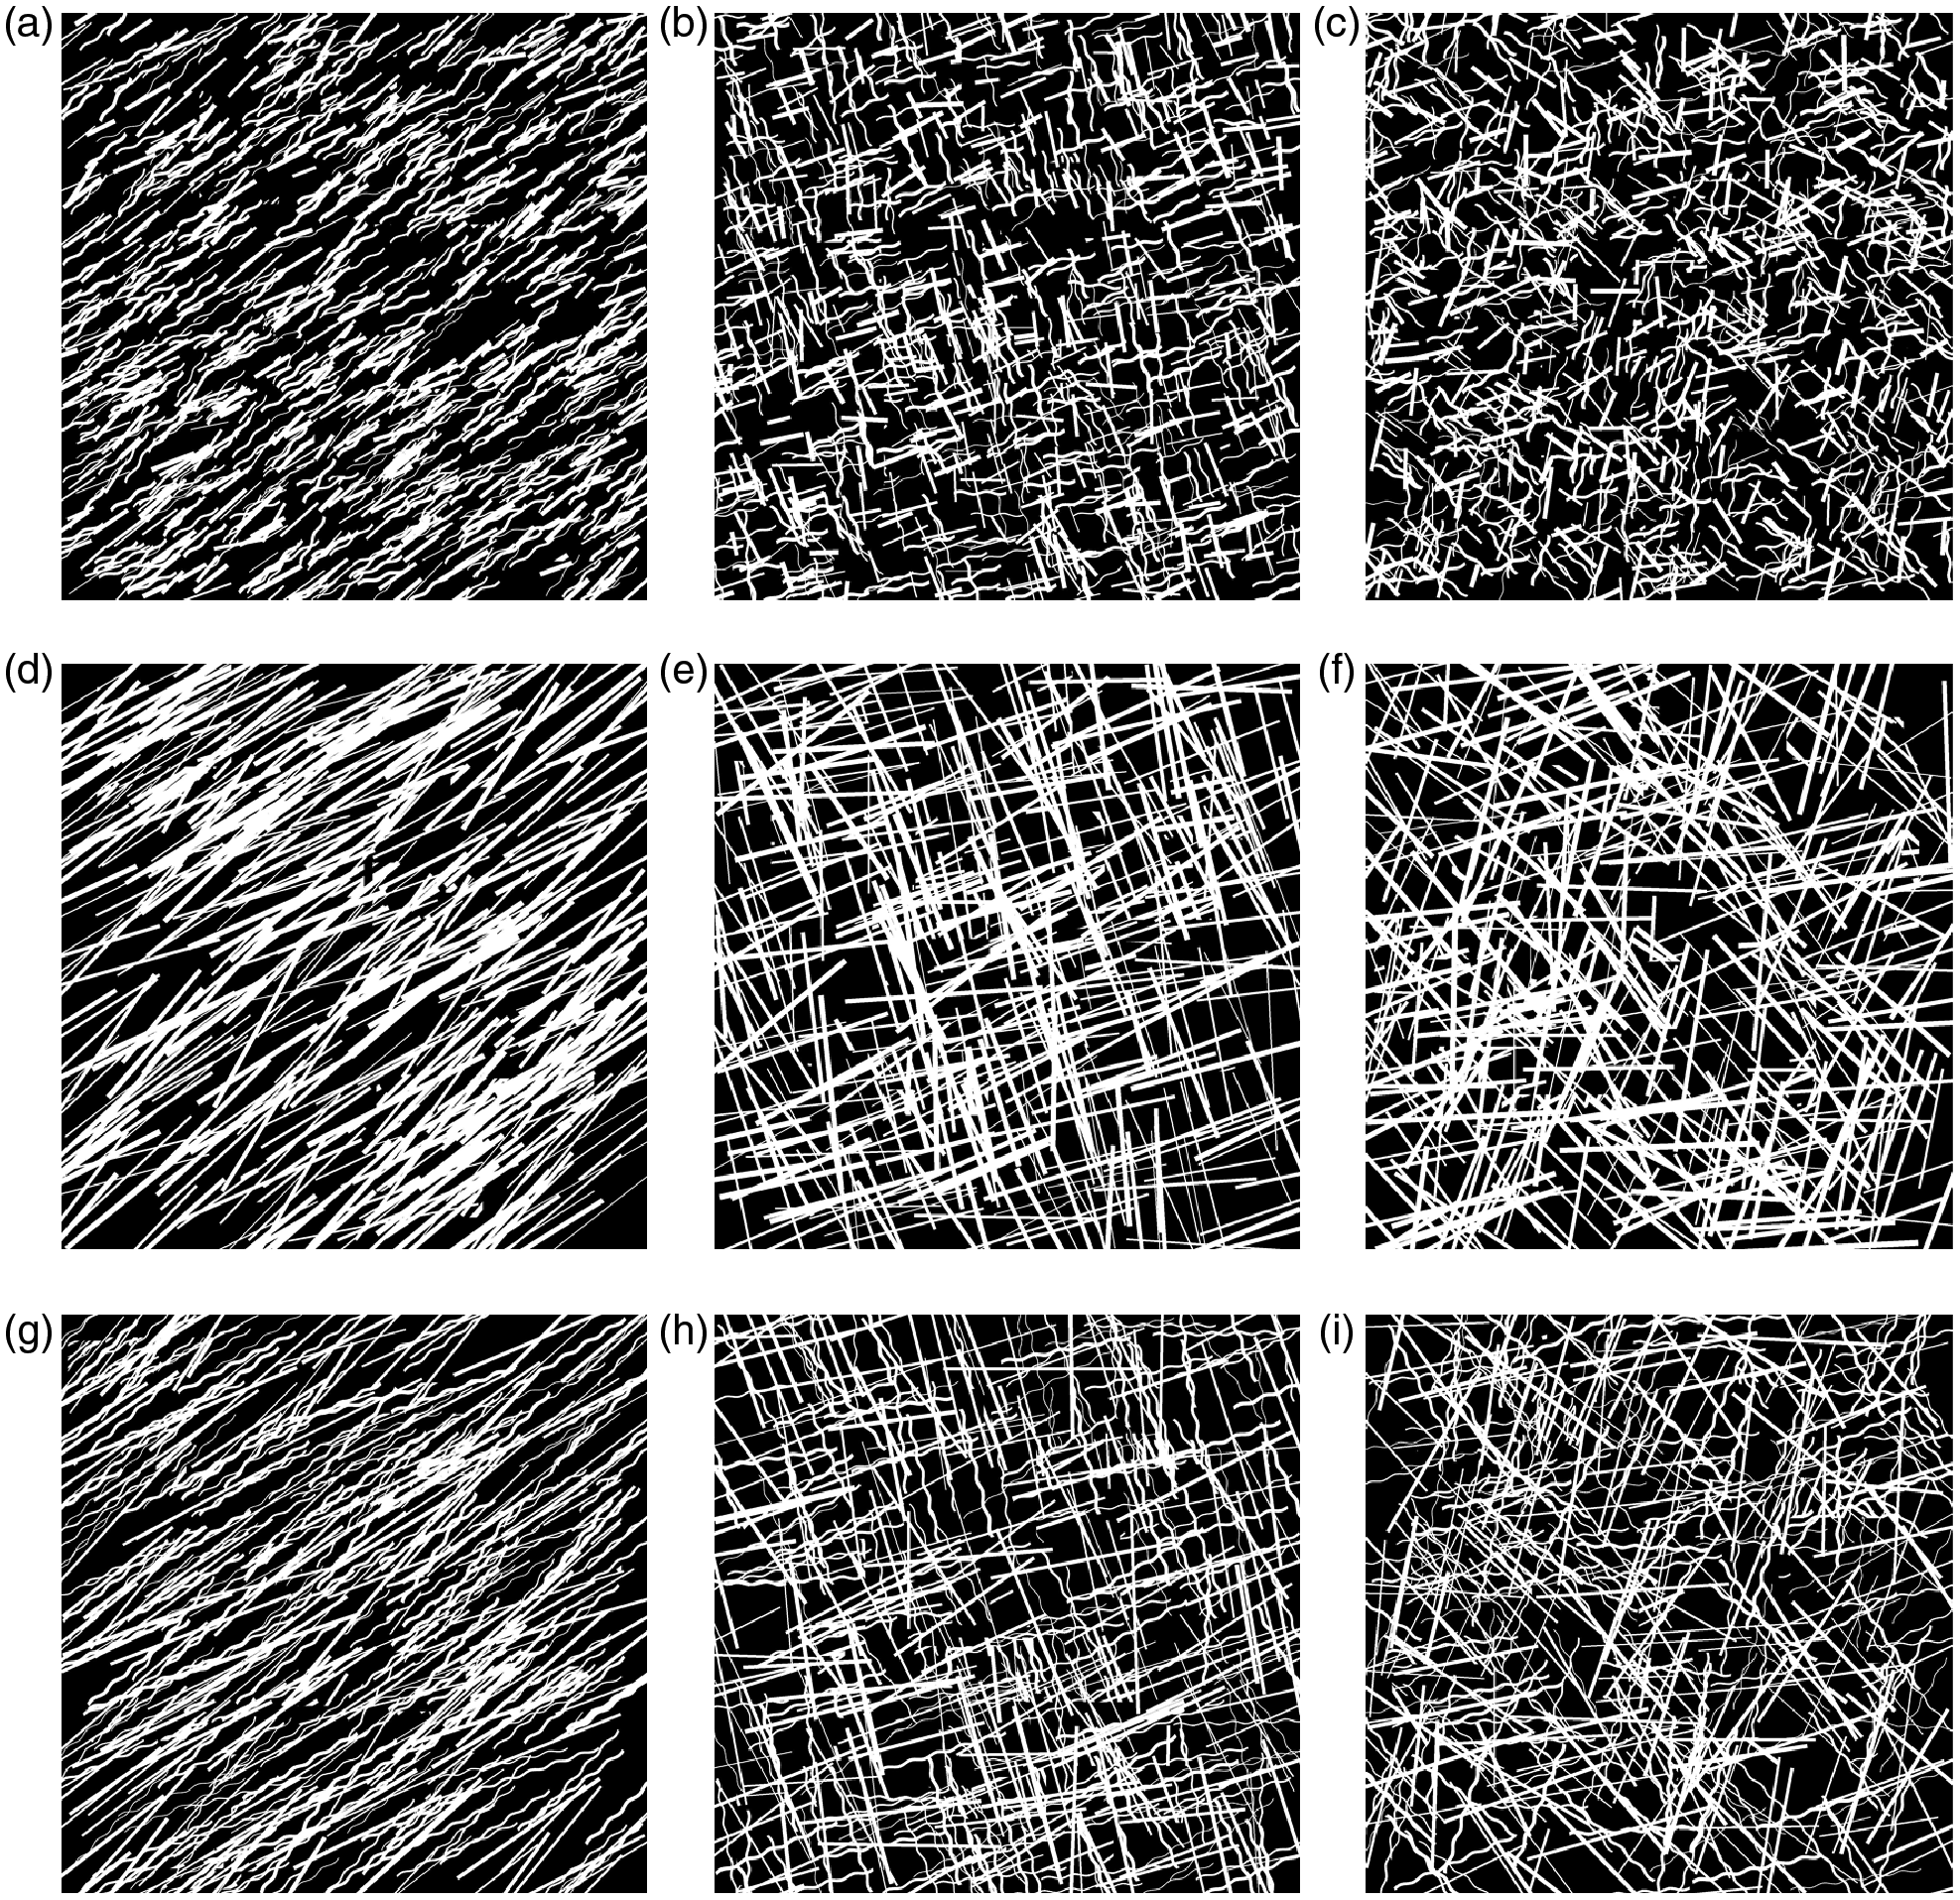
The simulated images in actual nonwoven fabrics usually have an ODF with a maximum of two peaks. Therefore, the maximal number of peaks is controlled as three, which is already more complex as expected in real cases. Also, to evaluate the reliability of the methods, five different images have been generated with the same number of peaks but different orientations.
Real images
For the evaluation of the orientation measurement methods in this work, there are also three sets of real nonwoven images that are used to evaluate the ODF measurement methods, as shown in Figure 5. Image acquisition has been carried out using the mold integrated camera system presented by Moll et al.
5
In this setup the camera UI-3290E from the company IDS (Obersulm, Germany) with a 4104 × 2174 pixel CMOS sensor and a Tamron M111FM08 lens has been used. Aperture has been set to f/22 in order to get the maximum depth of focus.
Real nonwovens images of (a) a fiber injection molded sample (Set A), (b) a needled mat sample with additional weave (Set B) and (c) a powder mat sample (Set C) with sample size of 400 mm × 400 mm and resolution of 2000 × 2000 pixels.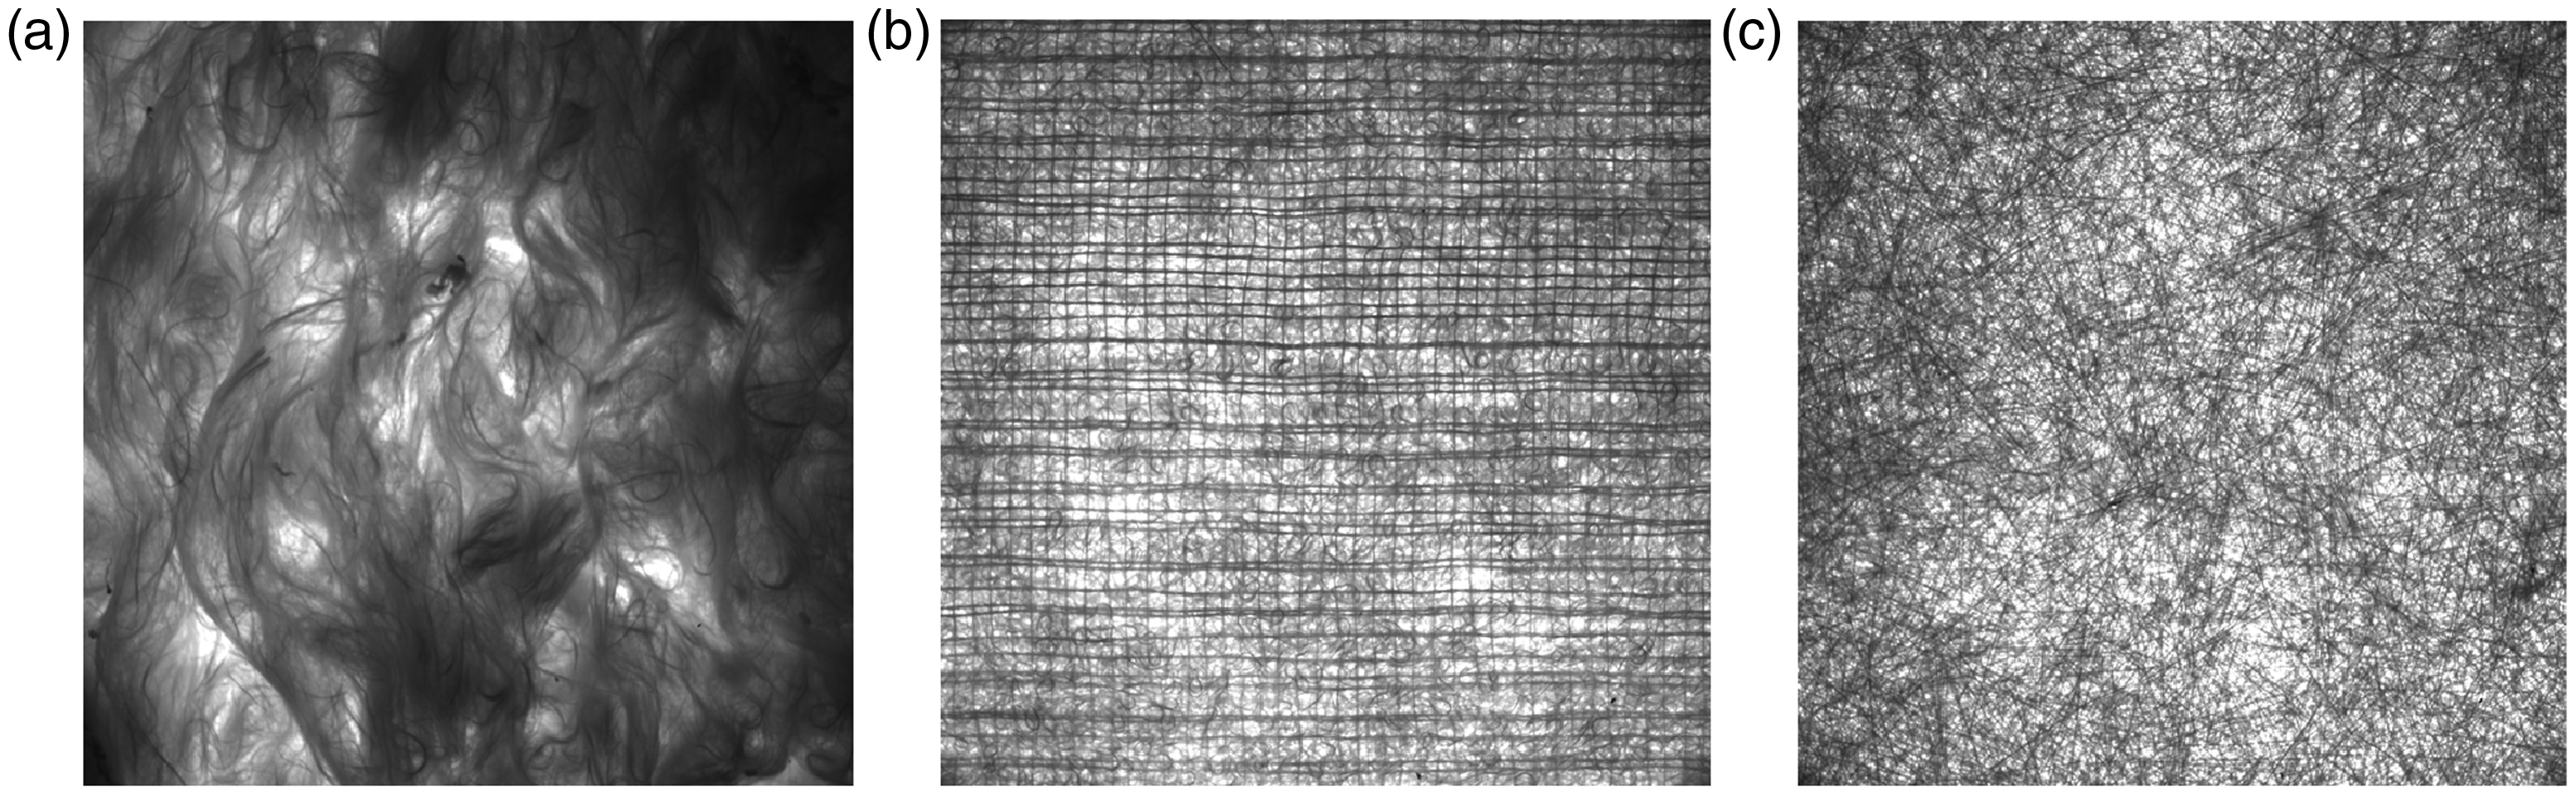
These three sets consist of different types of nonwovens. The first set, A (images A1–A5), consists of five samples of fiber injection molded nonwovens with a basis weight of around 1250 g/cm2 made of a 2400 tex glass fiber produced on a FIM test rig at wbk Institute of Production Science. The second set, B (images B1–B5), contains five samples of a needled glass fiber mat with 610 g/m2 basis weight including a second layer of a coarse weave produced by P-D Glasseiden GmbH (Oschatz, Germany). Hence for this weave, the ODFs of nonwovens images in Set B should have two peaks at 0° and 90°. Set C (images C1–C5) contains five powder mats with a basis weight of 450 g/cm2 with very good surface distribution also produced by P-D Glasseiden GmbH. The orientation distribution of fibers in Set C is more uniform than the nonwovens in Sets A and B. The nonwoven samples in all sets have a size of 400 mm × 400 mm. These obvious structure features of real nonwoven images have been used to evaluate the accuracy of the measurement methods.
The calculations were carried out on a personal computer equipped with an i7-8565U CPU (1.80 GHz), 16.0 GB RAM and Windows 10 Pro using MATLAB R2018b. For the evaluation of the real images with a resolution of 2000 × 2000 pixels the preprocessing took 216 s, the BFFT method 250 s and the STT method 540 s. The given values for the computational time are average values from the evaluation of all images in Sets A–C. As already described by Tunák et al., 13 the size of the subwindows affects computing time significantly.
Measurement results of the evaluated images
In this section the evaluation results based on simulated and real images by BFFT and STT are illustrated and discussed.
Simulated images
Firstly, the simulated images have been evaluated to study the influence of subwindow size and the effect of weighting the subwindows for the BFFT method. Figure 6(a) illustrates the KL divergence of the measured results by BFFT with 40 × 40, 50 × 50 and 100 × 100 pixels for the subwindow. The affiliation of the image numbers to the image sets and models can be taken from Table 4. The KL divergence in Figures 6 and Figure 7 is calculated from the smoothed measured ODF and the corresponding reference ODF. It can be noticed that the KL divergence is higher for larger subwindows than for smaller ones, which means that a smaller subwindow size leads to a more precise determination of the fiber orientation distribution. For all three sets the evaluation of the model with three peaks has the largest error between theoretical ODF and the computed one, whereas the model with only one peak has the best result. The accuracy also improves with a larger variance of fibers. It has to be noted, however, that the structural characters of nonwovens are normally very complex, so no general rule can be given for the calculation of a reasonable subwindow size. Our experience is that the size of subwindows should be decreased as the fiber density increases and the width of the fiber and roving decreases.
Evaluation of parameters for the blockwise Fast Fourier Transform method: (a) influence of subwindow size; (b) effect of the weighting factor. KL: Kullback–Leibler. Measurement of (a) image 23 (set 1), (b) image 48 (set 2) and (c) image 73 (set 3) with BFFT and STT compared to reference. Image number of simulated images in different image sets and models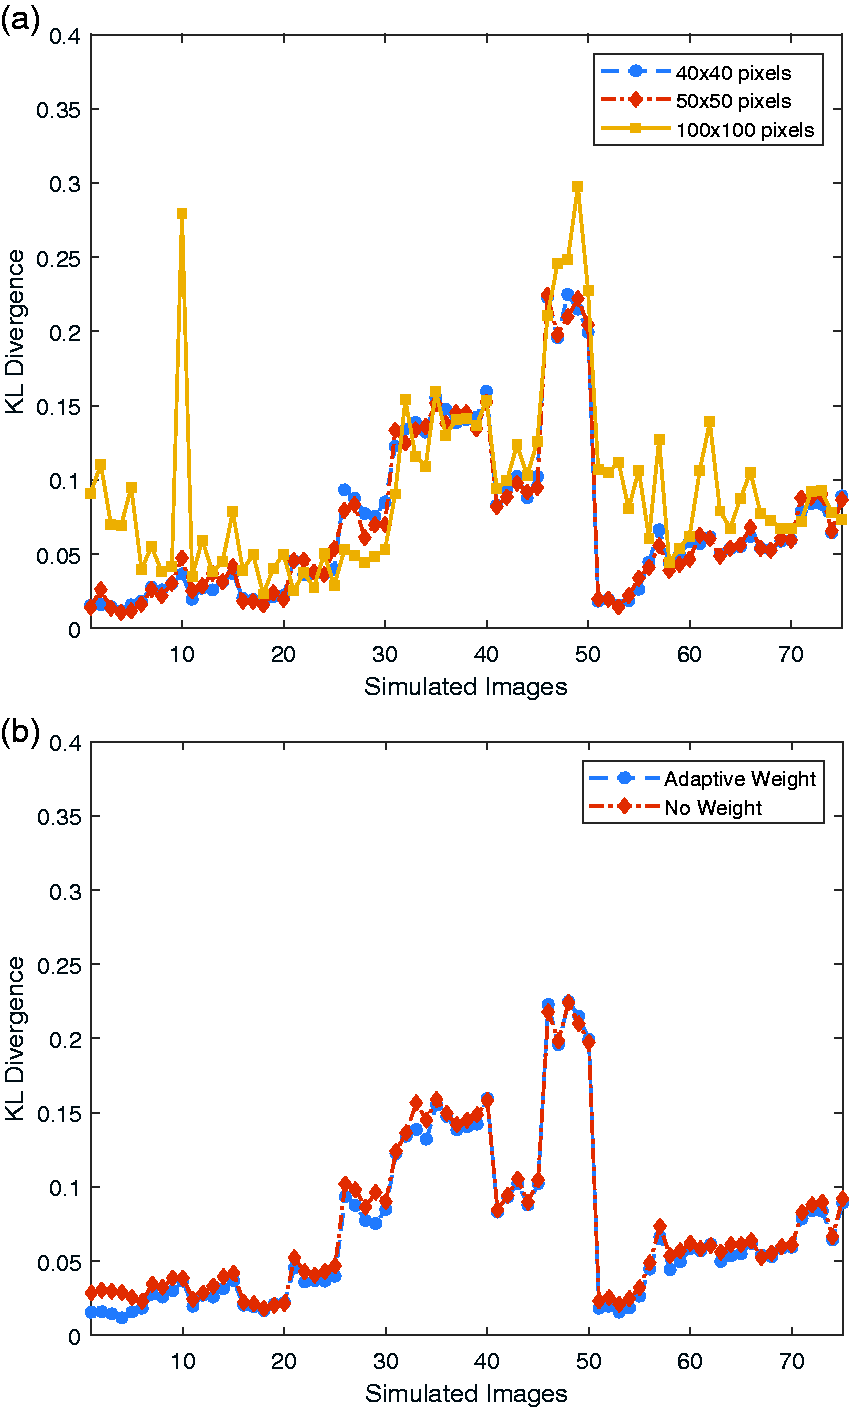
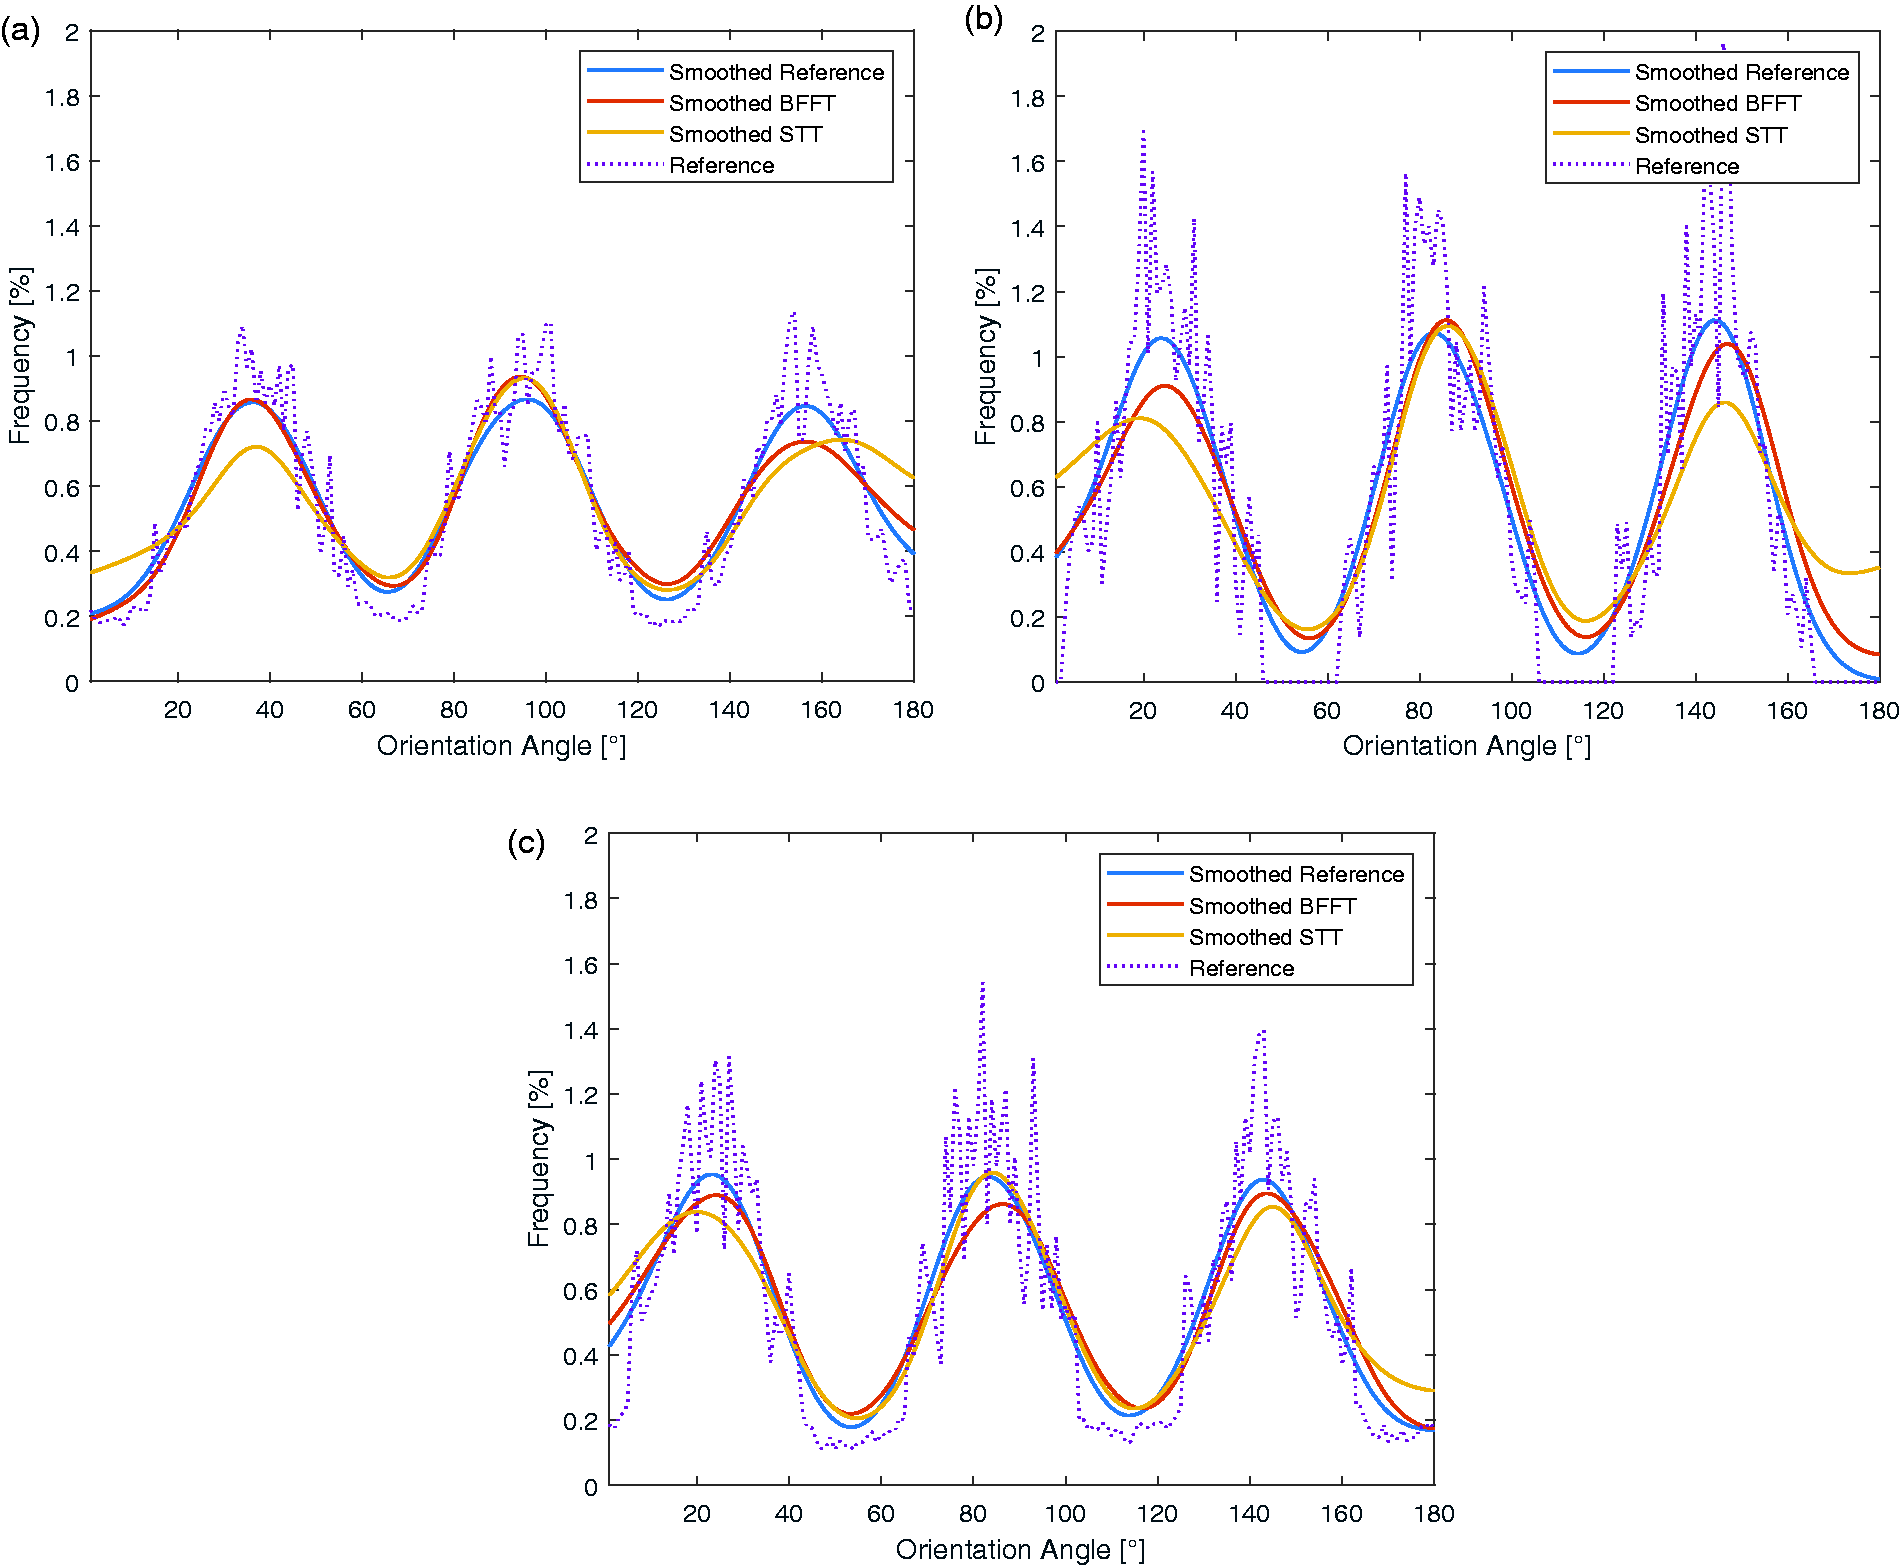
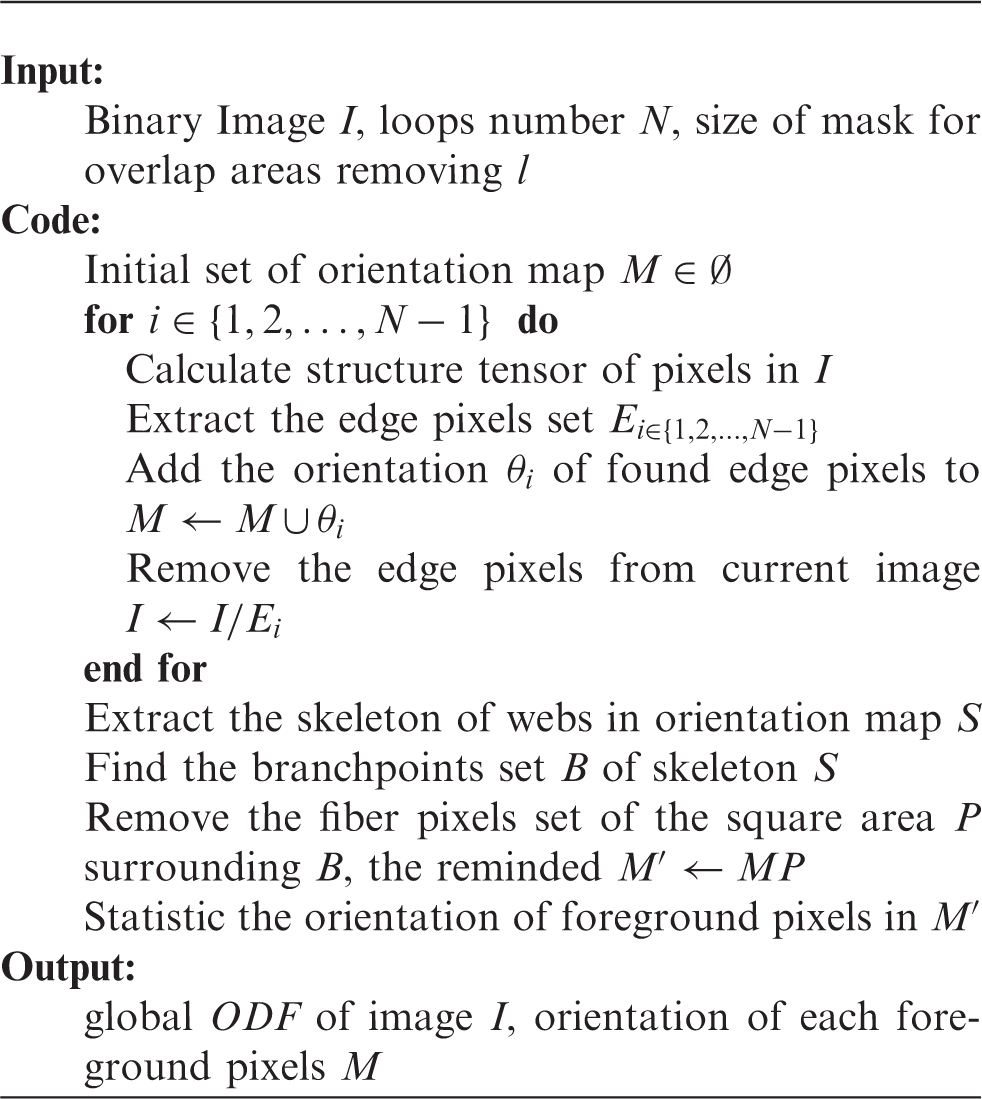
Figure 6(b) shows the KL divergence of the results measured by BFFT with a subwindow size of 40 × 40 pixels and adaptive weight for each subwindow and, respectively, no weight (as in Tunák et al. 13 ). By using an adaptive weight, the measured results are more accurate than the results without any weight. However, it is worth mentioning that the introduction of the new adaptive weight to the BFFT will also make the BFFT more sensitive to the web structure. Therefore, based on the evaluation of these two parameters, it is recommended that before the measurement of a new type of nonwoven fabric they should tuned.
Then, the simulated images have been analyzed by BFFT with KL divergence between measured and reference ODFs of measurements with (a) BFFT and (b) STT.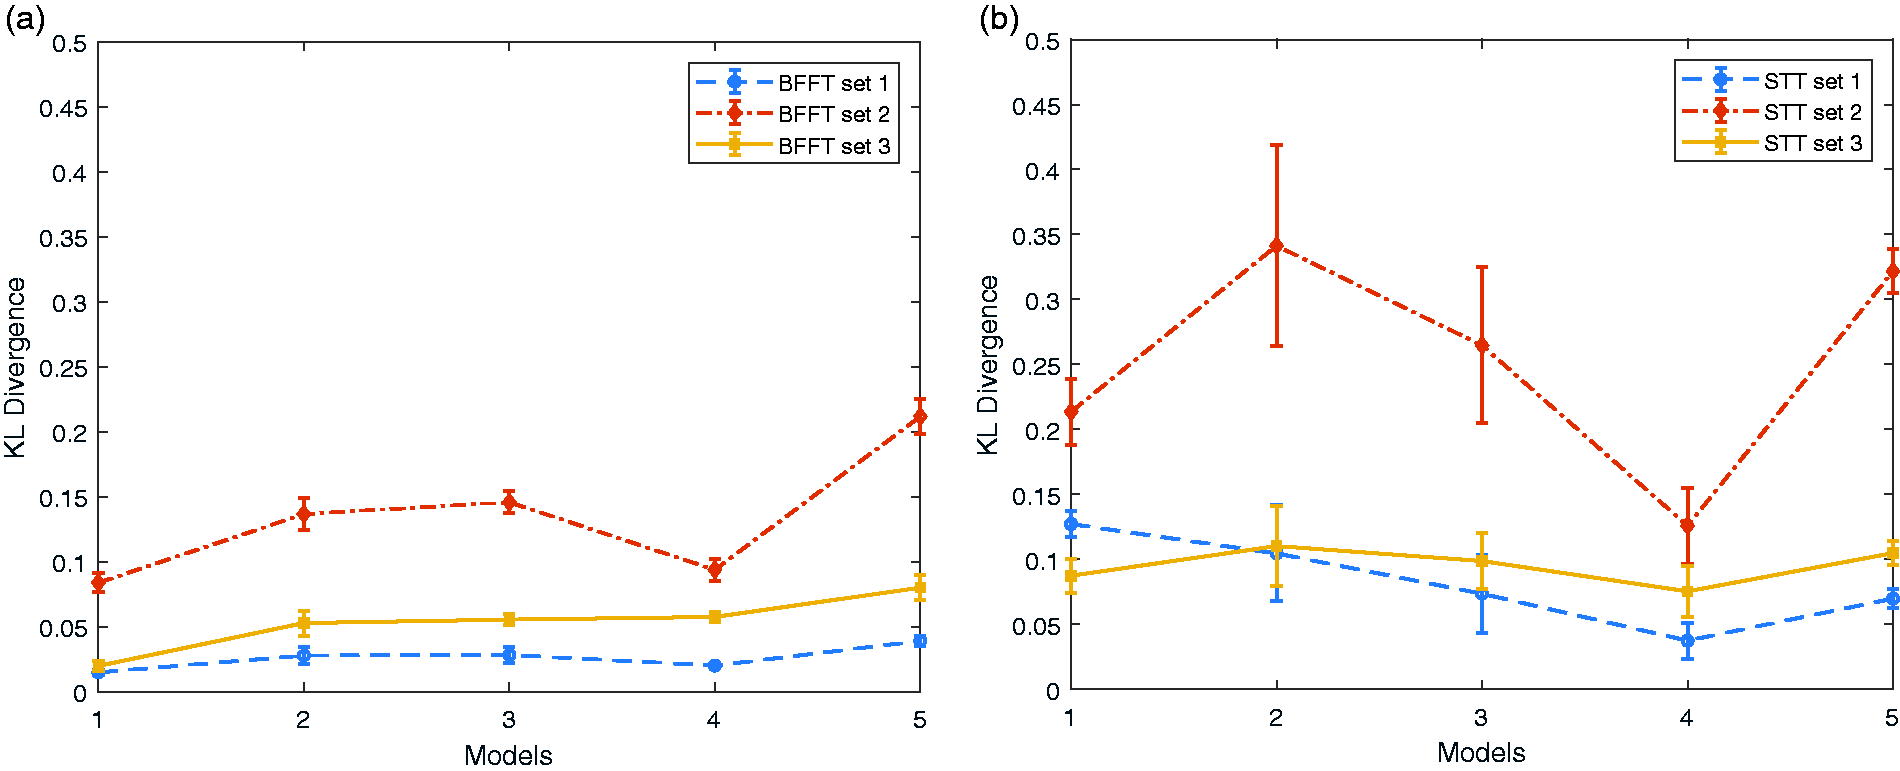
The average and standard variances of KL divergence of each of the five images are illustrated in Figure 8. Both methods deliver good results with only a small error for image Sets 1 and 3, but a little worse results for image Set 2 with long straight fibers. The worse results for Set 2 can be explained by the placement of straight fibers next to each other, which leaves few background pixels between the fibers and therefore complicates the calculation of the fiber orientation. Higher variance of the preferred orientation of the fibers (Models 3 and 4) thus leads to better accuracy. Comparing the two methods, it can be stated that BFFT measures the ODF with a slightly higher accuracy than STT.
Real images
The measured results by BFFT of real images are shown in Figure 9. For Set A, a clearly favored fiber orientation in the 90° direction was computed. Based on the subjective impression, this is a comprehensive result. The measured ODFs of nonwoven images of type B has two obvious 0° and 90° peaks. This can be attributed to the included weave, which can easily be seen in Figure 5. As expected, the measured ODFs of nonwovens images of type C are more uniformly distributed.
Measurement by blockwise Fast Fourier Transform of (a) samples A1–A5, (b) samples B1–B5 and (c) samples C1–C5.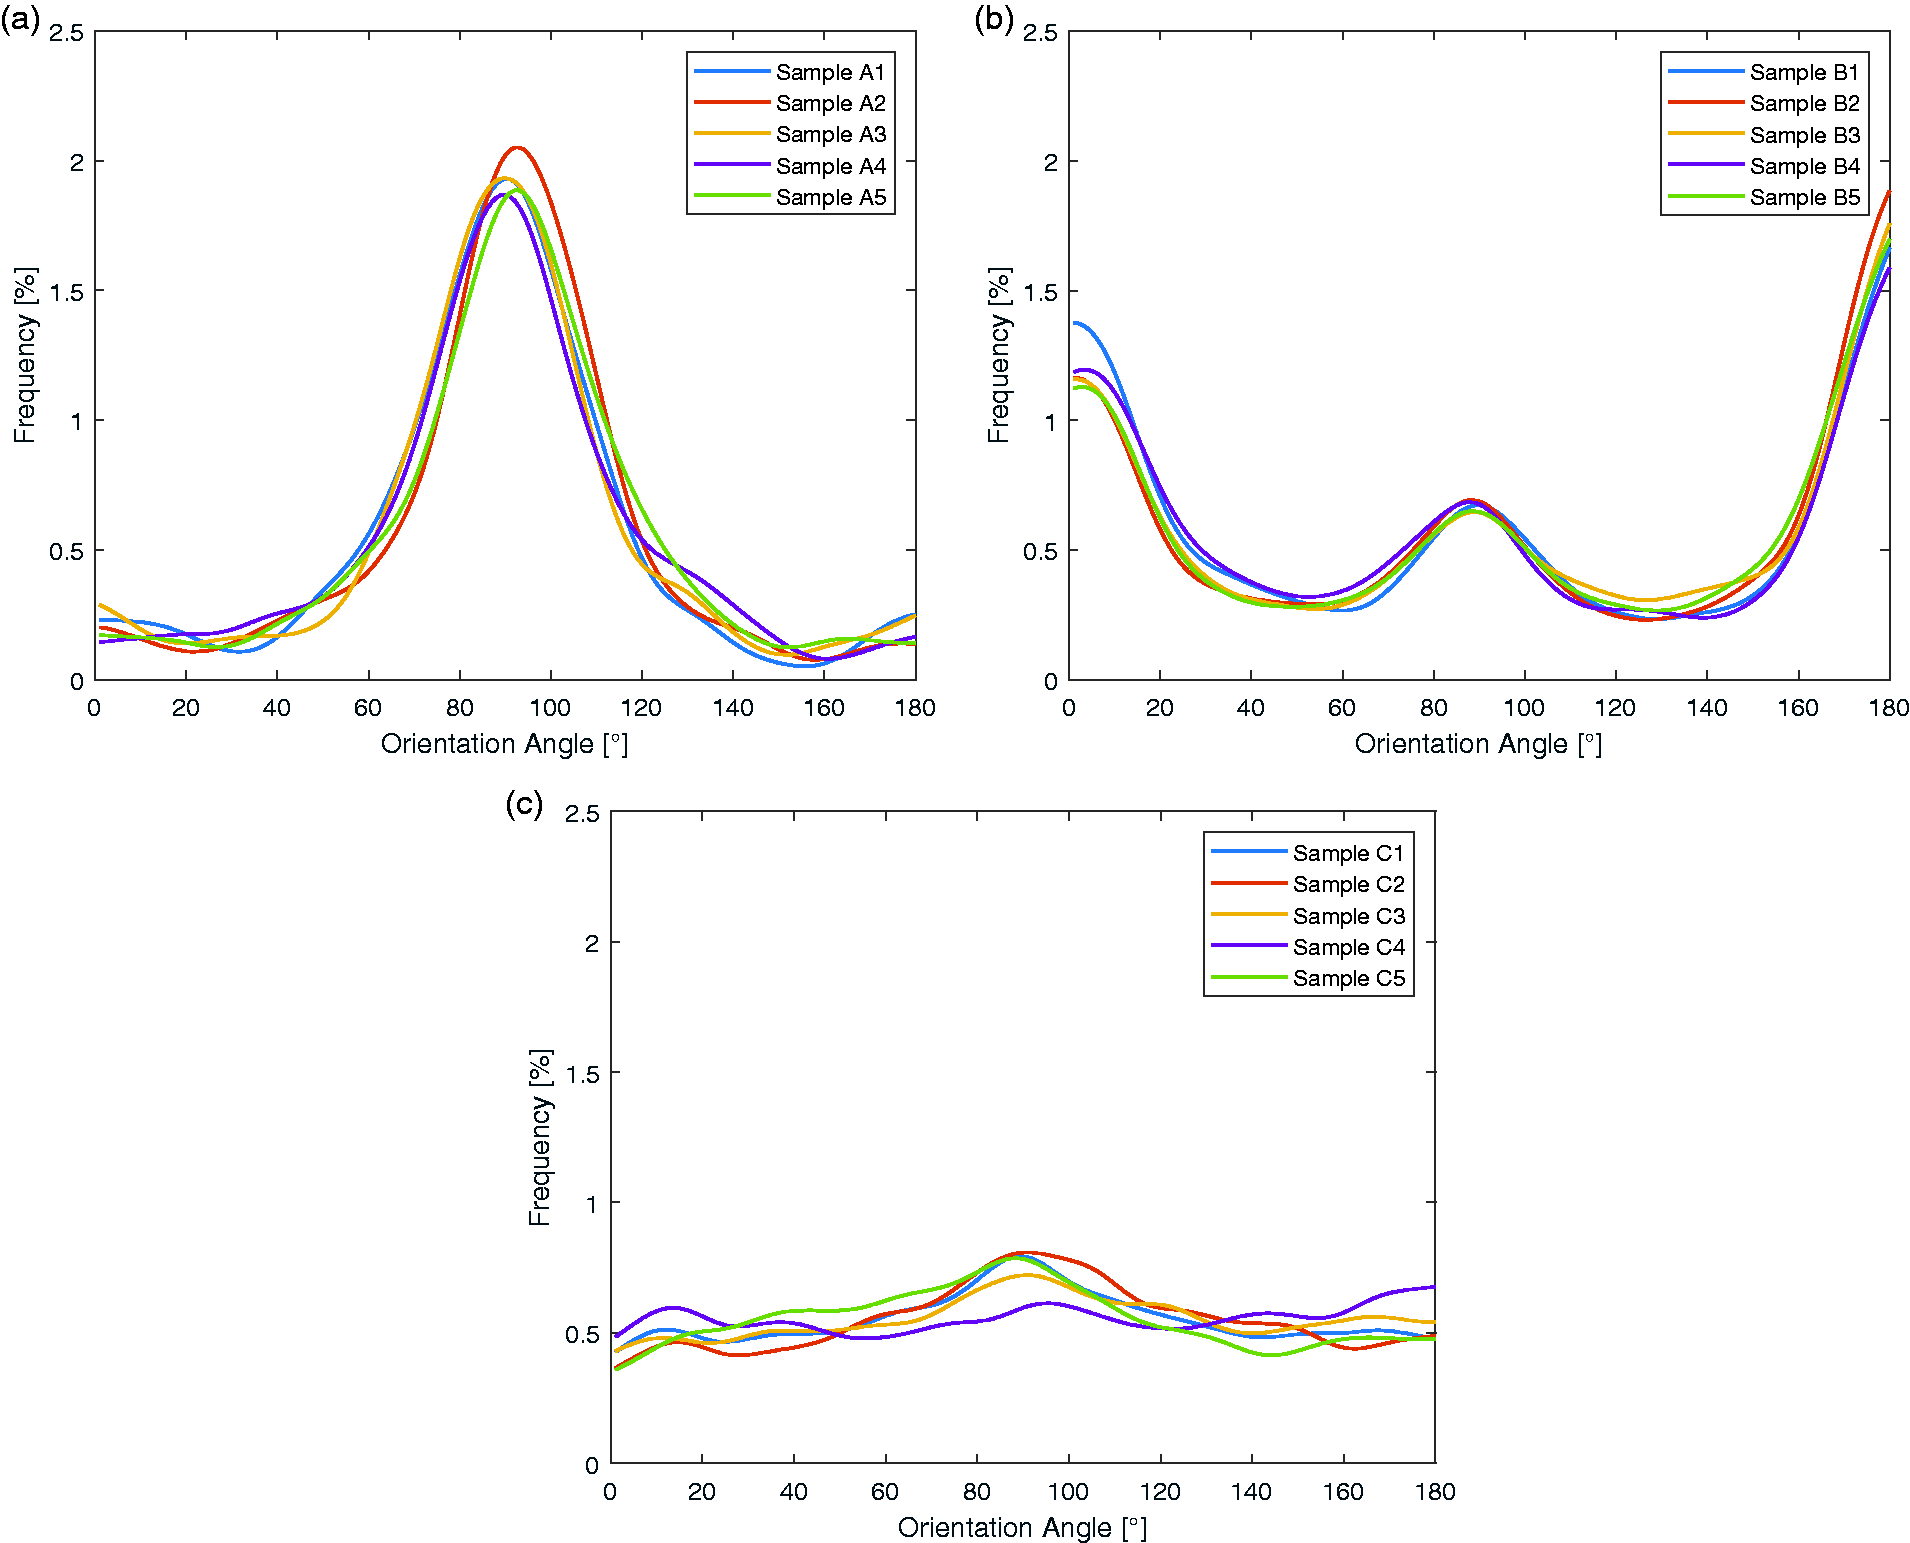
Figure 10 shows the measured ODFs by STT of real images. For all three nonwoven sets the same main fiber orientations as those computed with BFFT were determined. For Set A, however, the preference for the 90° direction is not as pronounced. In contrast, a slight preference for the 90° direction has been found for Set C.
Measurement by STT of (a) samples A1–A5, (b) samples B1–B5 and (c) samples C1–C5.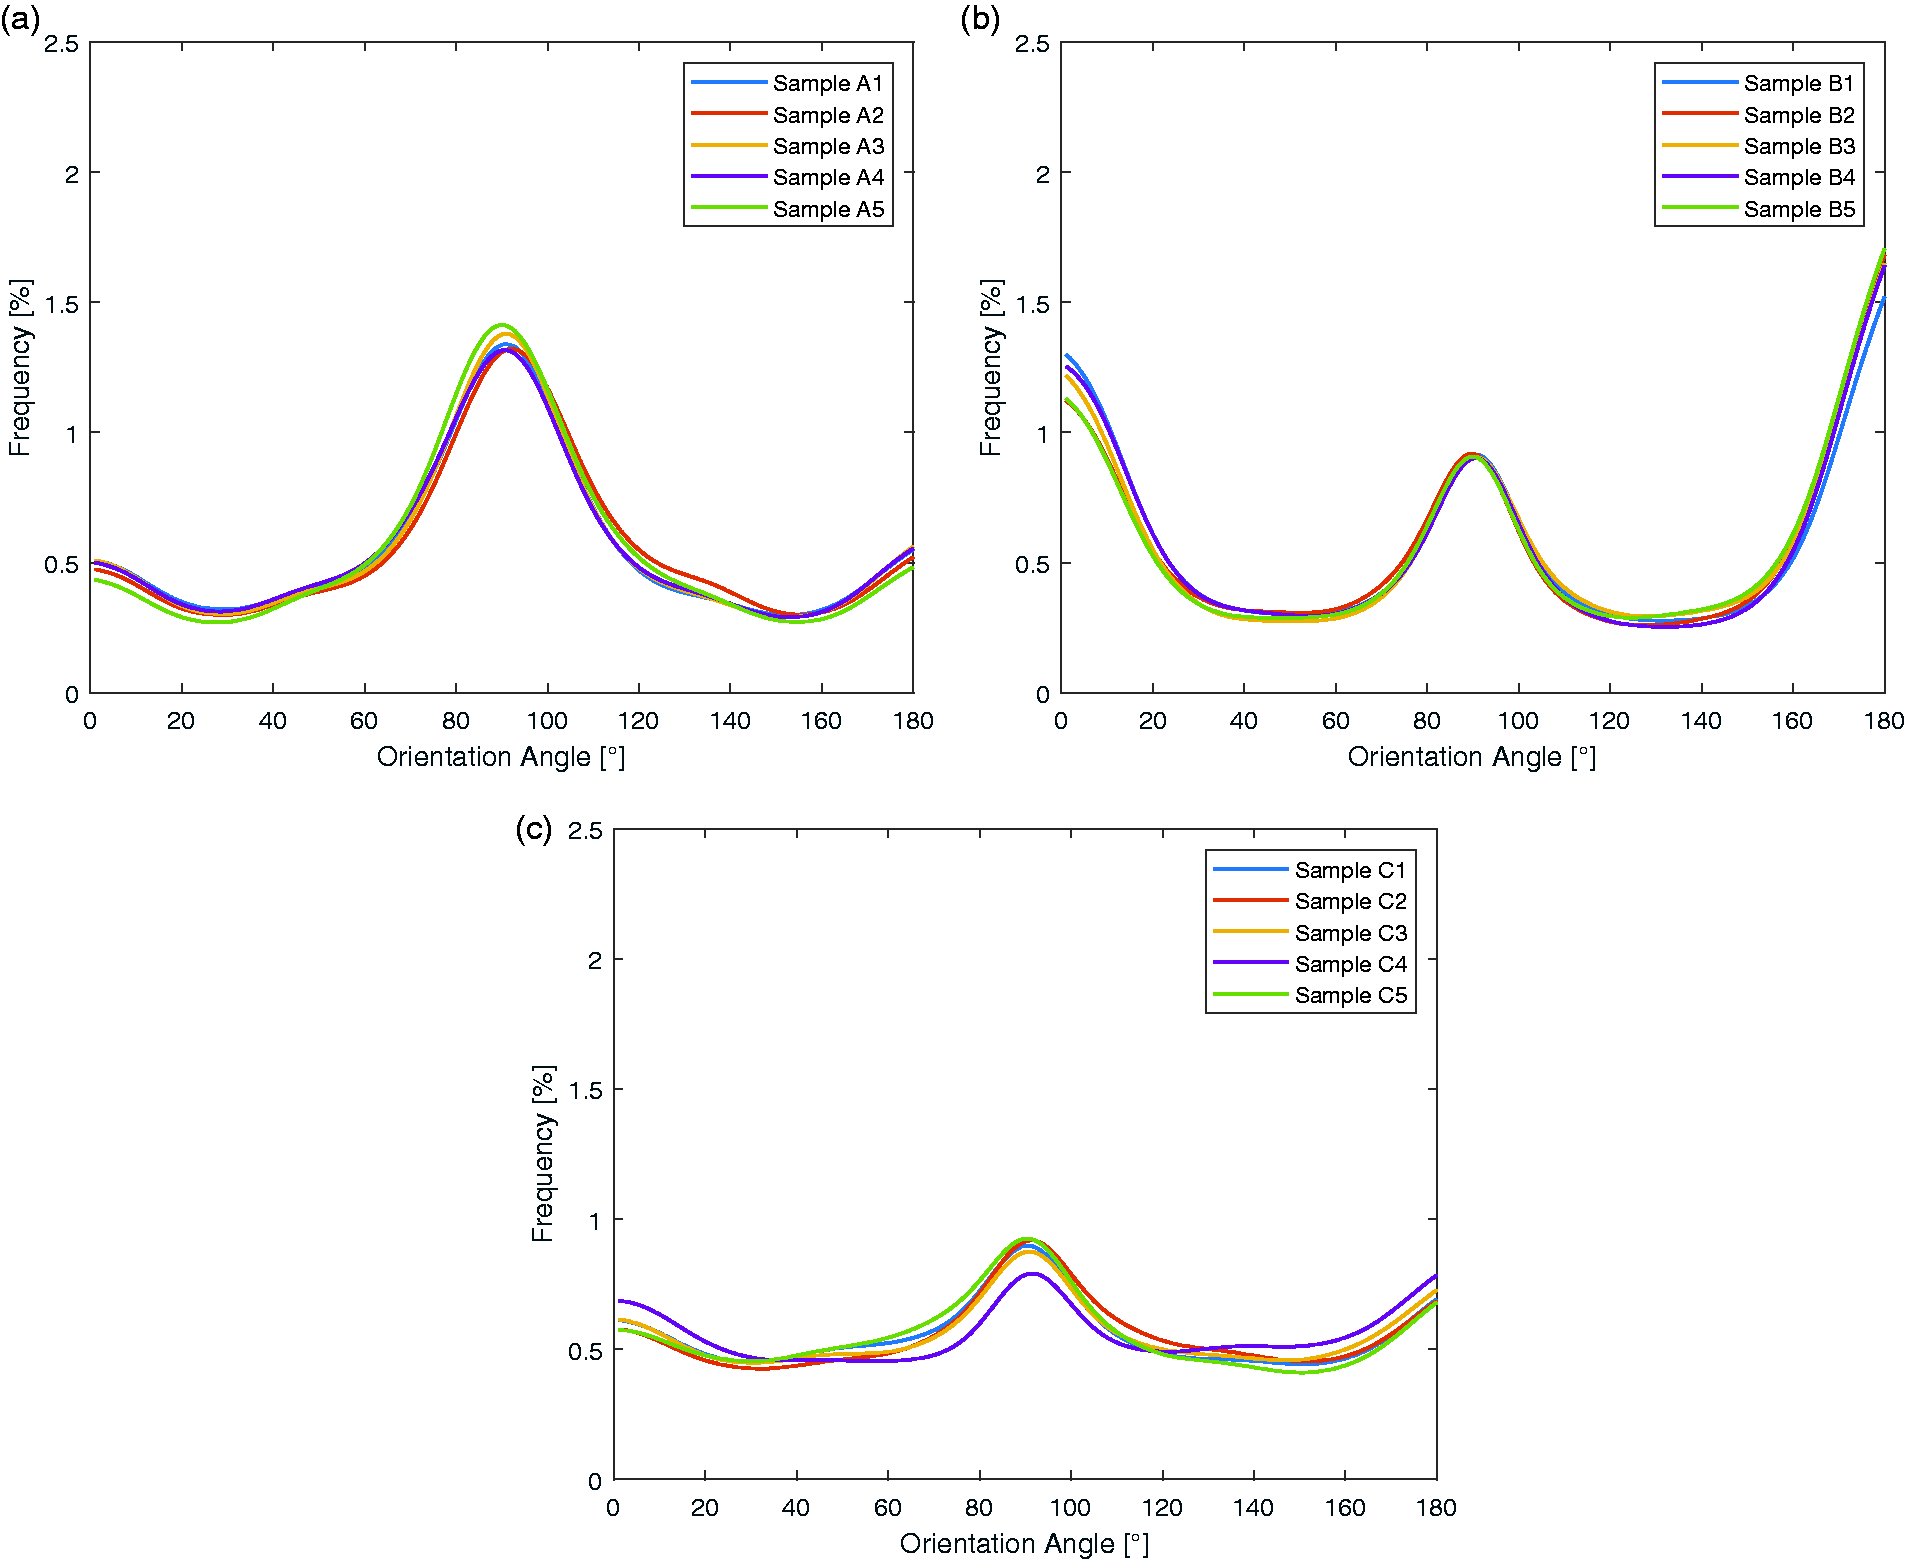
In addition, Figure 11 shows the local orientation measurement for every pixel of the image. For Set A no clear pattern in the location of the preferred fiber orientations can be seen. For Set C no distinct pattern can be seen either, as the fibers are randomly distributed as claimed by the manufacturer. In contrast, the display of the local orientation of a Set B sample clearly shows the weave of this nonwoven type.
Local orientation measurement for (a) image A1, (b) image B1 and (c) image C1.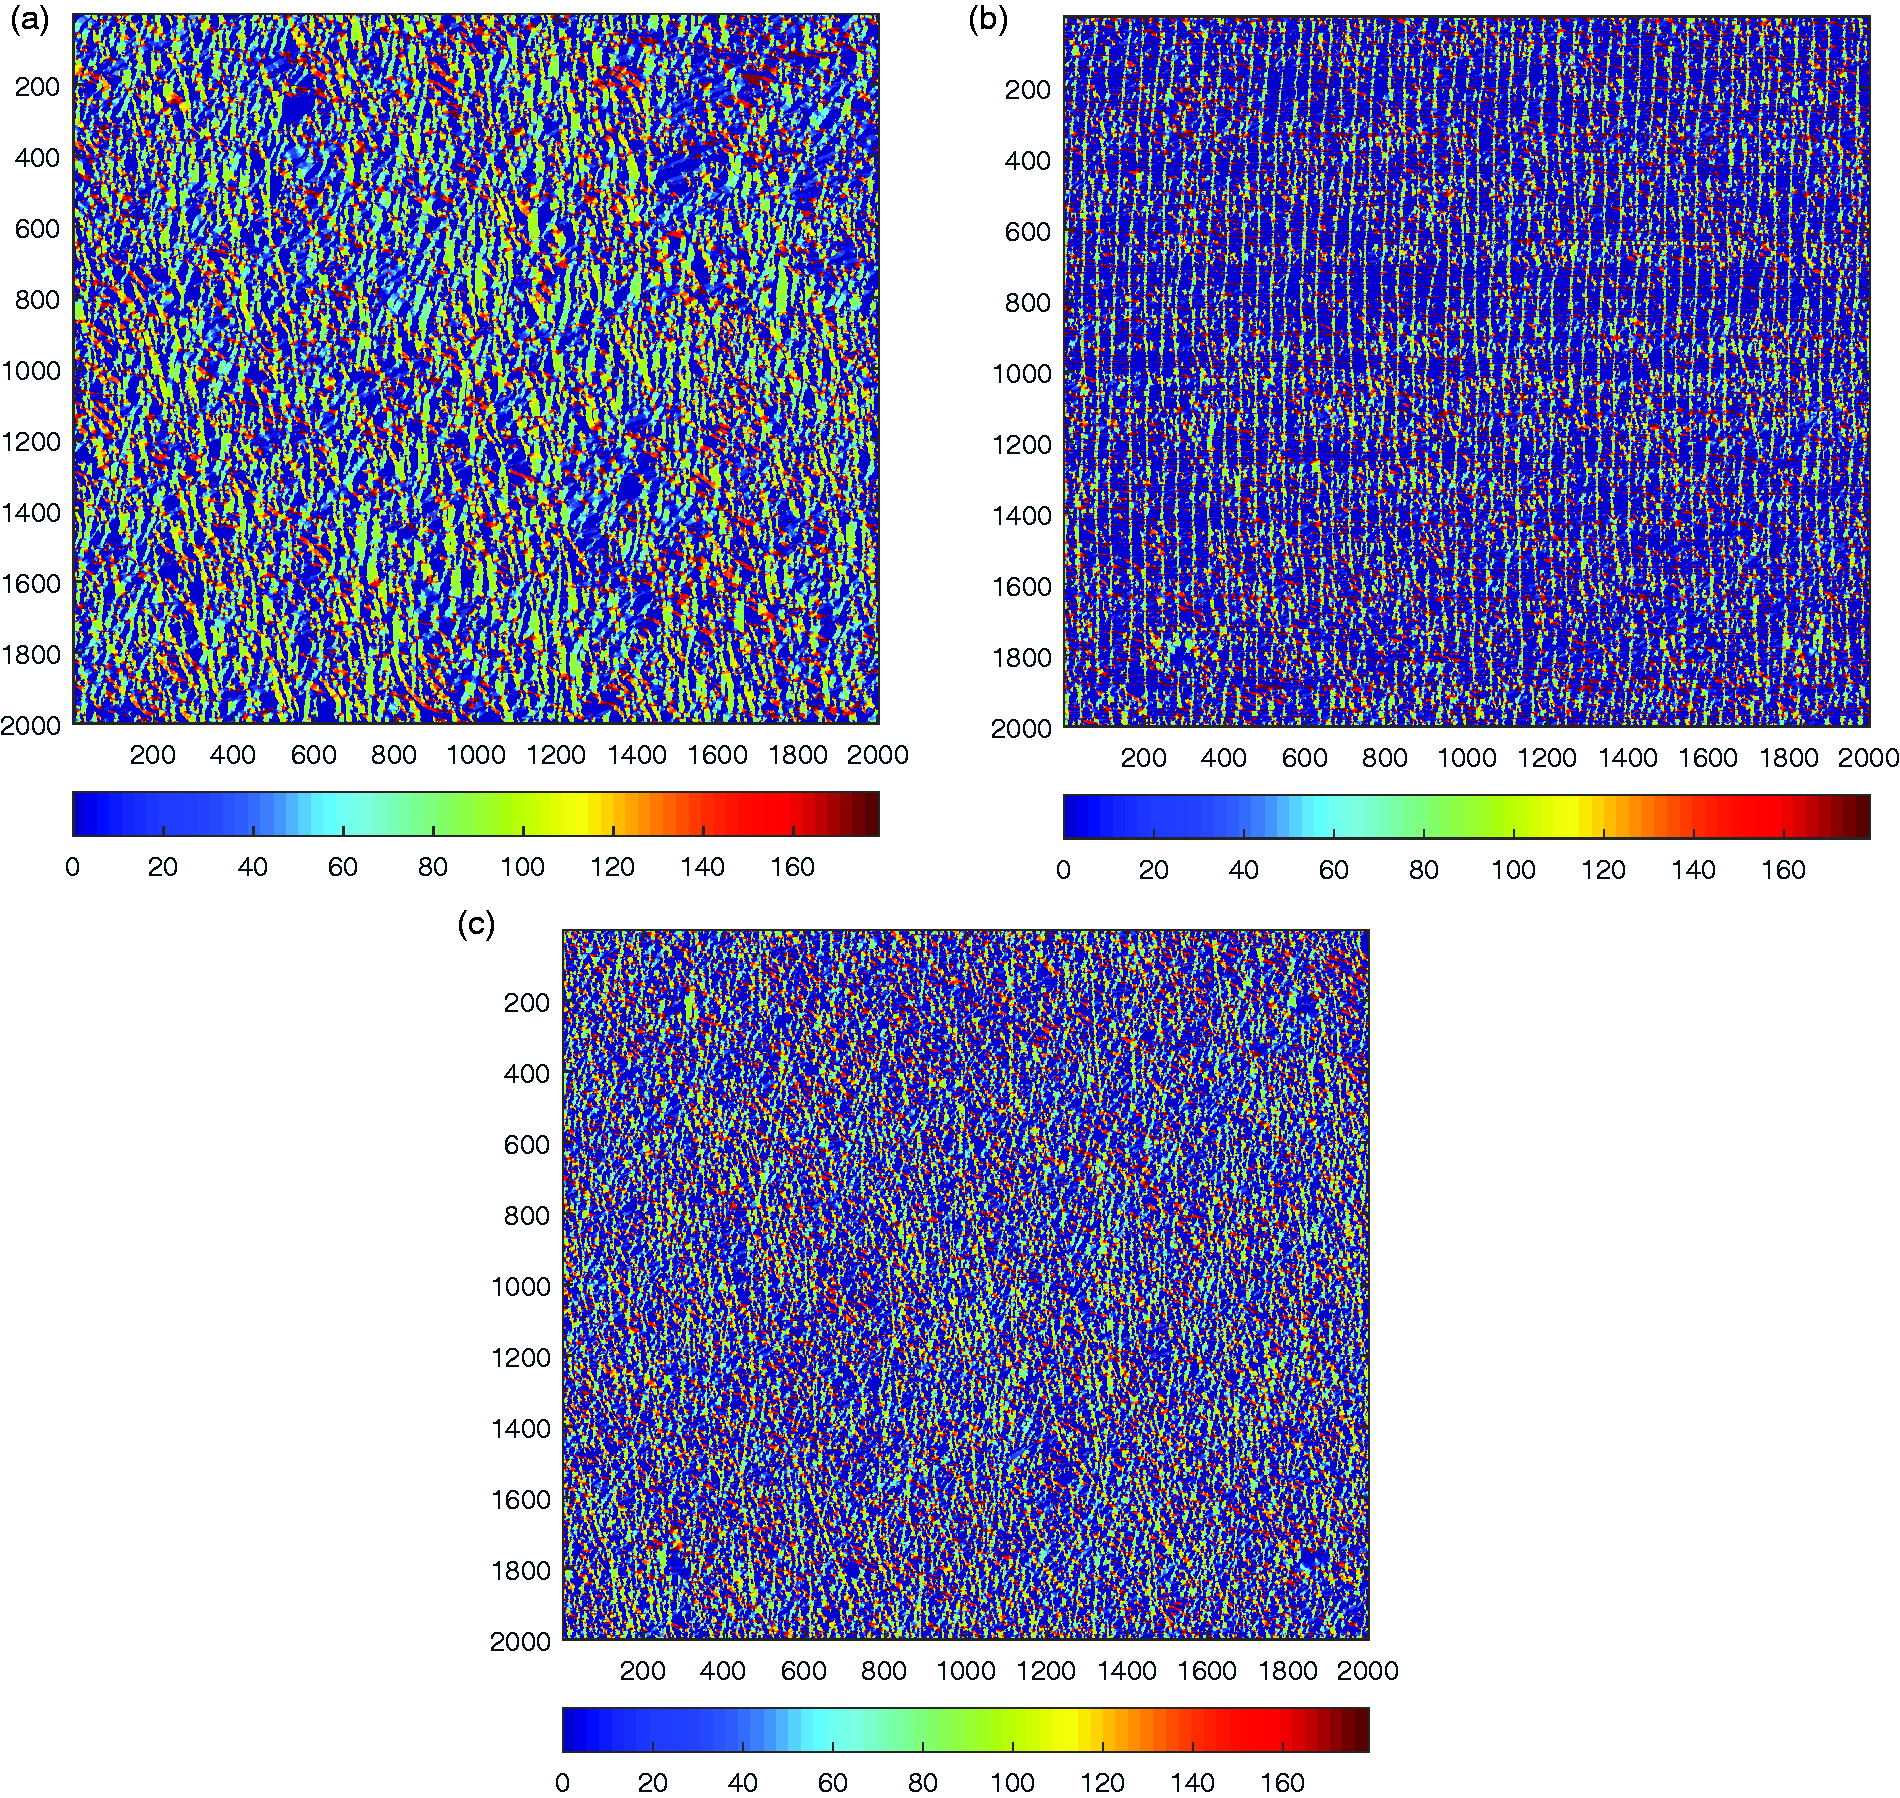
Average Kullback–Leibler (KL) divergence between measured Orientation Distribution Functions of images in one set and images from different sets
BFFT: blockwise Fast Fourier Transform; STT: Structure Tensor Thinning.
Conclusion
In this work, the algorithms of an improved BFFT and ST were adopted as the basis for a newly developed assemble method. At first, BFFT was improved by assigning an adaptive weight to each subwindow. BFFT was used to measure the overall orientation distribution of nonwovens. Then, based on the idea of ST, a new method called STT was developed to estimate the local orientation of each pixel in a nonwoven image. Meanwhile, the overall orientation distribution has also been calculated from this local information as a reference of the ODF obtained from BFFT.
Based on these results, it has been proved that BFFT and STT can clearly distinguish the different ODFs between different types of nonwovens. The evaluation with simulated images and known fiber orientation distributions showed that, by weighing the subwindows based on fiber density and specific alignment of the fibers, the BFFT method was improved compared to the existing methods. The newly developed STT methods have shown a high accuracy determining the dominant directions of fibers, improving the accuracy of state of the art ST methods significantly. However, as the 0 °/180° directions are slightly overestimated by this method, further research will be required. The evaluation of different real images shows that the type of nonwovens has no influence on the developed orientation measurement assemble schema. Because the measurement is based on the orientation of each pixel, the measured ODFs of STT are smoother and more robust than BFFT. BFFT is sensitive to the setting of different parameters. For the evaluation of these parameters a combination of both methods is recommended. For the measurement of a new type of fabric, the measured ODF by STT can be used as a reference to choose the right parameters for BFFT. Once the measured ODF by BFFT is reasonable, in future measurement of nonwoven fabrics can be efficiently measured with less required computing time.
The findings of our study indicate that the newly developed assemble method can be integrated in our equipment to accurately and robustly measure the ODF of different types of nonwoven fabrics. On the one hand, these calculated indexes can be used to control the mechanical properties of produced fiber injection molded nonwovens. On the other hand, they could be used to analyze and further guide the improvement of the production process.
Footnotes
Declaration of conflicting interests
The authors declared no potential conflicts of interest with respect to the research, authorship, and/or publication of this article.
Funding
The authors disclosed receipt of the following financial support for the research, authorship and/or publication of this article: This publication was partly written within the framework of the Profilregion Mobilitätssysteme Karlsruhe, which is funded by the Ministry of Science, Research and the Arts in Baden-Württemberg. The other part was supported by the German Research Foundation (DFG: Deutsche Forschungsgemeinschaft; project no. 439709829).
