
Abstract
Epoxy resin and carbon fiber were used as the reinforcement to modify phenolic resin. Phenolic epoxy resin was prepared by physical blending, and carbon fiber was introduced into the resin matrix, and meanwhile the curing agent was added. The flame retardancy and thermal stability of the samples were evaluated, and the mechanical performance of the samples was characterized to investigate the overall performance. The flame retardancy of phenolic epoxy resin decreased slightly with epoxy resin of 5 wt%. The oxygen index was decreased by 6.3%, the ignition time was shortened by 66 s, and the peak heat release rate was increased by 8.9%. The tensile strength and elastic modulus were increased by 46% and 26.1%, respectively. The flame retardant and mechanical properties of phenolic epoxy resin were improved the most with short carbon fiber of 0.5 wt%. The oxygen index was increased by 4.6%, the ignition time was delayed by 35 s, the peak heat release rate was reduced by 18.9%, the carbon residue rate at 800℃ was increased by 60.4%, the apparent activation energy was increased by 11.3%, and the tensile strength and elastic modulus were improved by 90.4% and 87.9%, respectively.
Keywords
Phenolic resin (PR) is an ablation and heat insulation material commonly used in the aerospace industry, in electrical manufacturing, for anticorrosive material, and so on. It has good heat resistance and flame retardancy. However, the aromatic nucleus of PR is only connected by methylene, which results in excessive density of rigid groups (benzene rings), large steric hindrance, and a small degree of freedom of rotation of the links, which makes the material tough and poorly brittle. On the other hand, the phenol group is a strong polar group and its water absorption is very strong, which makes the mechanical strength of the material poor.1,2 Therefore, its mechanical properties need to be enhanced to meet the requirements of practical applications. Epoxy resin (EP) is widely used in the aerospace, electronics, and electrical fields due to its good thermal stability, insulation, adhesion, and mechanical properties. 3 Physical blending of EP and PR can not only exert the excellent flame retardancy and heat resistance of PR, but also greatly improve the mechanical properties of PR.4–6 Carbon fiber (CF), discovered in the 1960s, is a new type of reinforcing fiber that has both the advantages of fiber materials and the characteristics of carbon materials. Its main structure is a stable physical structure composed of graphite crystals arranged axially along the fiber. Its carbon content is greater than 90%. Since its introduction, it has been widely used in the aerospace, industrial, commercial, and other fields.7,8
The methods of EP modification to PR are mainly divided into chemical modification and physical blending. The principle of chemical modification is to introduce active epoxy groups in the PR molecule and react with the PR to achieve a toughening effect; physical blending is to stir the EP and PR to make them react to optimize each other. The reactions that occur during the mixing process are mainly the condensation reaction of the PR itself and the reaction of the epoxy group with the phenolic hydroxyl or methylol group in the PR, which increases the length of the molecular chain and reduces the cross-linking density after curing. This improves the toughness of the PR. Li 9 prepared different proportions of EP and PR by physical blending. The results showed that the bending and impact strength of the modified resin are significantly improved compared to pure PR with EP of 5 wt%, while the oxygen index and apparent activation energy decreased to a certain degree. Du et al. 10 adopted EP and silicone to modify PR adhesive. The adhesive prepared by adding 0.6 wt% of silicone showed better overall performance, and its tensile shear strength and heat resistance were significantly improved compared with unmodified adhesives. Liping et al. 11 prepared an EP-modified PR emulsion. The results showed that the modified emulsion exhibits good mechanical properties when EP is 20 wt%.
The EP-modified PR has good mechanical properties, but even a small amount of EP will cause a certain degree of decline in the heat resistance and flame retardancy of the PR. Therefore, a good flame retardant is necessary to be introduced into the EP/PR system. The body undergoes three-phase recombination, which is being considered by more and more scholars. 12 CF is a commonly used reinforcing fiber for composite materials. Introducing it into EP/PR can improve the heat resistance and flame retardancy of the material. At the same time, it can further improve the mechanical properties of the composite material. In addition, because of the introduction of epoxy groups, no water is generated during the curing process of the modified resin, and the wettability with fiber materials (glass fiber, CF) is also enhanced. 13 Park et al. 14 prepared CF/PR composites, and the results showed that after proper heat treatment, the interface properties of CF chips were significantly improved, thereby making the interface adhesion between recycled CF and PR much improved. Yuan et al. 15 studied the effect of CF surface modification pre-treatment on the properties of reinforced PR-based composites. The results showed that the interface adhesion and mechanical properties of the modified CF/PR composite were greatly improved. Peng and Zuihan 16 used EP/PR materials to soak CF cloth. The results showed that the bending and impact strength of composites were improved compared to EP/PR. Hongwei et al. 17 studied the effect of changes in the PR content on the properties of CF/EP/PR composites. The results showed that the bending strength of the modified material decreases with the increase of the PR content, and the interlaminar shear strength increases firstly and then decreases. Honglong 18 used CF powder to modify the PR, and the results showed that the thermal stability and thermal decomposition temperature of the composite were better than those of pure PR, and the electrical conductivity in and out of the plane of the composite was also improved. Woyun et al. 19 studied the wear resistance of the PR modified by CF, and the improvement is obvious, showing a linear increase when it is greater than 10 wt%.
The addition of CF will increase the thermal stability of the polymer to a certain extent and enhance the flame retardancy of the material. The application of CF to reinforce EP/PR composite materials can make up for the decline of the flame retardancy of PR by adding EP. At present, there are few researches on CF-reinforced EP/PR composites, and they mainly focus on the modification of the mechanical properties of phenolic EPs, while the systematic research on their flame retardancy, thermal stability and mechanical properties is scarce and not thorough enough. Therefore, it is of great significance for improving its fire resistance as well as carrying out further research and applications. In this paper, EP/PR composites and CF/EP/PR composites were first prepared. The flame retardancy, heat resistance, and smoke toxicity were characterized by the oxygen index, cone calorimetry, and thermogravimetry (TG). The mechanical properties were studied through tensile tests. Finally, the macroscopic morphology and microstructure of the materials were analyzed by scanning electron microscopy (SEM) to investigate the dispersion state of CF and its enhancement mechanism.
Experimental details
Materials
An Araldite LY1564SP EP from the Huntsman Corporation of America is the basis of the resin system. Polyacrylic (PAN)-based CF (T300) with a diameter of 6.91 µm is from the Toray Corporation of Japan. It has a tensile modulus of 230 GPa, an elongation of 1.5%, a mass per unit length of 800 g · 10−3 · m−1, and a density of 1.76 g · cm−3. The materials needed for analytical analysis include phenol (C6H5OH, purity ≥ 99.0%), formaldehyde solution (HCHO, purity 37–40%), barium hydroxide octa-hydrate (purity ≥ 98.0%), sodium dodecyl benzenesulfonate (C18H29NaSO3), concentrated nitric acid (purity ≥ 65%), silane coupling agent (KH-550, C9H23NO3Si), ethyl acetate, and absolute ethanol, which are all from Sinopharm Chemical Reagent Co., Ltd, of China.
Pre-treatment of CF
Untreated CF has a low surface energy and is hydrophobic. Therefore, it is necessary to perform surface pre-treatment on it, and introduce polar groups and reactive functional groups to enhance its wettability and improve their interfacial bonding. 20 It should be immersed in concentrated nitric acid for 5 h in a water bath at a constant temperature of 60℃. It was then washed out with distilled water until the pH was neutral and dried in a blast drying oven. After cutting it to 1–3 mm, it was bagged to use.
Preparation of EP/PR
Phenol was placed in a 45℃ water bath until it is dissolved into a liquid. Formaldehyde and phenol were poured into the beaker at a molar ratio of 1.25:1 and stirred. Then, fully mixed 1:5 barium hydroxide octa-hydrate with distilled water were poured into the beaker. After mixing and stirring for 0.5 h, the temperature was increased to 85℃ and mechanical stirring was continued for 3–4 h. In this process, due to the addition of a basic catalyst, formaldehyde and phenol undergo an addition reaction to generate a large number of polyhydric phenol alcohols and a small number of unit alcohols. The reaction process is shown in Figure 1(a); dehydration condensation occurs between the methyl groups. The reaction process is shown in Figure 1(b), and the main reaction is the b reaction. Finally, a first-order PR is obtained, and the molecular structure is shown in Figure 1(c). Then, the obtained red-brown liquid was mixed with the previously weighed EP, and mechanically stirred in a water bath at 60℃. After 1 h, it was taken out into a vacuum drying box for defoaming treatment, and finally poured into a mold and placed in a blast drying oven. The temperature of the drying oven was set at 60℃, and it was heated to 80℃ after drying for about 1 h. After it was maintained at a certain temperature gradient for 10 h, it was taken out of the mold when cooled to room temperature. The final specimens were bagged and recorded.
Reaction process of phenolic resin (PR): (a) addition reaction of phenol and formaldehyde; (b) condensation reaction of phenolic methylol; (c) thermoset grade A PR.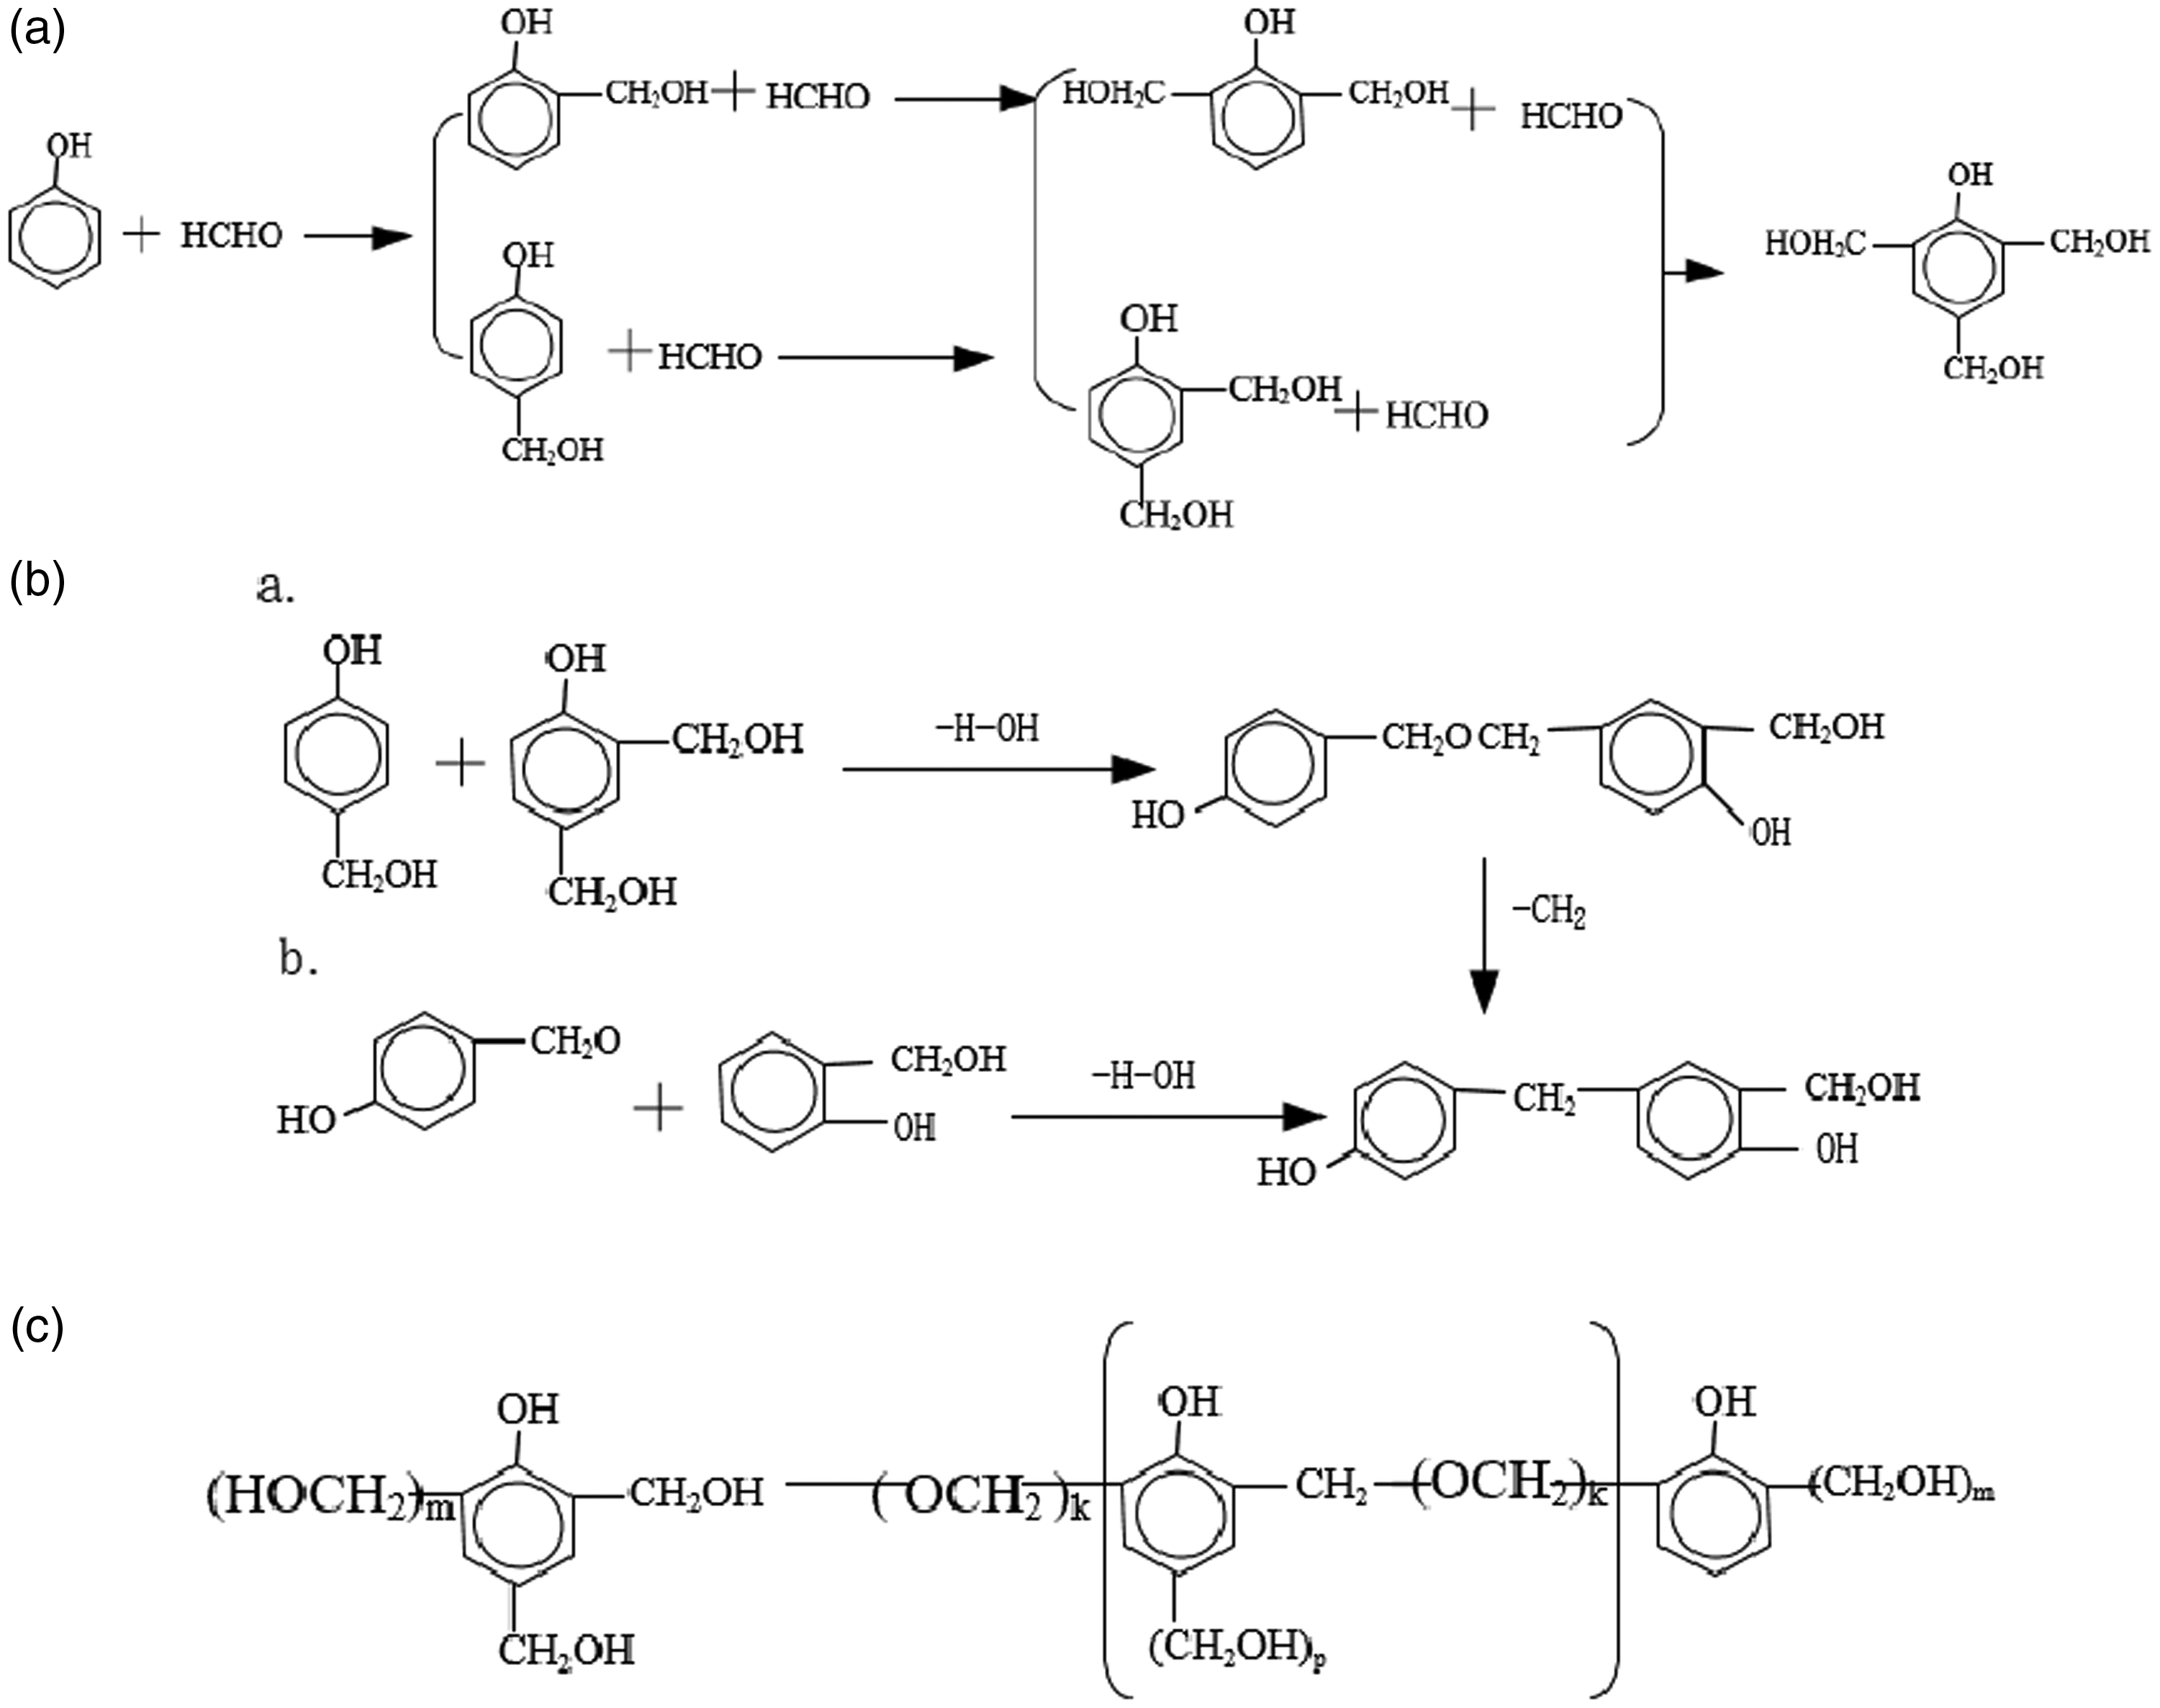
Figure 2 shows the infrared spectra of cured phenolic EP. It can be seen from the figure that the characteristic peak of 3426.30 cm−1 belongs to the stretching vibration of the O–H bond of phenol. The characteristic peak of 1237.34 cm−1 belongs to the stretching vibration of the ether bond. The 885.91 cm−1 characteristic peak belongs to the out-of-plane stretching vibration of the C–O–C bond. The stretching vibration of the phenol O–H bond and the ether bond is strong, while the stretching vibration of the C–O–C bond is weak. The results showed that the ring-opening reaction of EP condensed with phenolic hydroxyl in PR, resulting in more ether bonds and more macromolecules.
The Fourier transform infrared spectra of phenolic resin and epoxy resin condensate.
Preparation of CF/EP/PR
A certain amount of pre-treated CF was mixed with absolute ethanol, and a silane coupling agent (KH550) and a dispersant (sodium dodecylbenzenesulfonate) were added. They were placed in an ultrasonic cleaner for ultrasonic dispersion for 1 h. Then the mixture was poured with the formaldehyde, phenol, and barium hydroxide octa-hydrate solution that had been stirred and mixed. They were mechanically stirred in a water bath at a constant temperature of 50℃. After 0.5 h, it was kept at 90℃ for 4–5 h until the ethanol had completely evaporated to obtain a black viscous liquid. The subsequent preparation process is the same as that of EP/PR, and finally CF/EP/PR composites are obtained, where CF is 0.1, 0.3, 0.5, and 0.7 wt%, respectively.
Characterization
A Fourier transform infrared spectrometer (Nicolet is5003190721, Thermo Fisher, USA) was used for the infrared spectrum analysis. The resin structure was characterized by the Fourier transform infrared spectrometer, and the test sample was prepared by the thin film method. The resin sample was coated on the salt sheet, and the film was obtained after the solvent volatilized.
The limiting oxygen index (LOI) values are measured on an oxygen index meter (Fire Testing Technology Ltd) with sample dimension of 130.0 mm × 6.5 mm × 2.9 mm (±0.1) according to the standard ISO 4589-2:2017. 21
A cone calorimeter (Fire Testing Technology Ltd) is used to test the combustion characteristics of the sample, the required sample size of which is 100 mm × 100 mm and the thickness is 3–5 mm. Three samples are required for each group and the average is taken as the result, which is in accordance with standard ISO 5660-1. 22
A comprehensive thermal analyzer (DTG-60AH, Shimazu, Japan) is used to analyze the thermal stability of the composites, and the material is treated as sub-powder with a weight of 3–5 mg.
The sample required for the tensile test is in accordance with standard GB/T2567-2008. 23 Five valid samples are required for each group, and the average with the standard error of the mean (s.e.m.) is taken as the result. It is tested by a microcomputer control electronic universal testing machine (WDW-50, Shandong Wanchen Testing Machine Co. Ltd, China).
SEM (SUPRA55, Carl Zeiss, Germany) is used to analyze the microstructure of the sample.
Results and discussion
Phenolic epoxy resin
Oxygen index analysis
Oxygen index (OI) of different samples

EP: epoxy resin.
Cone calorimetric analysis
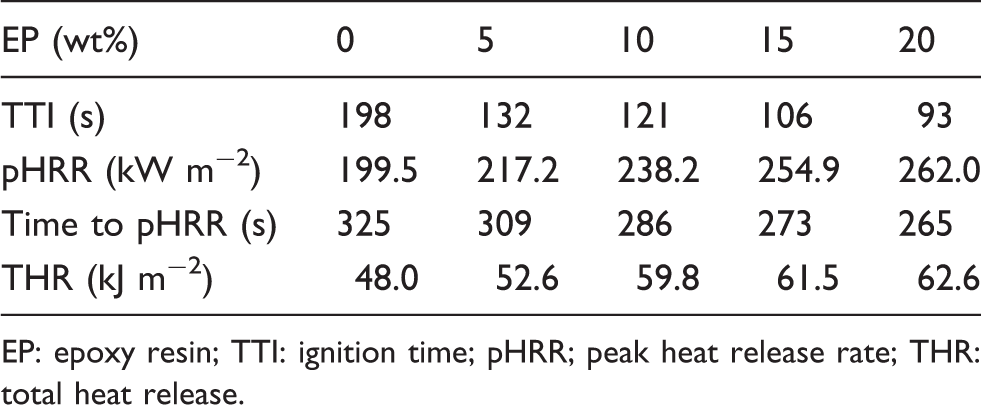
The heat radiation intensity of 50 kW m−2 was used to test the combustion characteristics of different EP content samples, and the heat release rates (HRRs) of different samples were obtained. Figure 3 shows the HRR and total heat release (THR) curves of samples with different EP content. It can be seen from Figure 3(a) that as the EP increases, the peaks of each curve increase to different degrees, and the peaks shift to the left. This shows that the increase of EP will increase the HRR of the sample and shorten the time to reach the peak. When the EP is 5 wt%, the ignition time (TTI) of the sample is reduced by 32 s compared with the matrix PR, and the peak heat release rate (pHRR) is increased by 8.9%. As can be seen from Table 2, when EP is 15 wt%, the TTI of the samples is shortened by 76 s, and pHRR is increased by 27.8%. Correspondingly, it can be seen from Figure 3(b) that THR of the samples is increasing with the increase of EP. The above shows that when EP increases, the TTI and peak time of EP/PR are reduced, and the pHRR is continuously enlarged, indicating that the flame retardancy of the samples is continuously weakened. When the EP exceeds 10 wt%, the decline is significant. This is because the rigid groups in the molecular structure directly affect the heat resistance of EP/PR. Therefore, the more PR introduced, the shorter the distance between the cross-linking points in the molecular structure, and the higher the density of cross-linking of the cured product, resulting in a large number of heat-resistant benzene ring rigid groups in the molecular structure.
Heat release rate and total heat release curves of different samples. HRR: heat release rate; THR: total heat release. Cone calorimetry data EP: epoxy resin; TTI: ignition time; pHRR; peak heat release rate; THR: total heat release.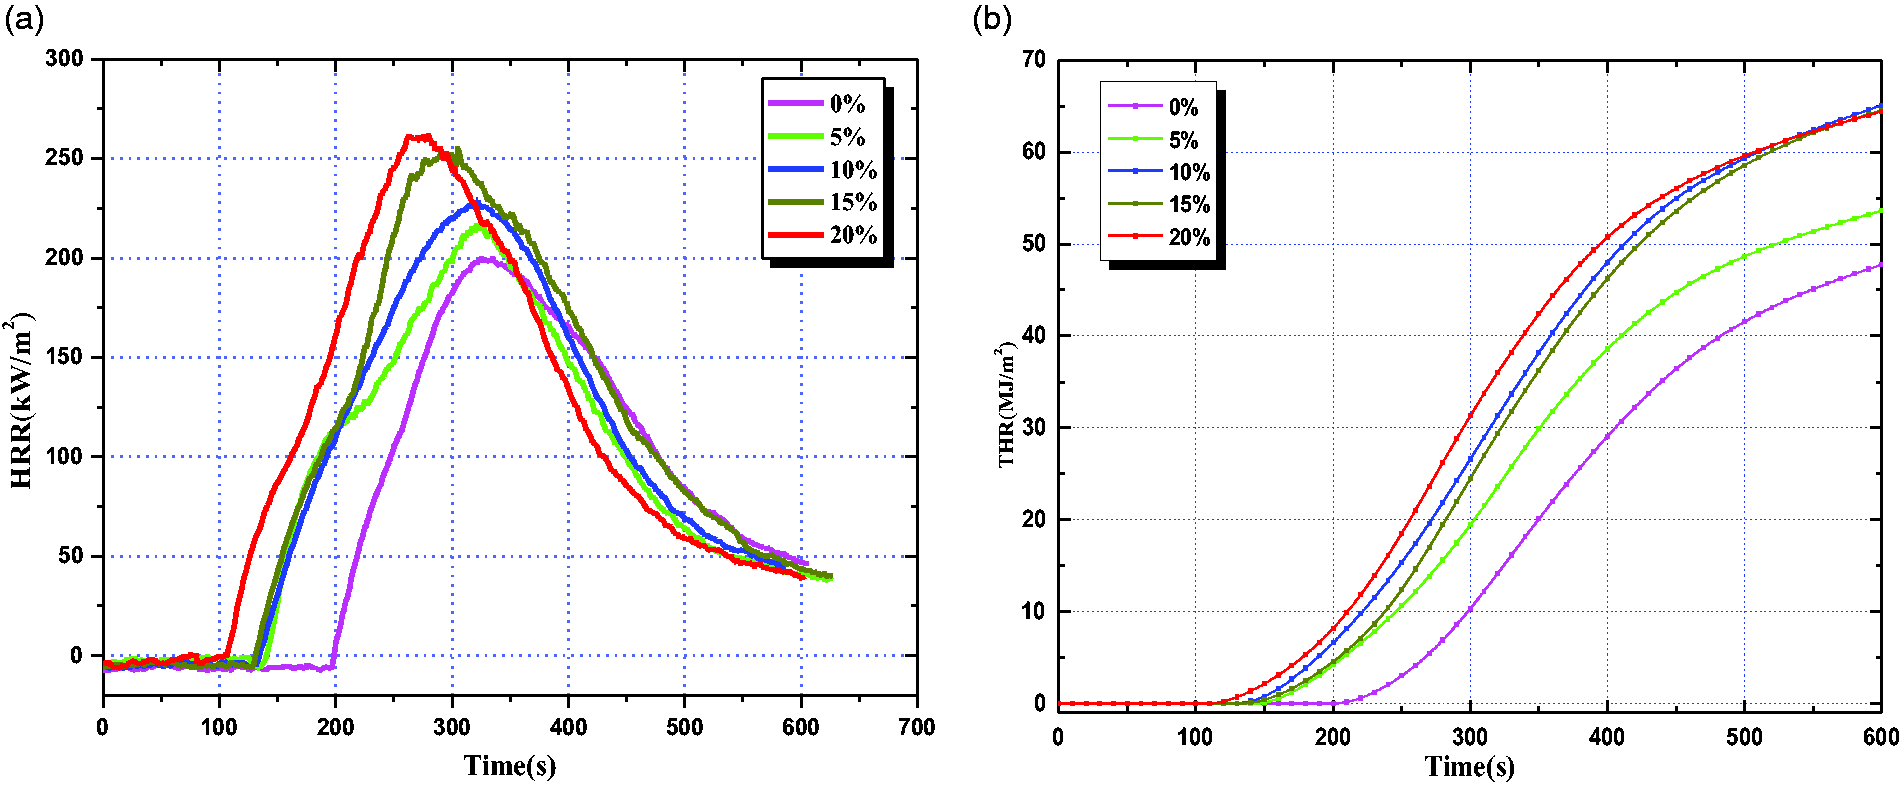
Analysis of tensile properties
The tensile strength characterizes the resistance of the material to the maximum uniform plastic deformation; the tensile elastic modulus refers to the stress required for the unit to deform elastically under the action of an external force. The greater the value, the smaller the elastic deformation of the material under certain stress. Figure 4 shows the tensile strength and elastic modulus of different samples. It can be seen that the addition of EP has the effect of improving the tensile strength. When EP is 5 wt%, the tensile strength of the sample is 46% higher than that of PR and the tensile elastic modulus is increased by 26.1%. When EP is 10 wt%, the tensile strength is 74% higher than that of PR and the tensile modulus of elasticity is increased by 33.9%. This is because a flexible chain is introduced through a chemical chain in the cured EP/PR network structure. Compared with pure PR, the tensile strength of the cured product of EP/PR is increased. However, with the increase of EP, the compatibility between the two molecules becomes worse, and the binding force between the two phases becomes smaller, resulting in a decrease in mechanical properties.
Tensile strength and elastic modulus of the specimens. EP: epoxy resin.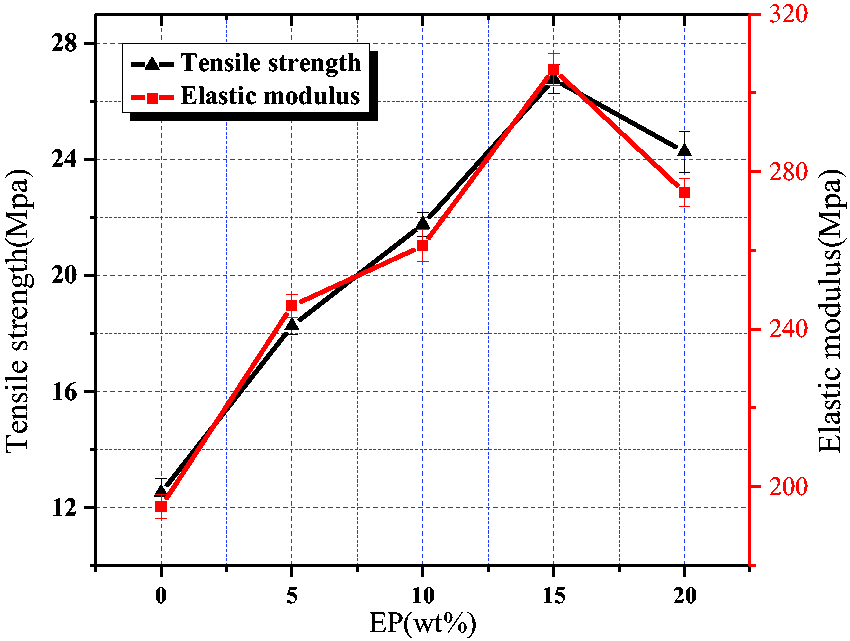
In summary, when EP is 5 wt%, it not only retains the good flame retardancy of the PR, but also significantly enhances the mechanical properties of the PR. The overall performance of the phenolic EP is optimized. Therefore, when the effect of the third-phase reinforcement on the performance of the resin is studied, the modification study is carried out with 5 wt% EP-reinforced PR as the matrix.
CF-reinforced phenolic epoxy resin
Oxygen index analysis
Oxygen index (OI) of different samples
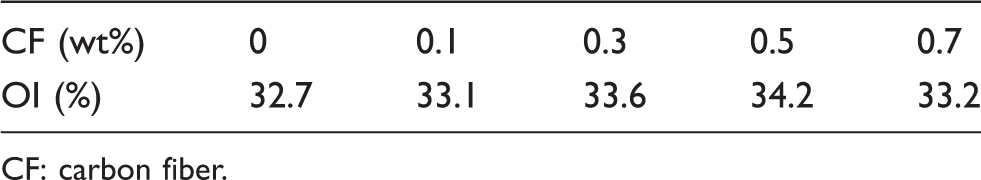
CF: carbon fiber.
Cone calorimeter analysis
The heat radiation intensity of 50 kW m−2 was used to test the flame retardancy and toxicity of different samples, and various combustion characteristics data of different proportions of samples are obtained. Figure 5 shows the HRR, THR, mass loss rate (MLR), and effective combustion heat (EHC) curves for different samples. Table 4 shows the data of various combustion characteristics of different samples.
Cone calorimetric curves of phenolic epoxy resins for different samples: (a) heat release rate (HRR); (b) total heat release (THR); (c) mass loss rate (MLR); (d) effective combustion heat (EHC). Calorimetric combustion characteristics of different samples CF: carbon fiber; TTI: ignition time; HRR: heat release rate; THR: total heat release; MLR: mass loss rate; EHC: effective combustion heat; COp: carbon monoxide production rate; COY: carbon monoxide yield.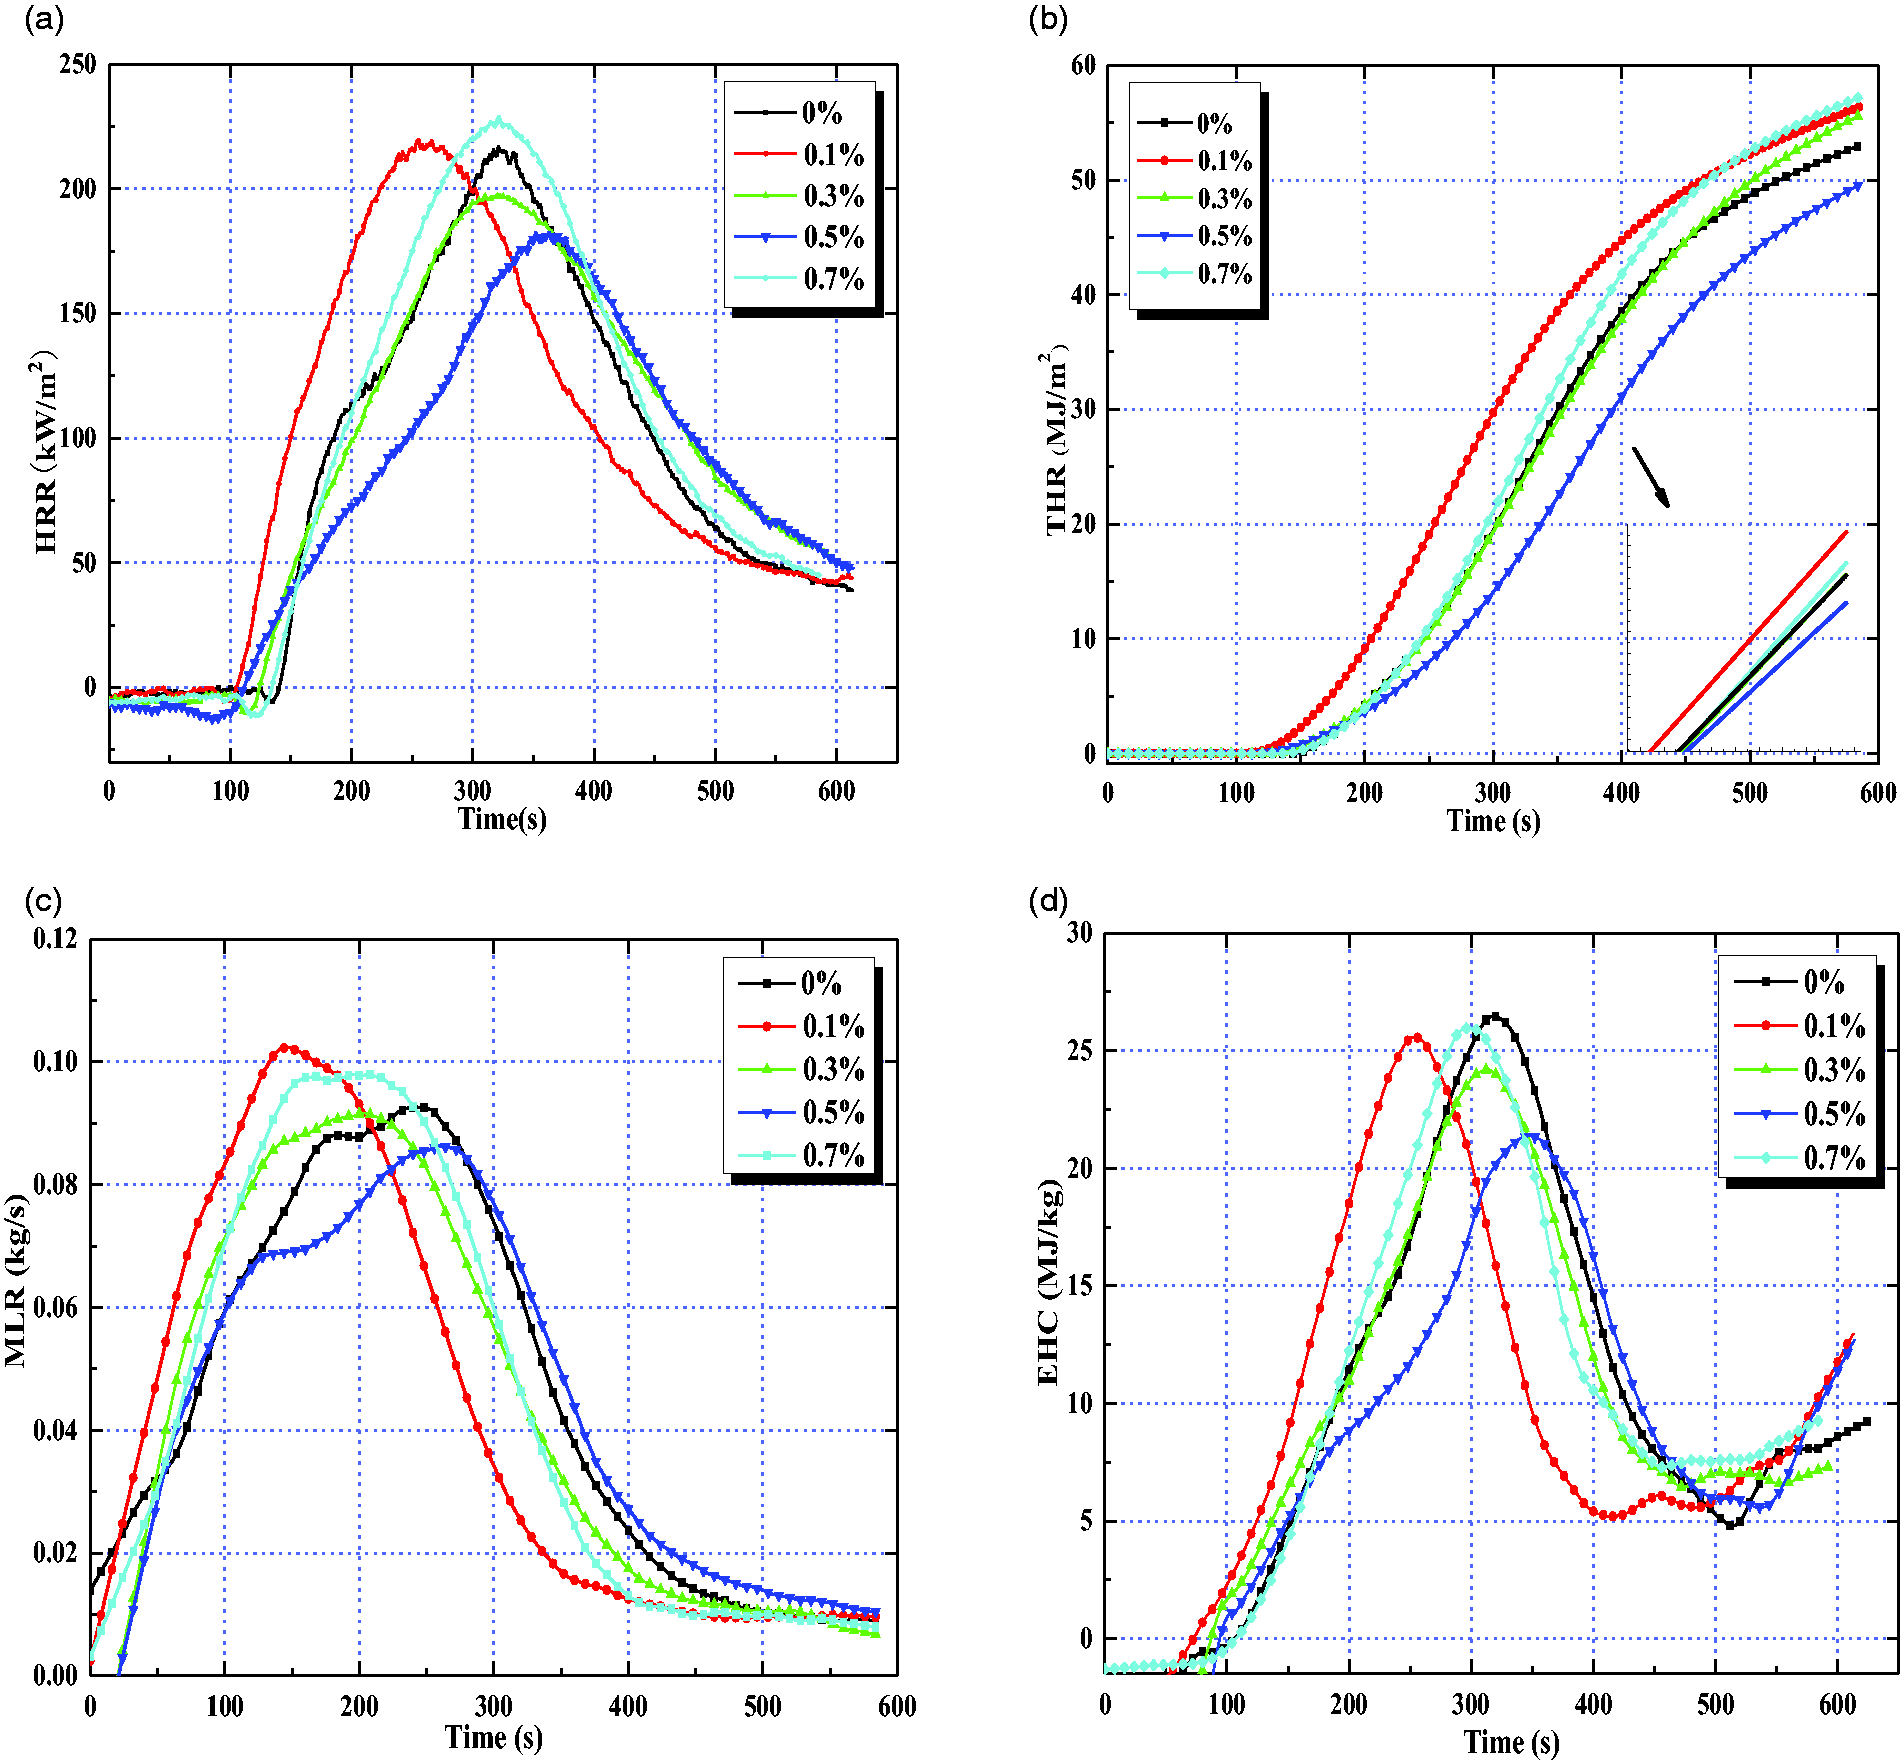
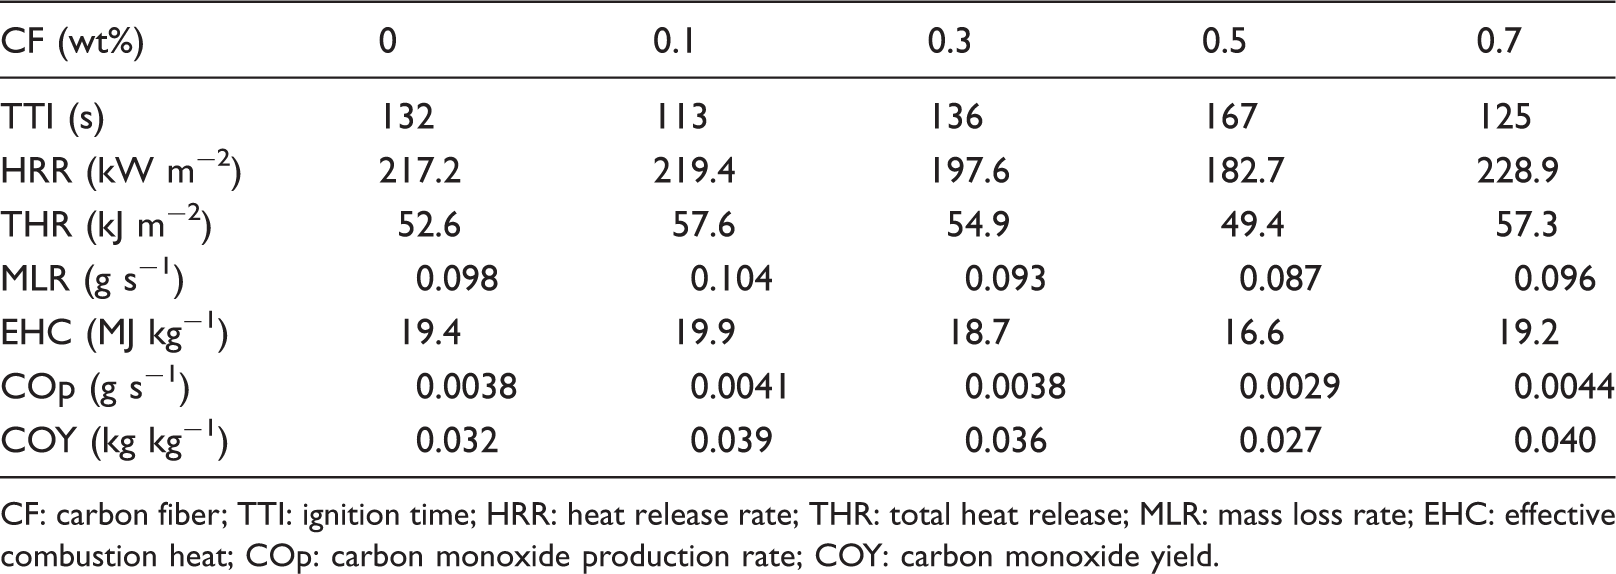
It can be known from Figure 5(a) and Table 4 that the HRR curve of the sample is a pre-monomodal type. As the CF increases, the HRR of the sample basically rises firstly and then decreases. However, when CF is 0.1 wt%, the curve shifts to the left compared to pure EP/PR; in addition, the TTI of the sample is 21 s earlier, and the pHRR is slightly increased. This may be because the CF content is less and the dispersion is uneven, resulting in voids inside the composites, which accelerates the ignition speed. 24 When the CF is 0.3 and 0.5 wt%, the curve shifts to the right and the TTI is delayed by 4 and 35 s, respectively. The pHRR also decreased by 9.9% and 18.9%, respectively. This is because CF will quickly form a carbon layer on the heated surface during the material combustion process, thereby preventing the transfer of heat, slowing down the decomposition rate of the material, and inhibiting the spread of the flame. When the CF is increased to 0.7 wt%, the TTI is 7 s ahead and the pHRR is increased by 5.4%. The material is easier to ignite and the flame retardancy begins to decrease. This is because too much CF causes uneven dispersion in EP/PR. The solidification of the sample is destroyed, which affected the formation of the carbonized layer, and the flame retardancy of the material is reduced. 25
From Figure 5(b) and Table 4, it can be seen that compared to pure EP/PR, the THR of samples with CF of 0.1, 0.3, and 0.7 wt% increased by 9.5%, 4.3%, and 8.9%, respectively. The inset in Figure 5(b) shows the slope of the whole variety tendency of the THR. The slope has not slowed down, indicating that under these three ratios, the effect of CF on suppressing the combustion of the material is not obvious. The THR of only 0.5 wt% of the samples is decreased by 6.1%, and the slope of the curve is slightly slowed. This indicates that CF at this ratio effectively inhibits the combustion of the sample and reduces the fire risk of the material.
As can be seen from Figure 5(c) and Table 4, compared with pure EP/PR, when CF is 0.1 wt%, the time to reach the peak mass loss rate (pMLR) of the sample is greatly advanced, and the pMLR is also increased by 6.1%. This is mainly because the CF content is too small at this time, and the distribution inside the material is uneven and voids are generated, which promotes the combustion of the material to a certain extent. The pMLR of the 0.3 wt% sample is lower than that of pure EP/PR, indicating that CF has effectively suppressed the pyrolysis of the material and reduced the pyrolysis rate of the material. The time to reach pMLR of the 0.5 wt% sample is delayed by 27 s, and the pMLR is also reduced by 11.2%, which significantly inhibits the pyrolysis behavior of the material and effectively reduces the pyrolysis rate of the material, achieving a considerable flame retardant effect. When CF is 0.7 wt%, due to the phenomenon of agglomeration of CF, the pMLR of the material rises again to 0.096 g s−1, and the time to reach pMLR is 35 s earlier than that of pure EP/PR.
From Figure 5(d) and Table 4, it can be seen that when the CF is 0.1, 0.3, and 0.7 wt%, time to reach the peak effective combustion heat (pEHC) is basically consistent with the TTI data and time to reach the pHRR and pMLR. The average value of the EHC of the sample is reduced by 3.6% and 1.1% compared to the pure EP/PR, respectively, when the CF is 0.3 and 0.7 wt%. This shows that CF plays a certain role in suppressing the generation of combustible gas under these ratios. The time taken for the sample to reach the pEHC is delayed by 56 s compared to pure EP/PR, and the average EHC decreased by 14.4% with CF of 0.5 wt%. This has a significant impact on the EHC index of the material, effectively reducing the amount of combustible gas produced by the material, and reducing the fire danger of the material.
Figure 6 shows the carbon monoxide production rate (COp) curve of CF/EP/PR. From Figure 6 and Table 4, it can be seen that the curve of pure EP/PR is relatively smooth in the first 150 s, and suddenly becomes steep after 150 s, and the CO release rate gradually increases, reaching a peak value of 0.0038 g s−1 at 276 s. When CF is 0.1, 0.3, and 0.7 wt%, the peak COp of the sample is higher than that of pure EP/PR. When CF is 0.5 wt%, the time to reach the peak COp of the sample is delayed, and the peak is slightly lower. The average carbon monoxide yield (COY) is reduced by 18.5% compared with pure EP/PR. This shows that a proper amount of CF has a certain effect in suppressing the toxic gas CO, which reduces the release rate and the amount of CO. The slower the rate of CO produced when the material is burned, the longer the evacuation time of the personnel, and the higher the fire safety.
Carbon monoxide production rate (COp) curves of different samples.
Thermal gravimetric analysis
The sample was heated at a heating rate of 10℃ min−1 in an air atmosphere, and the temperature was increased from 40℃ to 800℃. Figure 7 shows the TG and differential thermal gravity (DTG) curves of different samples. EP/PR weightlessness is divided into three stages. The first stage is from 50℃ to 300℃. Under the effect of temperature, the bulk density of the sample changes, and free formaldehyde volatilizes. During the temperature rise from 200℃ to 300℃, the ether bond is decomposed to generate hydroxyl and carboxymethyl and other small molecules. Observing the TG curve at this time, it is found that the addition of CF does not improve the initial decomposition temperature of the material. In the second stage, the methylene group is pyrolyzed and dehydrated with hydrogen and phenolic hydroxyl groups on the benzene ring. The cross-linking density of the material is further increased, and carbonization starts (about 450℃). Then the temperature continues to rise and methylene continues to decompose. From the final decomposition of hydroperoxides to alcohols and ketones, it is found that the addition of CF effectively inhibits the pyrolysis of the material. In addition, from the inset in Figure 7(a), the slope of the curve decreases with increasing CF content. This shows that the pyrolysis process of the material is delayed and slowed down. From the corresponding DTG curve, we can see that the material reached the peak of pyrolysis rate at this stage. When CF is 0.5 and 0.7 wt%, the pyrolysis peak of the sample is reduced and the peak area is smaller than that of the others, that is, the mass loss of the material is less, indicating that CF plays a role in inhibiting the pyrolysis rate of the material at this stage. The main reaction in the third stage is dehydrocarbonization, which releases CO, CO2, CH4, H2, and other gases, and finally forms a carbide. At 570℃, the quality of each sample is basically stable. At this stage, we can see from the TG curve that as the CF increases, the material quality quickly reaches stability. This shows that CF prevents the further occurrence of pyrolysis to a certain extent, reducing the number of escaped small gas molecules, and improving the carbon residue rate of the material. It can be seen from the DTG curve that the pyrolysis of the sample added with CF basically ends at 500℃, the pyrolysis rate decreases rapidly, and the quality tends to be stable. Calculated from the TG results, the carbon residue at 800℃ is 2.36% at 0.5 wt%, which is 60.4% higher than that of pure EP/PR. At 0.7 wt%, it reaches a maximum of 2.65%, which is 80.1% higher than that of pure EP/PR.
(a) Thermogravimetry and (b) differential thermal gravity (DTG) curves of different samples.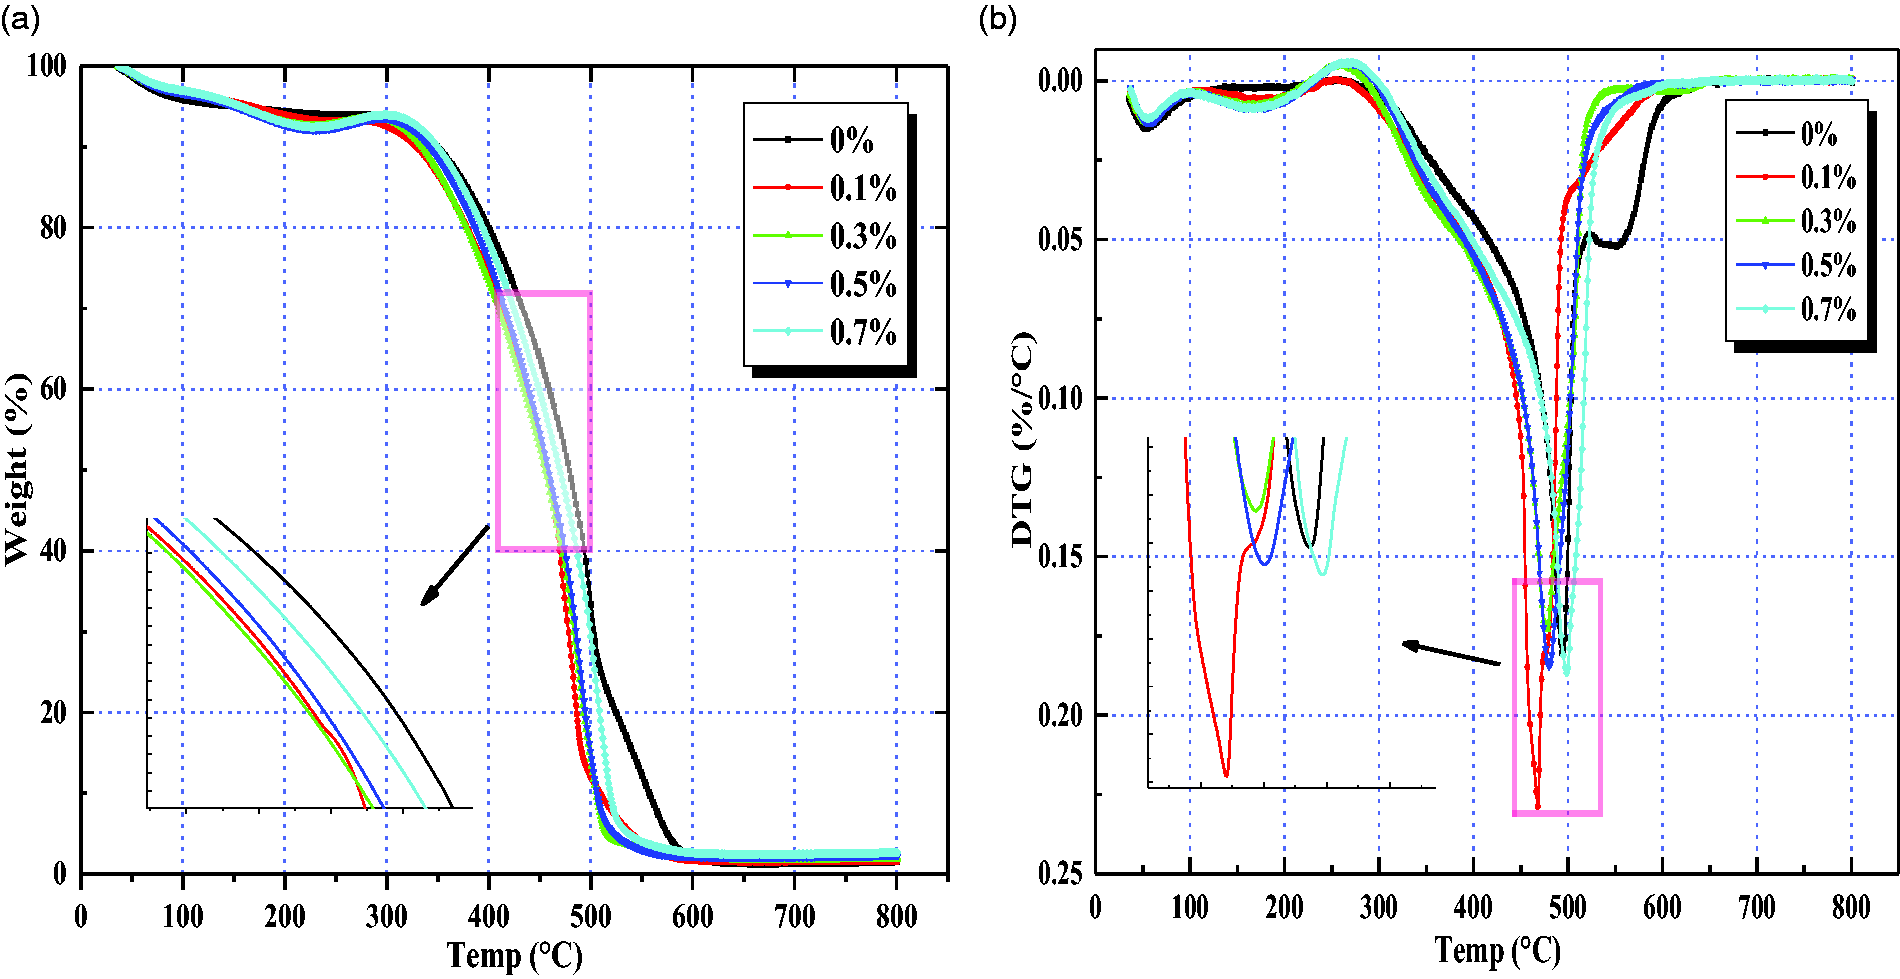
Pyrolysis kinetics analysis
The activation energy of a polymer refers to the lower limit of the energy required for a material to undergo a chemical reaction. The higher its value is, the less likely it is that the material will undergo pyrolysis and the better its thermal stability becomes. In this experiment, the Coats–Redfern method was used to calculate the apparent activation energy of each sample from the thermal weight loss data of samples with different CF ratios and analyze their thermal stability. The Coats–Redfern method is a classical integration method used to calculate the pyrolysis parameters of materials when there is only one heating rate in the study of pyrolysis kinetics. 26 When a material consists of one or more first-order irreversible reactions, the pyrolysis kinetics expression is as follows, where n is the reaction order.
When n = 1

When n ≠ 1

Figure 8 shows the curves obtained by fitting the pyrolysis data by the Coats–Redfern method, where n = 1 and n = 0, respectively, to determine the effect of the value of n on the results. When n = 1, Fitting curves of pyrolysis kinetics of different samples. Pyrolytic apparent activation energy of different samples CF: carbon fiber.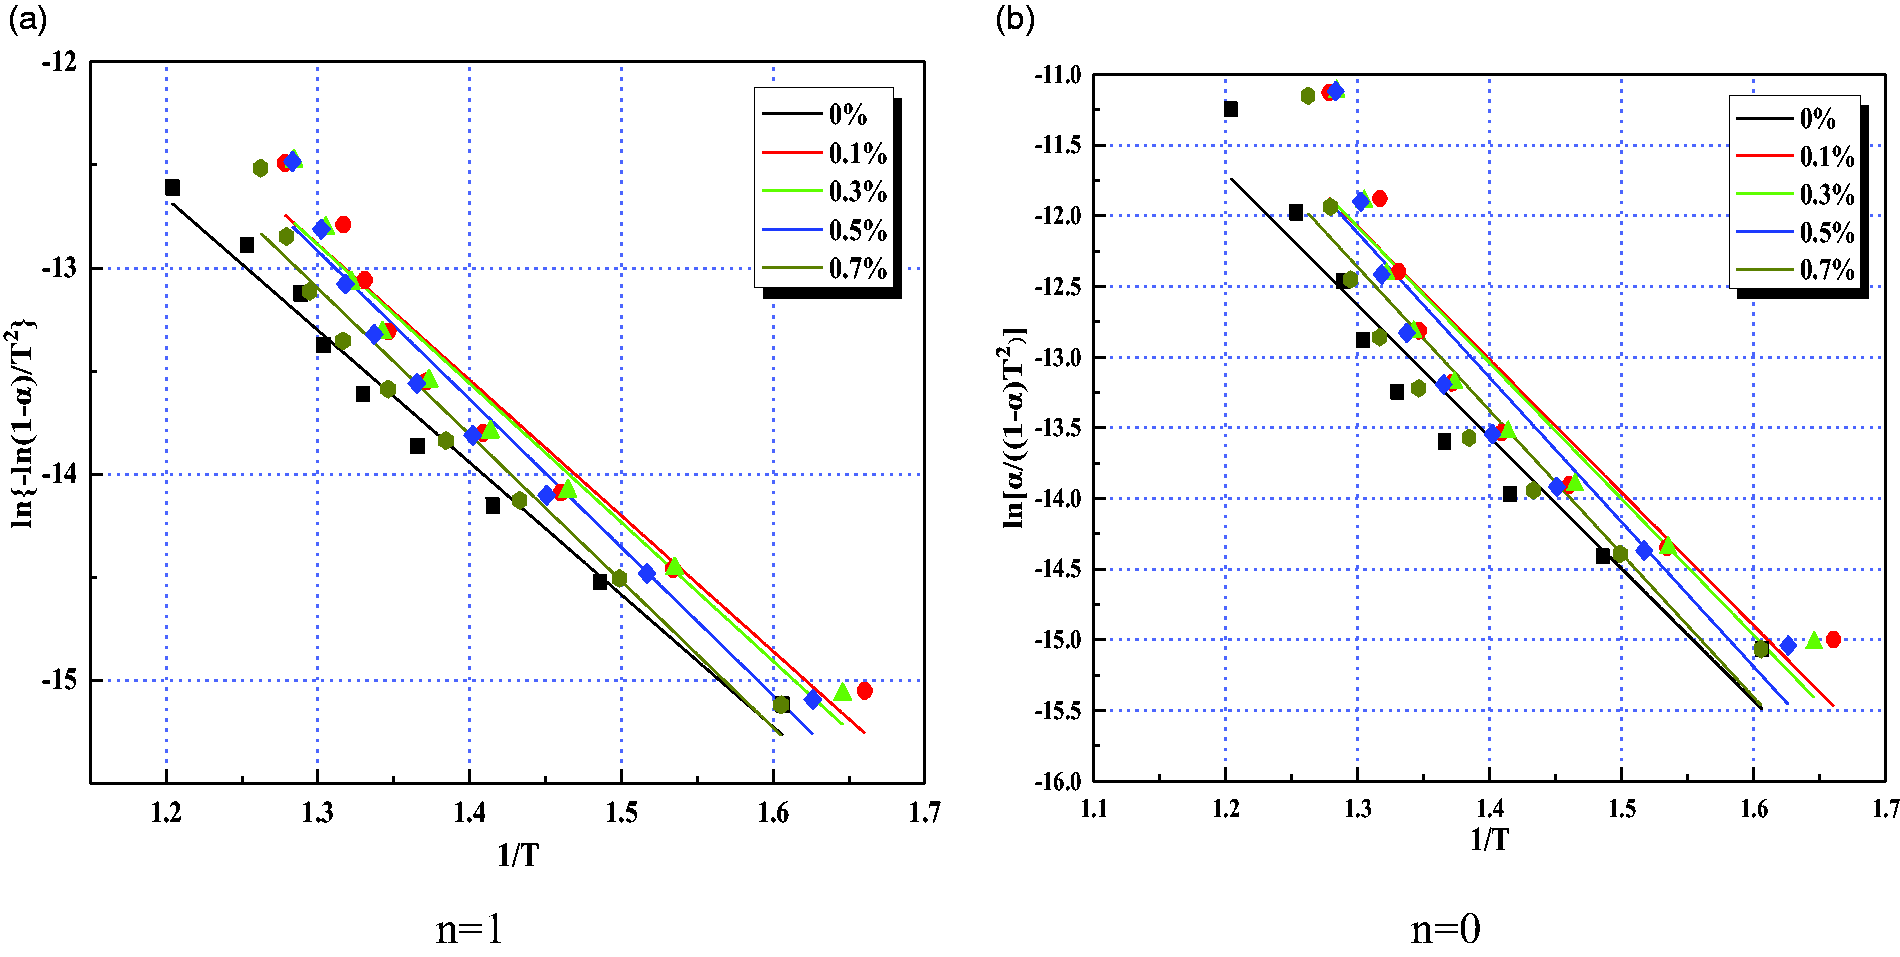
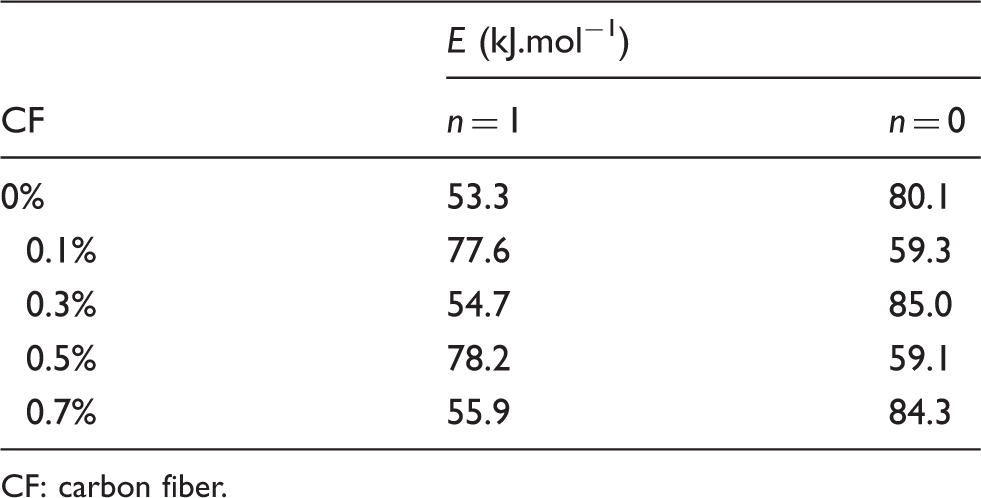
As shown in Figure 8, it can be seen that the curve fitting is better when n = 1, and the curve fitting effect is not ideal when n = 0, which indicates that the reaction order of the actual pyrolysis process of the material is closer to 1.0. However, the trend of the two curves obtained by the two values basically coincides with the calculated trend of the activation energy value, indicating that the addition of CF does increase the apparent activation energy of the material. Since DTG shows that there is only one peak in the pyrolysis rate of the material during the pyrolysis process, the nine values of the material from the beginning of the pyrolysis to the basic end of the pyrolysis are selected at the value of α, and they are regarded as a unified thermal solution phase. These nine parameters are used for curve fitting together, and the curve slopes corresponding to different CF ratio samples are obtained. It can be seen from the curve that when the CF increases, the slope of the curve becomes smaller. This shows that the activation energy of the sample is increasing, and the difficulty of pyrolysis reaction of the material is increased. When the value of n is set to 1.0, the activation energy of 0.1, 0.3, and 0.7 wt% CF samples are all higher than that of pure EP/PR. The material with CF of 0.5 wt% has the most significant improvement, and the apparent activation energy is 11.3% higher than that of pure EP/PR. The minimum energy for the material to undergo a pyrolysis reaction is increased, thereby improving the thermal stability of EP/PR.
Analysis of tensile properties
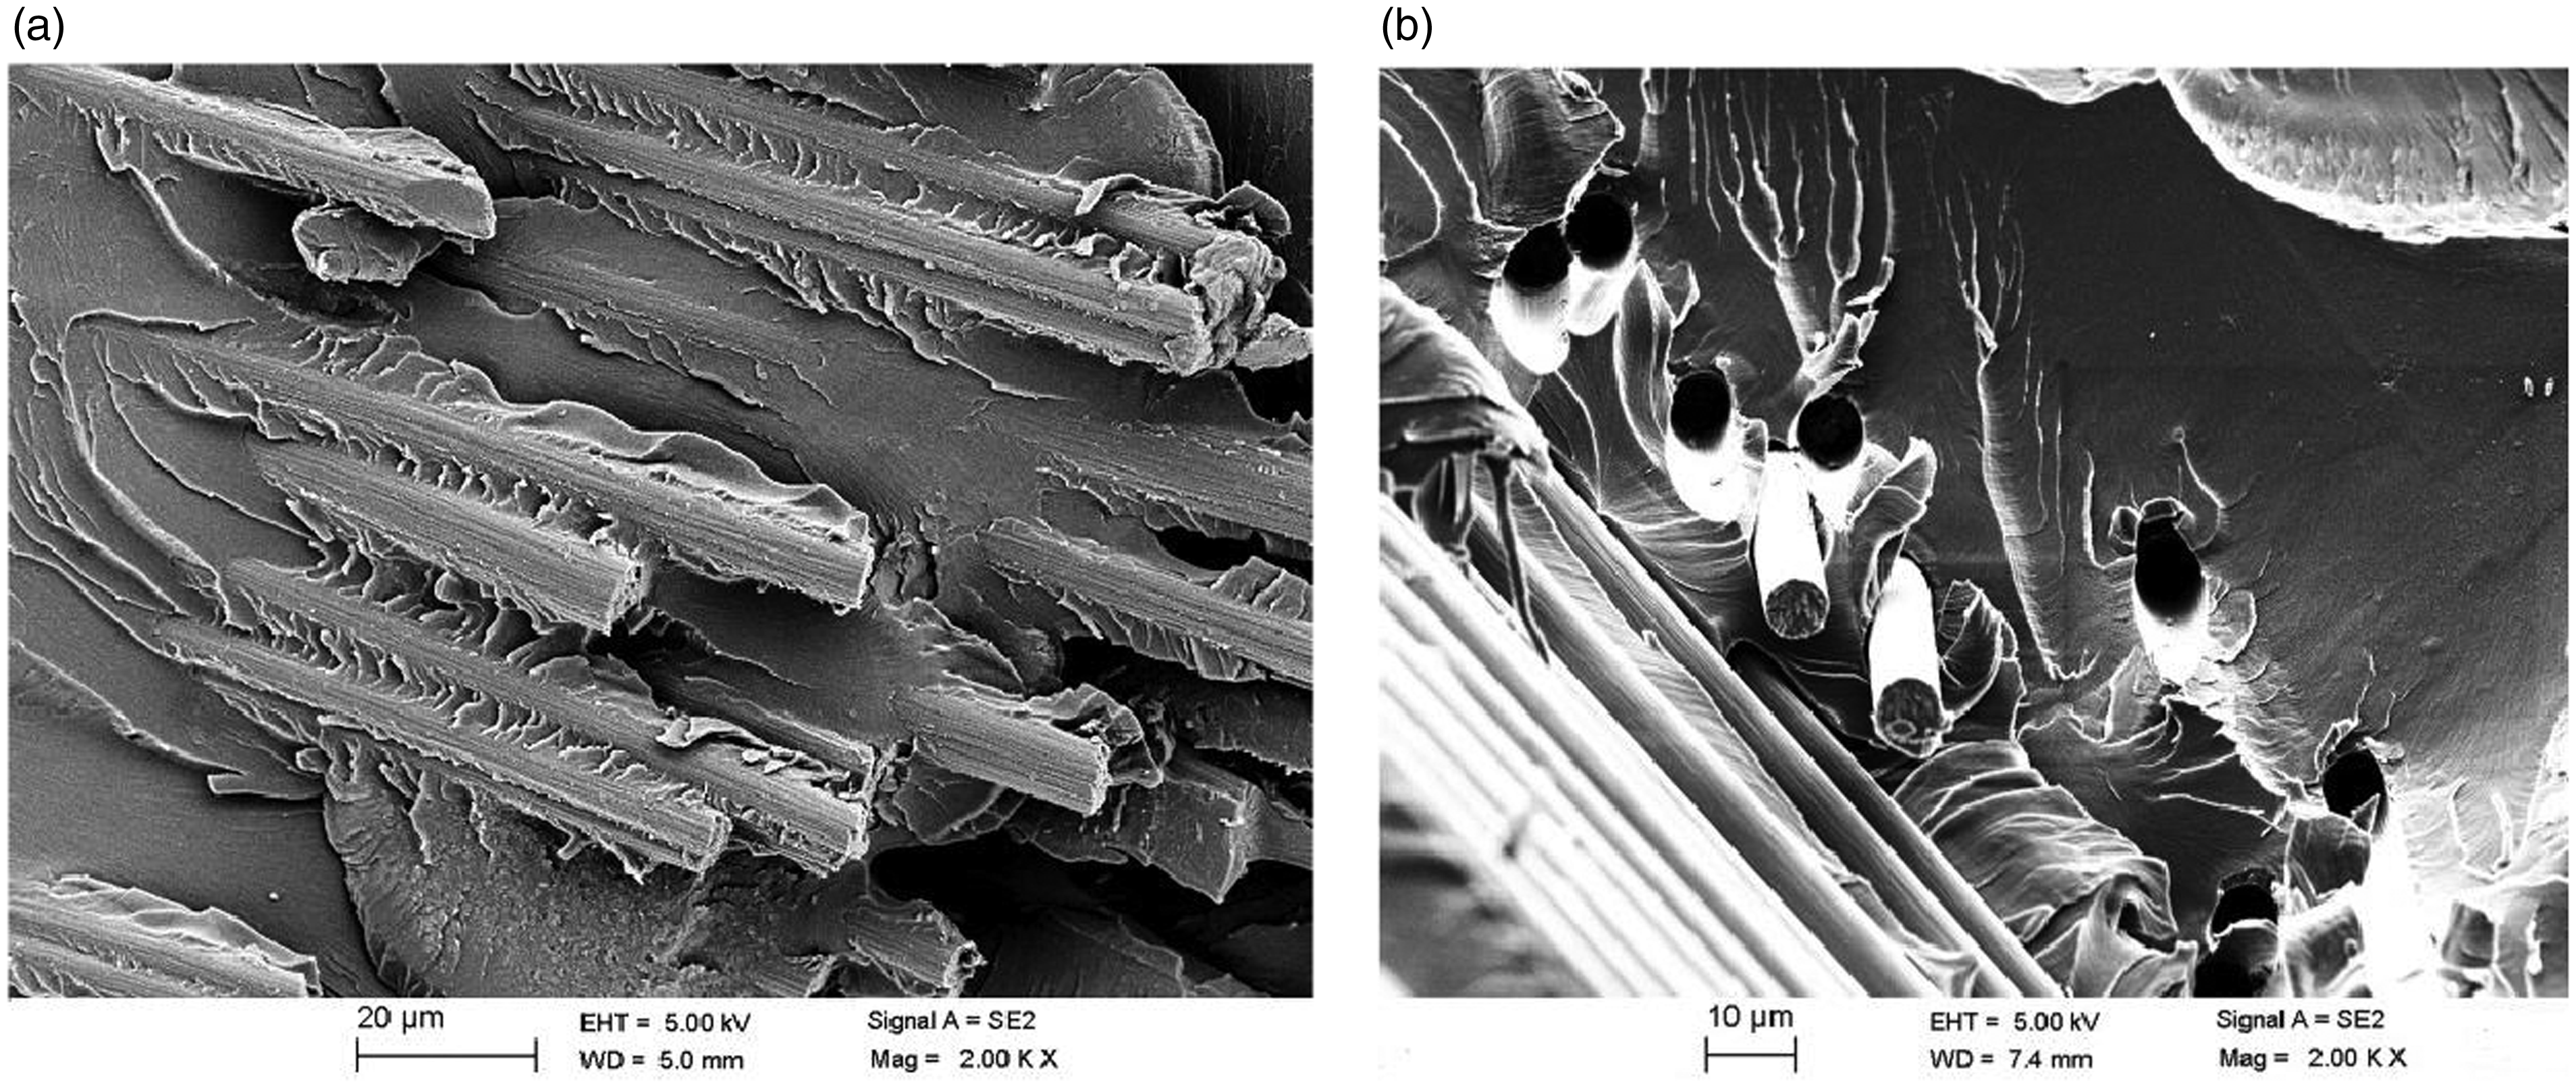
Figure 9 shows the tensile strength and elastic modulus of different samples. It can be seen from Figure 8 that with the increase of the CF, the tensile strength and elastic modulus of the samples both increase first and then decrease. The tensile strength of the test piece reaches a maximum of 34.75 MPa when the CF is 0.5 wt%, which is 90.4% higher than that of pure EP/PR. The tensile elastic modulus reaches 366.379 MPa, which is 87.9% higher than that of pure EP/PR. This shows that at this time, the interface effect between CF and resin is good, and it can be effectively transferred to CF when external force is applied, fully utilizing the advantages of CF's high strength, thereby improving the mechanical properties of the material. However, when CF is 0.7 wt%, the tensile strength of the material decreases to 30 MPa, and the tensile elastic modulus also decreases to 283.904 MPa. The main reason for this is that too much CF reduces the degree of dispersion and agglomeration occurs, which causes the adhesion between CF and resin to deteriorate, and weaker adhesion interfaces are formed. When external force is applied, the CF of the weakly bonded interface is desorbed and pulled out, and the transfer of stress cannot be completed, thereby reducing the tensile properties of the material. Correspondingly, Figure 10 shows the SEM images of the sample with 0.5 wt% CF. As can be seen in Figure 10(a), the surface of the CF is etched and appears rough. The surface of CF is tightly wrapped by resin, and the dispersion is more uniform. This indicates that the surface treatment of CF results in good interfacial properties, so that it can perfectly blend with the resin matrix to perform well. The above enhanced properties can verify this. From Figure 10(b), there are many holes in the surface of the resin. It is produced when CF is pulled out under a certain tension. When the sample is stressed, the resin can transfer the stress to the CF, and the direction of the force will also be transmitted along the orientation of the CF,
27
so that the CF can be uniformly applied and the high-strength characteristics of the CF can be effectively exerted. Transmitting this force also functions as an energy dispersion effect to a certain extent, thus improving the mechanical properties of the resin matrix.
Tensile strength and elastic modulus of different samples. SCF: short carbon fiber. Scanning electron microscopy analysis of carbon fiber (CF)/epoxy resin/phenolic resin composites: (a) dispersion state of CF in the resin magnified by 2000×; (b) tensile fracture surface magnified by 2000×.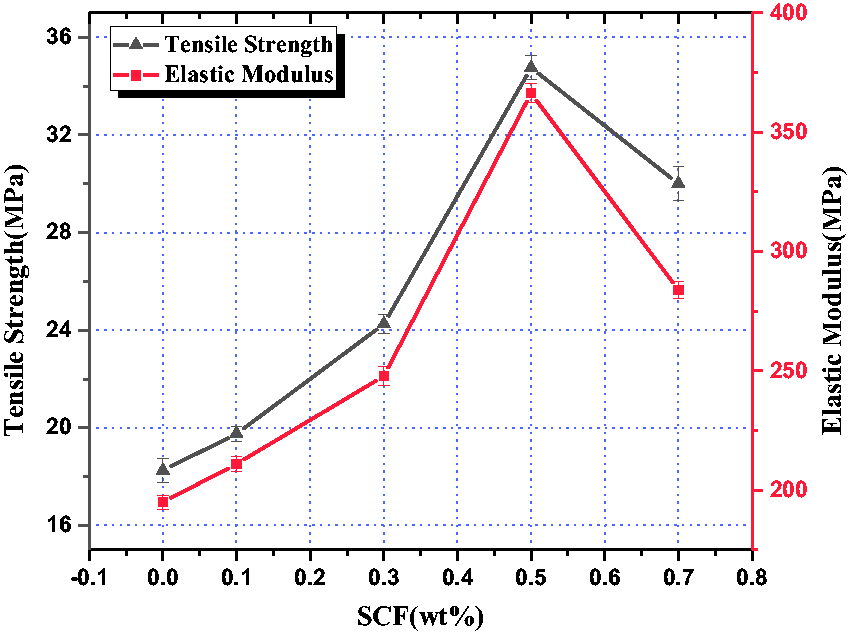
Macroscopic morphology and SEM microstructure analysis of samples
In order to explore the modification mechanism of CF on EP/PR, the macroscopic morphology and microstructure of the combustion products of the cone calorimetry experiment are analyzed.
Figure 11 shows the morphology of the combustion products after the cone calorimetry test of different samples. It can be seen from the figure that the addition of CF has a significant effect on the morphology of the combustion products of the sample. The structure of pure EP/PR material is broken after combustion, and the carbon layer is incomplete and broken into small pieces. With the increase of the CF content, the cracks of the combustion products of the sample become less, and the sample becomes more and more complete. This is mainly because the modified CF has introduced active groups on the surface and can be fully wet with the resin under the action of the silane coupling agent, forming a good bonding interface, so the physical structure of the material becomes firmer. In addition, the addition of CF will make the material quickly form a tight carbon layer and arch during the combustion process, which protects the lower material and limits the further combustion of the material. Moreover, CF itself has excellent high-temperature resistance characteristics, and can disperse heat during the combustion process, thereby enhancing the flame retardant performance of the material as a whole.
Morphology of combustion products after cone testing of different samples: (a) epoxy resin/phenolic resin; (b) 0.1 wt% carbon fiber (CF); (c) 0.3 wt% CF; (d) 0.5 wt% CF; (e) 0.7 wt% CF.
Figure 12 shows the microstructures of the combustion products of PR, EP/PR, and CF/EP/PR. Comparing Figures 12(a) and (c), it is found that after adding EP, there will be more voids on the surface of the material after combustion. This is mainly because during the curing process of EP/PR, water molecules will be evaporated due to the presence of epoxy groups, leaving traces on the surface of the material, which will cause the surface of the material to be uneven after combustion and there will be a large number of voids. Comparing Figures 12(c) and (d), it can be found that the addition of CF results in a large change in the microstructure of the material, and the CF is surrounded by a resin matrix, forming a more stable physical structure and thereby enhancing the toughness of the material. At the same time, this structure also helps the carbonization of EP/PR, which can reduce the heat released during the pyrolysis reaction and the efficiency of the material's thermal conduction. During the combustion process of PR, the temperature is as high as 700℃ or more, and carbonization of the material occurs. The process of carbon formation is generally divided into four stages: cross-linking, aromatization, melting of aromatic rings, and turbine-shaped layered carbon formation. The main structure of the carbon layer is an aromatic ring. The addition of CF is beneficial to increase its aromatic content, and makes the structure of the carbon layer more compact and complete, thereby improving the flame retardancy of the material.
Microstructures of the combustion products of phenolic resin (PR), epoxy resin (EP)/PR, and carbon fiber/EP/PR: (a) (c) (e) are 500 × magnified images and (b) (d) (f) are 2000 × magnification images.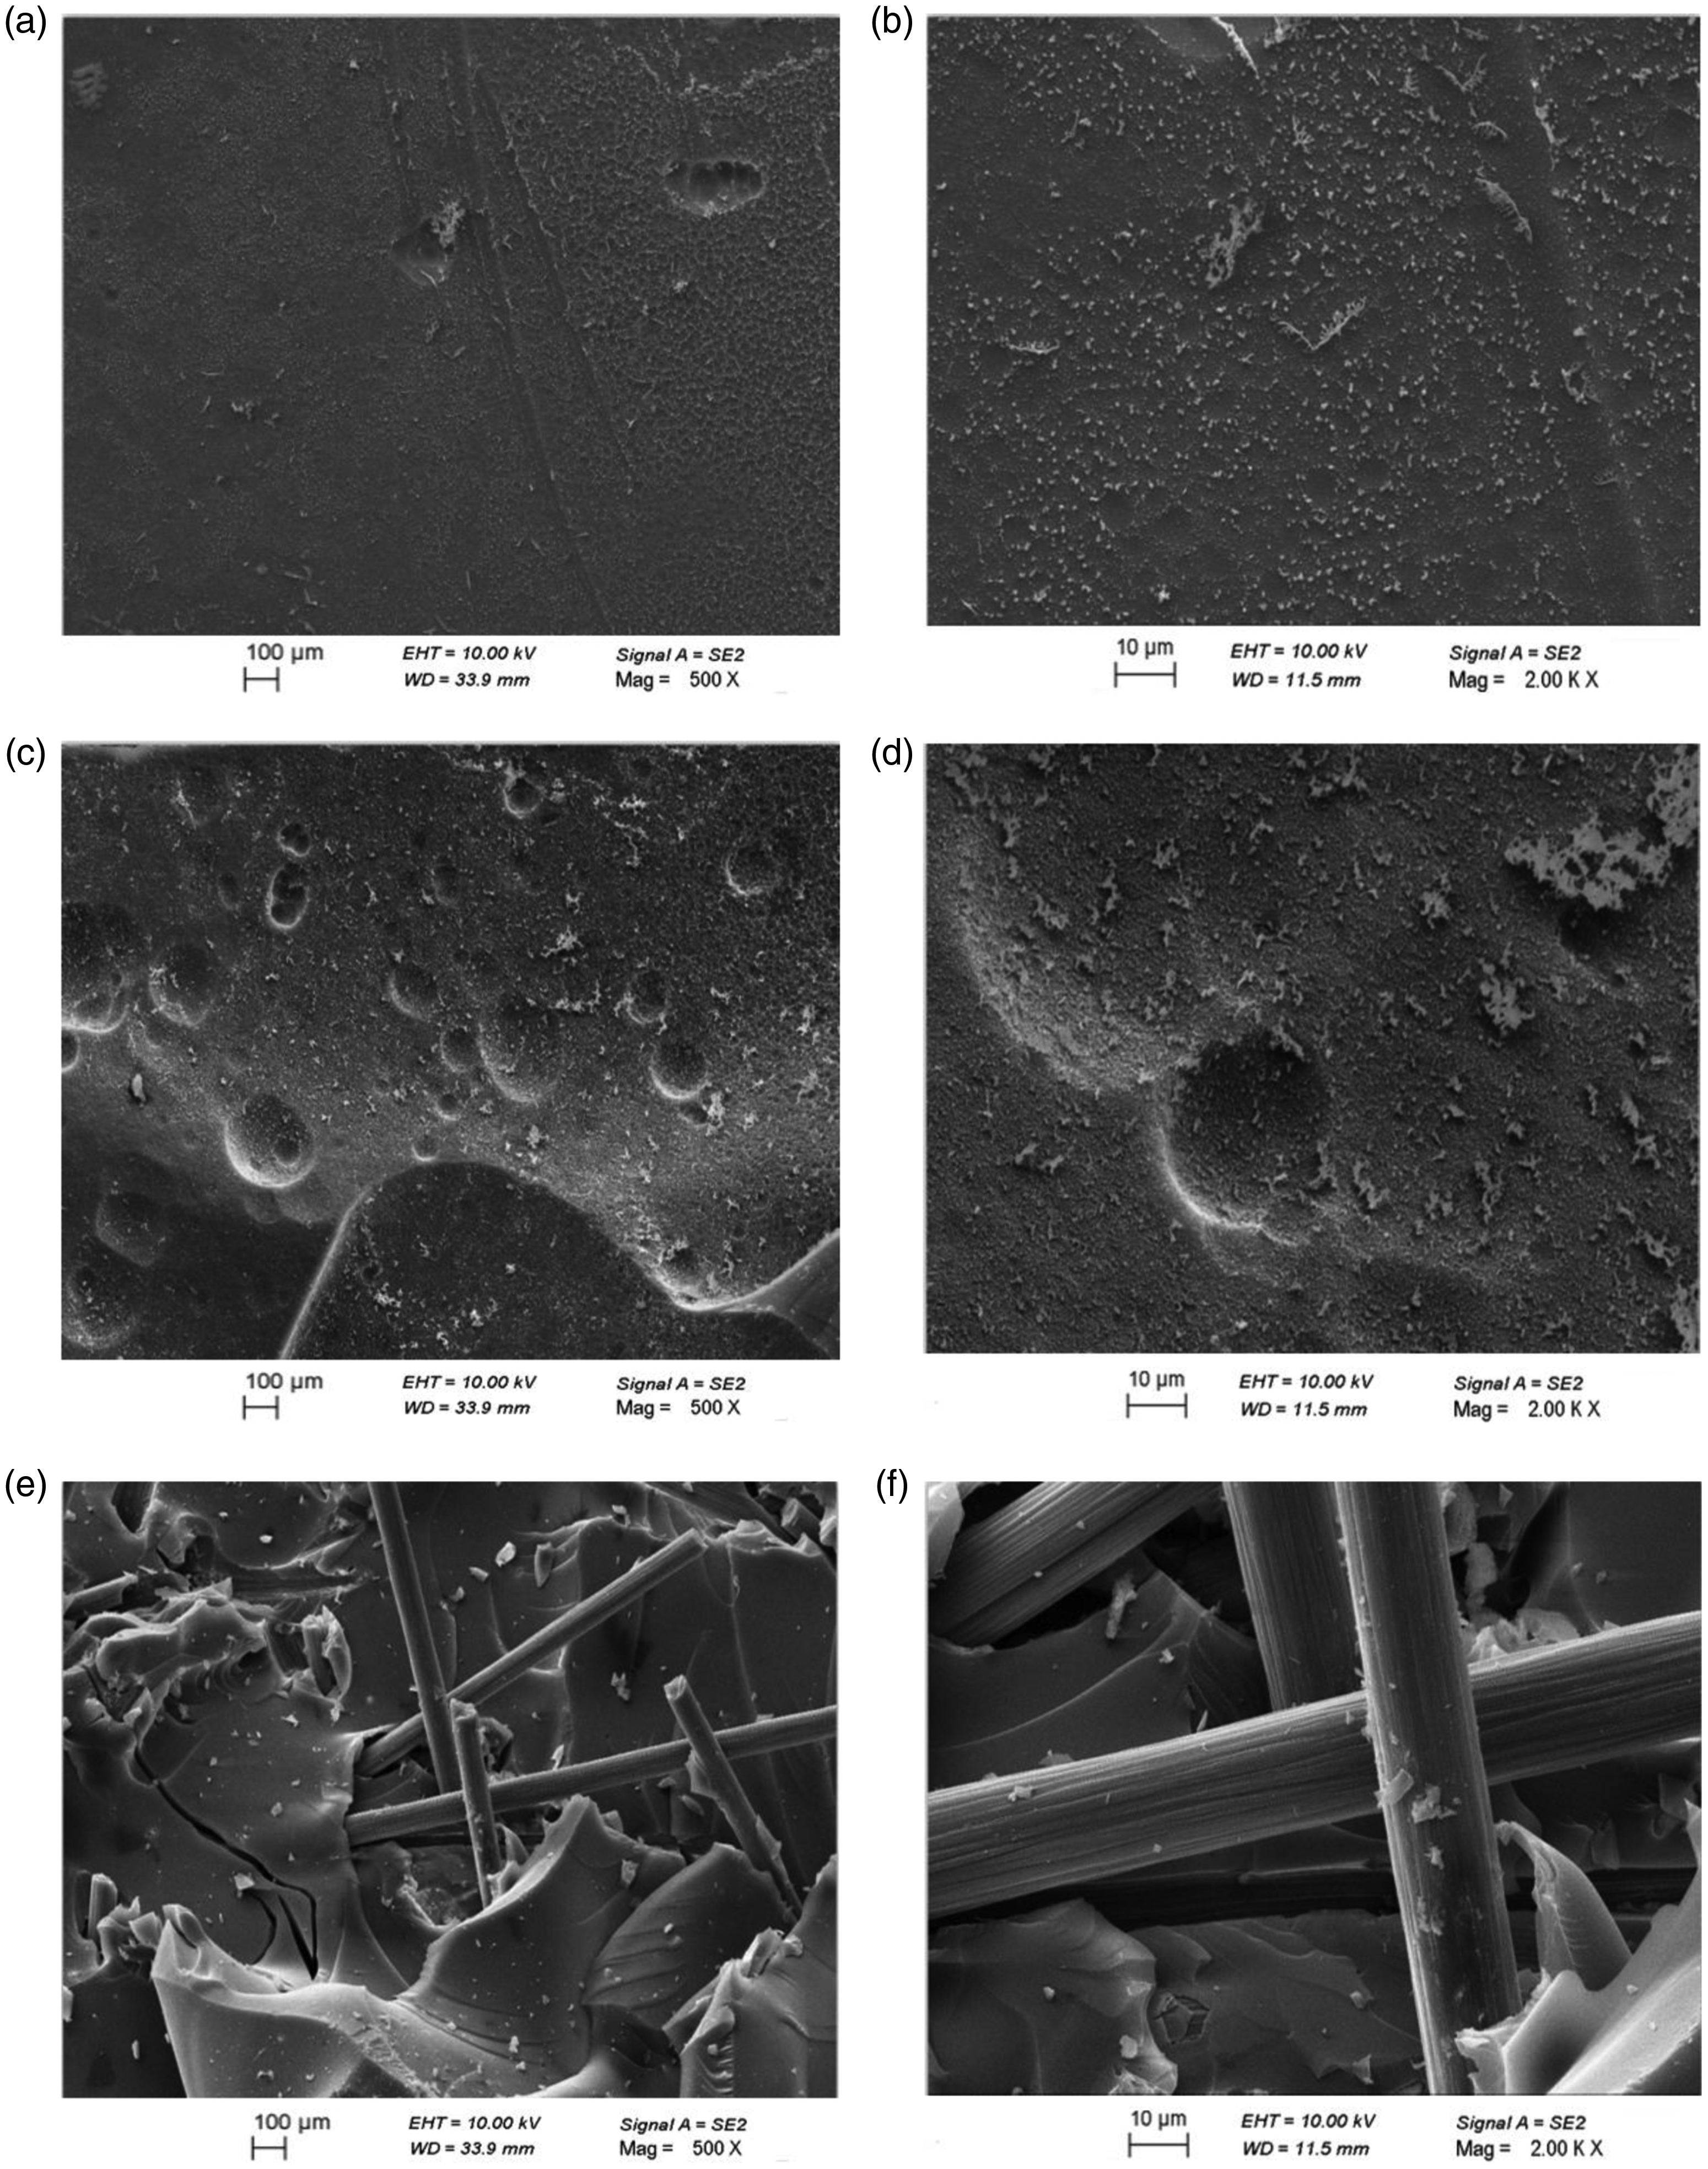
Conclusions
In this paper, EP/PR and CF/EP/PR were prepared by physical blending. The flame retardancy and mechanical properties of the material were studied by an oxygen index meter, cone calorimeter, thermogravimetric analyzer and tensile test. The main findings are as follows.
When EP is 5 wt%, it not only retains the excellent flame retardancy of PR, but also greatly enhances the mechanical properties of PR. The oxygen index is reduced by 6.3%, the TTI is reduced by 32 s, and the pHRR is increased by 8.9%. Its tensile strength is increased significantly at 5 wt% and reached its peak at 15 wt%. The proper amount of CF can enhance the flame retardancy and mechanical properties of EP/PR. When CF is 0.5 wt%, its oxygen index is increased by 4.6%, the TTI is 35 s, the pHRR is decreased by 18.9%, and the carbon monoxide production is reduced by 18.5%. The carbon residue ratio of the material at 600℃ reaches 2.36%, which is 60.4% higher than that of pure EP/PR, and the apparent activation energy is increased by 11.3%. The carbon-forming ability and amount in the process enhanced the material's ability to block heat. The tensile strength and elastic modulus are increased by 90.4% and 87.9%, respectively, compared to pure EP/PR. It can be verified from SEM that the CF will form an ordered and stronger physical structure with the resin molecules, thereby toughening the matrix and preventing its pyrolysis.
Footnotes
Declaration of conflicting interests
The authors declared no potential conflicts of interest with respect to the research, authorship, and/or publication of this article.
Funding
The authors disclosed receipt of the following financial support for the research, authorship, and/or publication of this article: This work was supported by the Future Scientists Program of the “Double First Class” of China University of Mining and Technology (Grant No. 2019WLKXJ055).