



Abstract
The method to obtain the breaking strength and elongation distribution of fiber through numerous single fiber tests is tedious and time-consuming. In the present work, a method based on acoustic emission (AE) signals generated by fiber fracture during the fiber bundle test has been developed for estimating the distribution of single wool breaking strength and elongation. AE detection is performed simultaneously during the fiber extension. According to the AE signal, it is proved that every individual fiber break can be detected, and the failure probability distribution of wool elongation can be obtained. Based on this, the single wool breaking strength is estimated from the tensile response of the fiber bundle, and then its distribution can be deduced. Finally, the distributions of breaking strength and elongation determined by the bundle test are compared with that obtained from the single fiber samples. The results show that the method developed in this work can be used to estimate the breaking strength and elongation of the single fiber within the bundle. Their cumulative probability distributions are similar to the results of single fiber sample tests, especially the distribution of the breaking strength.
The breaking strength and elongation are important tensile properties of textile materials. Estimating the single tensile properties from the bundle test is a traditional research topic of textiles. Dhavan et al.1 derived a mathematical model to predict the tensile properties of single cotton fibers from bundle load–elongation curves; the average breaking extension, coefficient of variation of breaking extension, and the average breaking strength were obtained. Cui et al.2,3 developed a method to estimate single cotton fiber tensile properties from the load–elongation curves of slack fiber bundles. The method is applied to bundle load–elongation curves from High Volume Instrument (HVI) tests to estimate the average of fiber breaking strength, elongation, and crimp. The average breaking strength and elongation can be obtained from the fiber bundle test through the mathematical models developed by the previous researchers.1 However, the average value cannot characterize the degree of dispersion and distribution of the tensile parameters. The estimated values of the fiber properties indicates that the accuracy needs to be further improved.
Some research has been proposed to estimate the function parameters of the frequency density distribution based on the linear elastic property of fiber. Two methods for determining the parameters of the Weibull distribution function are developed based upon the analysis of the tensile curves of fiber bundle by Chi et al.4 The first method focuses on the relation between the shape of the fiber bundle tensile curve and the survivability of the bundle; the second method makes use of the relation between the maximum load point of the fiber bundle tensile curve and the shape parameter of the Weibull distribution. Creasy5 proposed a method for extracting Weibull failure parameters from the fiber bundle tensile test by Fourier deconvolution. The fiber bundle test was performed by using gripping techniques that result in distributed filament lengths. The widened length distribution shifts the response from catastrophic failure to a more even sequence of filament failures. However, they are based on linear elastic fiber, such as carbon fiber or glass fiber, which follows the two-parameter Weibull distribution function. It may not be suitable for non-linear elastic fiber, such as wool. Furthermore, the disagreement between parameters taken from single filament testing and the proposed bundle test still is not resolved.
Theoretical studies on the tensile behavior of ideal fiber bundles were conducted by Peirce,6 Coleman,7 Radhakrishnan and Shelat,8 and Nachane and Krishna Iyer.9 Yu et al.10 described a new theoretical calculation to estimate the tenacity and breaking extension distribution of single fibers from bundle tensile curves using the characteristics of specific stress–strain curves. The experimental and estimated results obtained from the fiber bundle tests and the single fiber measurements agree with each other. Phoenix11,12 presented methods for computing the asymptotic tensile strength distribution of a bundle of a finite number of fibers. Besides, the random fiber slack effects are shown to cause an additional loss in bundle strength over that already caused by variations in fiber breaking elongation. Bundles constructed of more than one generic type of elastic fiber in fixed blend ratios are shown to suffer strength losses over those of bundles constructed of only one fiber type.
However, the theoretical models are mostly strictly for the sample or the test condition and are usually based on several ideal assumptions. For the aim to estimate the tensile properties of the single fiber and fiber bundle in a convenient and relatively quick method, acoustic emission (AE) detection is proposed during the fiber bundle test. Cowking et al.13 showed that individual fiber breaks in the lubricated bundles of a few hundred parallel E-glass fibers can be detected to the last fiber using AE. The AE monitoring of the E-glass fiber bundle under tension enabled the time of occurrence and linear location of each fiber fracture to be determined. Based on the corresponding number of fiber fractures, the parameters of the Weibull distribution function can be obtained. It has been established that AE can be used as a suitable means of determining fracture strength distribution of E-glass fibers in a strand under tension.14 Velu et al.15 detected and analyzed the AE generated during the tensile fracture of each of the single fibers in a cotton bundle. The acoustic pulse height and width are recorded coincident with the tensile breaking load and breaking elongation. The AE technique gives additional information on the fiber breaking process.16 The statistical Weibull parameters can be extracted from the survival probability–strain curves with good accuracy. However, the widespread AE signal parameters arising from similar fiber break events would appear to preclude the use of AE to determine fracture stresses of the individual fiber.17–19 The large scatter of measured AE parameters for fiber fractures of similar energy probably originates at the AE source.
Most research on estimating the tensile behavior from a single fiber to a fiber bundle or from a fiber bundle to a single fiber has focused on man-made filaments, such as Kevlar, E-glass, and carbon fibers. However, studies on fiber bundles of natural fibers have rarely been reported. Besides, a catastrophic failure is usually found in previous researches on fiber bundles, which caused problems in extracting the distribution parameters of single fibers and predicting the tensile response of fiber bundles.5 The wool fiber bundle failure is in a wide strain region, which leaves less chance of multiple filament fracture. This can not only make the fiber bundle data more reliable but also enhance the accuracy of AE detection. Therefore, a method based on AE signals generated by fiber fracture during the bundle test has been developed to estimate the frequency density distribution of single wool breaking strength and elongation. AE detection is performed simultaneously during the fiber bundle extension. According to the AE signals, the individual fiber fracture can be detected. The survival data of the wool fiber bundle and the elongation distribution of the single wool are obtained. Based on that, the single wool breaking strength can be estimated from the tensile response of the fiber bundle and the elongation distribution of single wool. It is a combination of the AE technique and the fiber bundle theory. This method can overcome the time-consuming problem of the single fiber test. Furthermore, it can be applied not only to the linear elastic fiber but also to non-linear elastic fiber, such as wool. The results show that the data obtained from the fiber bundle by this method is consistent with the single fiber test results.
Theoretical model
The test of single fiber provides the mean failure strain in a minimum of 10 experiments. However, extracting the shape of the distribution requires testing hundreds of single samples. Therefore, testing the bundle of fiber as a whole is an attractive goal for many researchers. The fiber bundle structure is a simplified yarn structure to some extent. A statistical model of tensile properties is necessary for the successful use of the fiber in structural applications, such as yarns, fabrics, and composites. The method combining the theoretical model of fiber bundles and AE technology can also be applied to the prediction of the tensile response of wool yarn. In the present work, a simple model is developed based on several simplifying assumptions: (1) the fiber length is constant within the bundle; (2) the fiber axes are parallel to the direction of extension and there is no inter-fiber friction within the bundle; (3) the bundle load is suffered equally by the fibers, and the load released by the fractured fiber is evenly distributed among the remaining fibers. Due to the non-linear elastic property of wool, the load suffered by single wool cannot be simply described by the multiplied value of elongation and the initial modulus. Thus, the load born by single wool at any extension e can be expressed as

When the bundle is extended, some weak fibers will break first. Then the load

Here,

Here, m and

As we know, the survivor probability at the extension e is equal to

According to a previous study,22 the breaking strength of wool follows a Log-normal distribution. The failure probability

The same adjustments as to Equation (3) are performed and then the parameters μ and σ can be estimated by Equation (7). Finally, the distribution of single fiber breaking strength can be obtained

Experimental details
Sample preparation
The fibers tested in this paper are 60S wool (22 μm). The wool is collected from the Australia coarse wool tops produced by a domestic wool spinning mill (Tongxiang Xiangxiang Wool Spinning Material Co., Ltd, China). The number of single wool fibers will be fixed on the paper in advance, as shown in Figure 1. The purpose is to minimize the friction between the fibers within the bundle and keep the length of each fiber equal. After the fibers are fixed, the paper will be cut along the dotted line and then fixed on the clips of the instrument. Two kinds of bundle samples are prepared, five bundles with 100 single fibers, and five bundles with 200 single fibers. The samples are all prepared under the standard conditions of 20 ± 2℃ and 65 ± 3% relative humidity.
Schematic diagram of sample preparation.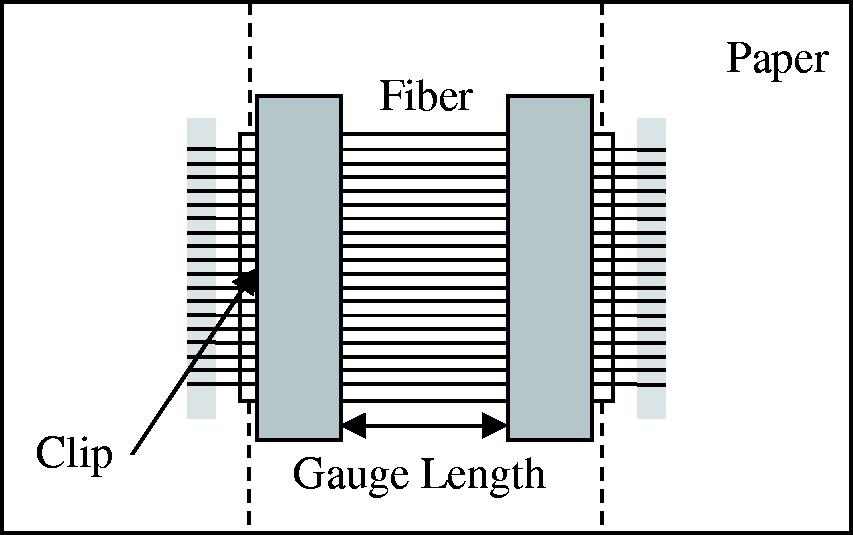
Measurement
A computer-based fiber bundle tester (InFiBTensor, developed by Shanghai Zhongchen Digital Technology Equipment Co., Ltd, China) is used in this study. It consists of two main parts, a tensile strength tester and an AE detector equipped with a microphone and an audio card for data collection. The microphone has a frequency response from 30 Hz to 20 kHz and a sensitivity of −32 dB ± 3 dB (0 dB = 1 V/Pa at 1 kHz). The sampling rate and resolution (quantization accuracy) of the audio card are 88.2 kHz and 16 bits, respectively. The tests are performed under the standard conditions of 20 ± 2℃ and 65 ± 3% relative humidity. The gauge length is set to 10 mm. The extension rate was 0.2 (a) Schematic diagram of the testing device. (b) Instrument photo.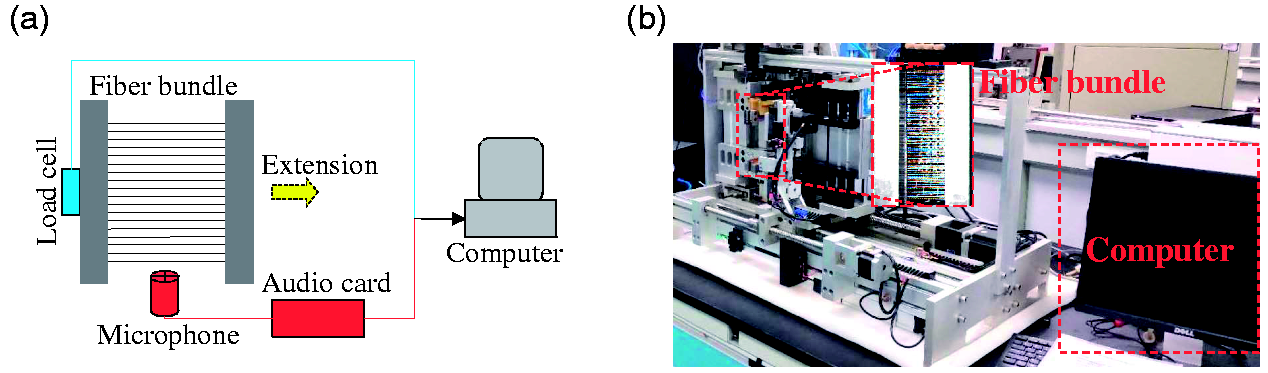
AE signal processing
Since the sound is not collected in an anechoic environment, the original AE signals obtained from the fiber bundle test contain some background noise, such as the mechanical noise from instrument motor motion, electronic noise caused by preamplifiers, etc. The amplitude is an important parameter to describe the signal time-domain characteristic. However, the amplitude of some weak signals is low. It will be difficult to distinguish the signal from noise based on the amplitude of the signal. Therefore, spectral analysis is introduced, such as wavelet analysis. Since the frequency range of signals is usually different from that of noises, it is easier to distinguish the signal from noise in the frequency domain. In wavelet analysis, the wavelet must satisfy the admissibility condition to make the identity of a certain resolution hold. When the scaling parameter in the wavelet is larger, the frequency resolution is higher and the time resolution is lower, mainly for low-frequency signals. When the scale parameter is smaller, the frequency resolution is lower, and the time resolution is higher, mainly for high-frequency signals. The wavelet transform (WT) method is utilized to remove the background noise from the original AE signal in this paper. The processing steps are as follows23: (a) decompose the original signal into six levels with wavelet basis ‘Daubechies 5’ to generate the wavelet coefficients, including six detail coefficients and an approximate coefficient; (b) select the ‘soft thresholding’ function and ‘minimax’ algorithm to remove noises; (c) perform inverse WTs of the thresholded wavelet coefficients to obtain the de-noised signal. The original signal and de-noised signal are shown in Figure 3.
(a) Original signal. (b) De-noised signal.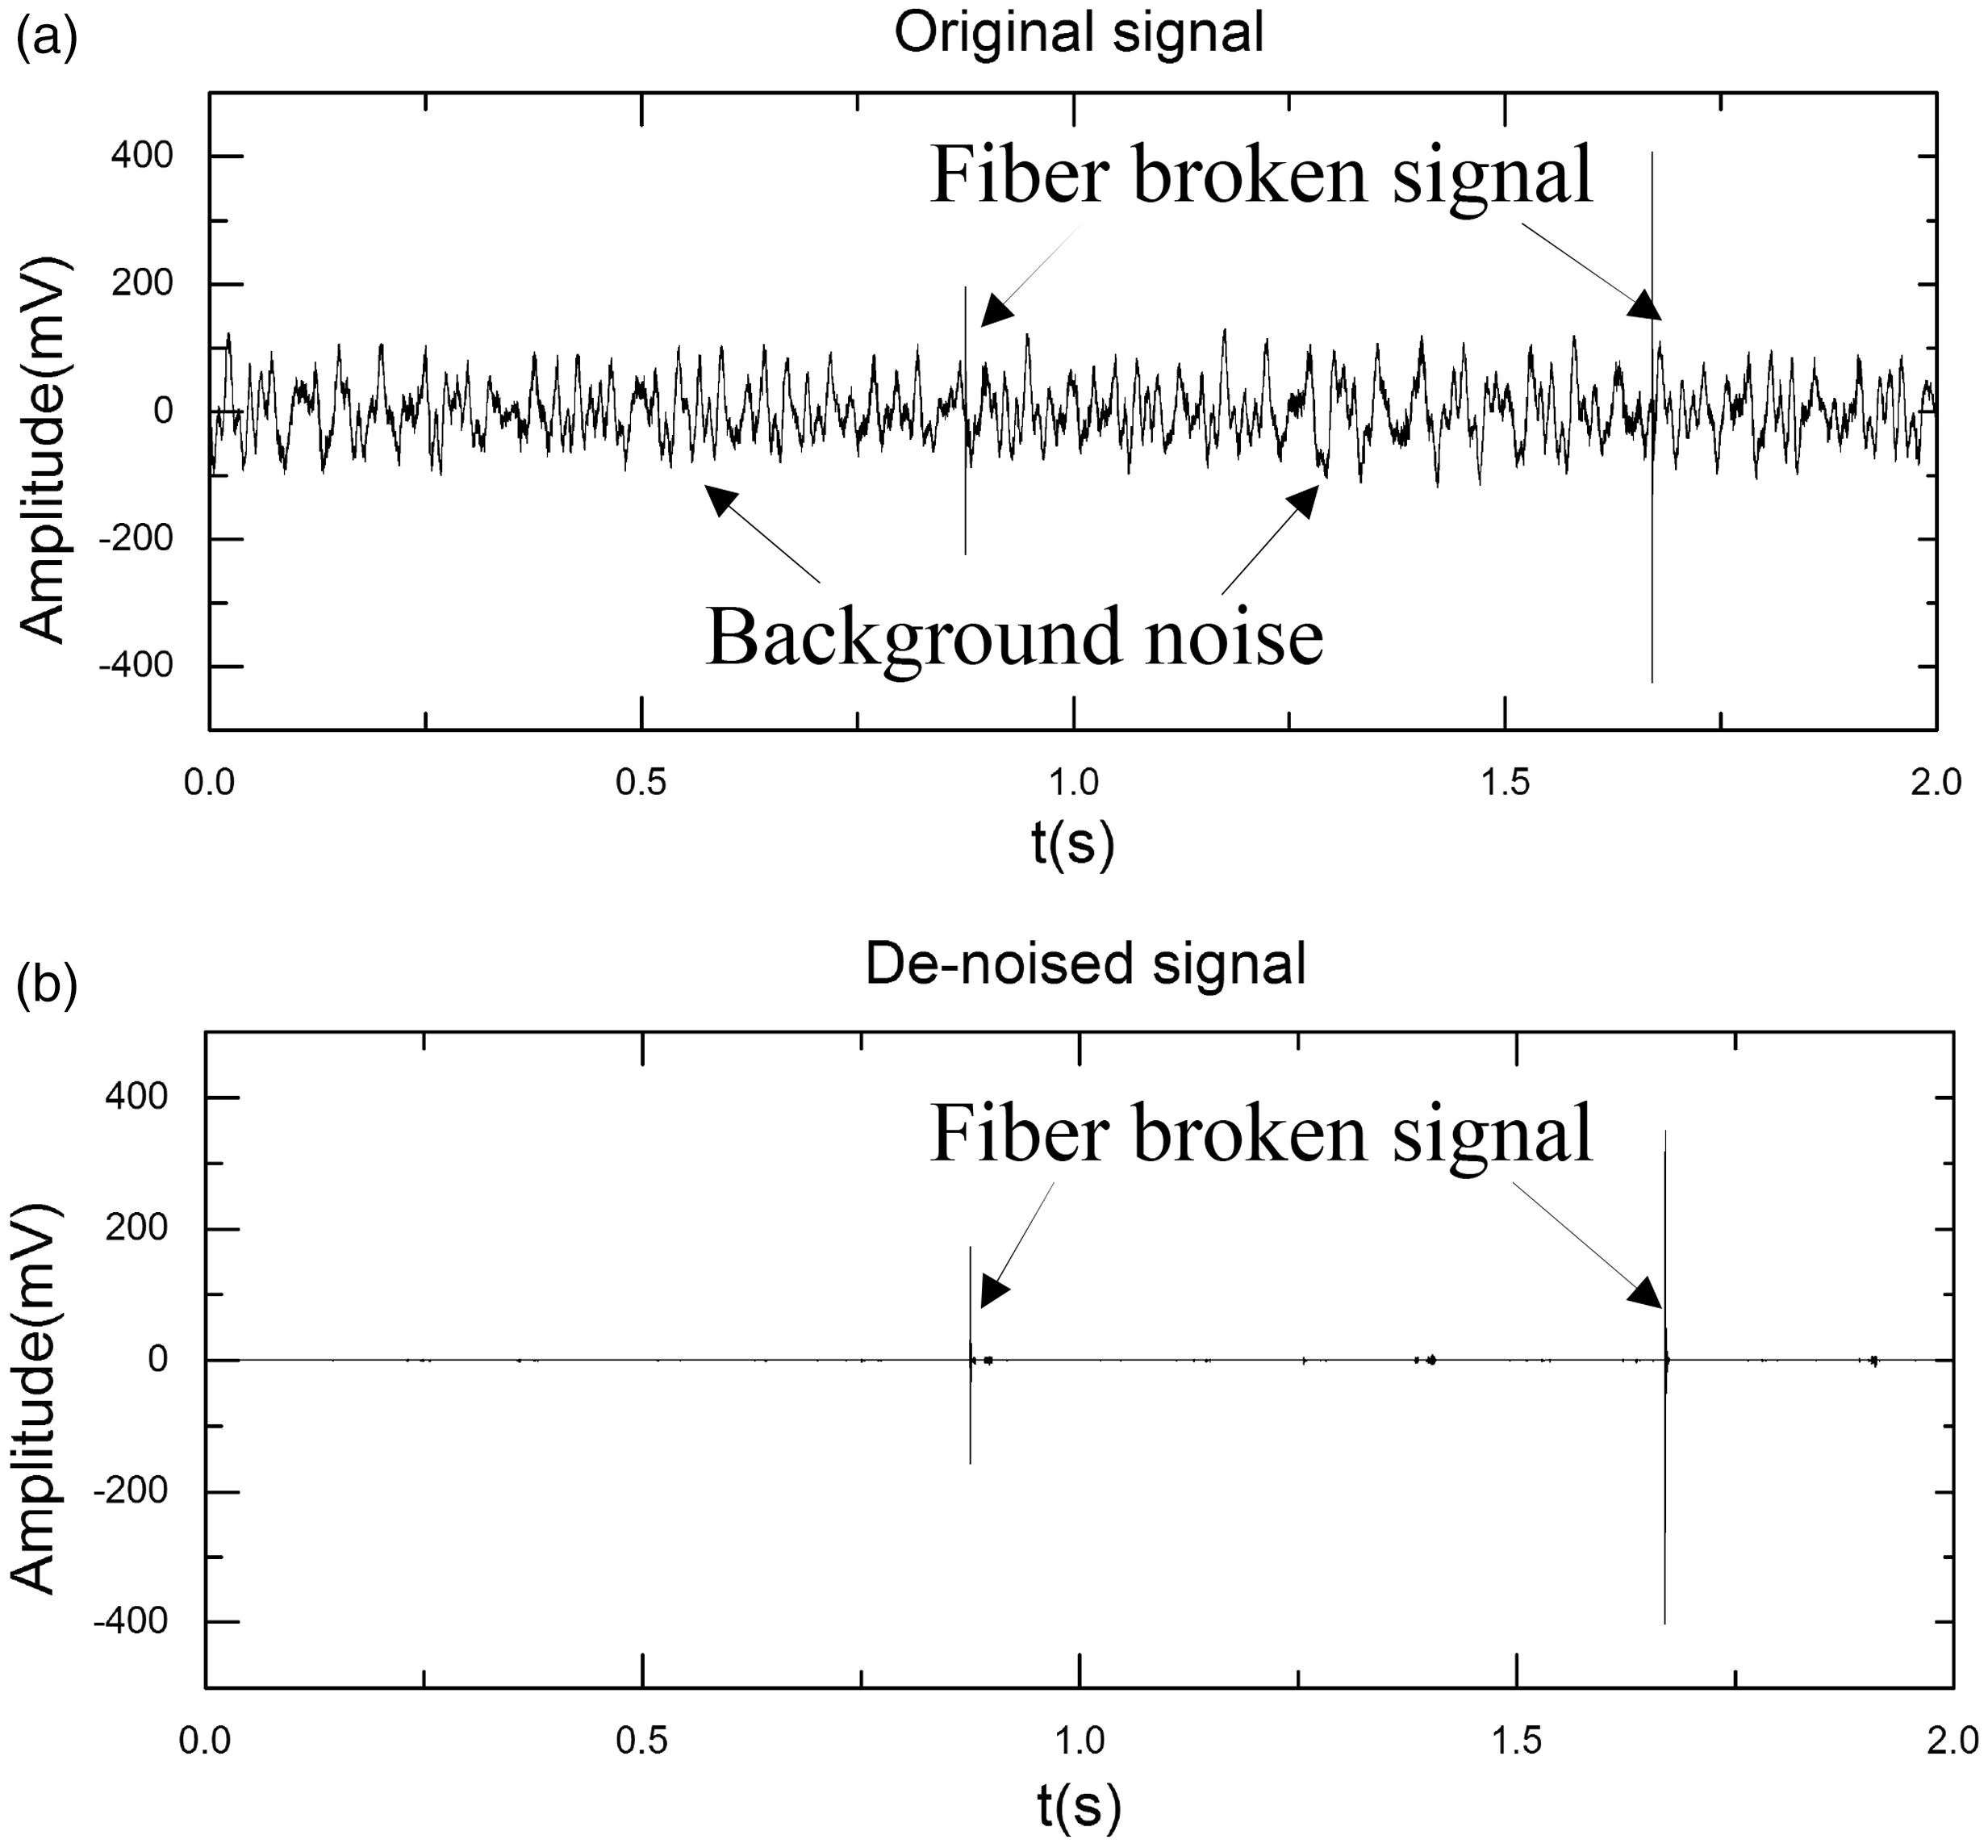
As shown in Figure 3, the background noises have amplitude similar to some weak fiber broken signals, which will cause problems in the subsequent AE signal processing and make the signal recognition more difficult. After the WT de-noise, the background noises contained in the AE signal are almost removed, which makes the fiber broken signal more obvious and easier to recognize.
Results and discussion
Fiber broken signal identification
AE detection is performed simultaneously when the fiber bundle is extended. The microphone will record the breaking signal when the fiber is breaking. Based on the bundle AE signal, every single fiber broken signal can be detected. Figure 4 shows the time-domain spectrum of the AE signal with the strength–elongation curve of the fiber bundle. The red line in the diagram represents the tensile curve and the blue line represents the AE signals.
The time-domain spectrum of the acoustic emission signal with the strength–elongation curve of the fiber bundle: (a) elastic zone; (b) yield zone; (c) breaking zone. (Color online only.).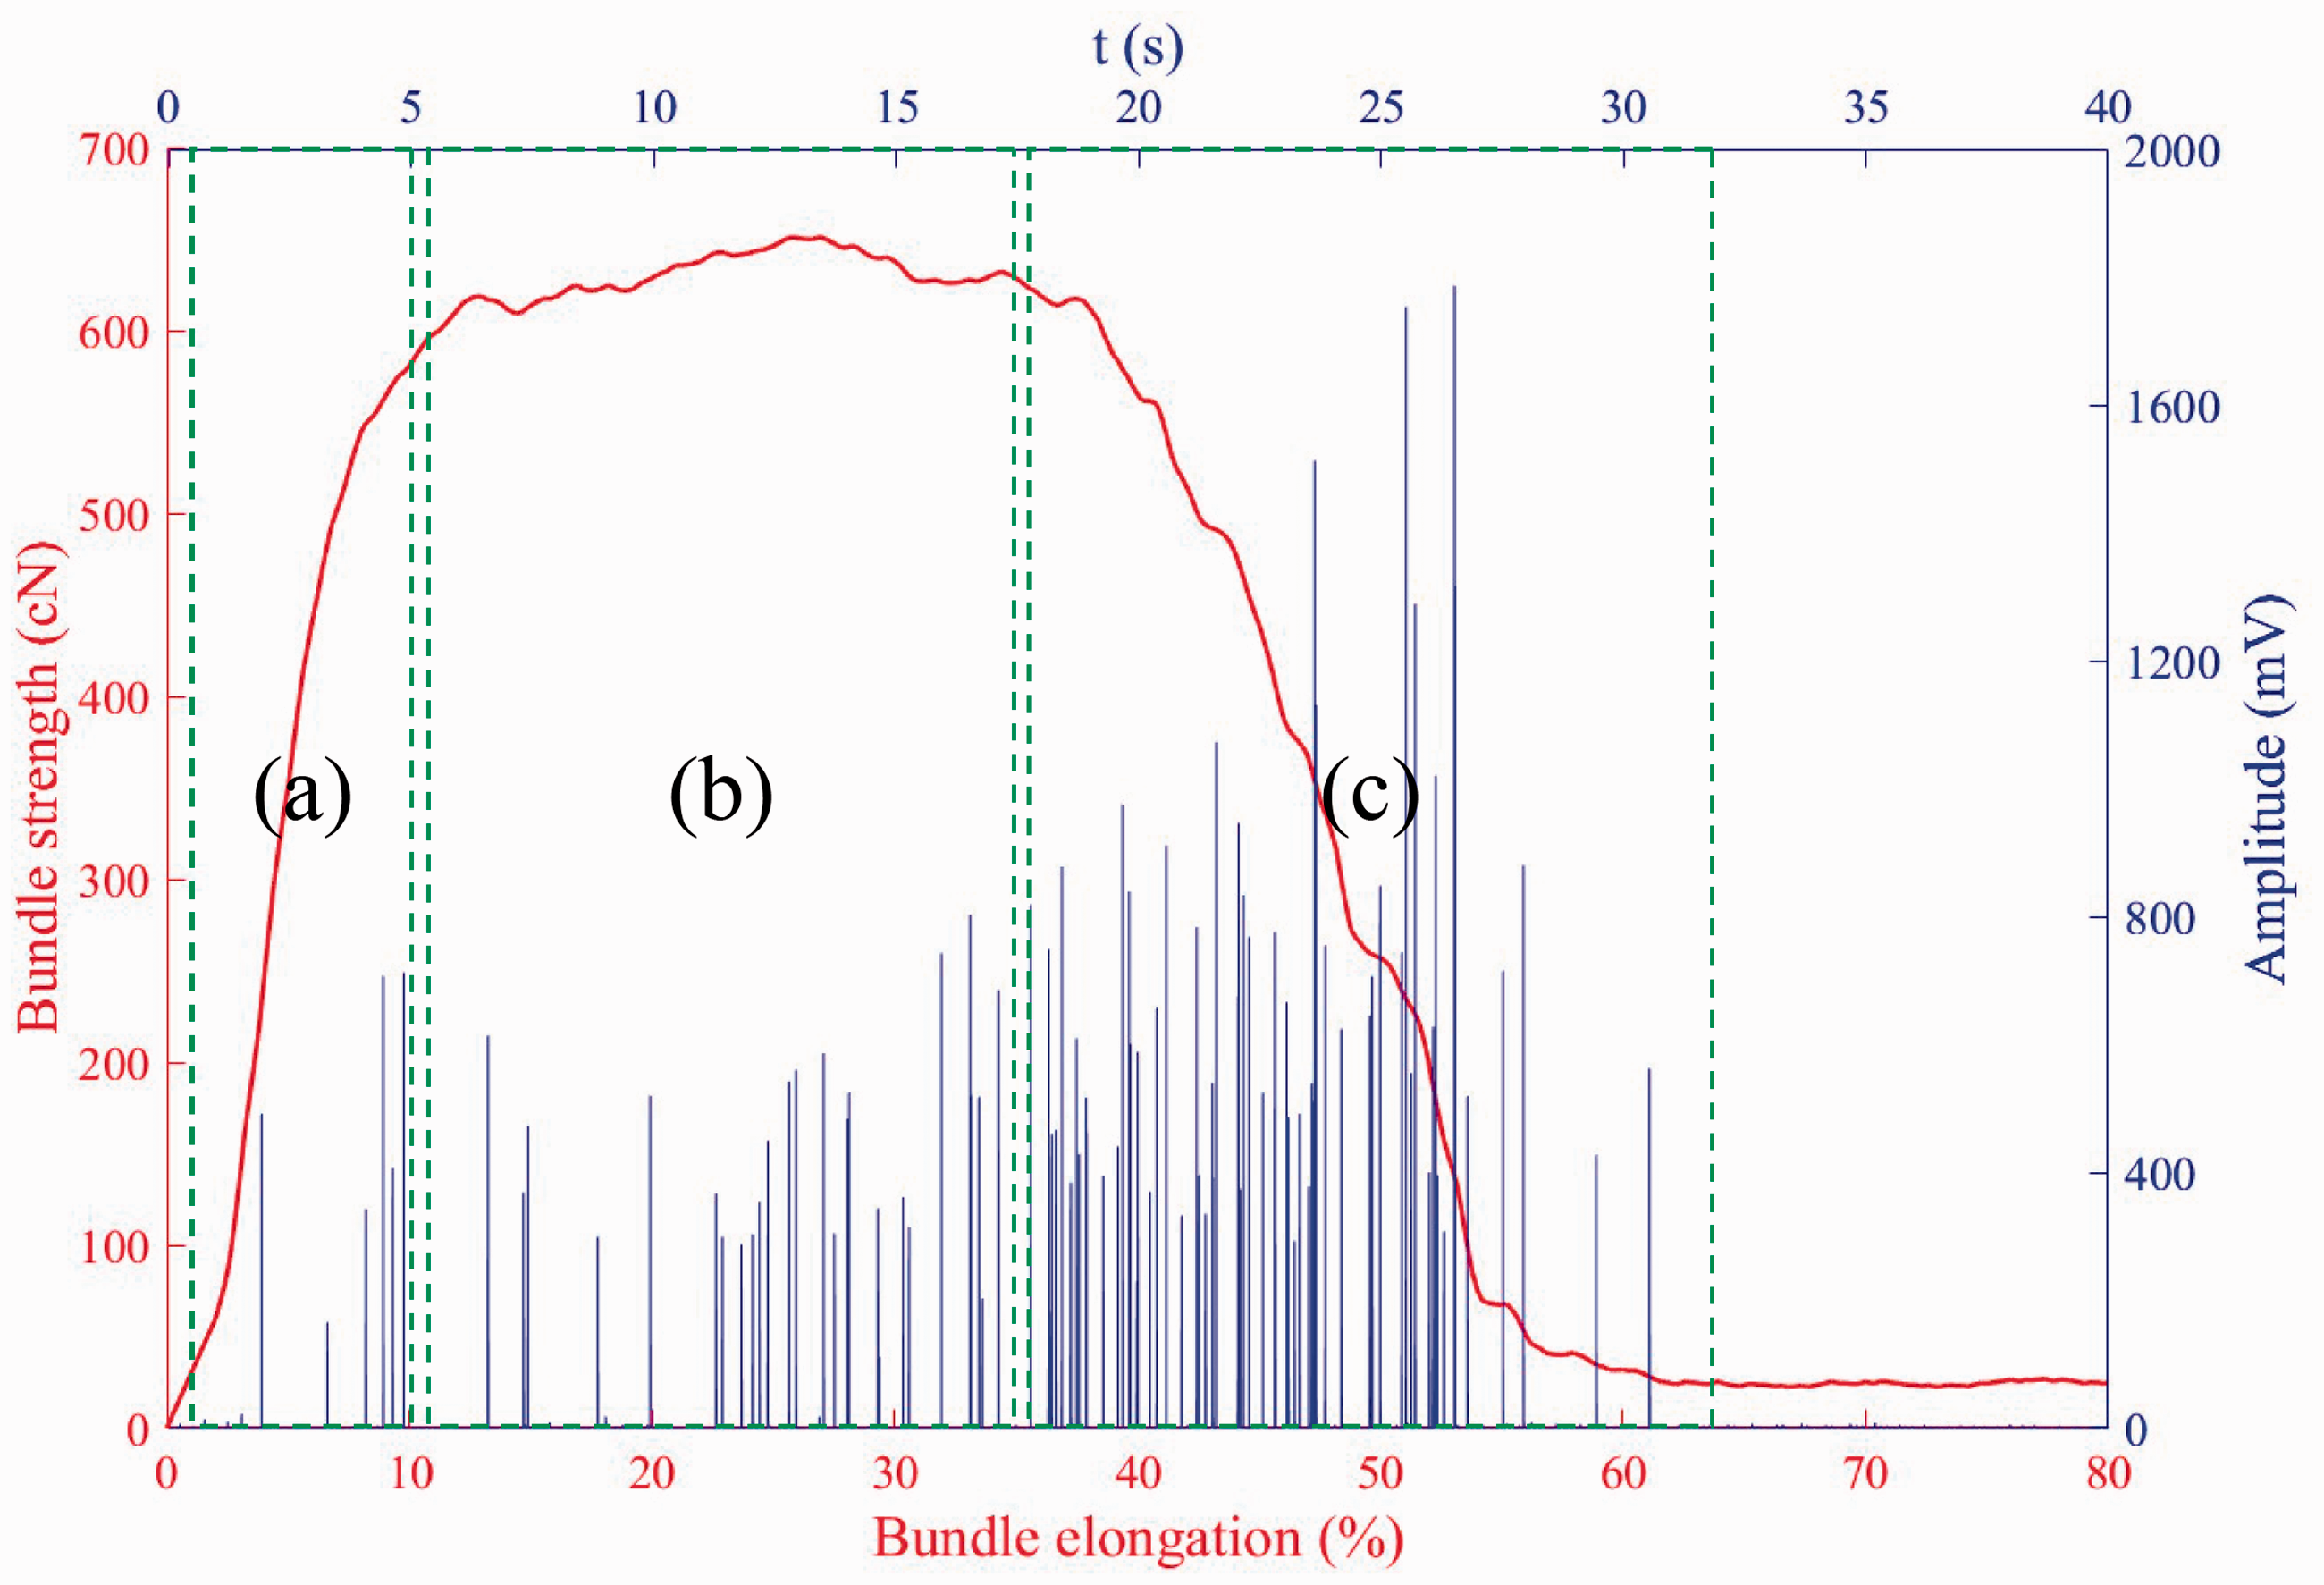
The tensile response curve of the fiber bundle follows Hooke's law in the elastic zone (a) and reaches a plateau during the yield zone (b). This region has low modulus and significant elongation, just like the yield zone in the tensile response of single wool. Finally, the fiber bundle begins to gradually break down in a wide elongation region zone (c). It can be found that the AE signals barely appear in the elastic zone (a), however, they becomes greater in the yield zone (b). The signals in these two zones all have a low time-domain amplitude. This is because the wool fibers that break before the yield point or during the yield zone are usually those with a ‘weak point.’ Therefore, they release less energy when they are broken, which causes their breaking AE signals to have low amplitude. When the wool fibers are extended over the yield zone (b), the fiber fracture becomes concentrated. Besides, the AE signals in the breaking zone (c) obviously have higher amplitude.
The broken fiber signal recognition accuracy rate in bundle acoustic emission detection

Distribution of breaking strength and elongation
Based on the high recognized accuracy rate, the precise breaking points along the elongation axis are obtained. That means the breaking elongation of every individual fiber can be calculated. According to Equation (5), the breaking strength of each fiber can be estimated. Therefore, the estimated breaking elongation and strength of single fibers from the bundle test based on AE detection are obtained. The relative frequency histogram and the cumulative frequency curve of the estimated elongation and strength are shown in Figure 5. Statistical analyses are performed on the estimated values. The median, the average, and the standard deviation values are given. The results are listed in Table 2.
The relative frequency histogram and the cumulative frequency curve of the estimated single fiber (a) elongation and (b) strength from the fiber bundle test. (Color online only.) The statistical analysis results of estimated single fiber elongation and strength from the fiber bundle test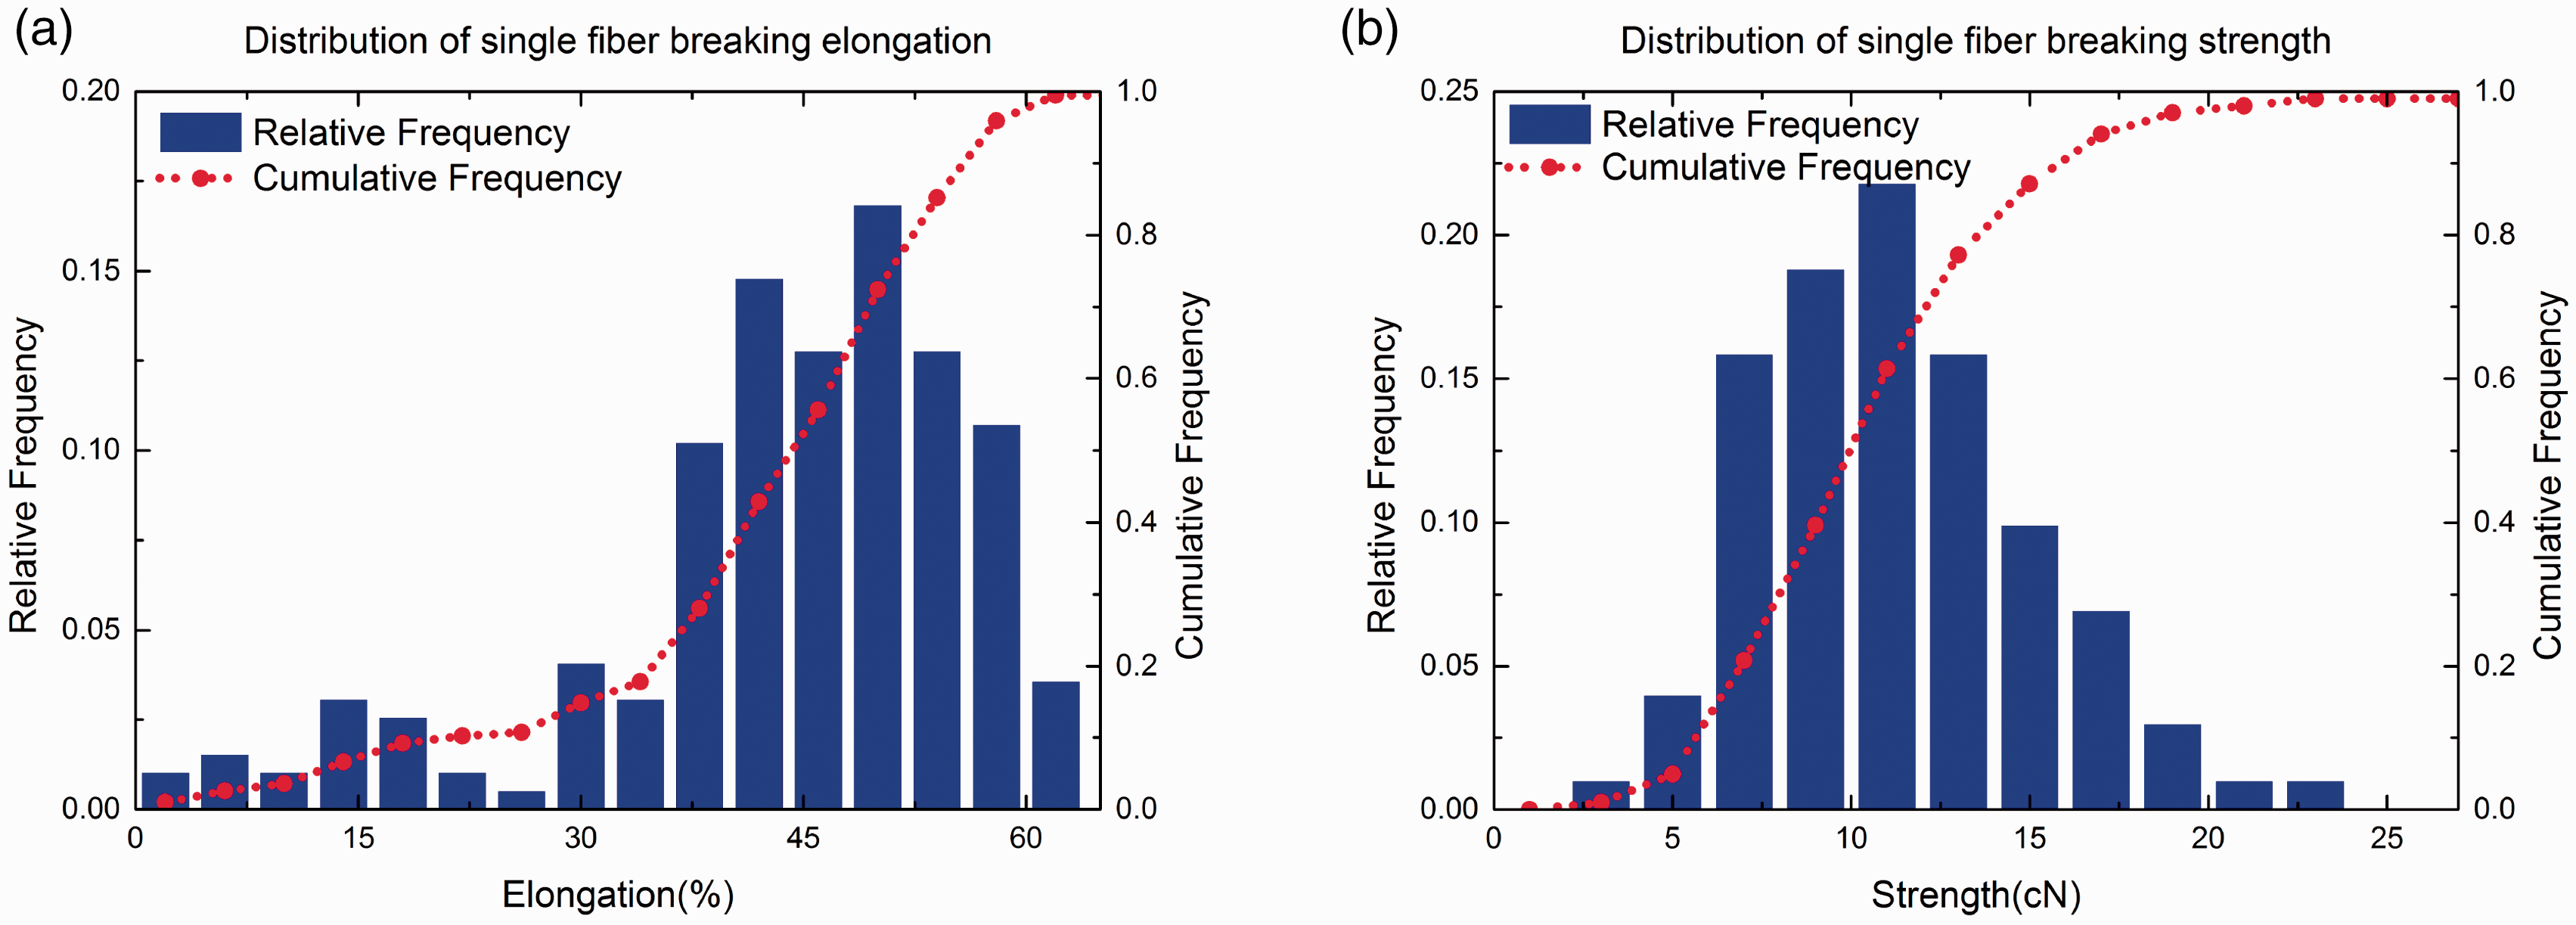
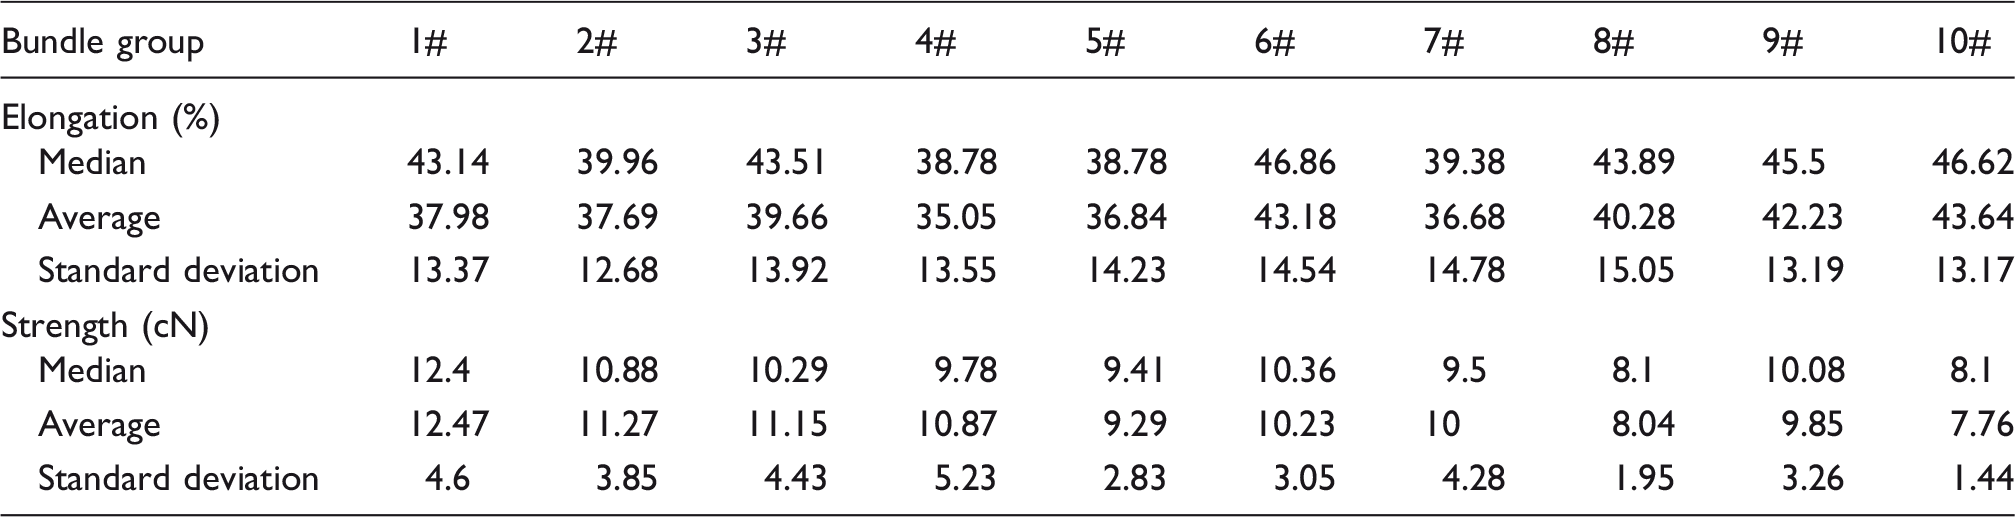
The red dotted line in Figure 5 represents the cumulative frequency of the estimated values and the blue square represents their relative frequency histogram. From Figure 5, it can be found that the elongation follows a left-biased distribution and the strength follows a right-biased distribution. This phenomenon has also been found in previous research. It proves that the single fiber breaking strength is independent of the breaking elongation. It also conforms to the non-linear characteristics of wool fiber. The breaking elongation has a range from 0% to 65% and the breaking strength has a range from 0 to 30 cN. The range of these estimated values is also consistent with the results obtained from the single fiber sample tests. The data listed in Table 2 further proves the shape of elongation and the strength histogram. The median of elongation in each bundle group is higher than the average of each bundle. The median strength is lower than the average. These respectively conform to the characteristics of left-biased and right-biased distribution. Although some errors occur, such as in the bundle groups 8# and 10#, this is caused by the over-concentrated data. It can be found that the standard deviations of groups 8# and 10 are 1.95 and 1.44, respectively. These values are lower than those of the other groups. This means that the estimated values of breaking strength in groups 8# and 10# are concentrated in a small range, which causes the values of their median and average to be very similar. However, it can be found that the estimated values of elongation and strength between different bundle groups are relatively stable.
The histogram and cumulative frequency curve are discrete and not suitable for comparison. As mentioned above, the breaking elongation and strength of single wool are proposed to follow the two-parameter Weibull distribution and Log-normal distribution, respectively. After the elongation and strength of every individual fiber within the bundle are obtained, their parameters of distribution can be estimated through Equations (4) and (7). The linear regression analysis is performed to fit the scatter plot. The parameters The linear regression analysis for estimating the parameters of the (a) Weibull and (b) Log-normal distributions. The estimated values of the Weibull and Log-normal distribution parameters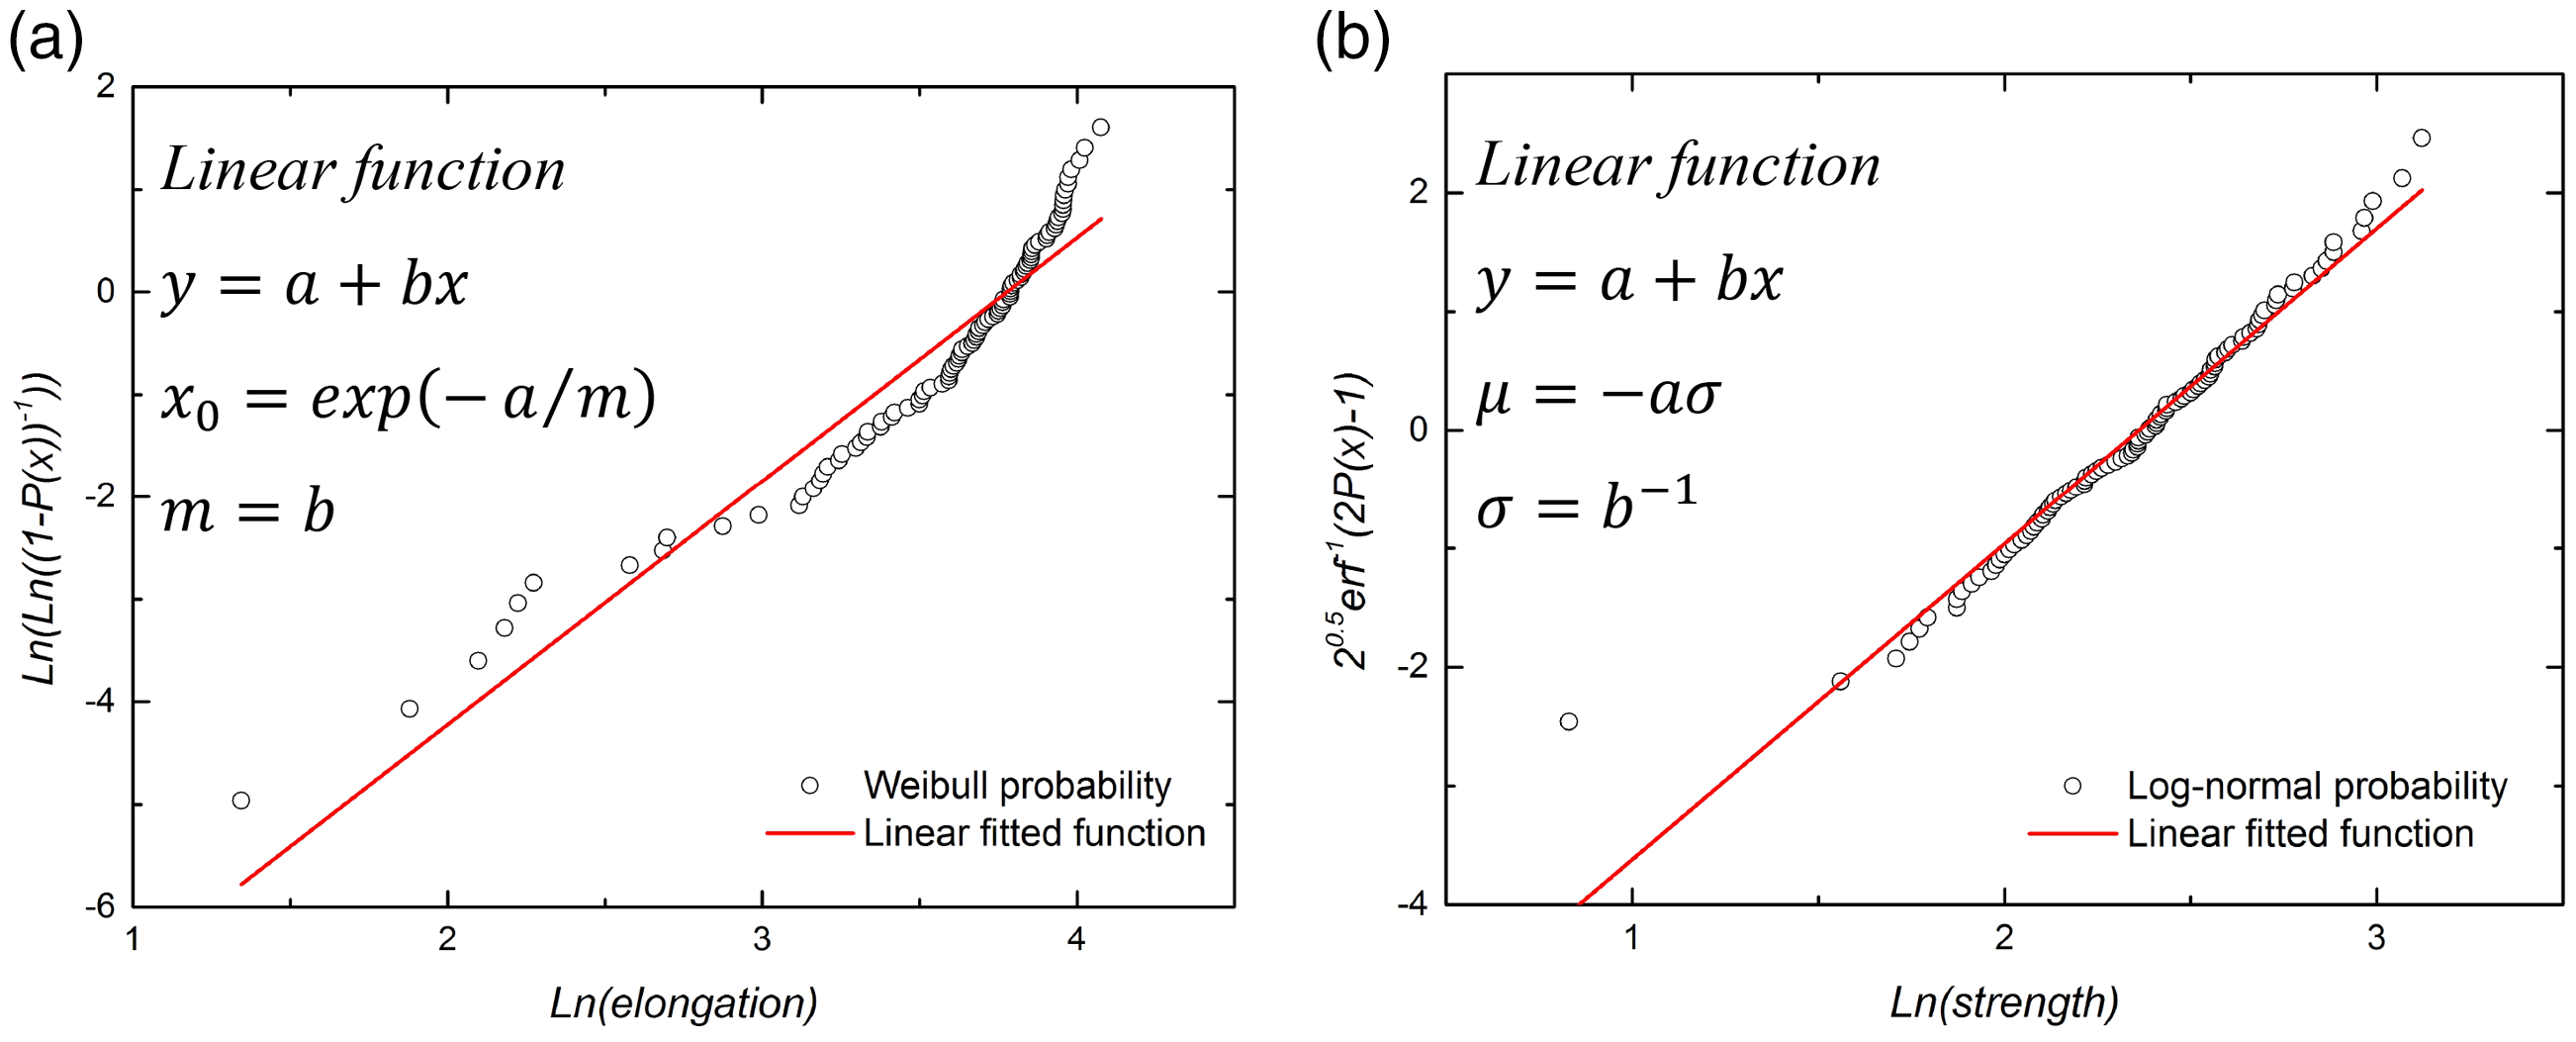
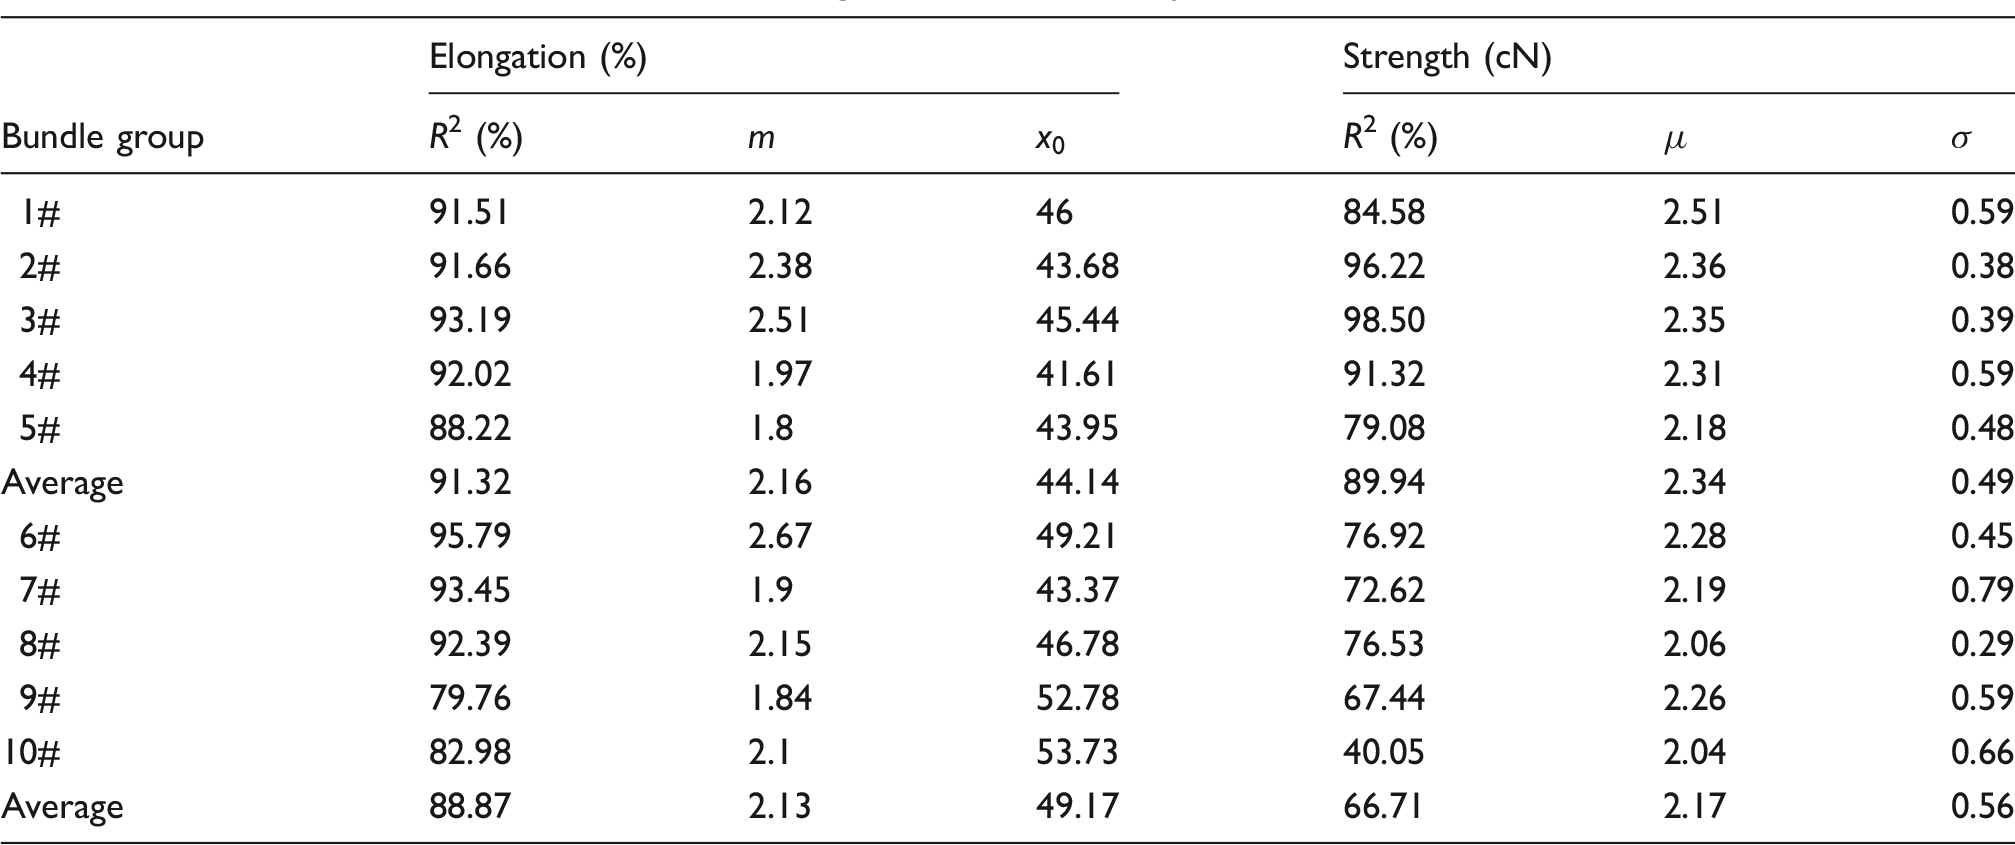
It can be found in Figure 6 that the parameters of different distribution functions can be estimated through the same linear regression analysis. The red line in Figure 6 is the linear fitted function and it is calculated from the hollow dots within it. The values of the shape and scale parameters of the Weibull and Log-normal distributions are estimated based on the values of the intercept and slope of the red fitted function. The coefficients of determination (R2) listed in Table 3 show that the hollow scatters are all well fitted. The values of R2 and the parameters of each bundle group are relatively stable. A higher coefficient of determination usually indicates a better fit. According to the results, it can be found that the average values of R2 on elongation and strength of the bundle groups with 100 fibers are both higher than those with 200 fibers. This indicates that the scatters of 100 fibers groups are better fitted than those of the 200 fibers groups. This may be due to the increased interaction between the individual fibers within the bundle. Although the single fiber is fixed in advance to minimize the interaction between fibers, the friction between fibers will inevitably increase as the number of fibers within the bundle increases. The breaking fiber may interact with neighboring fibers and cause premature failure. Therefore, there may be some points in the scatter plot of the 200-fiber bundle that can not fit well, resulting in a low coefficient of determination.
Comparison with the single fiber test results
The comparison between the strength and elongation distribution is estimated based on two kinds of fiber bundle samples and single fiber samples

The estimated values of strength distribution parameters based on fiber bundle sample tests are similar to the parameters obtained from single fiber sample tests. However, there is a difference between the parameters of elongation distribution obtained from fiber bundle samples and single fiber samples. The values of the scale parameter of Weibull distribution estimated from bundle samples are 44.14 and 49.17, respectively. They are higher than the value of 41.42 obtained from single fiber samples. That means the average values of estimated elongation are higher than that of the single fiber. The values of the shape parameter of Weibull distribution estimated from bundle samples are 2.16 and 2.13, respectively. They are lower than the value of 5.46 obtained from single fiber samples. This means that the elongation estimated based on the bundle samples is more dispersed than the single fiber distribution. The Kolmogorov–Smirnov (K-S) criterion is applied to describe whether the estimated strength and elongation distribution are similar to the results of single fiber samples. The statistics of the K-S criterion between the cumulative distribution of breaking strength obtained from fiber bundle samples and single fibers samples are 0.047 and 0.19, respectively. The statistics of breaking elongation are 0.21 and 0.29. The critical statistic for K-S criterion, at a degree of freedom The difference between the single fiber (a) elongation and (b) strength cumulative failure probability distribution obtained based on different samples. (Color online only.)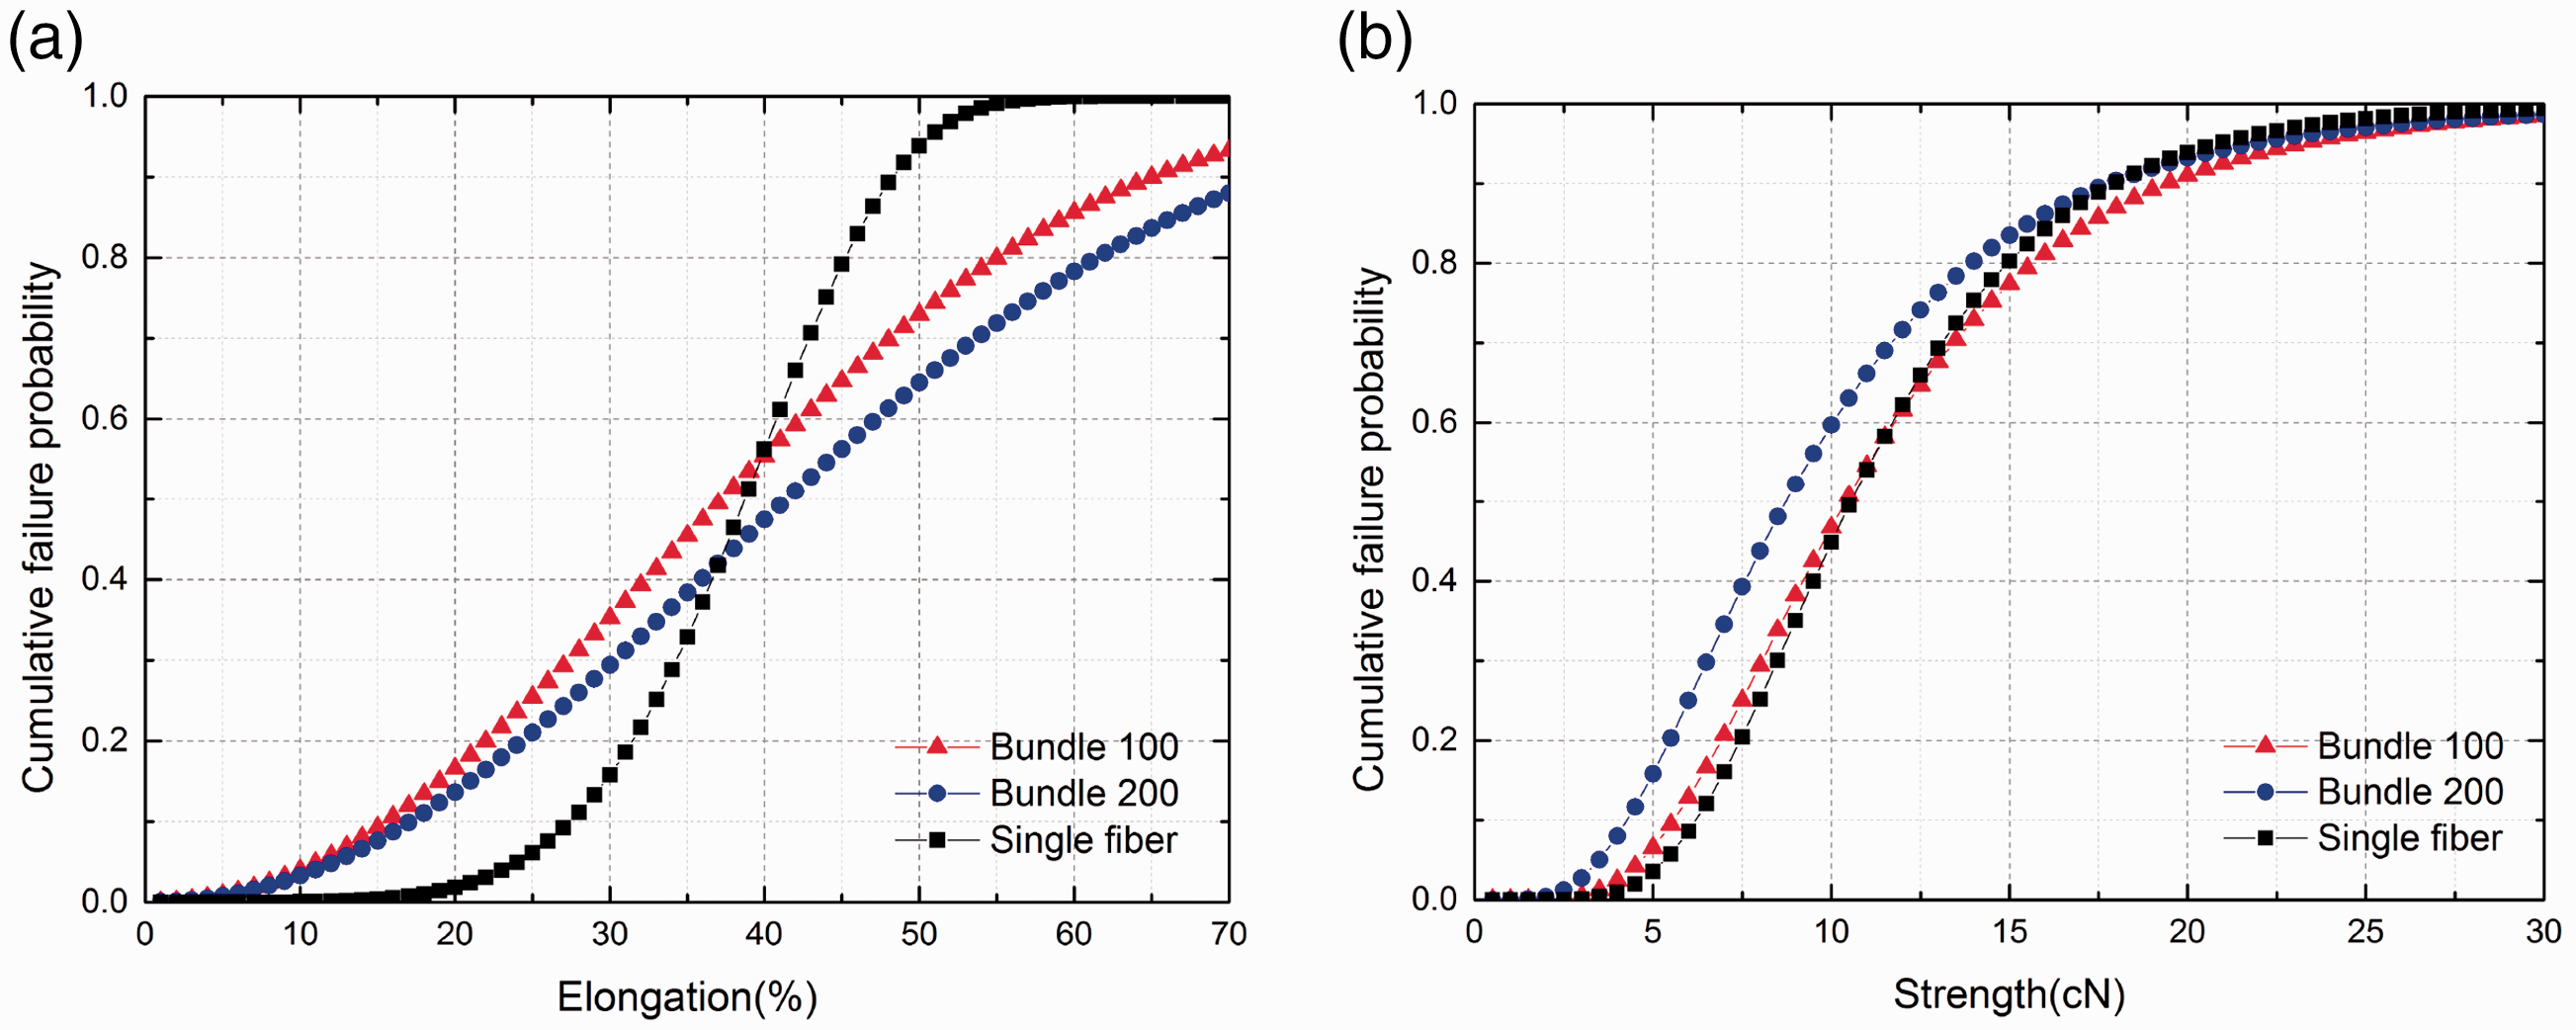
The different color dotted lines in Figure 7 conform to the above analysis. It can be found that the strength cumulative failure probability estimated from bundle samples is similar to that from single fiber samples. The cumulative distribution estimated from the fiber bundle sample with 200 fibers has a lower average value compared with that of the single fiber sample. This is consistent with the above test results. The cumulative failure probability of elongation estimated from the fiber bundle samples is flatter. Compared with the cumulative distribution of single fiber samples, the elongation distribution of fiber bundles is wider. In the fiber bundle samples, part of the single wool has a lower breaking elongation than the single fiber samples. Moreover, a higher breaking elongation than the single fiber samples will appear. The reason for this difference might be that the researchers removed the ‘abnormal values’ during the single fiber tests. The fiber bundle samples are composed of 100 or 200 single wool fibers. There might have been abnormal fibers in the fiber bundles, which could have produced abnormal values. These abnormal values may lead to the difference between the distributions. However, the fibers that break abnormally during the extension process may not be recorded in the single fiber test. Therefore, the estimated parameters from the single fiber test tend to have a more concentrated distribution. The fibers within the bundle did not go through this kind of unintentional process, which leads the estimated values of the single fiber in the bundle to appear more frequently in the lower or higher region.
Conclusions
In the present work, the AE detection is performed simultaneously during the fiber bundle test, thereby providing additional information about the fiber bundle breaking process. Based on the AE signal, the number of single fibers within the bundle and the breaking elongation distribution of single fibers can be obtained. The breaking strength of single fibers within the bundle is estimated from the tensile response of the fiber bundle through the method developed in this paper.
The results show that the AE technique can detect the individual fiber fracture signal during the fiber bundle test. The accuracy rate of the detected signal is higher than 98%. The relative frequency histogram and the cumulative frequency curve of the estimated single fiber elongation from the fiber bundle test show that they follow a left-skewed distribution, while the single fiber strength follows a right-skewed distribution. These are consistent with the results of single fiber tests. The statistical analysis results show that the estimated values between the different bundle groups are relatively stable. The linear regression analysis is utilized to estimate the parameters of the Weibull and Log-normal distributions. The results show that, except for the breaking strength of the bundle samples with 200 fibers, the coefficients of determination of linear fitting are all greater than 85%. Based on the estimated parameter by regression analysis, the cumulative probability distributions of the strength and elongation of the single fiber can be obtained. The cumulative distribution is compared with the distribution obtained from the single fiber samples. It shows that the cumulative distribution of the strength has high consistency, but the distribution of the elongation has a difference. The estimated elongation from the bundle test will follow a flatter distribution than that from the single fiber test. This difference is mainly caused by the interaction between the fibers. Although the wool was fixed on the paper in advance, when the number of fibers in the bundle increases, the interaction between the fibers will inevitably increase. The interaction between the fibers will cause the bundle to fail in a wider strain region, which makes the elongation distribution of wool become more widely spread.
The method for estimating the distribution of single wool breaking strength and elongation based on AE signals generated by fiber fracture during the fiber bundle test has been developed. AE technology is often used to detect and recognize the failure mechanism of composite materials. However, it is utilized to identify the broken fiber signal during the fiber bundle test in this work. This method overcomes the time-consuming problem of the single fiber test and demonstrates the combined application of the AE technique and the fiber bundle theory. It allows the extraction of the single fiber survival function from a fiber bundle test and the prediction of breaking strength distribution data of the single fiber from the fiber bundle test. Further work is needed to test larger fiber bundles and to predict the tensile behavior of the fiber bundles through the distribution of single fibers.
Footnotes
Declaration of conflicting interests
The authors declared no potential conflicts of interest with respect to the research, authorship and/or publication of this article.
Funding
The authors disclosed receipt of the following financial support for the research, authorship, and/or publication of this article: This work was supported by the National Key R&D Program of China (2016YFC0802802).
