



Abstract
In this study, a multivariate statistical process control was used to analyze the abnormal samples derived from the deviation of optimum processing parameters. The experimental samples derived from the optimum processing parameters were applied as the optimal historical data to determine the control limit, and then the T2 value was obtained from Hotelling's T2 method. If the T2 value exceeds the control limit, the corresponding sample is considered as abnormal. After that, the Runger, Alt and Montgomery method is used to decompose the abnormal T2 value. Then, each quality characteristic value can be obtained and the corresponding decision tree classifier can be implemented. To improve the classification accuracy, we classify the decision tree classifier into single–double identification, single-factor abnormality and double-factor abnormality. For the individual classification test, the result showed that the accuracy of single–double identification was 98.6%, the single-factor abnormality classification was 100% and the double-factor abnormality classification was 96.0%. For the combination classification test, we can get a 98.6% accuracy rate for the single–double identification, 98.3% accuracy rate for the single-factor abnormality classification and 95.3% accuracy rate for the double-factor abnormality classification. Therefore, it can be confirmed that the proposed methods in this study can effectively identify abnormal samples and establish a fault processing parameter diagnosis system for melt spinning machines.
Keywords
In this study, multivariate control charts and the decision tree classifier are integrated to determine the faults of the quality characteristic(s) of a melt spinning machine used in polypropylene as-spun fiber manufacturing. In general, monitoring production using statistical techniques is carried out using control charts. The contributions to this field have been made through graphics of the Shewhart control chart for univariate processes. 1 However, this control chart is only applicable to univariate qualities independent of each other. There may be misrecognition if it is used for multivariable quality characteristics, so the multivariable control method is derived.
In this study, the Hotelling's T2 of multivariate statistical process control (MVSPC) will be employed to analyze the abnormal samples derived from the deviation of optimum processing parameters, as obtained in Part I. MVSPC is the application of multivariate statistical techniques to improve the quality and productivity of an industrial process. 1 One of the most popular MVSPC procedures is based on Hotelling's T2 statistic. Using the T2 statistic with MVSPC not only allows for the monitoring of individual variables but also provides an excellent technique for determining when the relationships between variables are fouled. 2
Boullosa et al. 3 used control charts to make process monitoring of the cylinder lubrication for a marine diesel engine. If a univariate control chart is used, there would be excessive errors. On the other hand, the Hotelling's T2 control chart can detect the process of deviating from the optimum conditions effectively.
Kullaa 4 studied the damage detection of the Z24 bridge using different univariate and multivariate (Hotelling’s T2) control charts. Univariate control charts are sensitive to small shifts and may cause frequent false alarms in an automated monitoring system. Multivariate controls for individual variables is a good choice if false alarms should be avoided, because they are insensitive to small shifts. Wang and Ong 5 presented a structural health monitoring. By comparison with the Shewhart control chart, the Hotelling's T2 control chart has the better capacity of simultaneously monitoring the multivariate characteristics data without having to neglect the inherent relation between the components of the data. Senouci et al. 6 aimed to extend the use of these charts from two to three variables, in order to improve the statistical control of an industrial roll-type electrostatic separator designed for the recycling industry. In the case of electrostatic separation processes, the use of Hotelling's T2 chart for three variables would allow controlling on a single graph the correlation between the masses accumulated in the three boxes of the product collector.
A significant practical disadvantage of MVSPC is that it is difficult to determine which of the monitored variables is responsible for the out-of-control signal. 7 The statistic of T2 was used to reflect the contribution of every quality characteristic so that the uncontrolled quality of the monitored variables could be detected. 7 This study will employ the Hotelling's T2 control chart to judge normality and abnormality of the processing factors of a melt spinning machine used in polypropylene as-spun fiber manufacturing.
The decision tree classifier is one of the most effective forms to represent and evaluate the performance of algorithms, due to its various eye-catching features: simplicity, comprehensibility, no parameters and being able to handle mixed-type data. 8 Sugumaran and Ramachandran 9 applied the decision tree in fault diagnosis of roller bearings. The decision tree is used to select three good features out of 11 that can have a say in discriminating fault conditions. Amarnath et al. 10 used acoustic signals (sound) acquired from the near-field area of bearings in good and simulated faulty conditions for the purpose of fault diagnosis. The descriptive statistical features were extracted from sound signals and the important ones were selected using the decision tree. The selected features were then used for classification using the decision tree algorithm. Jegadeeshwaran and Sugumaran 11 applied fault diagnosis to improve the reliability of hydraulic brakes. The vibration signals for both good and faulty conditions of brakes were acquired from a hydraulic brake test setup. Descriptive statistical features were extracted from the acquired vibration signals and the feature selection was carried out using the decision tree algorithm. Ye et al. 12 proposed an adaptive diagnosis method based on incremental decision trees for board-level functional fault diagnosis. Faulty components are classified according to the discriminative ability of the syndromes in decision tree training. Singh and Gupta 8 explained three most commonly used decision tree algorithms to understand their use and scalability on different types of attributes and features. Among them, CARTs (classification and regression trees) can easily handle both numerical and categorical variables, identify the most significant variables and eliminate non-significant ones, can easily handle outliers and have good predictive and describing abilities.13–15 Zimmermanet al. 16 applied CART analysis to predict influenza in primary care patients. Influenza clinical decision algorithms are both rapid and inexpensive, but most are based on regression analyses that do not account for higher order interactions. The CART modeling was good to estimate probabilities of influenza.
Since the CART learning algorithm has been successfully used in expert systems in capturing knowledge, this study used the CART as classifier to find abnormal processing parameters.
Methodology
In this study, the abnormal T2 value is determined by using Hotelling's T2 control chart of MVSPC from the abnormal samples, which are obtained from the deviation of optimum processing parameters, combined with the Runger, Alt and Montgomery (RAM) feature extraction method. The CART is used as a classifier to obtain abnormal processing parameters that could affect the product quality and solve the problems. This study thus provides a diagnostic method for abnormal quality characteristics of the melt spinning machine.
Hotelling’s T2 control chart
The Hotelling’s T2 rule is probably the most popular multivariate control chart for monitoring the mean of a distribution.
2
This control chart proposed by Hotelling cannot predict the variance and average of a parent in practical application, as m samples are extracted from a stable process to calculate the covariance matrix. To monitor p quality characteristics in the multivariable process, No. i sample point of No. j quality characteristic is expressed as an
The average value of X is represented by

The average value of X and the covariance matrix S are used to establish historical data. If there is a new sample point



The control limit (UCL) is defined as

For the calculation of the UCL, we used the F distribution with α = 0.05, for type II errors.1,2 If the value of
Although the Hotelling’s T2 control chart is able to find the status of a multivariate process, the process personnel are unlikely to know which quality characteristics are faults. The RAM method may be used to find the characteristic that is out of control.
Performance evaluation criteria
For evaluation of the satisfaction status in the process control, this study uses the detection success rate, detection rate and false alarm rate to evaluate the effect of the methodology.17,18 The definition of the normal sample (Positive), abnormal sample (Negative), normal result of Hotelling's T2 method (True) and abnormal result of Hotelling's T2 method (False) are compiled in Table 1.
Definitions of true positive, false positive, true negative and false negative

Detection success rate
The ratio of the number of correct samples to the total number of samples in the given data (this value is larger the better) is as follows

Detection rate
The ratio of the number of normal samples that are correctly identified as normal samples to the total number of normal samples (this value is larger the better) is as follows

False alarm rate
The ratio of the number of abnormal samples that are misidentified as normal samples to the total number of abnormal samples (this value is smaller the better) is as follows

Runger, Alt and Montgomery method
In order to solve the problem in the multivariable control chart that only finds out comprehensive statistics and to determine the quality characteristics that make the process out of control, Runger et al. proposed the RAM method. 7
The quality characteristics that are abnormal can be known. These quality characteristics are given a statistic, and this statistic is constructed by Hotelling's T2 method, expressed as


Every
If the value of
The RAM method used in this study is extended from Hotelling's T2 control chart, which is used as the input feature of the classifier.
Decision tree learning
The decision tree is a predictive model, representing the coincidence relation between object properties and object values. Each node in the tree represents an object, and each branch represents a possible attribute value. The object value represented by the path from the root node to a leaf node corresponds to the leaf node. When one piece of data enters the decision tree from the node of a root, a test is performed at the root to determine which child node of the lower layer the data should move to. This process is repeated continuously until the data reaches the leaf node. The path from the root to each lobe represents the data classification rule. The prediction tree, depending on classification and training, can predict and classify the temporarily unknown objects according to what is known. As it has powerful function and is based on a tree diagram, it is easy for users, so it is a popular classification and prediction tool. 8
The CART19–21 is a binary recursive partitioning procedure capable of processing continuous and nominal attributes as targets and predictors. The data are split at each node by one single input variable function, and a dichotomous decision tree is established. This data are divided into two subsets by each segmentation continuously to build the decision tree, until the segmentation cannot continue. The scale of the decision tree can be simplified by using the binary segmentation method to increase the efficiency.
The node splitting of the CART algorithm is established on the Gini index. The Gini index is expressed as follows: the smaller the value is, the higher is the probability of samples belonging to the same class. It is a number between 0 and 1, where 0 represents completely homogeneous and 1 represents completely inhomogeneous

The steps of the CART algorithm are as follows:
the samples are divided into two groups, where one group is training data and the other group is testing data; the decision tree is built on training data using the aforesaid equation; the decision tree is pruned; steps (2) and (3) are repeated continuously and the test data are imported.
The CART is nonparametric. Therefore this method does not require the specification of any functional form. It does not require variables to be selected in advance. It can easily handle outliers, has no assumptions and is computationally fast. In addition, it is flexible and has an ability to adjust in time. The results are invariant to monotone transformations of its independent variables. 22
This study used the CART to build an automatic abnormality diagnosis system for the polypropylene as-spun fiber produced by melt spinning. The experiments were designed using the L18 orthogonal array of the Taguchi method. The single quality optimum parameters were obtained by an analysis of variance and the factor response table. The reproducibility of the experiment was validated by a confirmation experiment, and the multi-quality optimum parameters were obtained by the principal component analysis method.
The multi-quality optimum parameters were used as optimality criteria to make historical sample data. After the UCL was obtained, through the abnormal sample data of one to two processing parameter variation conditions, the Hotelling's T2 control chart was combined with UCL to divide the historical sample data and abnormal sample data into normal and abnormal data. Afterwards, the chi-square statistic of the variable,

Flowchart of the fault diagnosis system.
Abnormality diagnosis system setup
Historical sample data and abnormal sample collection
The multi-quality optimum parameters obtained are used as experimental parameters, as shown in Table 2. The corresponding 27 product qualities are used as the historical sample data, shown in Table 3. One to two processing parameters are collected for the experiment to get abnormal samples. In the case of single-factor abnormal experimental parameters, as shown in Table 4, one processing parameter is changed at a time, the change starts from factor A for abnormal 1 and to abnormal 2, then from Factor B to Factor F, and so on. In the case of two-factor abnormal experimental parameters, as shown in Table 5, two processing parameters are changed at a time, the change starts from Factors A and B, for abnormal 1 and to abnormal 2, then from Factors A and C to Factors E and F, and so on.
The normal processing parameters

Historical sample data

One single-factor abnormal experimental parameters

Two-factor abnormal experimental parameters

This study makes 10 samples of one single-factor abnormal experimental parameters and 10 samples of a two-factor abnormal experimental parameters; there are 120 single-factor abnormal samples and 300 two-factor abnormal samples.
Hotelling's T2 control chart to distinguish normal and abnormal cases
After the normal and abnormal samples are obtained, the T2 and UCL values of each sample can be calculated by Equations (3) and (5), where the F value is 2.79, when α is 0.05, m is 27 and p is 4, and the normal and abnormal cases are judged according to the UCL and T2 values. The UCL algorithm is expressed as follows

The T2 in this research uses MATLAB R2017 for data analysis. Firstly, we randomly select four parameters from a normal sample to obtain the X matrix and the average value of 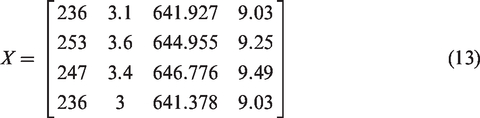

Then, we use Equation (1) to obtain the sample covariance matrix S matrix

The new experimental data
If the calculated T2 value is larger than 13.08, this sample is identified as abnormal, and otherwise as normal. In order to verify the reliability of Hotelling's T2 method, the abnormal sample detection is provided with 20 normal samples. Figures 2–5 are derived from the T2 value. It is observed that 20 samples are normal (enclosed circle), while 420 samples are abnormal.

T2 values of samples No. 1–110.

T2 values of samples No. 111–220.

T2 values of samples No. 221–330.

T2 values of samples No. 331–440.
Take a sample when the two-factor processing parameter, control factors B and F, are abnormal as an example. Fineness is 265 d, breaking strength is 3.1 N/mm2, breaking elongation is 665.57%, the modulus of resilience is 9.16 N/mm2, then


The T2 value is 35.699, which is larger than 13.08, so this sample is abnormal.
The results of Hotelling's T2 method are calculated by Equations (6)–(8) to obtain Table 6. The Hotelling's T2 method has favorable results of judgment of normality and abnormality.
Results of Hotelling’s T2 method

Decision tree classification
After the T2 values of all the abnormal samples are obtained, the RAM is combined with Hotelling's T2 method to find the abnormal quality.
RAM feature extraction
The obtained T2 value is used as the basis of the RAM method, where these quality characteristics are given a statistic 
When the
Taking a sample of two-factor gear pump temperature and take-up speed processing parameter abnormality as an example, the quality data are as shown in Table 7. To know whether there is a problem in the fineness, the fineness is deducted and the
Two-factor abnormal quality data

Decision tree classification
After the di values are obtained, which quality is normal or not can be known; in order to know which processing parameters induce abnormality, a classifier is required. If the single factor and two factors are classified for all the data directly, there is misrecognition as some di values are too similar, so that the fault process parameters cannot be identified correctly. In order to increase the accuracy of the classifier, all the abnormal samples shall be divided into single factor or two factor before subdivision.
Four feature values are obtained by the RAM method in this study, and Factor A is taken as an example. Figures 6–9 show the feature value distribution derived from the actual classification of the four feature values.

The di distribution of fiber fineness and breaking strength.

The di distribution of fiber fineness and breaking elongation.

The di distribution of fiber fineness and breaking strength.

The di distribution of breaking elongation and modulus of resilience.
As shown in Figures 6 and 7, to merely classify single-factor abnormality, most single factors can be classified according to two feature values, such as fineness d1 and breaking strength d2, combined with breaking elongation d3 to finish classification. To classify two-factor abnormality, as shown in Figure 8, the classification is performed only by the d1 of fiber fineness and d2 of breaking strength. The AC abnormality and AD abnormality are mixed, which should be classified with other features. As shown in Figure 9, the d3 of breaking elongation and d4 of modulus of resilience can classify AC and AD conditions, proving that the four feature values are applicable to system identification, and then the built model is used to classify the test samples.
The identification and classification model
The single–double identification, single-factor abnormal classification and two-factor abnormal classification models are shown in Figures 10–12. The classification result on the left-hand side is smaller than the threshold value and that on the right-hand side is larger than the threshold. In addition, the node and threshold of splitting are shown in Tables 8–10. The threshold value is calculated by sequencing the feature values in ascending order, and each interval is bifurcated. The Gini value of each bifurcation is calculated by Equation (11) and the maximum Gini value (minimum Gini index) is selected as optimal bifurcation, that is, the threshold, where d1, d2, d3 and d4 represent the characteristic values of the four qualities respectively and which characteristic value the node is classified by.

Decision tree model for single–double identification.

Decision tree model for single-factor abnormality classification.
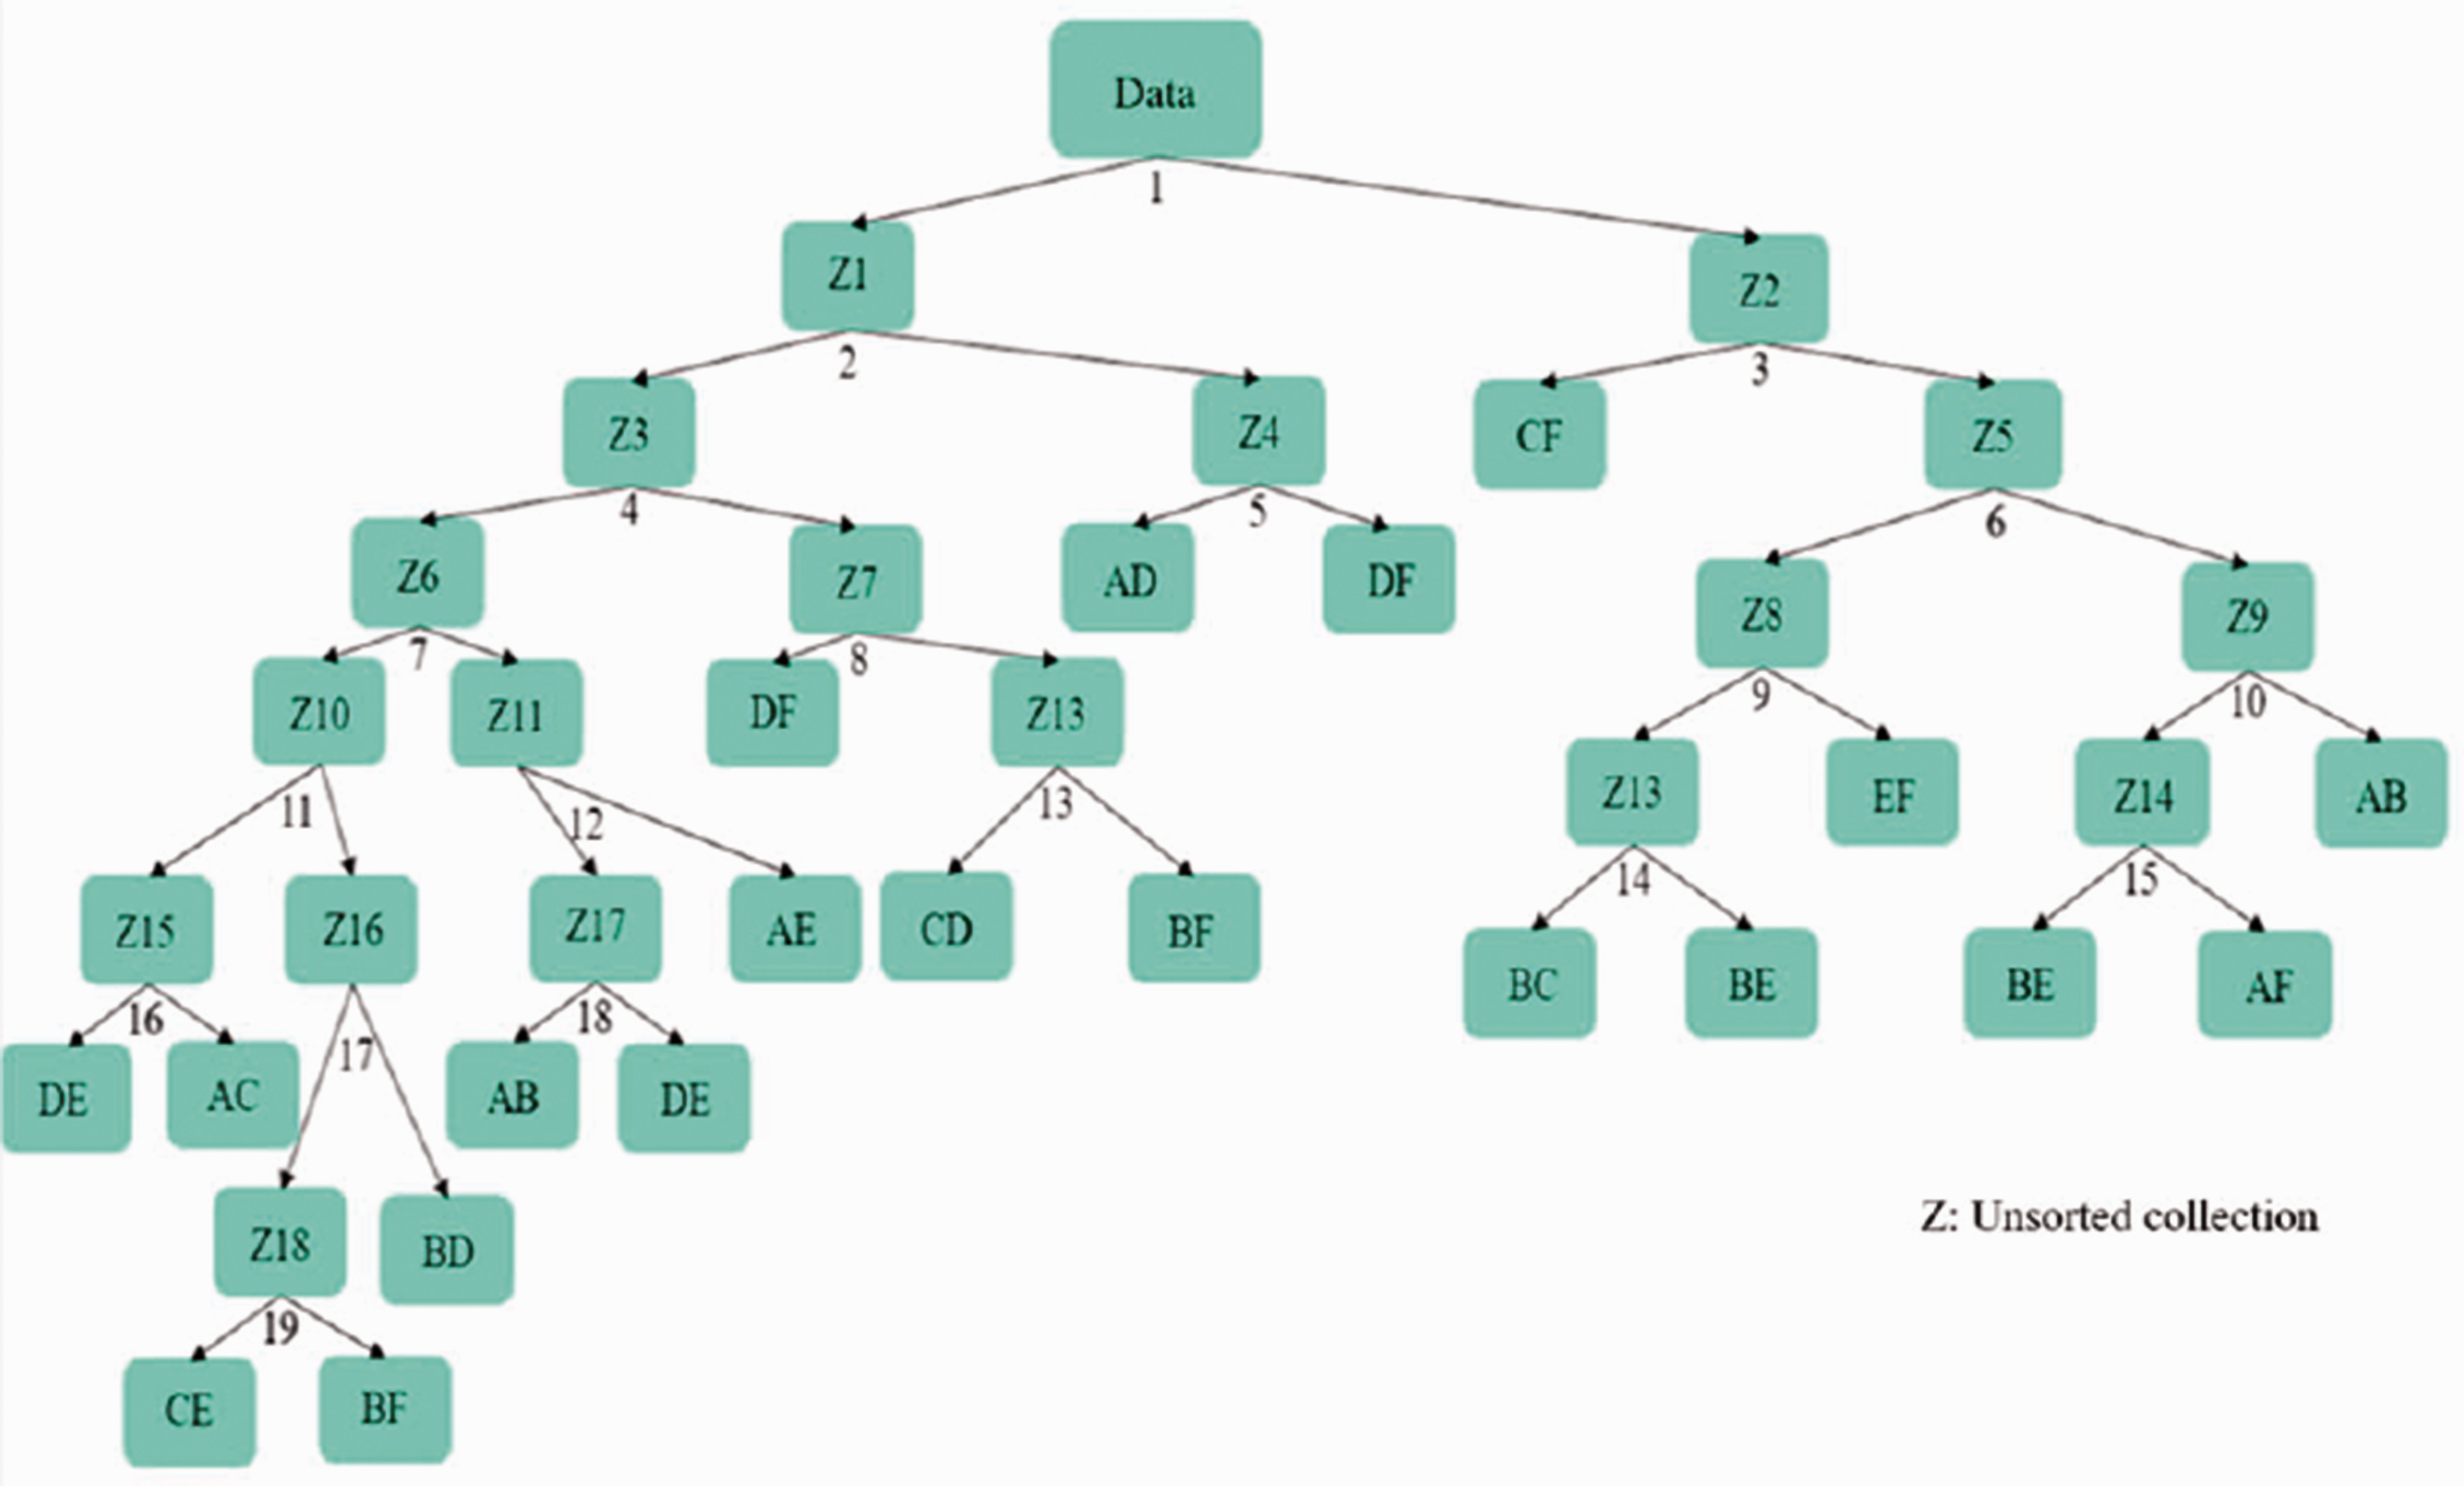
Decision tree model for two-factor abnormality classification.
Decision tree threshold value for single–double identification

Decision tree threshold value for single-factor abnormality classification

Decision tree threshold value of two-factor abnormality

Results
Individual test for individual classifiers
Single-factor and double-factor abnormal identification
This study used the decision tree classifier for single-factor or double-factor abnormal identification. The four di values obtained by the RAM method were used as the input features of the classifier. There were 420 samples, among which 210 samples were selected randomly for training and 210 samples were used for testing. The training samples were used for training to build the decision tree model, and the test samples were classified. Therefore, the purpose of testing samples was to check whether the di feature value for the melt spinning machine processing parameter abnormality diagnosis system is appropriate or not. The result showed that the single-factor abnormality of 210 test samples are all identified correctly, but three two-factor abnormalities are misidentified as single-factor abnormalities. The success rate of classification is 98.6%. The proposed decision tree has a very favorable classification effect.
Single-factor abnormal classification
There are 120 single-factor abnormal samples, of which 60 samples were randomly selected for training and the other 60 samples were used for testing. The 100% single-factor abnormal classification can be identified and it successfully indicated that the corresponding processing parameter caused the abnormality. It is concluded that the proposed decision tree classifier has a very favorable effect.
Two-factor abnormal classification simultaneously
There are 300 two-factor simultaneously abnormal samples, of which 150 samples were randomly selected for training and the other 150 samples were used for testing. Six of 150 test samples are misclassified. The 96.0% two-factor simultaneously abnormal classification can identify which processing parameter caused the abnormality.
Integration test for combination classification
Table 11 shows the accurate rate of the three cases separated into classification. The test result of merging them to obtain the total accuracy of the classification is presented in Table 12.
The test results of identification and classification for three cases

The results of identification and classification for the combination test

The accuracy of single–double identification, single-factor and two-factor abnormality classification all are higher than 94.6%. It is observed that the method proposed in this study has a favorable effect on melt spinning machine abnormality diagnosis.
To determine the faults of quality characteristic(s) for a machine it is usual to adopt signal processing for the understanding of mechanical systems, which usually uses vibrations, structural modeling and identification.4,9 This study determines the faults of quality characteristic(s) for a melt spinning machine through polypropylene as-spun fiber manufacturing using a new application context and an experimental dataset. A new feature for analysis is proposed that appears to be superbly applicable in manufacturing. In addition, a good classifier is proposed that appears to be perfectly applicable as well.
Conclusions
This study proposed a melt spinning quality abnormality diagnosis system based on melt spinning machine multi-quality parameter optimization. The experimental samples derived from the optimum processing parameters were used as the optimal historical data to determine the control limit. MVSPC based on Hotelling's T2 method was used to get T2 value. The T2 statistic provides an excellent technique to monitor many process variables because it considers them as a simultaneous group of items that interact with one another. This T2 value was judged as abnormal if it exceeded the control limit. It was combined with the feature value obtained by the RAM method, and the fault process parameters were successfully identified and classified by the decision tree method. CARTs are used as the machine‐learning methods to construct prediction models from data. These models are acquired by binary recursively partitioning the data space and installing a simple prediction model from each partition. Consequently, the partitioning can be constituted graphically as the decision tree. The conclusions are given below.
There are 440 samples in this study, including 420 abnormal samples and 20 normal samples. The normal and abnormal products are judged by Hotelling's T2 control chart. This method is evaluated by the detection success rate, and detection rate is 100% with a zero false alarm rate. Therefore, the Hotelling's T2 control chart has an excellent recognition effect on abnormal products of the melt spinning machine. For abnormal products, the T2 value is decomposed by the RAM method to obtain the feature value, and the obtained feature value is used as the classifier input. This study uses the decision tree as the classifier, and the test samples are imported into the model of a decision tree built by using training samples. Individual and combination test results show that the single–double identification classification accuracy is 98.60%, the single-factor abnormality classification accuracy is above 98.3% and the two-factor classification accuracy is above 95.3%, meaning the designed classifier can find fault process parameters effectively. This study used polypropylene as-spun fiber to develop a recognition system for fault process parameters of melt spinning as a case study, which can find the abnormal products and fault process parameters rapidly and successfully, so as to guarantee product quality and reduce unnecessary costs.
Footnotes
Declaration of conflicting interests
The author(s) declared no potential conflicts of interest with respect to the research, authorship, and/or publication of this article.
Funding
The authors disclosed receipt of the following financial support for the research, authorship and/or publication of this article: This work was supported by the Ministry of Science and Technology of the Republic of China (grant numbers 108-2221-E-011-073 and 108-2622-E-011-020-CC3).
